New trends in InSAR time series analysis for wide area deformation mapping
27
1 New trends in InSAR time series analysis for wide area deformation mapping R.F. Hanssen, M. Caro Cuenca, A. Hooper, D. Bekaert, M. Arikan and P. Mahapatra
Transcript of New trends in InSAR time series analysis for wide area deformation mapping

1
New trends in InSAR time series analysis for wide area deformation mapping
R.F. Hanssen, M. Caro Cuenca, A. Hooper, D. Bekaert, M. Arikan and P. Mahapatra

2
Introduction
• InSAR time series analysis is able to provide mm precision displacements estimates (short scale signals) • However, when applied to study displacements at large scales, it has some limitations:
1. Observations are usually affected by atmosphere and orbit errors. 2. Combination of InSAR observations is complex
because estimates are relative to a reference area.

3
Introduction
• We propose to overcome these limitations with ancillary data.

4
Introduction
• Ancillary data required to overcome these limitations
• We explore how ancillary data is combined with InSAR time series results for a optimal estimation of both, short scale and large scale signals.

5
Case studies
1. Slow slip event on the Guerrero subduction zone, Mexico
2. Vertical rates in the whole of the Netherlands
3. Tectonic motion in the Marmara region, Turkey

6
Case studies
1. Slow slip event on the Guerrero subduction zone, Mexico
2. Vertical rates in the whole of the Netherlands
3. Tectonic motion in the Marmara region, Turkey

7
The Guerrero subduction zone
Estimation of the slow slip event of 2006 Available data: • Continuous GPS: 9 stations
• Sounding balloon data
• InSAR time series processed using Persistent Scatterers
Interferometry for 1 track 300x100 km acquired by Envisat.

8
• Small regions
• Horizontal isolines
•
• Large regions
• Spatial variation of troposphere
• Split in multiple regions
Guerrero subduction zone, tropospheric
correction
isolines
We use sounding ballon data to constrain the rate of change of the delay and estimate the constant.
USA
Mexico
Mexico City
D. Bekaert and A Hooper (2011) AGU Fall meeting

9 cm
-10 13.5
Interferogram Corrected Estimated tropospheric signal
31 Dec. 2004 (w.r.t 16 Dec. 2005)
USA
Mexico
Mexico City
Guerrero subduction zone, examples of
tropospheric correction
D. Bekaert and A Hooper (2011) AGU Fall meeting

10
Guerrero subduction zone, estimated Slow
Slip Event (SSE) of 2006
Without tropospheric correction With tropospheric correction
A Hooper et all (2011) Tectonophysics

11
Case studies
1. Slow slip event on the Guerrero subduction zone, Mexico
2. Vertical rates in the whole of the Netherlands
3. Tectonic motion in the Marmara region, Turkey

12
The Netherlands,
Vertical rates for the whole of the Netherlands
Available data • GPS: 9 (5 in NL) continuous GPS stations starting in late 1990’s.
Provided by EUREF network.
• Leveling: 15.000 benchmarks and average measurement period of ~5 yrs.
• InSAR: Time series results of 15 tracks (8 ascending 7 descending) acquired by Envisat and ERS.

13
Leveling network (1992-2010)
Germany

14

16
Data combination
• We interpolate (no extrapolation) the velocity maps estimated with each data set to a common 500 x 500 m2 grid with ordinary kriging.
• We estimate the variance for each interpolated value with kriging.
17
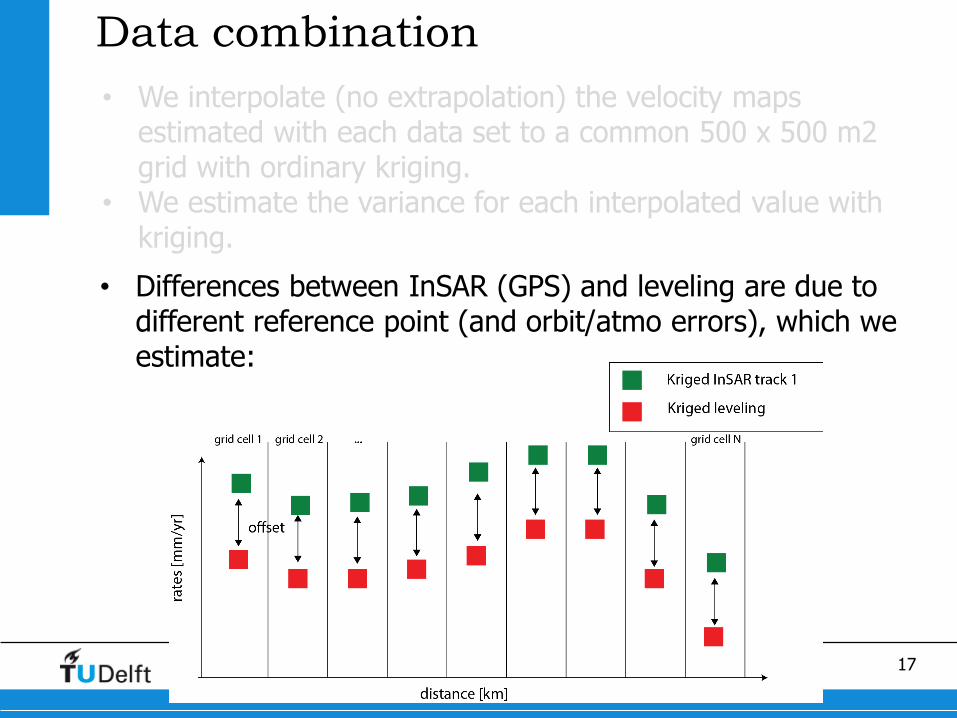
Data combination
• We interpolate (no extrapolation) the velocity maps estimated with each data set to a common 500 x 500 m2 grid with ordinary kriging.
• We estimate the variance for each interpolated value with kriging.
• Differences between InSAR (GPS) and leveling are due to different reference point (and orbit/atmo errors), which we estimate:

18
Data combination
• We assume that leveling, GPS, ERS1/2 and Envisat observe the same signal. We realize it is a big assumption i.e. the results contain average linear rates.

20
Data combination
• We assume that leveling, GPS, ERS1/2 and Envisat observe the same signal. We realize it is a big assumption i.e. the results contain average linear rates.
• Per grid cell, the functional and stochastic models are:
• InSAR residual contains unmodeled atmosphere and
unmodeled orbit errors
• We low pass filter the InSAR residuals (30km window) to obtain the remaining atmosphere and orbit errors and remove them from InSAR observations.

21
Vertical rates in the Netherlands

22
Case studies
1. Slow slip event on the Guerrero subduction zone, Mexico
2. Vertical rates in the whole of the Netherlands
3. Tectonic motion in the Marmara region, Turkey

23
Marmara region, Turkey
Recent tectonic activity in the area of the Sea of Marmara Available data
• GPS: ~ 50 continuous stations • InSAR: Time series results of 15 tracks (8 ascending 7
descending) acquired by Envisat
• Combined with the same approach as in the case of the Netherlands.

24
Horizontal (East) displacement rates from the GPS (1997-2006) with respect to the Eurasia.
The arrows show the horizontal velocity field of the GPS measurements. Aktug et al. (2009) JGR
Marmara region, GPS estimations

25
Envisat descending Tracks
Envisat ascending Tracks
line-of-sight displacements
Marmara region, TS-InSAR estimations

26
Marmara region, combined result
Easting

27
Marmara region, combined result
Easting Combined
Arikan et al. (2011), FRINGE’11

28
Summary and Conclusions
• InSAR alone cannot measure large scale displacement signals
• InSAR requires extra data and modeling for orbital and atmospheric
errors.
• Until now geodetical data have usually been used to validate InSAR.
Now ancillary data is combined with InSAR.
• Combination InSAR-ancillary data requires interpolation unless they
are both simultaneously acquired:
• Using corner reflectors or
• Compact Active Transponders (CAT’s)

29
SubCoast is a collaborative project under Seventh Framework Programme of the European Commission (FP7). SubCoast aims at developing a service for assessing and monitoring subsidence hazards in coastal areas around Europe. More information http://www.subcoast.eu/
This worked has been partially supported by SubCoast