New insights into the 2012 Emilia (Italy) seismic sequence through advanced numerical modeling of...
7
New insights into the 2012 Emilia (Italy) seismic sequence through advanced numerical modeling of ground deformation InSAR measurements P. Tizzani, 1 R. Castaldo, 1 G. Solaro, 1 S. Pepe, 1 M. Bonano, 1 F. Casu, 1 M. Manunta, 1 M. Manzo, 1 A. Pepe, 1 S. Samsonov, 2 R. Lanari, 1 and E. Sansosti 1 Received 14 December 2012; revised 21 February 2013; accepted 22 February 2013; published 26 May 2013. [1] We provide new insights into the two main seismic events that occurred in 2012 in the Emilia region, Italy. We extend the results from previous studies based on analytical inversion modeling of GPS and RADARSAT-1 InSAR measurements by exploiting RADARSAT-2 data. Moreover, we benefit from the available large amount of geological and geophysical information through finite element method (FEM) modeling implemented in a structural-mechanical context to investigate the impact of known buried structures on the modulation of the ground deformation field. We find that the displacement pattern associated with the 20 May event is consistent with the activation of a single fault segment of the inner Ferrara thrust, in good agreement with the analytical solution. In contrast, the interpretation of the 29 May episode requires the activation of three different fault segments and a block roto-translation of the Mirandola anticline. The proposed FEM-based methodology is applicable to other seismic areas where the complexity of buried structures is known and plays a fundamental role in the modulation of the associated surface deformation pattern. Citation: Tizzani, P., R. Castaldo, G. Solaro, S. Pepe, M. Bonano, F. Casu, M. Manunta, M. Manzo, A. Pepe, S. Samsonov, R. Lanari, and E. Sansosti (2013), New insights into the 2012 Emilia (Italy) seismic sequence through advanced numerical modeling of ground deformation InSAR measurements, Geophys. Res. Lett., 40, 1971–1977, doi:10.1002/grl.50290. 1. Introduction [2] On 20 May 2012, at 02:03 UTC, an M l = 5.9 earthquake occurred in the central alluvial Po Plain near the town of Finale Emilia, Italy. The seismic sequence evolved with some decreasing local magnitude aftershock events (M l ≤ 5.1) until 29 May at 7:00 UTC, when an M l = 5.8 seismic event occurred around the Mirandola village, ~10 km SW of the 20 May main shock epicenter (Figure 1a). These seismic events resulted in major industrial and residential building damages as well as 27 fatalities and the evacuation of about 20,000 residents. The focal solutions for these two main shocks show WNW-ESE-oriented and E-W-oriented nodal planes, respectively, and approximately N-S compressional kinematics (www.globalcmt.org). [3] The region struck by the 2012 Emilia seismic sequence represents the northern segments of the Apennines accretionary prism-foredeep system, for which, in the last decade, several analyses aimed at detecting the active geodynamic processes affecting this area have been performed [Carminati and Vadacca, 2010, and references therein]. The key outcomes resulting from these studies are (i) the identification in the upper crust of the occurrence of the stress field along-depth variations, with normal faulting above and thrusting below, and (ii) the interference of local tensional stresses with regional compression in the Mirandola anticline region. In this context, the 2012 seismic sequence represents a great opportunity to analyze the interaction processes between the regional and local stresses that are released during seismic events. [4] The large amount of data available for the considered area, acquired through InSAR analyses and geophysical and deep borehole geological investigations, allows for the extensive study of the relationship between the ground deformation fields and the activated fault segments associated with the M l 5.9 and M l 5.8 main shocks. To this aim, we first perform classic analytical modeling [Okada, 1985] by investigating a RADARSAT-2 (RSAT-2) interferogram that, encompassing the two main earthquakes, allows for quickly identifying the upper crust regions affected by the faulting processes. Then, we analyze the role of the buried geological structures of the inner Ferrara thrust (IFT) and the Mirandola fault–related anticline (MFA) in the modulation of the observed ground deformation by developing a numerical model based on a finite element method (FEM) implemented in a structural-mechanical context [Fagan, 1992]. We show that the rock failure phenomena that occurred were strongly conditioned by the geological complexity of the investigated area and propose an interpretation of the two main shock deformation processes. 2. Geological and Structural Outlines [5] The North Apennines fold and thrust belt has grown during the Neogene and Quaternary times along an eastward retreating westward directed subduction zone [Doglioni et al., 1999]. The radial advance of the subduction process induced the progressive eastward migration of thrust fronts, foredeep basins, and extensional back-arc tectonics [Carminati and Vadacca, 2010]. The subsurface geometry of the northern Apennines frontal thrust system, detected by seismic reflection profiles [Pieri, 1983], shows several arcuate structures [Carminati et al., 2010]. Among them, we focus on the Ferrara arc region (Figure 1a) where the two investigated main shock Additional supporting information may be found in the online version of this article. 1 National Research Council (CNR) , Istituto per il Rilevamento Elettromagnetico dell ’ Ambiente (IREA), Napoli, Italy. 2 Canada Centre for Remote Sensing, Ottawa, Ontario, Canada. Corresponding author: R. Lanari, CNR-IREA, via Diocleziano 328, IT-80124 Napoli, Italy. ([email protected]) ©2013. American Geophysical Union. All Rights Reserved. 0094-8276/13/10.1002/grl.50290 1971 GEOPHYSICAL RESEARCH LETTERS, VOL. 40, 1971–1977, doi:10.1002/grl.50290, 2013
-
Upload
independent -
Category
Documents
-
view
3 -
download
0
Transcript of New insights into the 2012 Emilia (Italy) seismic sequence through advanced numerical modeling of...
New insights into the 2012 Emilia (Italy) seismic sequencethrough advanced numerical modeling of ground deformationInSAR measurements
P. Tizzani,1 R. Castaldo,1 G. Solaro,1 S. Pepe,1 M. Bonano,1 F. Casu,1 M. Manunta,1
M. Manzo,1 A. Pepe,1 S. Samsonov,2 R. Lanari,1 and E. Sansosti1
Received 14 December 2012; revised 21 February 2013; accepted 22 February 2013; published 26 May 2013.
[1] We provide new insights into the two main seismicevents that occurred in 2012 in the Emilia region, Italy. Weextend the results from previous studies based on analyticalinversion modeling of GPS and RADARSAT-1 InSARmeasurements by exploiting RADARSAT-2 data. Moreover,we benefit from the available large amount of geological andgeophysical information through finite element method(FEM) modeling implemented in a structural-mechanicalcontext to investigate the impact of known buried structureson the modulation of the ground deformation field. We findthat the displacement pattern associated with the 20 Mayevent is consistent with the activation of a single faultsegment of the inner Ferrara thrust, in good agreement withthe analytical solution. In contrast, the interpretation of the29 May episode requires the activation of three differentfault segments and a block roto-translation of the Mirandolaanticline. The proposed FEM-based methodology isapplicable to other seismic areas where the complexity ofburied structures is known and plays a fundamental role inthe modulation of the associated surface deformation pattern.Citation: Tizzani, P., R. Castaldo, G. Solaro, S. Pepe, M. Bonano,F. Casu, M. Manunta, M. Manzo, A. Pepe, S. Samsonov, R. Lanari,and E. Sansosti (2013), New insights into the 2012 Emilia (Italy)seismic sequence through advanced numerical modeling ofground deformation InSAR measurements, Geophys. Res. Lett.,40, 1971–1977, doi:10.1002/grl.50290.
1. Introduction
[2] On 20 May 2012, at 02:03 UTC, anMl = 5.9 earthquakeoccurred in the central alluvial Po Plain near the town of FinaleEmilia, Italy. The seismic sequence evolved with somedecreasing local magnitude aftershock events (Ml ≤ 5.1) until29May at 7:00 UTC, when anMl = 5.8 seismic event occurredaround the Mirandola village, ~10 km SW of the 20 Maymain shock epicenter (Figure 1a). These seismic eventsresulted in major industrial and residential buildingdamages as well as 27 fatalities and the evacuation of about20,000 residents. The focal solutions for these two mainshocks show WNW-ESE-oriented and E-W-oriented nodal
planes, respectively, and approximately N-S compressionalkinematics (www.globalcmt.org).[3] The region struck by the 2012 Emilia seismic sequence
represents the northern segments of the Apennines accretionaryprism-foredeep system, for which, in the last decade, severalanalyses aimed at detecting the active geodynamic processesaffecting this area have been performed [Carminati andVadacca, 2010, and references therein]. The key outcomesresulting from these studies are (i) the identification in theupper crust of the occurrence of the stress field along-depthvariations, with normal faulting above and thrusting below,and (ii) the interference of local tensional stresses with regionalcompression in the Mirandola anticline region. In this context,the 2012 seismic sequence represents a great opportunity toanalyze the interaction processes between the regional andlocal stresses that are released during seismic events.[4] The large amount of data available for the considered
area, acquired through InSAR analyses and geophysicaland deep borehole geological investigations, allows for theextensive study of the relationship between the grounddeformation fields and the activated fault segments associatedwith the Ml 5.9 and Ml 5.8 main shocks. To this aim, wefirst perform classic analytical modeling [Okada, 1985] byinvestigating a RADARSAT-2 (RSAT-2) interferogram that,encompassing the two main earthquakes, allows for quicklyidentifying the upper crust regions affected by the faultingprocesses. Then, we analyze the role of the buried geologicalstructures of the inner Ferrara thrust (IFT) and the Mirandolafault–related anticline (MFA) in the modulation of theobserved ground deformation by developing a numericalmodel based on a finite element method (FEM) implementedin a structural-mechanical context [Fagan, 1992]. We showthat the rock failure phenomena that occurred were stronglyconditioned by the geological complexity of the investigatedarea and propose an interpretation of the two main shockdeformation processes.
2. Geological and Structural Outlines
[5] The North Apennines fold and thrust belt has grownduring the Neogene and Quaternary times along an eastwardretreating westward directed subduction zone [Doglioniet al., 1999]. The radial advance of the subduction processinduced the progressive eastward migration of thrust fronts,foredeep basins, and extensional back-arc tectonics [Carminatiand Vadacca, 2010]. The subsurface geometry of the northernApennines frontal thrust system, detected by seismic reflectionprofiles [Pieri, 1983], shows several arcuate structures[Carminati et al., 2010]. Among them, we focus on the Ferraraarc region (Figure 1a) where the two investigated main shock
Additional supporting information may be found in the online version of thisarticle.
1National Research Council (CNR) , Istituto per il Rilevamento Elettromagneticodell’Ambiente (IREA), Napoli, Italy.
2Canada Centre for Remote Sensing, Ottawa, Ontario, Canada.
Corresponding author: R. Lanari, CNR-IREA, via Diocleziano 328,IT-80124 Napoli, Italy. ([email protected])
©2013. American Geophysical Union. All Rights Reserved.0094-8276/13/10.1002/grl.50290
1971
GEOPHYSICAL RESEARCH LETTERS, VOL. 40, 1971–1977, doi:10.1002/grl.50290, 2013
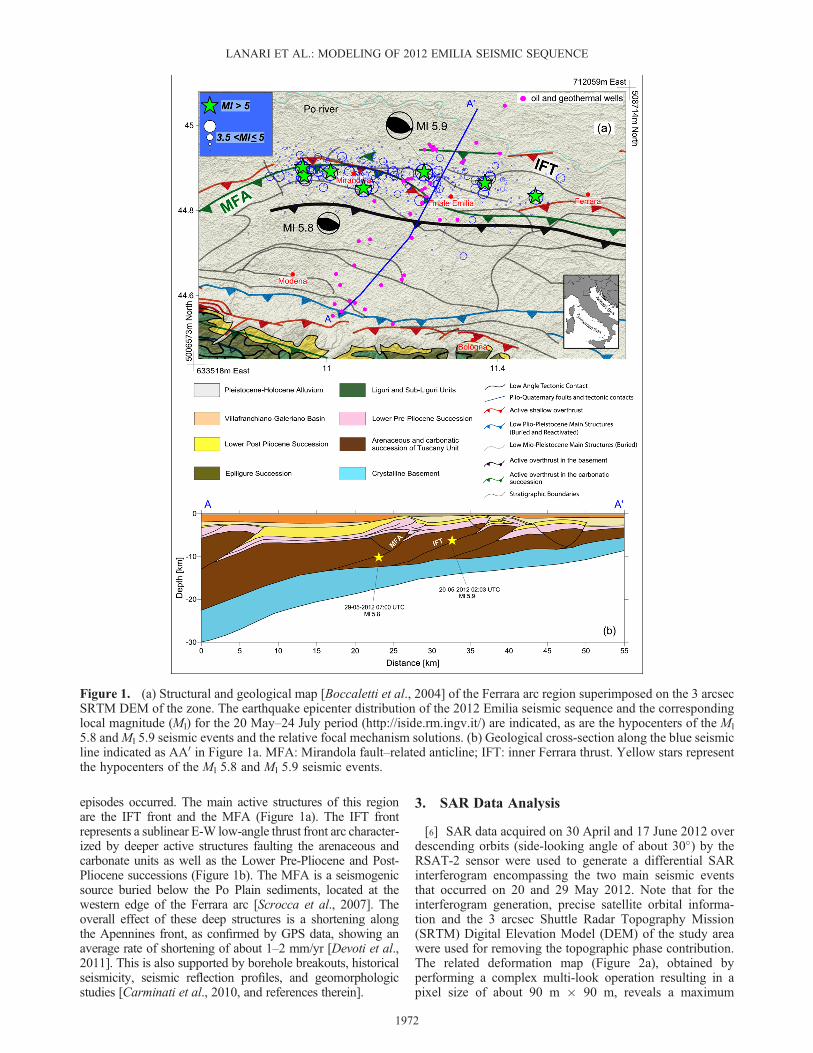
episodes occurred. The main active structures of this regionare the IFT front and the MFA (Figure 1a). The IFT frontrepresents a sublinear E-W low-angle thrust front arc character-ized by deeper active structures faulting the arenaceous andcarbonate units as well as the Lower Pre-Pliocene and Post-Pliocene successions (Figure 1b). The MFA is a seismogenicsource buried below the Po Plain sediments, located at thewestern edge of the Ferrara arc [Scrocca et al., 2007]. Theoverall effect of these deep structures is a shortening alongthe Apennines front, as confirmed by GPS data, showing anaverage rate of shortening of about 1–2 mm/yr [Devoti et al.,2011]. This is also supported by borehole breakouts, historicalseismicity, seismic reflection profiles, and geomorphologicstudies [Carminati et al., 2010, and references therein].
3. SAR Data Analysis
[6] SAR data acquired on 30 April and 17 June 2012 overdescending orbits (side-looking angle of about 30�) by theRSAT-2 sensor were used to generate a differential SARinterferogram encompassing the two main seismic eventsthat occurred on 20 and 29 May 2012. Note that for theinterferogram generation, precise satellite orbital informa-tion and the 3 arcsec Shuttle Radar Topography Mission(SRTM) Digital Elevation Model (DEM) of the study areawere used for removing the topographic phase contribution.The related deformation map (Figure 2a), obtained byperforming a complex multi-look operation resulting in apixel size of about 90 m � 90 m, reveals a maximum
Figure 1. (a) Structural and geological map [Boccaletti et al., 2004] of the Ferrara arc region superimposed on the 3 arcsecSRTM DEM of the zone. The earthquake epicenter distribution of the 2012 Emilia seismic sequence and the correspondinglocal magnitude (Ml) for the 20 May–24 July period (http://iside.rm.ingv.it/) are indicated, as are the hypocenters of the Ml
5.8 andMl 5.9 seismic events and the relative focal mechanism solutions. (b) Geological cross-section along the blue seismicline indicated as AA0 in Figure 1a. MFA: Mirandola fault–related anticline; IFT: inner Ferrara thrust. Yellow stars representthe hypocenters of the Ml 5.8 and Ml 5.9 seismic events.
LANARI ET AL.: MODELING OF 2012 EMILIA SEISMIC SEQUENCE
1972
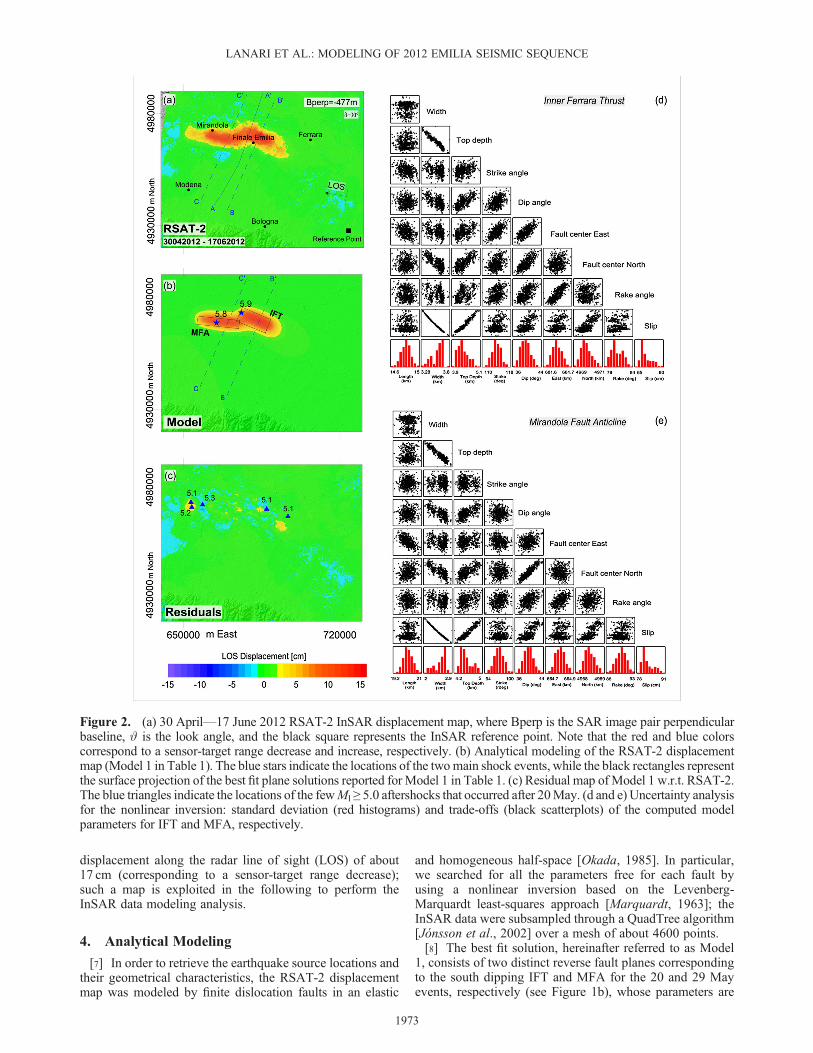
displacement along the radar line of sight (LOS) of about17 cm (corresponding to a sensor-target range decrease);such a map is exploited in the following to perform theInSAR data modeling analysis.
4. Analytical Modeling
[7] In order to retrieve the earthquake source locations andtheir geometrical characteristics, the RSAT-2 displacementmap was modeled by finite dislocation faults in an elastic
and homogeneous half-space [Okada, 1985]. In particular,we searched for all the parameters free for each fault byusing a nonlinear inversion based on the Levenberg-Marquardt least-squares approach [Marquardt, 1963]; theInSAR data were subsampled through a QuadTree algorithm[Jónsson et al., 2002] over a mesh of about 4600 points.[8] The best fit solution, hereinafter referred to as Model
1, consists of two distinct reverse fault planes correspondingto the south dipping IFT and MFA for the 20 and 29 Mayevents, respectively (see Figure 1b), whose parameters are
Figure 2. (a) 30 April—17 June 2012 RSAT-2 InSAR displacement map, where Bperp is the SAR image pair perpendicularbaseline, # is the look angle, and the black square represents the InSAR reference point. Note that the red and blue colorscorrespond to a sensor-target range decrease and increase, respectively. (b) Analytical modeling of the RSAT-2 displacementmap (Model 1 in Table 1). The blue stars indicate the locations of the twomain shock events, while the black rectangles representthe surface projection of the best fit plane solutions reported for Model 1 in Table 1. (c) Residual map of Model 1 w.r.t. RSAT-2.The blue triangles indicate the locations of the fewMl ≥ 5.0 aftershocks that occurred after 20May. (d and e) Uncertainty analysisfor the nonlinear inversion: standard deviation (red histograms) and trade-offs (black scatterplots) of the computed modelparameters for IFT and MFA, respectively.
LANARI ET AL.: MODELING OF 2012 EMILIA SEISMIC SEQUENCE
1973
reported in Table 1. The model results (see Figure 2b) showa good fit with the measured InSAR data, as clearlyhighlighted by the residual map in Figure 2c, where valuessmaller than 2 cm are generally found. However, small areaswith higher residues are also noted; they appear at the loca-tions corresponding to the few aftershocks with Ml ≥ 5.0 notconsidered in the inversion procedure and that occurred inthe same time period covered by the RSAT-2 interferogram.The results of uncertainty analysis (standard deviations andtrade-offs) for the nonlinear inversion of the IFT and MFAmodel parameters are also presented in Figures 2d and 2e,respectively. The trade-off analysis shows that the geometryand slip values cannot be unambiguously resolved, since astrong correlation between slip and width exists.[9] In addition, we compare the retrieved fault parameters
with those computed by Bignami et al. [2012] and Serpelloniet al. [2012], who inverted an RSAT-1 interferogram andGPS data, respectively. The corresponding parameters reportedin Table 1 provided the two best fit solutions, hereinafternamed Model 2 and Model 3, respectively. By consideringthe modeling results summarized in Table 1, we remark thegood consistency among the three inversion results for theIFT structure, particularly for what concerns InSAR Models 1and 2. Differently, more significant discrepancies are presentfor the results relevant to MFA. Note, in particular, the ratherdifferent values of the dip angles as well as width and slipparameters for the three models in spite of the limited presenceof residues for Models 1 and 2 (supporting information) thatimplies a good fit for both analytical models.[10] It is worth noting that a second interferogram also
including the two main seismic events and generated by usingthe SAR data collected by the RSAT-1 sensor on 12 May and5 June 2012 was computed and used to check the reliability ofthe obtained fault models (see supporting information).
5. FEM Model
[11] To further extend the investigation of the grounddeformation pattern caused by the 2012 Emilia seismicsequence and retrieved through the InSAR analysis, wedeveloped a numerical model based on an FEM, whichallowed us to account for all geological and geophysicalinformation available for the considered area.
[12] In particular, we analyzed the seismic events in a struc-tural-mechanical context under the plane strain approximationmode to solve for the retrieved displacements [Fagan, 1992].We defined the subdomain setting of the FEM model usingavailable geological and structural information derived fromthe oil and geothermal well logging (Figure 1a) and theinterpretation of the seismic line indicated as AA0 in Figure 1(http://unmig.sviluppoeconomico.gov.it/videpi/). These dataare distributed along a NNE-SSW alignment that crossesthe area where the ground deformation associated with thetwo seismic events was measured (Figure 2a). From thisinformation, we derived the 2D structural geometric domainsof the region at depth along the AA0 line and extended sucha structure for the 50 km covering the area from Modena toFerrara (WNW-ESE direction) (see Figure 1). This geometricextrusion is reliable thanks to (i) the essentially E-W linearextension of the buried geological structures (Figure 1) and(ii) the condition of nearly no displacement variation alongthe extrusion direction. The latter statement, supported bythe two nearly constant fault rake values detected throughseismological analyses (www.globalcmt.org) and analyticalmodeling (see Table 1), allowed us to apply the plane strainapproximation mode to solve for the measured displacements[Fagan, 1992].[13] In this context, from the RSAT-2 InSAR displacement
map, we performed 2D optimization by focusing on the twoBB0 and CC0 profiles, shown in Figure 2a, which crossthe areas of maximum deformation associated with theMl 5.9 and Ml 5.8 seismic events, respectively.[14] According to Carminati and Vadacca [2010], we
assumed stationarity and linear elasticity of the involvedmaterials by considering a solution of classic equilibriummechanical equations [Fagan, 1992]. Within the developedheterogeneous model, we also assumed that the singlegeological units were isotropic and characterized by homoge-neous mechanical properties. We evolved our model throughtwo stages: during the first stage (pre-seismic), the modelcompacted under the weight of the rock successions (gravityloading) until it reached a stable equilibrium. At this level,we considered only the retrieved tensional field whilemaintaining the total displacements equal to zero. At thesecond stage (co-seismic), where the stresses were releasedthrough a nonuniform slip along the faults, we used aniterative optimization procedure based on a trial-and-error
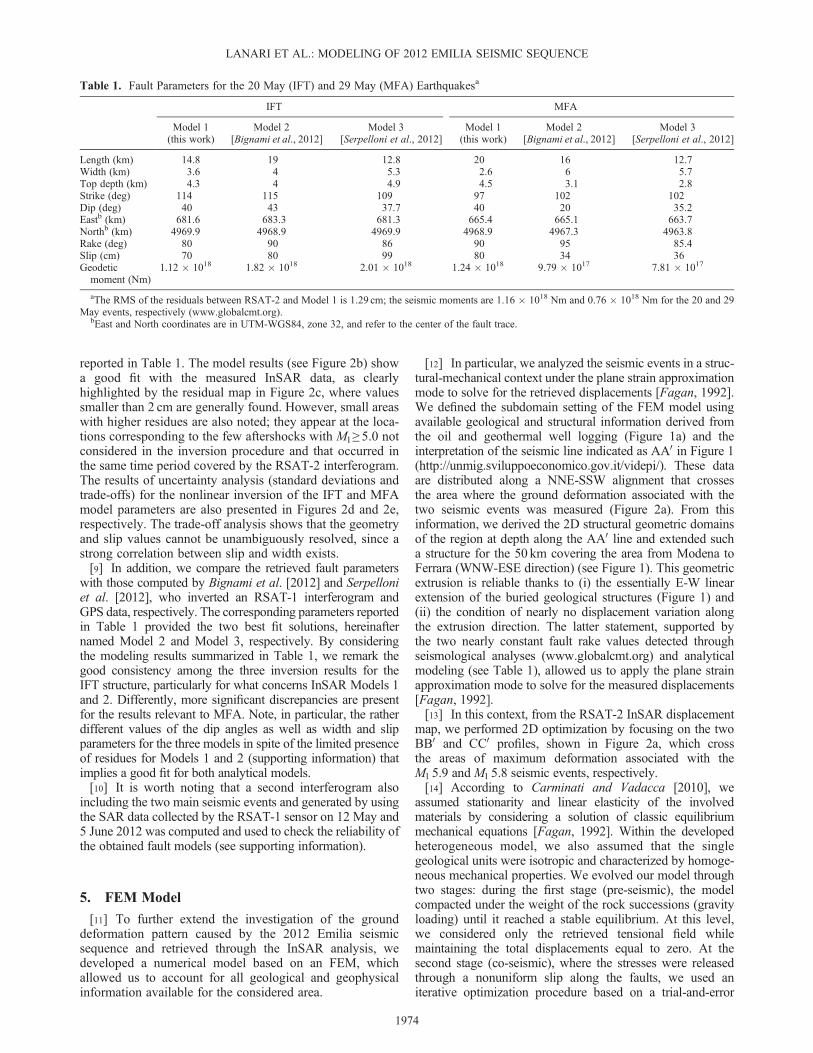
Table 1. Fault Parameters for the 20 May (IFT) and 29 May (MFA) Earthquakesa
IFT MFA
Model 1(this work)
Model 2[Bignami et al., 2012]
Model 3[Serpelloni et al., 2012]
Model 1(this work)
Model 2[Bignami et al., 2012]
Model 3[Serpelloni et al., 2012]
Length (km) 14.8 19 12.8 20 16 12.7Width (km) 3.6 4 5.3 2.6 6 5.7Top depth (km) 4.3 4 4.9 4.5 3.1 2.8Strike (deg) 114 115 109 97 102 102Dip (deg) 40 43 37.7 40 20 35.2Eastb (km) 681.6 683.3 681.3 665.4 665.1 663.7Northb (km) 4969.9 4968.9 4969.9 4968.9 4967.3 4963.8Rake (deg) 80 90 86 90 95 85.4Slip (cm) 70 80 99 80 34 36Geodeticmoment (Nm)
1.12 � 1018 1.82 � 1018 2.01 � 1018 1.24 � 1018 9.79 � 1017 7.81 � 1017
aThe RMS of the residuals between RSAT-2 and Model 1 is 1.29 cm; the seismic moments are 1.16 � 1018 Nm and 0.76 � 1018 Nm for the 20 and 29May events, respectively (www.globalcmt.org).
bEast and North coordinates are in UTM-WGS84, zone 32, and refer to the center of the fault trace.
LANARI ET AL.: MODELING OF 2012 EMILIA SEISMIC SEQUENCE
1974
approach [Tarantola, 2005], allowing to follow the evolutionof the faulting processes within the best fit solution retrieval.Therefore, we achieved (i) the active seismogenic structuresresponsible for the observed ground deformation, (ii) theeffects of the different mechanical constraints on the ground
deformation pattern, and (iii) the spatial distribution of thelocal stress field.[15] Boundary conditions (Figures 3a and 3b) were applied
as follows: the upper boundary, representing the Earth’ssurface, was not constrained; the bottom boundary was a fixed
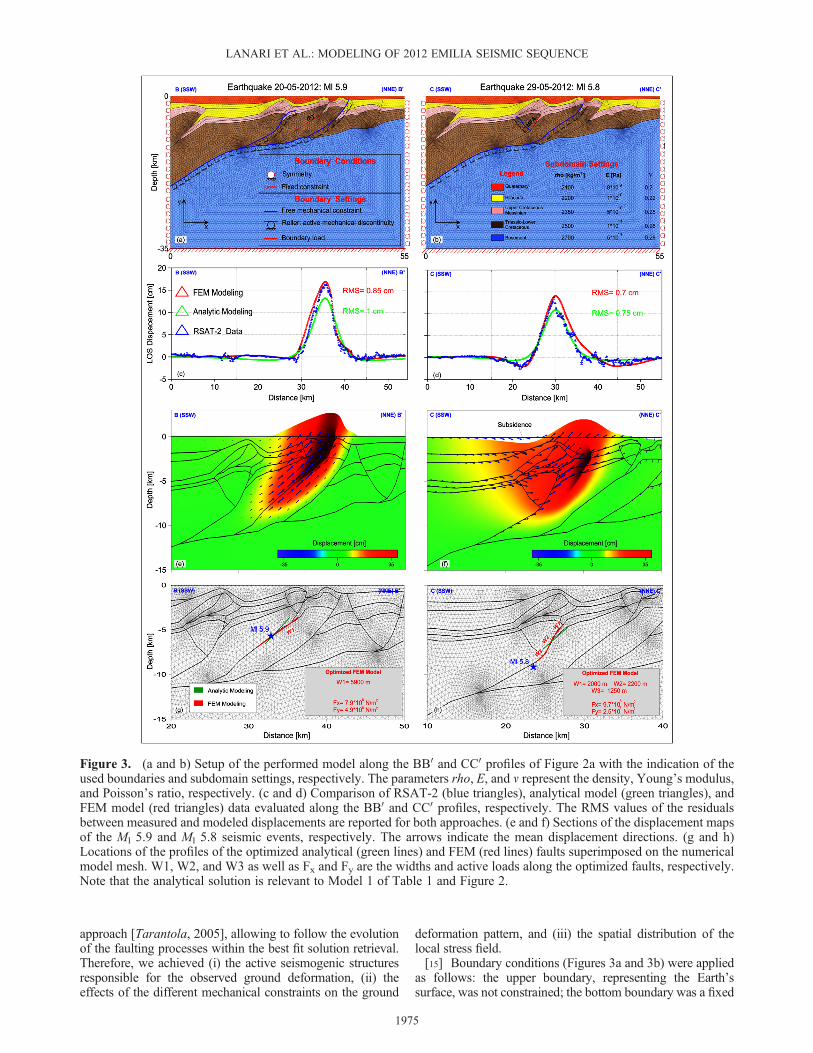
Figure 3. (a and b) Setup of the performed model along the BB0 and CC0 profiles of Figure 2a with the indication of theused boundaries and subdomain settings, respectively. The parameters rho, E, and n represent the density, Young’s modulus,and Poisson’s ratio, respectively. (c and d) Comparison of RSAT-2 (blue triangles), analytical model (green triangles), andFEM model (red triangles) data evaluated along the BB0 and CC0 profiles, respectively. The RMS values of the residualsbetween measured and modeled displacements are reported for both approaches. (e and f) Sections of the displacement mapsof the Ml 5.9 and Ml 5.8 seismic events, respectively. The arrows indicate the mean displacement directions. (g and h)Locations of the profiles of the optimized analytical (green lines) and FEM (red lines) faults superimposed on the numericalmodel mesh. W1, W2, and W3 as well as Fx and Fy are the widths and active loads along the optimized faults, respectively.Note that the analytical solution is relevant to Model 1 of Table 1 and Figure 2.
LANARI ET AL.: MODELING OF 2012 EMILIA SEISMIC SEQUENCE
1975
constraint; and finally a symmetry condition was assumed forthe SSW and NNE areas to make the edge effects negligible.Moreover, three different boundary settings were consideredin order to represent the sedimentary and tectonic contactsbetween the different rock successions (Figures 3a and 3b):(i) free mechanical constraints where the faults are kept locked;(ii) roller constraints (active mechanical discontinuities), whichallow the faults to freely slip under the applied stress field; and(iii) boundary loads along which the forces are concentratedand transferred to the boundary subdomains. Note that thelatter two boundary settings were derived through the above-mentioned trial-and-error optimization approach. In particular,to evaluate the boundary setting best fit configuration(see Figures 3a and 3b) responsible for the observed grounddeformation, we generated several forward structural-mechanicalmodels for the Ml 5.9 and the Ml 5.8 seismic events (250 and300, respectively). They were obtained through the activationof different structural segments whose geometries wereset via the borehole and the seismic line information. Foreach step of the iterative process, we generated a forwardmodel and compared the predicted and measured grounddeformation fields in order to select the minimum RMSsolution (see Figures 3c and 3d).[16] In Figures 3c and 3d we compare the best fit solutions
for the RSAT-2 data with the analytical (we consider Model1 of Table 1 and Figure 2) and heterogeneous FEM modelsalong the BB0 and CC0 lines, respectively. It is evidentthat the FEM models developed along these profiles showa better fit to the observed ground deformation pattern, interms of shape and amplitude of the signal, for both seismicevents. We observe that the use of a linear inversion toretrieve the slip distribution on the fault planes may improvethe RSAT-2 best fit solution obtained through the analyticalmodeling. However, the small values of the computed residualmap of Figure 2c indicate that our solution can be consideredsuitable to characterize the two causative faults.[17] Moreover, the FEM solution associated with the
20May event provides a section of the displacement distribution(see arrows in Figure 3e) that is consistent with the activationof a single segment (red line in Figure 3g) of IFT. Note that theretrieved analytical modeling solution, whose projection alongthe BB0 profile is depicted by the green segment in Figure 3g,represents a good approximation of the activated structure incorrespondence to IFT. We also remark that the displacementmap shown in Figure 3e emphasizes that the co-seismic defor-mation field was strongly constrained by the active mechanicaldiscontinuities (see the blue lines in Figure 3a) located SSWand NNE of the detected maximum deforming area.[18] Conversely, the FEM modeling relevant to the 29 May
event encompassed a displacement pattern (Figure 3f) thathighlighted the existence of a counterclockwise roto-translationof the Mirandola block along the N-S direction (see arrows inFigure 3f). This implies that the deformed crustal areas are, inthis case, strongly influenced by the geometric complexity ofthe buried structures (Figure 3b). This result justifies both thefault thrust process, as expected from the available focal mech-anism solutions (www.globalcmt.org), and the subsidence phe-nomena found in the region SSW of the maximum uplift area(Figure 3f). Moreover, the evolution of the failure mechanisminvolved three different segments of the Mirandola anticline(red lines in Figure 3h), thus explaining the discrepancies inthe previously presented analytical modeling solutions, whichare discussed in section 4 (see also Table 1).
[19] Finally, Figure 3f shows a section of the displacementspatial distribution at SSW of the detected maximumdeforming area; this is a consequence of the unconstrainedstructural condition at SSW (see Figure 3b). Indeed, the geo-logical evidence indicates that the active tectonic structuresSSW of MFA are located ~20 km from the maximum defor-mation area; accordingly, their effects on the corresponding lo-cal stress field are negligible.
6. Conclusions
[20] We extensively investigated the retrieved InSAR defor-mation patterns associated with the main shock episodes thatoccurred on 20 May (Ml 5.9) and 29 May (Ml 5.8) byexploiting classic analytical modeling and structural-mechanicalFEM modeling; the latter approach accounts for all availablegeological and structural information for the analyzed areain an FEM context and allows us to better characterize thetectonic scenario.[21] The exploitation of these different modeling approaches
improves understanding of the several aspects concerningthe type and evolution of the failure mechanisms responsiblefor the two main shock episodes. In particular, the performedanalysis permitted (i) to detect the active seismogenicstructures responsible for the observed ground deforma-tion, (ii) to evaluate the impact of the regional tectonicconstraints on the modulation of the retrieved deformationfield, and (iii) to provide a detailed characterization of therock failure mechanisms.[22] The achieved results suggest a reactivation process of
preexisting faults (Figures 3a and 3b) that have accumulatedenergy over the last 500 years (http://emidius.mi.ingv.it/CPTI11/) by absorbing the compressional tectonic regimebetween the Apennines and Adriatic plates [Doglioni et al.,1999]. Moreover, the analysis along the active structures ofthe Mirandola anticline reveals the occurrence of obliquedirection displacements along the active seismogenic faults.[23] In this context, the Emilia earthquake sequence
occurred in the region characterized by a seismic gap of severalhundred years (http://emidius.mi.ingv.it/CPTI11/) andconfirmed that the tectonic structures, buried under thePlio-Quaternary deposits of the Po Plain, are active. Morespecifically, the shape of the detected ground deformation isa consequence of the nearly E-W alignment of the buriedstructures of the Ferrara Front. The 2012 Emilia seismicsequence could be interpreted as an effect of the long-termregional tectonic compression, which was responsible for thenorthward bending of the Po River course, the deviation ofthe Panaro River trace, and the growth of the Mirandola anti-cline located at shallow depths under the Po Plain [Burratoet al., 2003]. Moreover, the active thrusting processes of theFerrara Front revealed by our results, see Figures 3e–3f, arefully consistent with a shortening accommodation at a ratesmaller than ~2mm/yr, which was recently proposed byDevotiet al. [2011] and based on the pre-seismic GPS measurements.[24] We point out that the proposed modeling approach
is general and can be applied to other tectonic contexts tobetter understand the impact of geological complexity onthe resulting rock failure phenomena.
[25] Acknowledgments. We thank the Canadian Space Agency foracquiring RSAT-2 data and the Italian Civil Protection Department forsupporting our activities. We also thank Chrystelle Dunn for proofreadingthe manuscript and the two reviewers for their valuable remarks.
LANARI ET AL.: MODELING OF 2012 EMILIA SEISMIC SEQUENCE
1976
ReferencesBoccaletti, M., et al. (2004), Carta sismotettonica della regione EmiliaRomagna. 1:250.000 e note illustrative, Selca, Firenze.
Bignami, C., et al. (2012), Coseismic deformation pattern of the Emilia2012 seismic sequence imaged by Radarsat-1 interferometry, Ann.Geophys., 55, 4, doi:10.4401/ag-6157.
Burrato, P., F. Ciucci, and G. Valensise (2003), An inventory of riveranomalies in the Po Plain, Northern Italy: evidences for active blindthrust faulting, Ann. Geophys., 46(5), 865–882.
Carminati, E., D. Scrocca, and C. Doglioni (2010), Compaction-inducedstress variations with depth in an active anticline: Northern Apennines,Italy, J. Geophys. Res., 115, B02401, doi:10.1029/2009JB006395.
Carminati, E., and L. Vadacca (2010), Two-and three-dimensional numericalsimulations of the stress field at the thrust front of the Northern Apennines,Italy, J. Geophys. Res., 115, B12425, doi:10.1029/2010JB007870.
Devoti, R., et al. (2011), Evidence of large scale deformation patterns fromGPS data in the Italian subduction boundary, Earth Planet. Sci. Lett., 311(3–4), 1–12, doi:10.1016/j.epsl.2011.09.034.
Doglioni, C., et al. (1999), Orogens and slab vs. their direction of subduction,Earth Sci. Rev., 45, 167–208, doi:10.1016/S0012-8252(98)00045-2.
Fagan, M. J. (1992), Finite elements analysis: Theory and Practice, pp. 1–311,London, Prentice Hall.
Jónsson, S., et al. (2002), Fault slip distribution of the 1999 Mw7.2HectorMine earthquake, California, estimated from satellite radar andGPS measurements, Bull. Seismol. Soc. Am., 92, 1377–1389.
Marquardt, D. (1963), An algorithm for least-squares estimation ofnonlinear parameters, SIAM J. Appl. Math., 11, 431–441, doi:10.1137/0111030.
Okada, Y. (1985), Internal deformation due to shear and tensile faults in ahalf-space, Bull. Seismol. Soc. Am., 75, 1135–1154.
Pieri, M. (1983), Three seismic profiles through the Po Plain, in SeismicExpression of Structural Styles, A Picture and Work Atlas, Stud. Geol.Ser., vol. 15, edited by A. W. Bally, pp. 3.4.1/8–3.4.1/26, Am. Assoc.of Pet. Geol., Tulsa, Okla.
Scrocca, D., et al. (2007), Slab retreat and active shortening along the central-northernApennines, in Thrust belts and Foreland Basins: from fold kinematicsto hydrocarbon systems, Frontiers in Earth Sciences, edited by O. Lacombe,J. Lavè, F. Roure, and J. Verges, pp. 471–487, Berlin, Springer.
Serpelloni, E., et al. (2012), GPS observations of coseismic deformationfollowing the May 20 and 29, 2012, Emilia seismic events (northern Italy):data, analysis and preliminary models, Ann. Geophys., 55, 4, doi:10.4401/ag-6168.
Tarantola, A. (2005), Inverse Problem Theory and Methods for ModelParameter Estimation, pp. 1–343, SIAM Society for Industrial andApplied Mathematics, Philadelphia, ISBN 0-89871-572-5.
LANARI ET AL.: MODELING OF 2012 EMILIA SEISMIC SEQUENCE
1977