Formation of lava tubes and extensive flow field during the 1991–1993 eruption of Mount Etna

Bull Volcanol (2004) 66:443–456DOI 10.1007/s00445-003-0324-8
R E S E A R C H A R T I C L E
G. Dubosclard · F. Donnadieu · P. Allard ·R. Cordesses · C. Hervier · M. Coltelli · E. Privitera ·J. Kornprobst
Doppler radar sounding of volcanic eruption dynamics at Mount Etna
Received: 25 March 2002 / Accepted: 28 August 2003 / Published online: 5 November 2003� Springer-Verlag 2003
Abstract Besides their common use in atmosphericstudies, Doppler radars are promising tools for the activeremote sensing of volcanic eruptions but were littleapplied to this field. We present the observations madewith a mid-power UHF Doppler radar (Voldorad) duringa 7-h Strombolian eruption at the SE crater of Mount Etnaon 11–12 October 1998. Main characteristics of radarechoes are retrieved from analysis of Doppler spectrarecorded in the two range gates on either side of the jetaxis. From the geometry of the sounding, the contributionof uprising and falling ejecta to each Doppler spectrumcan be discriminated. The temporal evolution of totalpower backscattered by uprising targets is quite similar tothe temporal evolution of the volcanic tremor and closelyreproduces the overall evolution of the eruption before,during and after its paroxysm. Moreover, during the sharpdecrease of eruptive activity following the paroxysm,detailed analysis of video (from camera recording), radarand seismic measurements reveals that radar and videosignals start to decrease simultaneously, approximately2.5 min after the tremor decline. This delay is interpreted
as the ascent time through a magma conduit of large gasslugs from a shallow source roughly estimated at about500 m beneath the SE crater. Detailed analysis of eruptiveprocesses has been also made with Voldorad operating ina high sampling rate mode. Signature of individualoutburst is clearly identified on the half part of Dopplerspectra corresponding to rising ejecta: temporal variationsof the backscattered power exhibit quasi periodic undu-lations, whereas the maximum velocity measured on eachspectrum displays a sharp peak at the onset of eachoutburst followed by a slow decay with time. Periodicityof power variations (between 3.8 and 5.5 s) is inagreement with the occurrence of explosions visuallyobserved at the SE vent. Maximum vertical velocities ofover 160 m s�1 were measured during the paraoxysmalstage and the renewed activity. Finally, by using asimplified model simulating the radar echoes character-istics, we show that when Voldorad is operating in highsampling rate mode, the power and maximum velocityvariations are directly related to the difference in size andvelocity of particles crossing the antenna beam.
Keywords Explosive eruption · Volcanic jet · Dopplerradar · Particle velocity · Gas velocity · Dopplerspectrum · Volcanic tremor
Introduction
Volcanic outbursts are, potentially, important sources ofinformation for understanding eruption mechanisms.Outburst intensity, expressed by particle velocity andconcentration in the jet, is directly related to the energyreleased by the volcano. In relatively fluid magma, like atEtna, gases form a separate and evolving phase undergo-ing decompression, expansion and acceleration and mayultimately fragment the liquid. The surface explosiveregimes generally range from Strombolian, where discretegas slugs are released in rhythmic bursts disrupting thetop of the magma column and jetting lava clots up in theair for a few seconds, to lava fountains, where a central
Editorial responsibility: A. Woods
G. Dubosclard · F. Donnadieu ()) · R. Cordesses · C. Hervier ·J. KornprobstOPGC, Universit� Blaise Pascal, Clermont-Ferrand, Francee-mail: [email protected].: +33-0-473346700Fax: +33-0-473346744
G. DubosclardLaboratoire de M�t�orologie Physique,Universit� Blaise Pascal - CNRS, Clermont-Ferrand, France
P. AllardLSCE, CEA-CNRS, Gif/Yvette, France
M. Coltelli · E. PriviteraIstituto Nazionale di Geofisica e Vulcanologia,Sezione di Catania, Italy
F. Donnadieu · J. KornprobstLaboratoire Magmas & Volcans, Universit� Blaise Pascal - CNRS,Clermont-Ferrand, France
gas jet sustained over several hours expels molten clots oflava in a continuous shower (Vergniolle and Jaupart 1986;Vergniolle and Mangan 2000). Gases therefore providethe driving force of volcanic eruptions. Only scarce data(essentially collected at Stromboli) are available onparticle velocity, particle size distribution, and gasvelocity, as well as their distribution in the jet and theirevolution in time at the scale of an explosion as well asthat of an eruption. Thus, although a more accurateknowledge of volcanic jet structure and dynamics seemsto be a fruitful research orientation, there is yet a crucialneed for estimates of these parameters inside volcanic jetsas a function of time for several reasons: (1) to monitorthe continuous evolution of an eruption even duringadverse weather and assess its changes in intensity; (2) toprovide more stringent constraints on the assumptionsincluded in models of volcanic processes and improvetheir quantitative basis; (3) to investigate more thoroughlythe conduit flow dynamics from the magma chamber tothe surface by combining direct measurements of jetparameters variations at the surface with other type ofdata coming from signals generated at the top of themagma column (e.g. acoustic) or deeper in the conduit(e.g. seismic).
For evident safety reasons during field work near aneruptive vent, measurements of eruption dynamics char-acteristics are generally restricted to passive remotesensing methods. These are mainly based on photographic(Chouet et al. 1974; Blackburn et al. 1976; Ripepe et al.1993), video (Sparks and Wilson 1982; Neuberg et al.1994; Ripepe et al. 2001) or acoustic (Mauk 1983;Vergniolle et al. 1996; Ripepe et al. 1996) techniques.Recently, active remote sensors based on Doppler radarprinciple and commonly used in atmospheric researchhave been successfully operated at Stromboli volcano(Weill et al. 1992; Hort and Seyfried 1998; Seyfried andHort 1999). The main advantage of these systems is toselectively probe inside a specific volume of the jetgenerally just above the crater. Furthermore, they provide,with a good temporal and spatial coverage, two data setsrelated respectively to the echo power and velocity of theejecta, which can be used to quantify the intensity of theeruption.
The Doppler sounders (sodar and frequency modulatedradar) already used at Stromboli volcano were well suitedfor the study at close distance of relatively small volcanicjets emitting low velocity particles. In this paper wepresent measurements of a more intense Strombolianeruption made at Mount Etna (Italy) with a pulsedDoppler radar (Voldorad) specially designed and built forthe sounding of explosive volcanic eruptions at distancesof hundreds of meters to several kilometres (Dubosclardet al. 1999).
Voldorad, a volcano Doppler radar
Using a mid-power transmitter (1 kW) and a steerableYagi antenna array (beamwidth=9�), Voldorad is an UHF
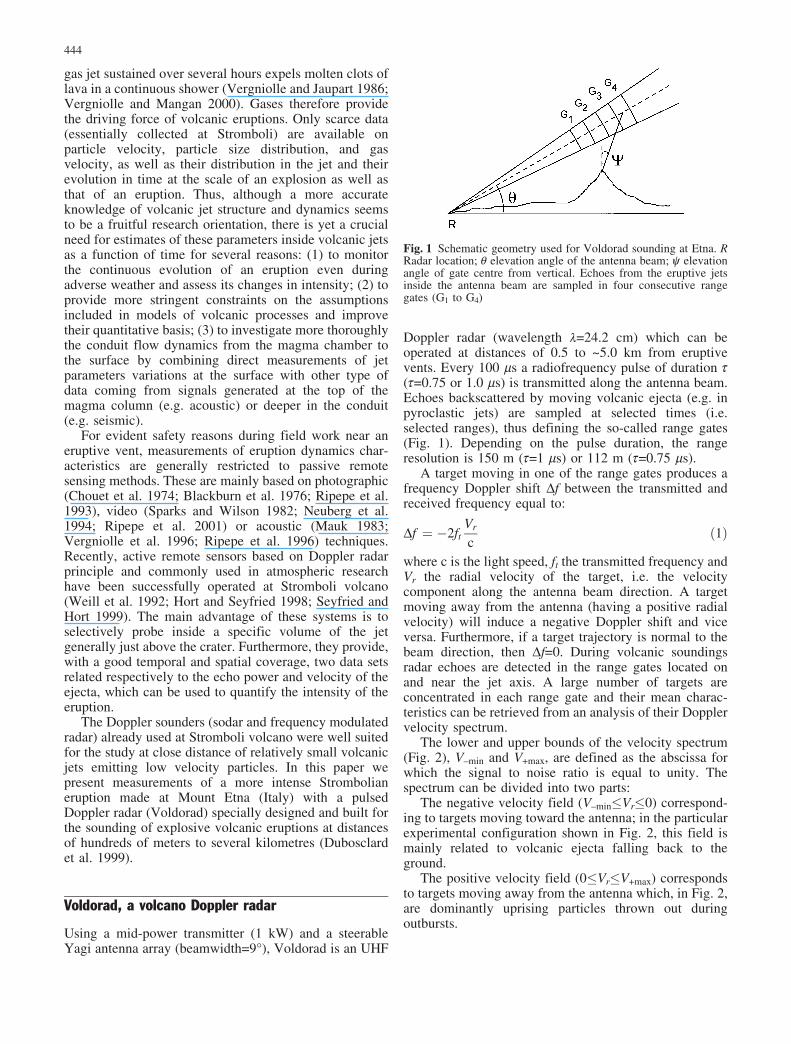
Doppler radar (wavelength l=24.2 cm) which can beoperated at distances of 0.5 to ~5.0 km from eruptivevents. Every 100 ms a radiofrequency pulse of duration t(t=0.75 or 1.0 ms) is transmitted along the antenna beam.Echoes backscattered by moving volcanic ejecta (e.g. inpyroclastic jets) are sampled at selected times (i.e.selected ranges), thus defining the so-called range gates(Fig. 1). Depending on the pulse duration, the rangeresolution is 150 m (t=1 ms) or 112 m (t=0.75 ms).
A target moving in one of the range gates produces afrequency Doppler shift Df between the transmitted andreceived frequency equal to:
Df ¼ �2ftVr
cð1Þ
where c is the light speed, ft the transmitted frequency andVr the radial velocity of the target, i.e. the velocitycomponent along the antenna beam direction. A targetmoving away from the antenna (having a positive radialvelocity) will induce a negative Doppler shift and viceversa. Furthermore, if a target trajectory is normal to thebeam direction, then Df=0. During volcanic soundingsradar echoes are detected in the range gates located onand near the jet axis. A large number of targets areconcentrated in each range gate and their mean charac-teristics can be retrieved from an analysis of their Dopplervelocity spectrum.
The lower and upper bounds of the velocity spectrum(Fig. 2), V–min and V+max, are defined as the abscissa forwhich the signal to noise ratio is equal to unity. Thespectrum can be divided into two parts:
The negative velocity field (V–min�Vr�0) correspond-ing to targets moving toward the antenna; in the particularexperimental configuration shown in Fig. 2, this field ismainly related to volcanic ejecta falling back to theground.
The positive velocity field (0�Vr�V+max) correspondsto targets moving away from the antenna which, in Fig. 2,are dominantly uprising particles thrown out duringoutbursts.
Fig. 1 Schematic geometry used for Voldorad sounding at Etna. RRadar location; q elevation angle of the antenna beam; y elevationangle of gate centre from vertical. Echoes from the eruptive jetsinside the antenna beam are sampled in four consecutive rangegates (G1 to G4)
444

The total echo power P received in a given range gatecan be written as the sum of two terms P+ and P–representing the total power backscattered by targets withpositive and negative radial velocities, respectively:
P ¼ P� þ Pþ ¼Z 0
V�min
pðvÞdvþZ Vþmax
0pðvÞdv ð2Þ
where p(v) stands for the backscattered power associatedwith velocity v. Similarly, the average velocities of targetscrossing the range gate are given by:
V�mean ¼R 0
V�minpðvÞvdv
P�Vþmean ¼
R Vþmax0 pðvÞvdv
Pþ(3)
Knowing any radial velocity Vir (V–min , V+max, V–mean,V+mean), the corresponding jet velocity Vi measuredradially from the vent and its vertical component Wi arededuced from the sounding geometry, using respectivelyEqs. (4a) and (4b) (Dubosclard et al. 1999):
Vi ¼Vir
sinðq� yÞ ð4aÞ
Wi ¼ Vi cosy ð4bÞwhere q is the antenna elevation angle above horizontaland y is the angle between the gate-crater axis and thevertical (Fig. 1). Note that Eq. (4a) cannot be used whenq=y. However, in this configuration, the target trajectorywould be normal to the radar beam direction and noDoppler shift would be measured (Vir=0). Thus, the radarallows to retrieve two sets of parameters from a Dopplerspectrum analysis: positive parameters (P+, V+max, V+mean)and negative parameters (P– , V–min, V–mean), respectively,
associated with particles moving away or toward the radarantenna, which in turn correspond to rising and fallingparticles, in the central range gates.
Experimental conditions
From mid-September 1998 to early February 1999, theeruptive activity at Mt Etna was mainly located at theSoutheast (SE) summit Crater. During this interval, 21periodical episodes of brief Strombolian eruption oc-curred at the SE Crater lasting a few hours andculminating in 300–600-m-high continuous jets and lavaflows. Each eruption was interspersed by one week, inaverage, of total quiescence. The last event occurred onFebruary 4th 1999, and was the most explosive of thewhole series; an eruptive fissure opened at the south-eastern base of the SE cone from which a lava flowspilled into the Valle del Bove. Other remarkable series ofsimilar episodes again took place at the same craterbetween January and August 2000, and from May 2001until the summit and S-NE flank eruption of July-August2001 (INGV scientific staff 2001).
Radar soundings reported here were carried out onOctober 11–12th 1998, during the seventh eruptiveepisode of the SE Crater since its reawakening on 15September. The Southeast crater began to erupt at about16:00 UT and the eruption progressively increased up to aparoxysmal phase, which took place between 23:00 and00:00, and consisted of lava fountains and a lava flow thatextended 700 m downslope eastward adjacent to the 5October flow. During the second part of the night, thevolcanic activity decreased regularly and finally ended atabout 11:00 on October 12th.
Voldorad was set up at an altitude of 2,900 m a.s.l.,300 m below and about 1,150 m away from the SE craterrim (Torre de Filosofo; Fig. 3). Radar measurements were
Fig. 2 Typical Doppler spectrum obtained with Voldorad in aselected range gate. (Vr radial velocity of the target, i.e. componentof the velocity V along the antenna beam direction). PSD powerspectral density in dB units. The horizontal line corresponds tobackground noise level. Positive radial velocities (right) correspondto targets moving away from the radar antenna, negative radialvelocities (left) to targets moving toward the radar antenna. Zeroradial velocity is forced to mean noise power
Fig. 3 Contour map of Mount Etna’s summit area showing theactive SE crater in October 1998, the site of radar measurement andvolcanic tremor recording at Torre del Filosofo, and the online TVcamera location
445

performed overnight for 7 h, from about 19:30 to 02:30.Volcanic tremor data from the broadband seismograph ofIIV (Istituto Internazionale di Vulcanologia now IstitutoNazionale di Geofisica e Vulcanologia, Catania) at Torredel Filosofo as well as video records from the IIV onlineTV camera located at La Montagnola (2,700 m a.s.l.,about 4 km south of SE crater) were available for thisperiod.
Initially (19:30 to 22:50), several combinations ofantenna elevation angle (q) and pulse duration (t) weretested. Afterwards (22:50 to 02:30) all soundings wereperformed with q=30� and t=0.75 ms. Under suchoperating conditions, radar echoes from the eruption wererecorded in four consecutive range gates (G1 to G4;Table 1, Fig. 1). Continuous and powerful echoes wereobserved in the central gates G2 and G3 (hereafter G23), oneither side of the jet axis (Fig. 4), whereas echoes from G1and G4 were weaker and much more intermittent.Furthermore, backscattered power in G2 (315 m abovethe crater : Fig. 4) was always greater than in G3 (371 mabove the crater). This is in agreement with the commonlyaccepted idea that the concentration of pyroclasts ishigher near the jet axis and decreases with height (e.g.Chouet et al. 1974).
For each range gate, the contribution to the Dopplerspectrum of uprising ejecta and falling ejecta can bededuced from the geometry of the experiment. Forinstance, Fig. 4 shows that all rising ejecta crossing G3had positive radial velocities (trajectories 3 and 4). Thecorresponding Doppler spectrum ranges in velocity from0 to V+max. In the same gate, all falling particles havenegative radial velocities and their Doppler spectrumspreads on the velocity range 0–V–min. As in G3, mosttargets rising in G2 (e.g. trajectory 2 in Fig. 4) havepositive radial velocities. However, particles culminatingin G2 (e.g. trajectory 1) induce, close to their apex, a lownegative velocity. Nevertheless, as a first approximation,we will consider thereafter that for central gates G2 andG3, positive and negative Doppler parameters correspondessentially to rising and falling particles, respectively.
Radar observations
Temporal evolution of the radar signal
Assuming that radar echoes detected by Voldorad aremainly due to Rayleigh scattering of the transmittedsignal by the erupted pyroclasts (particle size smaller thanthe radar wavelength i.e. than 24 cm), the total powerreceived from a gate located at distance r from theantenna is given by (e.g. Sauvageot 1992):
Pr ¼ Ce� 1eþ 1
��������2 Z
r2ð5Þ
where C is a constant including the radar characteristics, ethe dielectric constant of the targets and Z the so-calledradar reflectivity factor which, for spherical targets, isgiven by:
Z ¼Z 1
0NðDÞD6dD ð6Þ
where N(D)dD is the number of particles per unit volumewhose diameters are between D and D+dD.
For radar sounding of rain, an empirical relation wasestablished between the reflectivity factor and rainfall rate(e.g. Sauvageot 1992). By analogy, if P+23 denotes thesum of P+ in gates G2 and G3, it can reasonably beassumed that the variations of P+23 during the radarsounding period do reflect the changes of eruption flowrate in the central part of the jet at 315–370 m above thecrater. Figure 5 shows the temporal evolution during theeruption of both P+23 together with the amplitude of thevolcanic tremor.
The eruptive episode is well characterised by thetemporal variations of the volcanic tremor. In closeagreement with field observations, these define threemain eruptive stages, namely: (1) a gradual increase ofStrombolian activity from 19:30 to 23:00 UT; (2) aparoxysmal phase (23:00 to 00:00), with a maximum at23:15, during which the jets became almost continuous,approaching lava fountaining ; and (3) a post-paroxysm
Table 1 Characteristics of range gates of 112 m width (antennaelevation angle: 30�, pulse duration: 0.75 ms)
G1 G2 G3 G4
Gate angle to the vertical Y (�) 29 8 �8 �19Slanting distance to the radar (m) 1,118 1,230 1,342 1,455Horizontal distance to the crater (m) �142 �45 52 149Elevation above crater Z (m) 259 315 371 427Gate height (m) 175 193 210 228
Fig. 4 Radar sounding geometry at scale (gate width: 112 m;antenna beamwidth: 9.5�; antenna elevation angle q=30�) andexamples of ballistic trajectories in gates G2 and G3. The origin ofthe coordinate system is at crater centre. See text for details
446

decline that was initially sharp but that includes areactivation burst around 00:50.
The three main phases of the eruptive sequence areclearly apparent on the temporal evolution of the radarsignal shown in Fig. 5. P+23 first growths up quietly until22:30, and then more intensively from about 22:45.Throughout all the paroxysmal phase, the radar signalcontinues to increase and then dramatically decreasesnear midnight. During this last stage of the eruption, theoverall variations of P+23 closely match the temporalevolution of the volcanic tremor intensity except duringthe reactivation of eruptive activity (around 01:00) justwhen Voldorad was operating in high resolution mode (cf.thereafter); as a result, each data point (corresponding to a20-s integration period) is probably more representativeof the instantaneous received signal than the meanevolution of the radar echoes, because of the time gapsneeded for data transfer to the PC between measurementsequences.
The major differences between the volcanic tremor andthe radar signals are observed during the increase of thevolcanic activity. The apparent delay between the twosignals probably results from an underestimation of thereflectivity of total ejected particles. Indeed, G2 and G3range gates being located near 350 m above the crater (inorder to reduce perturbations by ground clutters) only asmall fraction of the ejected particles reached this levelduring the first hours of the eruption. So, the increase ofP+23 signal probably portrays the progressive filling of theantenna beam by a growing flux of particles resultingfrom the development of the eruption activity (note thatdue to a power generator failure no radar data are
available during the maximum of seismic signal). Bycontrast, even if the antenna beam was not fully filled up,the sharp decrease in volcanic activity around 00:00necessarily induced a simultaneous reduction of theparticle flux in the range gates and, consequently, of theP+23 signal. This could explain the relatively goodagreement between the temporal variations of P+ andvolcanic tremor during the post-paroxysmal phase.
In this first experiment, continuous computing of jetvelocities from Doppler spectra over the whole eruptiveepisode was hardly possible on account of rather frequentsaturation of the digitized data resulting from largeamplitude variations of the backscattered signal despite a30 dB attenuation of the receiver gain. Also, because oflarge jet velocity variations, aliasing effects on Dopplerspectra were sometimes observed that prevented contin-uous recording of maximum velocities (i.e. end ofspectra). However, one can deduce from the typicalshape of Doppler spectra (Fig. 2) and Eq. (3) that meanvelocities are mainly influenced by large power spectraldensity (P+) values (i.e. left part of positive velocities).Therefore, Dubosclard et al. (1999) managed to retrievedispersed values of mean velocities reaching 21 m s�1 andestimated by ballistics corresponding initial ejectionvelocities to 87 m s�1. Another conclusion arising fromthis is that V+mean represents velocities of the ejecta havingthe strongest reflectivity factor, that is, particles with thelargest diameters thus making up the bulk mass of the jet.In addition, we have retrieved values of maximumvelocities measured in the beam direction (V+max) up to60 m s�1 from measurement sequences integrated over 5 sduring the paroxysmal stage of the eruption just beforemidnight. This provides estimates of maximum verticalvelocities up to 160 m s�1.
Comparison between radar, video and tremor signals
In order to investigate more thoroughly the relationshipbetween the radar signal and the volcanic activity, theevolution of ejecta flux was roughly assessed by usingvideo image recorded by the monitoring TV camera.Individual frames (sampling period of 3 s) correspondingto the same centring and focal length were first extracted(as a bitmap file) from the video record. Processing ofeach image (limited to the area above the crater rim andunder the image legend; Fig. 6) was then carried out intwo steps: (1) reduction of the colour depth and increaseof the contrast, in order to get a four colours image (i.e.black, red, yellow and white) as shown in Fig. 6; (2)counting the total pixel number of each individual red(Xr), yellow (Xy) and white (Xw) colour.
Let XT be the total sum of coloured pixels such as:
XT ¼ XR þ XY þ XW ð7ÞIn spite of some optical parasite effects (due to
reflection and diffusion of light), it can reasonably beassumed that the variation of XT with time is a roughindicator of the surface volcanic activity at the SE crater;
Fig. 5 Temporal evolution of radar echo power (P+23) and volcanictremor amplitude (continuous line) during the October 11–12, 1998eruption (see text). Tremor data are smoothed by running average.Radar data measured with an antenna elevation angle q=30� (dots)are averaged over a 1-min period. Triangles correspond to radarmeasurement sequences made in high sampling rate mode andintegrated over 20 s. Open circles around 22:00 correspond toadjusted data measured with q=20�
447

this is exemplified in Fig. 7 where are plotted thetemporal evolutions of volcanic tremor amplitude, radarecho power P+23 and XT during and after the eruptionparoxysm. The overall variations of P+23 and XT are quitesimilar. Discrepancies only occur around 00:45, when theradar operated in high resolution mode, confirming that,in this case, radar data are not fully representative of themean evolution of the eruption. The variations of P+23 andXT are also in good agreement with the temporal evolutionof the tremor amplitude, although two main differencesare observed during the eruption climax (23:00 to 00:00):a) between 23:00 and 23:30, during the strong amplifi-cation of the tremor amplitude (which reaches itsmaximum around 23:20) the video signal successivelypasses through a maximum and a minimum; b) from23:30 to 00:00, while the seismic activity is relativelyconstant, XT and P+23 are still increasing.
According to the mechanism suggested by La Delfa etal. (2001), our measurements can be interpreted in termsof internal dynamics of the volcano. These authorssuggested the presence of a significant magma bodybelow the SE crater that fed the periodic eruptions in acyclic manner during the end of 1998. Progressive build-up of magmatic pressure probably occurred owing tocontinuous, low-supply rate of basaltic magma fromdepth. Then, the continuous increase of the volcanictremor until 23:15 might reflect the progressive openingof the eruptive vent. At 23:15, the vent was fully open andthe flux of magma and gas from a shallow reservoircontinued to rise rapidly in accordance with the increaseof P+23 and XT signals. This led to a pressure drop in themagma chamber and, consequently, to the sudden reduc-tion of Strombolian activity at 00:00, also marked by theabrupt decrease of the tremor, radar and video signals.
A more detailed temporal evolution of those threesignals around 00:00 is shown in Fig. 8, where thevariation of the white pixel number (XW) is also plotted.Corresponding to the inner part of the video picture(Fig. 6), XW represents the warmer part of the jets justabove the vent. It is also less contaminated than the otherred and yellow pixels by the parasitic diffusion effects. Inspite of rather large signal fluctuations, Fig. 8 shows thatradar and video (especially XW) signals behave verysimilarly at that time, whereas the seismic signal evolvesdifferently. Cross-correlation analysis shows that the bestfit (correlation coefficient r=0.94) is obtained when theradar signal is delayed by 2.5 min from the tremor signal.The best correlation to the tremor is found at 4 min for XT(r=0.86) and 1 min for XW (r=0.96). Interestingly, bothindependent video and radar signals reveal a delaybetween the tremor and the surface activity at thebeginning of the eruption decline. We consider hereafterthe time-lag of 2.5 min provided by the radar signalbecause it represents an average value and is inferred
Fig. 7 Temporal evolution of volcanic tremor amplitude, radarecho power (P+23) and video (X T) signals. All data are smoothed byrunning average
Fig. 6 Typical picture extracted from video record of the IIVtelecamera, and processed to obtain four elementary colours (black,red, yellow and white). In order to eliminate insignificant data,counting of coloured pixels is limited to the area between the twohorizontal lines
Fig. 8 Close-up of the temporal evolution of the volcanic tremor,radar (P+23) and video (XW, X T) signals showing the end of theparoxysmal phase around midnight. All data are smoothed byrunning average. Notice the good coincidence of the drop off (at23:59) of radar and video signals imaging the surface activity andthe time delay of about 2.5 min to the tremor decline
448

from direct probing of the jet interior, whereas XW forexample depends on the temperature of the lava clots andwhether or not the hot inner core of the jet is exposed.This delay could be interpreted as the transfer time ofenergy from depth to the surface at least at the end of theparoxysm. This time might be related to the depth of thetremor source.
Note that scrutiny of Figs. 5 and 7 suggests that a moresignificant delay of about 35 min might exist betweenradar and volcanic tremor signals. The peak in tremor at23:20 would then correspond to that at 00:55 and twoother peaks might then correlate at 00:10 (tremor) and00:45 (radar). However, this delay is highly hypotheticaldue to operational limitations of radar soundings alreadymentioned above: lack of radar data during paroxysm(around 23:20); measurements around 01:00 are scarce(high sampling-rate mode) and short (20 s) and thus radarrecords are not fully representative of the mean evolutionof the eruptive activity around 01:00.
Discussion
One possible interpretation of the delay between seismicand radar (also video) signals is proposed in thefollowing. The recurrent pattern of SE crater eruptionsin 1998–1999, with relative calm or very low-levelactivity that lasted up several days interspersed withepisodes of very intense Strombolian activity that culmi-nated in lava fountains and short-lived, rapid effusion oflava flows for 1–2 days, strongly suggests a cyclicalprocess of gas accumulation and release at a given depthbeneath the crater. This mechanism requires a pre-eruptive gas enrichment. The most likely enrichmentprocess, common at other basaltic volcanoes, is thecyclical accumulation of a gas bubble foam layer at eitherthe top of a magma body beneath SE crater or any kind ofstructural discontinuity (e.g. Jaupart and Vergniolle1988). Upon reaching a critical thickness, the bubblefoam gradually collapses and generates large gas slugsthat rise through a basalt-filled conduit and then burst outat the surface. The eruption stops when the foam has beenremoved or the overpressure evacuated, and a new cycleof bubble accumulation can start again.
In this framework, we interpret the tremor increase tobe due to magma degassing dynamics beneath the SEcrater, and the time lag of 2.5 min observed aroundmidnight between the tremor amplitude and the radarsignal as being the ascent time of the gas slugs throughthe volcanic conduit. Assuming that large slugs rise in aregime dominated by inertia over melt viscosity andsurface tension, their upward velocity in a verticalcylindrical conduit of diameter Dc, filled with moltenbasalt, is well approximated by (Wallis 1969; Vergniolle1998):
Vs ¼ 0:345ffiffiffiffiffiffiffiffigDc
pð13Þ
where g is the gravity acceleration. Although Dc is notknown accurately throughout the conduit length, we canassume an effective conduit flow diameter of 10 mbecause this value is in the range provided by observa-tions of the exit vent diameter during this period (GVN1998; La Delfa et al. 2001). We thus obtain Vs=3.4 m s�1
which, for a transit time t of 2.5 min, would imply a slugsource at about 500 m beneath the SE crater. Assumingthat Dc and t are known respectively within €3 m and€30 s, the uncertainty on the source depth is €180 m.Eventually, because of all simplifying assumptions made,we consider a source depth located at a few hundredmeters, in agreement with studies of other authors at Etna(e.g. Schick and Riuscetti 1973; Ereditato and Luongo1994) and Stromboli (Chouet et al. 1999; Vergniolle2001). Note that with the more hypothetical 35-min delaybetween radar and tremor signals, the reservoir would belocated at a depth of about 7 km, consistent with seismicstudies (Laigle and Hirn 1999; Laigle et al. 2000).
High temporal resolution radar sensingof volcanic jets
Explosion sequences
In order to get a detailed observation of the eruptiveprocesses, Voldorad was also operated in a high resolu-tion mode which was specifically developed for volcanicsounding. The acquisition procedure is manually triggeredand so, can be synchronized with any particular event(striking suite of explosions for instance). The returnsignal in a given range gate is sampled at high frequency(up to 64 ms) and the resulting data are stored in amemory buffer. At the end of the sequence, the buffercontent is transferred on the hard disk of the computer.Due to the important data flow and the limited size of thebuffer, the high resolution sequence duration was limitedto about 20 s with this first version of Voldorad; since, ithas been significantly increased in a new version of theradar (Voldorad II).
This fast data sampling mode was used between 00:30and 01:10. Figure 9 shows an example of Doppler spectrasequence (averaged over a 1-s period) measured in gateG2 with such an operating mode. The onset of datasampling was manually triggered in coincidence with theonset of an explosion, visually observed at the SE Craterand propelling lava clots. From the corresponding spec-trum (t=0 s) we infer the following radial velocities:V+max=42 m s�1, V+mean=15 m s–1, V–min=�27 m s–1,V–mean=�7 m s–1. Using Eqs. (4a) and (4b) with q=30� andy=8� provides estimates of vertical velocities in gate G2:W+max=112 m s–1, W+mean=40 m s–1, W–min=�72 m s–1,W–mean=�19 m s–1. The main error on the calculation ofthe vertical velocity W arises from the uncertainty on thevalue of angle y (Fig. 1), that is from the relative positionof the gate centre (xc, zc) to the crater. For gate G2(xc=45 m, zc=315 m), y is small (8�) so that a relativeerror of 20% on xc and zc would produce a relative error of
449
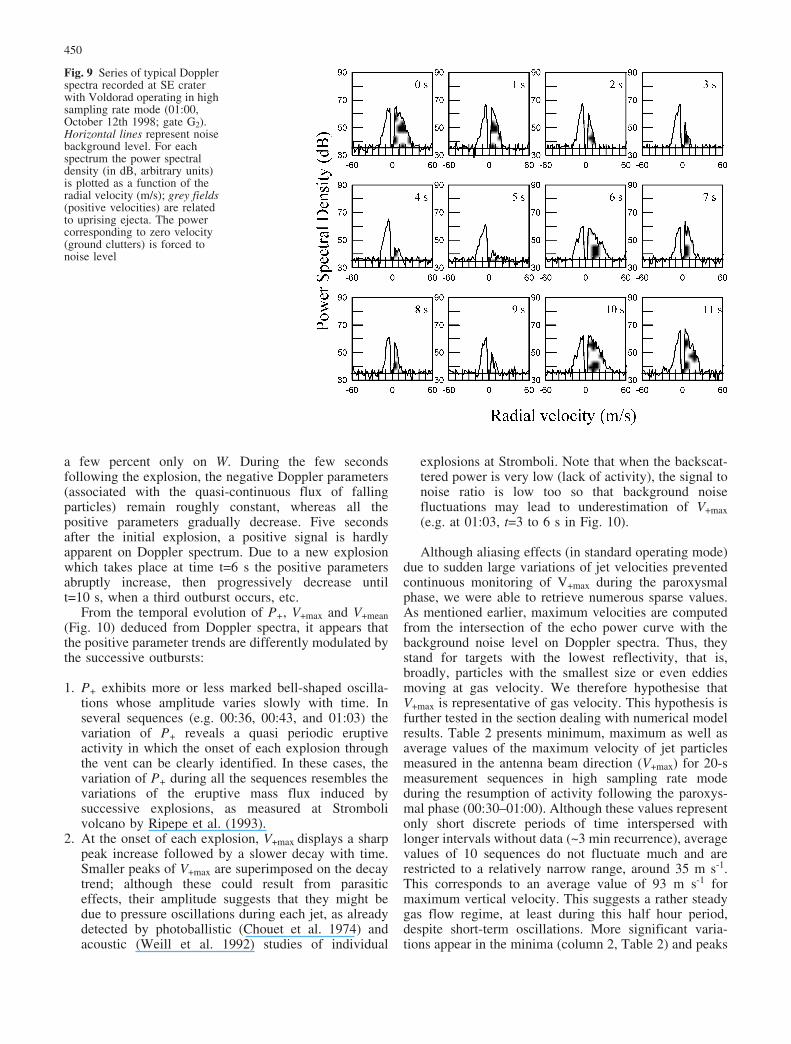
a few percent only on W. During the few secondsfollowing the explosion, the negative Doppler parameters(associated with the quasi-continuous flux of fallingparticles) remain roughly constant, whereas all thepositive parameters gradually decrease. Five secondsafter the initial explosion, a positive signal is hardlyapparent on Doppler spectrum. Due to a new explosionwhich takes place at time t=6 s the positive parametersabruptly increase, then progressively decrease untilt=10 s, when a third outburst occurs, etc.
From the temporal evolution of P+, V+max and V+mean(Fig. 10) deduced from Doppler spectra, it appears thatthe positive parameter trends are differently modulated bythe successive outbursts:
1. P+ exhibits more or less marked bell-shaped oscilla-tions whose amplitude varies slowly with time. Inseveral sequences (e.g. 00:36, 00:43, and 01:03) thevariation of P+ reveals a quasi periodic eruptiveactivity in which the onset of each explosion throughthe vent can be clearly identified. In these cases, thevariation of P+ during all the sequences resembles thevariations of the eruptive mass flux induced bysuccessive explosions, as measured at Strombolivolcano by Ripepe et al. (1993).
2. At the onset of each explosion, V+max displays a sharppeak increase followed by a slower decay with time.Smaller peaks of V+max are superimposed on the decaytrend; although these could result from parasiticeffects, their amplitude suggests that they might bedue to pressure oscillations during each jet, as alreadydetected by photoballistic (Chouet et al. 1974) andacoustic (Weill et al. 1992) studies of individual
explosions at Stromboli. Note that when the backscat-tered power is very low (lack of activity), the signal tonoise ratio is low too so that background noisefluctuations may lead to underestimation of V+max(e.g. at 01:03, t=3 to 6 s in Fig. 10).
Although aliasing effects (in standard operating mode)due to sudden large variations of jet velocities preventedcontinuous monitoring of V+max during the paroxysmalphase, we were able to retrieve numerous sparse values.As mentioned earlier, maximum velocities are computedfrom the intersection of the echo power curve with thebackground noise level on Doppler spectra. Thus, theystand for targets with the lowest reflectivity, that is,broadly, particles with the smallest size or even eddiesmoving at gas velocity. We therefore hypothesise thatV+max is representative of gas velocity. This hypothesis isfurther tested in the section dealing with numerical modelresults. Table 2 presents minimum, maximum as well asaverage values of the maximum velocity of jet particlesmeasured in the antenna beam direction (V+max) for 20-smeasurement sequences in high sampling rate modeduring the resumption of activity following the paroxys-mal phase (00:30–01:00). Although these values representonly short discrete periods of time interspersed withlonger intervals without data (~3 min recurrence), averagevalues of 10 sequences do not fluctuate much and arerestricted to a relatively narrow range, around 35 m s-1.This corresponds to an average value of 93 m s-1 formaximum vertical velocity. This suggests a rather steadygas flow regime, at least during this half hour period,despite short-term oscillations. More significant varia-tions appear in the minima (column 2, Table 2) and peaks
Fig. 9 Series of typical Dopplerspectra recorded at SE craterwith Voldorad operating in highsampling rate mode (01:00,October 12th 1998; gate G2).Horizontal lines represent noisebackground level. For eachspectrum the power spectraldensity (in dB, arbitrary units)is plotted as a function of theradial velocity (m/s); grey fields(positive velocities) are relatedto uprising ejecta. The powercorresponding to zero velocity(ground clutters) is forced tonoise level
450

of maximum velocity (column 3: ~51 to about 61 m s�1,i.e. 136 to 163 m s�1 for vertical velocities) revealingthese short-term fluctuations. The maximum verticalvelocity (W=163 m s�1) is comparable with values foundduring the paroxymal stage. The radial components of themaximum accelerations and decelerations for these shortperiods are presented as well in Table 2 (column 5 and 6).The components of maximum accelerations measured inthe beam direction reach 164 m s�2, which is equivalent tovertical accelerations of about 440 m s�2 in the jet,whereas maximum vertical decelerations exceed�300 m s�2.
3. Finally, except for brief peaks occurring at the onset ofeach outburst, V+mean remains fairly constant. Itssteadiness and average value (about 10 m s�1, i.e.W+mean=27 m s�1) are determined by larger tephra
passing through the gate and quasi continuouslyejected during the eruptive activity approaching lavafountaining.
In each diagram of Fig. 10, the sharp initial peak ofV+max shortly precedes the maximum of P+. This is likelyrelated to the different size and velocity of particlespassing through G2. In fact, at the onset of each outburst,the first targets crossing the radar beam are the finestparticles that have the lowest reflectivity and move at (orclose to) the gas velocity. These small particles arefollowed in the jet by larger and slower ejecta, whosehigher radar reflectivity determines an increase of P+ anda decrease of V+max (Fig. 10).
Fig. 10 Sequences of temporalvariations of positive parame-ters (P+, V+max, V+mean) deducedfrom Doppler spectra measuredin gate G2 during the eruptionreactivation phase with Voldo-rad operating in high samplingrate mode. Arrows indicate theoccurrence of explosions visu-ally observed at SE crater.Vertical velocities can be cal-culated by multiplying theplotted radial velocities by 2.67
Table 2 Velocity and acceleration data set inferred from themaximum velocity of jet particles measured in the radar beamdirection (V+max) in the range gate at 1,230 m during sequences of
20 s like in Fig. 10 (0.25 s sampling rate). Vertical components canbe obtained by multiplying by 2.67
Time(U.T.)
Minimum V+max(m s�1)
Maximum V+max(m s�1)
Average V+max(m s�1)
Maximum acceleration(m s�2)
Maximum deceleration(m s�2)
00:36 11.4 60.6 34.5 164 �7600:43 24.6 54.9 35.5 95 �8800:47 24.6 56.8 36.5 85 �5700:49 22.7 54.9 36.6 133 �6700:53 18.9 47.3 33.0 69 �5700:55 20.8 60.6 37.2 114 �7600:58 26.5 54.9 37.2 66 �7601:00 22.7 60.6 37.6 114 �11401:03 7.6 51.1 24.6 123 �5701:06 18.9 54.9 31.3 85 �95
451

Spectral analysis of eruptive jets
Fourier analysis of P+ variations during the eruptive jets(Fig. 11) reveals that the resulting spectra have commonfeatures:
– Most of the spectral energy is concentrated in the lowfrequencies (<0.5 Hz);
– All spectra show one or several peaks between 0.4 and0.1 Hz;
– A peak near 0.2 Hz observed in almost all spectracorresponds to the average period of 5 s betweensuccessive outbursts. Rhythmic front pulses at inter-vals of 1 to 5 s through the core of lava fountains arecommon (Vergniolle and Mangan 2000).
– A substantial part of the energy is associated withlower frequencies (<0.08 Hz) but, due to the limitedsize of the time series (21 s), its spectral componentscan’t be thoroughly resolved. These are probablyassociated with the slow variations superimposed to P+oscillations observed in Fig. 10.
The mean frequency calculated for all spectra, shownin Fig. 11 is 0.22€0.04 Hz. The corresponding periods(3.8 to 5.5 s) confirm a rather steady eruptive regimeduring the time interval from 00:30 to 01:10.
Modelling of radar signal
In order to improve our understanding of radar echoesfrom volcanic explosions, a simplified model (seeappendix) is developed, which simulates the temporalevolution of the positive parameters corresponding to aflux of spherical particles crossing the radar beam. Thisstill simple model is not intended to reproduce the wholecomplexity of volcanic explosions and provide vol-canological interpretations but rather to validate assump-tions made for our interpretation of Doppler spectra interms of eruption characteristics. In particular, we verifyour previous hypothesis that V+mean was related to largeparticles making up the broad mass of the jet whereasV+max was more representative of the gas velocity.
Assumptions
We assume that the particles simultaneously launched bythe explosion are all spherical with density rp=1,530 kg/m3 and their size distribution is given by:
NðDÞ ¼ N0 expð�LDÞ ð8Þwhere L and N 0 are constants and N(D) is the number ofparticles of diameter D. Although actual particle-sizedistributions are probably different from a simple expo-nential law, Fig. 12 shows that, at least for decimetrediameters, the measurements made at Stromboli volcano(Ripepe et al. 1993) are in rather good agreement withEq. (8) when L =0.0127. This value of L is used for thesimulation and, as only the relative variations of P+ aresimulated, we take N0=1. Note that for a size distributionsuch as Eq. (8), the radar reflectivity factor Z and the totalmass of particles M are respectively given by:
Z ¼Z 1
0N Dð ÞD6dD ¼ 720
N0
L7 ð9aÞ
M ¼rpp6
Z 10
N Dð ÞD3dD ¼ rppN0
L4 ð9bÞ
When Voldorad is operating in high resolution modewe assume that during the short duration of measuringsequences (20 s) the size distribution law of ejectedparticles doesn’t change significantly (N0 and L nearlyconstant). So, from Eqs. (9a) and (9b) it appears that, insuch a condition, Z is proportional to M. If we furthermoreassume that all the targets have the same dielectricconstant (e), P+ is proportional to Z (see Eq. 5), and,therefore, to M. This proportionality between the powerbackscattered in a given range gate and the mass ofejected pyroclasts crossing this gate could explain the
Fig. 11 Spectral analysis of the echo power backscattered byuprising ejecta (P+) shown in Fig. 10
452

similarity between the temporal evolution of P+23(Fig. 10) and that of mass flux measured by Ripepe etal. (1993) at Stromboli volcano.
Using the so-called radar equation (e.g. Sauvageot1992) and the size distribution (Eq. 8) with N0=1 andL=0.0127 the total power backscattered by particle withdiameter D can be written as:
pðDÞ ¼ C2 expð�0:0127ÞD6 ð10Þwhere C2 is a constant including the radar characteristicsand the dielectric constant supposed equal for all parti-cles.
For our two-dimensional simulation we take C2=1 anda set of particles with discrete values of D (ranging frommillimetres to centimetres) and launched within an anglea of €10� to the vertical. The initial velocity of a particlewith a diameter D is taken as (Steinberg and Babenko1978):
Wp0ðDÞ ¼ Wg0 � kffiffiffiffiDp
ð11Þwhere Wg0 is the gas initial velocity and k=150 (Chouet etal. 1974; Ripepe et al. 1993). Finally it is assumed that the
gas velocity decreases exponentially with height (Black-burn et al. 1976) according to:
WgðzÞ ¼ Wg0 expð�4:6z=zrefÞ ð12Þwhere zref is the height above the vent such asWg(zref)=0.01 Wg0. In the simulations, the followingvalues are arbitrarily used: Wg0=100 m s�1 andzref=1,200 m (i.e. four times the mean height of the rangegates above the crater).
Model results
The model has been first used to simulate the radarresponse to a single outburst occurring at time 0 at thevent. The temporal evolution of positive radar parameters(Fig. 13a) is in rather good agreement with our radarobservations (particularly those at 00:36 and 01:03; seeFig. 10), with a sharp peak of V+max occurring before themaximum of P+ . In agreement with our initial hypoth-esis, Fig. 13b supports that the major contribution to P+comes from the largest particles, whereas the highestvalues of V+max are observed when the smallest particlescross the radar beam.
The model has been also used to simulate thevariations of positive parameters when several consecu-tive explosions occurred at the vent. Several combinationsof input parameters have been tested in order to obtain thebest agreement between model and radar data. The resultof the simulation closely depends on the time delaybetween successive outburst as well as on the size ofparticles launched by each explosion. As an example,Fig 14 shows the temporal variations of positive param-eters computed from the model which resemble, at leastqualitatively, some of the results obtained with Voldorad(00:36 and 00:56 in Fig. 10). The outburst characteristicsused for this simulation (Table 3) correspond to aperiodicity, not only in the occurrence of the explosionsbut also in the size and the mass of launched particles.The qualitative agreement between observed and simu-lated radar signal shows that some of the simplifyingassumptions we used (exponential distribution of spher-
Fig. 13 Temporal evolution ofpositive radar parameters (P+,V+max, V+mean) deduced fromthe model. Left: for 12 values ofparticle diameter (ranging from1 mm to 10 cm); right: forparticle diameters of 2 and3 mm, and 5 and 6 mm
Fig. 12 Particle size distribution in explosive jets at Strombolivolcano. Dots represent data deduced from Fig. 4 in Ripepe et al.(1993). A good fit to the data is found with Eq. (8) for N0=278.8and L=0.0127 mm
453

ical particles, Rayleigh scattering) are reasonable at firstapproximation.
Discussion and conclusions
This first field experiment at Etna has shown that ourDoppler radar is a powerful tool suited for the remoteprobing of Strombolian-type volcanic eruptions. From thegeometry of the sounding the selection of the appropriaterange gates, straight above the crater, allows to discrim-inate in time (sampling rate) and space (range gates), andwith a reliable confidence, the relative contributions to theDoppler spectrum of rising (positive parameters) andfalling (negative parameters) particles.
Several parameters can then be retrieved from theanalysis of each part of the recorded spectra: (1) thepower backscattered from the jet interior, which is afunction of the number and size of ejecta; (2) meanvelocities coming from large particles forming the bulkmass of the jet; (3) maximum positive velocities comingfrom fine particles moving at or close to the gas velocity.Thus, Voldorad can be used directly to follow theevolution of the eruption intensity. Furthermore, itscapacity to record Doppler spectra at a high samplingrate allows detailed scrutiny of individual explosion orlava fountain mechanisms. As of the 11–12 October 1998eruption at Etna SE crater, maximum vertical velocities ofover 160 m s�1 were measured. A good correlation existsbetween the signal retrieved from processed video imagesof the surface activity and radar echo power. A simple
numerical jet model further validates our interpretation ofthe radar measurements and shows that the power andmaximum velocity variations are directly related to thedifference in size and velocity of particles crossing theantenna beam.
Moreover, the positive power spectral density, P+23,reflecting the surface activity, appears to follow a trendsimilar to the tremor amplitude over the whole duration ofthe eruptive episode. Some examples of correlationbetween volcanic tremor and eruptive activity at Etnahave been discussed previously by several authors(Cosentino et al. 1989; Gresta et al. 1991; Montalto etal. 1992, 1995; Falsaperla et al. 1994; La Delfa et al.2001). There is now a general consensus among seismol-ogists that volcanic tremor signals are intimately relatedto both the internal fluid dynamics of the magma gasmixture and the geometrical features of the plumbingsystem. Following the fluid dynamic approach of Wallis(1969) and Vergniolle and Jaupart (1986), Montalto et al.(1992) associated the variations of the tremor amplitudeenvelope, observed at Mt. Etna during the summiteruptions of January 1990, with changes in the flowregime of volcanic gases and vapours escaping throughthe upper magma conduits: from the bubbly flow regimeduring stages of quiet degassing at the summit vents to theslug flow regime when Strombolian bursts occur. Recentseismic and infrasonic data collected at Etna (Ripepe etal. 2001) and at Stromboli (Ripepe 1996; Ripepe andGordeev 1999; Ripepe et al. 2001) suggest that volcanictremor is generated by gas expansion at shallow depth inthe degassing magma column, while infrasound isproduced by gas bubble bursting at the magma free-surface. Besides, Vergniolle and Brandeis (1996) andVergniolle et al. (1996) showed that bubble characteris-tics can be retrieved from acoustic data and provide goodinsight into the eruption dynamics of the system.
For the 11–12 October 1998 eruptive episode, a delayof 2.5 min was found between the decline of the tremoroverall amplitude and that of the radar measurementsimaging the surface activity and confirmed by video data.Such a delay might have existed during the increase oferuption intensity but, due to the sounding geometry,could not be evidenced. This delay suggests a transfer ofenergy from depth where the volcanic tremor originates tothe surface where energy is released through explosionsand the common denominator seems to be the gas bubblesgrowth, flow and burst. We have roughly estimated aminimal source depth of about 500 m. Although this valuemust be taken cautiously because of all assumptions
Fig. 14 Variations of positive parameters calculated from themodel for five successive explosions occurring at times 0, 5, 10, 15and 20 s. Particle diameters are given in Table 3
Table 3 Characteristics of theexplosions simulated in Fig. 14
Explosionnumber
Time ofoccurrence (s)
Particles diameters (cm) Relativemass
1 0 0.1, 0.2, 0.4, 0.6, 0.8, 1, 2, 3, 4, 5, 6, 7, 8, 9, 10 12 5 4, 5, 6, 7, 8 0.423 10 5, 6 0.124 15 4, 5, 6, 7, 8 0.425 20 0.1, 0.2, 0.4, 0.6, 0.8, 1, 2, 3, 4, 5, 6, 7, 8, 9, 10 1
454

made, it falls in a reasonable depth range for magmadegassing in the upper plumbing system.
We are confident that investigating jointly the surfaceactivity by radar (and video) measurements together withbubble outbursts at the top of the magma column byacoustic methods as well as the deep source of thevolcanic tremor will bring more constraints about theplumbing system geometry and its internal dynamicsincluding the depth of gas slug generation. Rigorouscomparisons between the tremor amplitude and V+max(directly related to exit gas velocity) could not beachieved with Voldorad 1998 data because of aliasingand saturation effects on Doppler spectra. These draw-backs are now minimised in the new version of Voldorad,particularly thanks to an improved real time visualisationof radar echoes and associated spectra allowing a moreappropriate choice of radar operating parameters accord-ing the state of the eruption. Emphasis will be put on thecontinuous monitoring of V+max during the next fieldexperiments in order to shed light on the detailed relationbetween volcanic tremor and output gas velocity and toapproach a direct balance of degassing during theexplosive phases.
Appendix
Equations of motion
Let a spherical particle of mass mp be launched by anexplosion at the volcano vent (origin of the coordinatesystem) at time t=0 with a speed v 0 and an ejection anglea0. At time t the particle is at position (x, z). We assumethat two forces are acting on the particle: the drag forceFD (with a direction opposite to the velocity vector) andthe gravitational force. So, the equations of motion of canbe written as:
d2x
dt2¼ FDx
mp
d2z
dt2¼ FDz
mp� g
ðA1Þ
where FDx and FDz are the components of the drag forceand g is the acceleration due to gravity. FD is given by(e.g. Chow 1979):
FD ¼12rgACDðvg � vpÞ2 ðA2Þ
where rg is the gas density, A is the cross-sectional area ofthe particle, CD is the particle drag coefficient, vg(components: ug, vg) and vp (components: up, vp) are thegas and particle velocities. After some rearrangement,(Eq. A1) can be rewritten as:
d2x
dt2¼ 3
4
rg
rp
CD
D
!ug � up
� �wj j
d2z
dt2¼ 3
4
rg
rp
CD
D
!vg � vp
� �wj j � g
ðA3Þ
where rp is the particle density, D its diameter and :
wj j ¼ffiffiffiffiffiffiffiffiffiffiffiffiffiffiffiffiffiffiffiffiffiffiffiffiffiffiffiffiffiffiffiffiffiffiffiffiffiffiffiffiffiffiffiffiffiffiðug � upÞ2 þ ðvg � vpÞ2
qðA4Þ
Simulation
In order to simulate the radar signal received from anexplosion, system (Eq. A3) is numerically integrated(with a time step of 0.1 s) by using a fourth-order Runge-Kutta method. At t=0, we suppose that a set of N sphericalparticles with different diameters are launched at theorigin of coordinates. At each time step, for each particleand ejection angle (�10<a <10�; 2� steps), the coordinatesand the velocity of all particles are determined from(Eq. A3) where CD is deduced from the Reynolds numbercalculation according to the method suggested by Chow(1979).
For all the particles located inside the considered rangegate at time t (Fig. 15), our model calculates the mean(V+mean) and the maximum (V+max) of the positive radialvelocities. Assuming that all particles have the samedielectric constant, the P+ parameter is calculated using:
Pþ ¼X
j
f ðjjÞD6
j ðA5Þ
where f ðjjÞ is the distribution function of Voldoradantenna gain.
Fig. 15 Geometry used for the model. R Radar location, M particlelocation, q antenna elevation angle. Radial velocity is the compo-nent of the particle velocity along direction RM (elevation angle f)
455

Acknowledgements We thank S. Vergniolle and an anonymousreferee for their thoughtful comments, and A. Woods for handlingthe paper. This work was supported by the European Community(contract ENV4-CT96–0288), CNRS (INSU-PNRN) and CRV(Coordination de la Recherche Volcanologique). Facilities for radarsoundings at Mt. Etna were kindly provided by Istituto Inter-nazionale di Vulcanologia (Catania) and Parco dell’Etna (Nicolosi).F.D. was supported by the French Soci�t� de Secours des Amis desSciences. We gratefully acknowledge helpful contributions from T.Caltabiano, O. Coutant and V. Pinel.
References
Blackburn EA, Wilson L, Sparks RS J (1976) Mechanisms anddynamics of Strombolian activity. J Geol Soc Lond 132:429–440
Chouet B, Hamisevicz N, Mc Getchin TR (1974) Photoballistics ofvolcanic jet activity at Stromboli, Italy. J Geophys Res 79:4961–4976
Chouet B, Saccorotti G, Dawson PB, Martini M, Scarpa R, De LucaG, Milana G, Cattaneo M (1999) Broadband measurements ofthe sources of explosions at Stromboli Volcano, Italy. GeophysRes Lett 26:1937–1940
Chow CY (1979) An introduction to computational fluid mechan-ics. Wiley, New York
Cosentino M, Lombardo G, Privitera E (1989) A model for internaldynamical processes on Mt. Etna. Geophys J R Astron Soc97(3):367–379
Della Schiava M (1995) Effetto del gas sull’origine del campod’onda sismico registrato a Stromboli. Tesi di Laurea, Dip. diScienze della Terra, Universit� di Firenze
Dubosclard G, Cordesses R, Allard P, Hervier C, Coltelli M,Kornprobst J (1999) First testing of a volcano Doppler radar(Voldorad) at Mount Etna, Italy. Geophys Res Lett 26:3389–3392
Ereditato D, Luongo G (1994) Volcanic tremor wave field duringquiescent and eruptive activity at Mt. Etna (Sicily) J VolcanolGeotherm Res 61:239–251
Falsaperla S, Privitera E, Spampinato S, Cardaci C (1994) Seismicactivity and volcanic tremor related to the December 14, 1991Mt. Etna eruption. Acta Vulcanol 4:63–73
Gresta S, Montalto A, Patane G (1991) Volcanic tremor at MountEtna (January 1984-March 1985): its relationship to theeruptive activity and modelling of the summit feeding system.Bull Volcanol 53:309–320
GVN (1998) Global Volcanism Network, Bulletin of the GlobalVolcanism Program of the Smithsonian Institution, WashingtonDC, 23(12):10–12
Hort M, Seyfried R (1998) Volcanic eruption velocities measuredwith a micro radar. Geophys Res Lett 25:113–116
INGV scientific staff (2001) Multidisciplinary approach yieldsinsight into Mt. Etna eruption. EOS Trans Am Geophys Union82 (52):653–656
Jaupart C, Vergniolle S (1988) Laboratory models of Hawaiian andStrombolian eruptions. Nature 331:58–60
La Delfa S, Patan� G, Clocchiatti R, Joron JL, Tanguy JL (2001)Activity of Mount Etna preceding the February 1999 fissureeruption: inferred mechanism from seismological and geo-chemical data. J Volcanol Geotherm Res 105:121–139
Laigle M, Hirn A (1999) Explosion-seismic tomography of amagmatic body beneath Mount Etna; volatile discharge andtectonic control of volcanism. Geophys Res Lett 26:2665–2668
Laigle M, Hirn A, Sapin M, Lepine J-C, Diaz J, Gallart J, NicolichR (2000) Mount Etna dense array local earthquake P and Stomography and implications for volcanic plumbing. J GeophysRes 105:21633–21646
Mauk, JM (1983) Utilization of seismically recorded infrasonic-acoustic signals to monitor volcanic explosions: the El Chichonsequence 1982- a case study. J Geophys Res 88:10385–10401
McGetchin TR, Settle M, Chouet BA (1974) Cinder cone growthmodeled after Northeast crater, Mount Etna, Sicily. J GeophysRes 79:3257–3272
Montalto A, Distefano G, Patane G (1992) Seismic patternspreceding and accompanying the January 15, 1990 eruptiveparoxysm on Mt. Etna (Italy). J Volcanol Geotherm Res51:133–143
Montalto A, Longo V, Patane G (1995) Echo-resonance andhydraulic perturbations in magma cavities: application to thevolcanic tremor of Etna (Italy) in relation to its eruptiveactivity. Bull Volcanol 57:219–228
Neuberg J, Luckett R, Ripepe M, Braun T (1994) Highlights from aseismic broadband array on Stromboli volcano. Geophys ResLett 21(9):749–752
Ripepe M (1996) Evidence for gas influence on volcanic seismicsignals recorded at Stromboli. J Volcanol Geotherm Res70:221–233
Ripepe M, Ciliberto S, Della Schiava M (2001) Time constraintsfor modeling source dynamics of volcanic explosions atStromboli. J Geophys Res 106:8713–8727
Ripepe M, Coltelli M, Privitera E, Gresta S, Moretti M, Piccinini D(2001) Seismic and infrasonic evidences for an impulsivesource of the shallow volcanic tremor at Mt. Etna, Italy.Geophys Res Lett 28(6):1071–1074
Ripepe M, Gordeev E (1999) Gas bubble dynamics model forshallow volcanic tremor at Stromboli. J Geophys Res104:10639–110654
Ripepe M, Poggi P, Braun T, Gordeev E (1996) Infrasonic wavesand volcanic tremor at Stromboli. Geophys Res Lett 23(2):381–384
Ripepe M, Rosi M, Saccorotti G (1993) Image processing ofexplosive activity at Stromboli. J Volcanol Geotherm Res54:335–351
Sauvageot H (1992) Radar meteorology, Artech House, Boston, pp1–366
Schick R, Riuscetti M (1973) An analysis of volcanic tremors atsouth Italian volcanoes. Z Geophys 39:247–262
Seyfried R, Hort M (1999) Continuous monitoring of volcaniceruption dynamics: a review of various techniques and newresults from a frequency-modulated radar Doppler system. BullVolcanol 60:627–639
Sparks RSJ, Wilson L (1982) Explosive volcanic eruptions V.Observations of plume dynamics during the 1979 Soufriereeruption, St Vincent. Geophys J R Astron Soc 69:551–570
Steinberg GS, Babenko JI (1978) Gas velocity and densitydetermination by filming gas discharges. J Volcanol GeothermRes 3:89–98
Vergniolle S (1998) Modeling two-phase flow in a volcano. 13thAust Fluid Mech Conf, Monash University, Melbourne, Aus-tralia, pp 647–650
Vergniolle S (2001) Listening to Stromboli volcano as a tool into itsvolcanic conduit. EOS Trans, AGU fall meeting, pp 1399–1400
Vergniolle S, Brandeis G (1996) Strombolian explosions, part 1: alarge bubble breaking at the surface of a lava column as asource of sound. J Geophys Res 101:20433–20447
Vergniolle S, Brandeis G, Mareschal JC (1996) Strombolianexplosions, part 2: Eruption dynamics determined from acous-tic measurements. J Geophys Res 101:20449–20466
Vergniolle S, Jaupart C (1986) Separated two-phase flow andbasaltic eruptions. J Geophys Res 91:12842–12860
Vergniolle S, Mangan M (2000) Hawaiian and Strombolianeruptions. In: Sigurdsson H et al (eds) Encyclopedia ofvolcanoes. pp 447–461
Wallis GB (1969) One-dimensional two-phase flows. McGraw-Hill, New York, pp 1–408
Weill A, Brandeis G, Vergniolle S, Baudin F, Bilbille J, F�vre JF,Piron B, Hill X (1992) Acoustic sounder measurements of thevertical velocity of volcanic jets at Stromboli volcano. GeophysRes Lett 19:2357–2360
456
Copyright © 2022 FDOKUMEN