All-sky assimilation of SSMIS humidity sounding channels ...
28
EUMETSAT/ECMWF Fellowship Programme Research Report No. 38 All-sky assimilation of SSMIS humidity sounding channels over land within the ECMWF system Fabrizio Baordo and Alan J. Geer July 2015 To be submitted to Quarterly Journal of the Royal Meteorological Society
-
Upload
khangminh22 -
Category
Documents
-
view
0 -
download
0
Transcript of All-sky assimilation of SSMIS humidity sounding channels ...

EUMETSAT/ECMWF Fellowship ProgrammeResearch Report No. 38
All-sky assimilation of SSMIS humiditysounding channels over land within theECMWF system
Fabrizio Baordo and Alan J. Geer
July 2015
To be submitted to Quarterly Journal of the Royal Meteorological Society
Series: EUMETSAT/ECMWF Fellowship Programme Research Reports
A full list of ECMWF Publications can be found on our web site under:http://www.ecmwf.int/en/research/publications
Contact: [email protected]
c©Copyright 2015
European Centre for Medium Range Weather ForecastsShinfield Park, Reading, RG2 9AX, England
Literary and scientific copyrights belong to ECMWF and are reserved in all countries. This publication is notto be reprinted or translated in whole or in part without the written permission of the Director-General. Appro-priate non-commercial use will normally be granted under the condition that reference is made to ECMWF.
The information within this publication is given in good faith and considered to be true, but ECMWF acceptsno liability for error, omission and for loss or damage arising from its use.

All-sky assimilation of SSMIS humidity sounding channels over land
Abstract
The extension of all-sky assimilation of SSMIS humidity sounding channels to land surfaces is investigatedin this paper. A ‘symmetric’ error model, which adaptively determines the size of observation errors, canbe formulated using the scattering index as a predictor to identify cloudy and precipitating regions overland. This assigns larger observation errors in those situations more difficult to model because of radiativetransfer and ‘mislocation’ errors. The use of an instantaneous emissivity retrieval from SSMIS surface-sensitive channels is also explored. In clear-sky scenes, emissivity retrievals appear better at capturing dailydifferences in surface conditions, compared to emissivity atlas values. In the presence of clouds, retrievalshave different behaviour. In the lower microwave frequencies (less than 50 GHz), emissivity estimatesappear nearly as reliable as those in clear-skies, but at higher frequencies, as the magnitude of scatteringincreases, so does the error in the retrieval and the resultant emissivity estimate can be unphysically low orhigh. However, the retrieval still appears feasible at high frequencies in light cloud situations; the numberof retrievals discarded due to these kind of problems is around 10%. In these cases, an estimate froman emissivity atlas can be substituted instead. Assimilation experiments are performed that demonstratethe feasibility of assimilating SSMIS 183 GHz channels over land in all-sky conditions: the assimilationsystem is not degraded and the improvements on analysis and forecast scores are about the same as thosewhich are obtained by the equivalent clear-sky approach. The developments described in this study werean essential first step to create framework to allow the all-sky assimilation over land of other microwavehumidity sounders: this started operationally at ECMWF in 2015, covering both SSMIS and four MHS(Microwave Humidity Sounder) instruments.
1 Introduction
The assimilation of microwave observations in numerical weather prediction (NWP) systems is still more inten-sive over ocean than over land surfaces. Over ocean, fast and accurate emissivity models have been developedfor NWP (e.g. Liu et al., 2011; Kazumori and English, 2014) that allow the assimilation of channels withstrong surface-sensitivity. In contrast, the microwave signal emerging from land surfaces not only depends onfrequency, incidence angle and polarisation, but is also affected by the large variability in surface types (e.gdeserts, vegetation, high orography) and conditions (e.g. roughness, moisture, snow, ice). For this reason, indata assimilation, the high complexity of modelling the interaction between all these surface parameters andthe microwave radiation has generally restricted the use of observations to temperature and humidity soundingchannels which receive a weak contribution from the surface. However, an estimate of surface emissivity is stillrequired to assimilate such data. Increasingly in NWP, the approach is to make retrievals of land emissivitiesdirectly from satellite measurements (e.g. Karbou et al., 2005; Prigent et al., 2005; Ruston et al., 2008 amongmany others). The general assumption is that for most surface types, land emissivity is sufficiently invariantwith frequency that emissivity retrieved from surface-sensitive (“window”) channels can be used as a reason-able approximation for sounding channels. This approach has also been implemented for some years withinthe operational ECMWF system to assimilate clear-sky observations in temperature and humidity soundingchannels (Krzeminski et al., 2009) from AMSU-A (Advanced Microwave Sounding Sounding Unit-A) andMHS (Microwave Humidity Sounder): emissivities retrieved from AMSU-A channel 3 (50.3 GHz) are givento the temperature channels (50-60 GHz), whilst retrievals from MHS channel 1 (89 GHz) are assigned to thehumidity channels (183 GHz). Karbou et al., 2010a,b investigated the use of land emissivity retrievals withinthe Meteo France assimilation system, showing that it helps to reduce bias and standard deviation of first-guess(FG) departures (e.g. observation minus forecast differences) and increases the number of assimilated obser-vations from AMSU-A and AMSU-B surface-sensitive and sounding channels. Improved correlations betweenobservations and simulations were found over snow-covered areas, and analyses and forecasts over tropicalregions appeared to be improved.
Research Report No. 38 1
All-sky assimilation of SSMIS humidity sounding channels over land
A further increase in the use of sounding observations over land can be achieved by extending the assimilationto clear, cloudy or precipitating scenes (the so called “all-sky” approach). However, at microwave frequenciesin situations where the atmospheric scattering is most important (such as over land and in temperature andhumidity sounding channels), the inaccuracy of scattering radiative transfer models has been a problem. (e.g.Geer et al., 2012; Baordo et al., 2012). However, Geer and Baordo (2014a) were able to globally improvingthe accuracy of the microwave scattering signal across all frequencies from 10 GHz to 183 GHz in all weatherconditions by modelling snow as a non-spherical hydrometeor and uses optical properties from the Liu (2008)discrete dipole approximation for a sector snowflake. These developments allowed ECMWF to start operationalall-sky assimilation of SSMIS (Special Sensor Microwave Imager Sounder) humidity sounding channels overocean (Geer, 2013). This brings benefits to forecast quality; the all-sky assimilation of the SSMIS humiditychannels brings roughly twice the benefit of just assimilating the observations in clear skies. The benefitcomes through the 4D-Var assimilation, which can infer dynamical initial conditions from humidity, cloud andprecipitation features in the observations. This has also been demonstrated in the assimilation of clear-skyinfrared humidity observations by Peubey and McNally (2009). The benefit of SSMIS humidity channels isgreatest in the southern midlatitudes, where the storm-tracks provide ideal conditions for model-tracing. Thegood results over ocean strongly encouraged feasibility studies to extend the assimilation of SSMIS humiditysounding channels to land-surfaces.
Our purpose in this paper is to document the technical and scientific changes which were needed to implementthe all-sky framework over land, summarising and extending the initial work carried out by Baordo et al., 2012,2013. The over land framework has been developed and evaluated through the use of SSMIS observations,but it can be generalised for the assimilation of other humidity sounder sensors. A general overview of theall-sky assimilation at ECMWF is provided in Sect. 2. Methodology to implement the over land framework isdescribed in Sect. 3. Results of assimilation experiments are provided in Sect. 4.
2 General overview of the all-sky assimilation
2.1 Radiative transfer model
ECMWF has been operationally assimilating microwave imager observations in all-sky conditions for over fiveyears (Bauer et al., 2010; Geer et al., 2010; Geer and Bauer, 2011). The observation operator designed forassimilating microwave radiances in clear, cloudy and precipitating scenes is RTTOV-SCATT (Bauer et al.,2006), which uses the delta-Eddington approximation (Joseph et al., 1976) to solve the radiative transfer equa-tion including scattering. The bulk optical properties for cloud water, cloud ice and rain are pre-tabulated foreach hydrometeor type as a function of temperature, frequency and water content. Cloud water, cloud ice andrain are modelled as spherical particles using Mie theory and a constant density: the first two hydrometeors usea gamma size distribution (e.g. Petty and Huang 2011), while a Marshall and Palmer (1948) size distribution isused for rain. Since the ECMWF operational cycle 40r1, snow has been modelled as a non-spherical hydrom-eteor which uses optical properties calculated from the discrete dipole approximation for a sector snowflake(Liu, 2008). To simulate bulk optical properties for the Liu sector shape, the tropical version of the Field (2007)size distribution is used.
Ocean surface emissivity is computed by version 5 of FASTEM (Liu et al., 2011; Bormann et al., 2012). Overland, as will be documented in Sect. 3, we adopt same strategy as implemented in previous studies (e.g. Kar-bou et al., 2010a,b; Krzeminski et al., 2009): we firstly retrieve land emissivities from satellite observationsin surface-sensitive channels and, secondly, assuming that the spectral variability of emissivity is minimal, wereassign these estimates to the closest channel higher in frequency in order to perform radiative transfer calcu-
2 Research Report No. 38

All-sky assimilation of SSMIS humidity sounding channels over land
lations (for instance, emissivities retrieved in the SSMIS 91 GHz channel are applied to the humidity soundingchannels). If the retrieval fails, we use emissivities provided by the TELSEM (Tool to Estimate Land SurfaceEmissivities at Microwave) atlas, which is based on a pre-calculated monthly-mean emissivity climatologyderived from 10 years of SSMI observations (Aires et al., 2011). TELSEM atlas values are available withinRTTOV and they provide emissivity estimates for all land surfaces between 19 and 100 GHz and for all anglesand linear polarisations.
The observation operator in the all-sky framework selects the nearest model profile to the observation (in timeand space) and then runs RTTOV-SCATT. The hydrometeor inputs to RTTOV-SCATT are the vertical profilesof cloud water, cloud ice, total rain and total snow, plus the effective cloud fraction (C), which controls thecomputation of the all-sky simulated observation (Tall−sky) which is a weighted average of brightness temper-ature from two independent sub-columns, one clear (Tclr) and one cloudy (Tcld). The effective cloud fractionprovides the weight given to the two sub-columns:
Tall−sky = (1−C)Tclr +CTcld . (1)
Over ocean surfaces, C is computed as a hydrometeor-weighted average of cloud, convective and large-scaleprecipitation fractions across all vertical levels, providing an approximate but computationally efficient solutionto account for the effects of sub-grid variability in cloud and precipitation (Geer et al., 2009a,b, the ‘Cav’approach).
Over land surfaces, C is computed as the largest cloud fraction in the model profile (the ‘Cmax’ approach.) Thisis essentially a tuning measure to compensate for a relative lack of deep convection over land in the model, ascompared to over the ocean. The choice of the Liu sector snowflake to model scattering from snow hydromete-ors was made based on getting the best fit between modelled and observed brightness temperatures over ocean(Geer and Baordo, 2014a). It was not possible to find one particle that gave good results simultaneously overland and ocean. Instead of having different particle models for land and ocean, technically it was easier to varythe cloud fraction. With this in place, the accuracy of the cloud and precipitation radiative transfer model is asgood over land as over ocean.
2.2 Observations
In order to investigate the all-sky assimilation over land of 183 GHz humidity sounding channels, this studyuses observations from SSMIS. In line with the ECMWF operational usage, only Defence MeteorologicalSatellite Program satellite (DMSP) F-17 has been used. The SSMIS sensor (Kunkee et al., 2008) representsan important advancement over its predecessor, SSMI, as it combines the SSMI imaging capabilities with theprofiling capabilities of microwave sounders. SSMIS allows microwave measurements at frequencies rangingfrom 19 to 183 GHz over a swath width of 1707 km. SSMIS channels can be grouped as follows: 13 channels(channels 1-7 and 19-24) located near the oxygen absorption band (50-60 GHz) which allow atmospherictemperature sensing from about 80 km down to the earth surface; 3 humidity sounding channels (channels9-11) close to the strong 183 GHz water vapour line; 7 SSMI-like imaging channels (channels 12-18), withthe 91.65 GHz replacing the SSMI 85.5 GHz channels and the addition of 1 channel at 150 GHz (channel 8).Table 1 summaries the general characteristics of SSMIS channels.
The SSMIS F-17 data are pre-processed along the lines of Bell et al. (2008), who described the necessary correc-tions for F-16 observations. However, instrument improvements implemented for F-17 make the pre-processingslightly different: corrections are made for scan non-uniformity and reflector emission (based directly on anaccurate thermistor-measured reflector temperature) but not for warm load intrusions, which are infrequent. Inthe all-sky framework, SSMIS observations are also averaged (or ‘superobbed’) in boxes of approximately 80
Research Report No. 38 3

All-sky assimilation of SSMIS humidity sounding channels over land
Table 1: Properties of SSMIS channels.Channel/NameFrequency
(GHz)PolarisationSensitivity
1 / 50H 50.3 H Surface2 / - 52.8 H Temperature3 / - 53.596 H Temperature4 / - 54.4 H Temperature5 / - 55.5 H Temperature6 / - 57.29 RC Temperature7 / - 59.4 RC Temperature8 / 150H 150.0 H Humidity9 / 183±7 183.31±6.6 H Humidity10 / 183±3 183.31±3.0 H Humidity11 / 183±1 183.31±1.0 H Humidity12 / 19H 19.35 H Surface13 / 19V 19.35 V Surface14 / - 22.235 V Surface15 / 37H 37.0 H Surface16 / 37V 37.0 V Surface17 / 91V 91.65 V Surface18 / 91H 91.65 H Surface19 / - 63.28 ± 0.285 RC Temperature20 / - ν = 60.79±
0.358RC Temperature
21 / - ν ± 0.002 RC Temperature22 / - ν ± 0.005 RC Temperature23 / - ν ± 0.016 RC Temperature24 / - ν ± 0.050 RC Temperature
km by 80 km in order to make the horizontal scales of observed cloud and precipitation more similar to theireffective resolution in the model (Geer and Bauer, 2010).
3 All-sky framework over land
3.1 Observation error modelling
In the all-sky assimilation, the accuracy of the radiative transfer calculations in cloud and precipitating areas isnot the only parameter to deal with. Forecast models are also affected by ‘mislocation’ errors which are due todifficulties in predicting cloud and precipitation in exactly the right place with the right intensity (e.g. Fabryand Sun, 2010). Radiative transfer error and ‘mislocation’ error lead to a highly non-Gaussian behaviour offirst-guess departures, independent of the surface type (land or ocean). Geer and Bauer (2011) showed thatthis ‘representivity’ problem can be resolved by means of a symmetric error model which can provide a robustthreshold quality-control check and also determine the size of observation errors for the assimilation. Formicrowave imager observations over ocean, the observation error is a linear function of the symmetric cloudamount given by the average of observed and simulated polarisation difference at 37 GHz.
4 Research Report No. 38
All-sky assimilation of SSMIS humidity sounding channels over land
−10 0 10 20 30Observed SI [91H − 150H]
0
1
2
3
4
Mea
n [k
g/m
2 ]
−10 0 10 20 30Simulated SI [91H − 150H]
0
1
2
3
4
Mea
n [k
g/m
2 ]
LHC+IHC
IHC
a
b
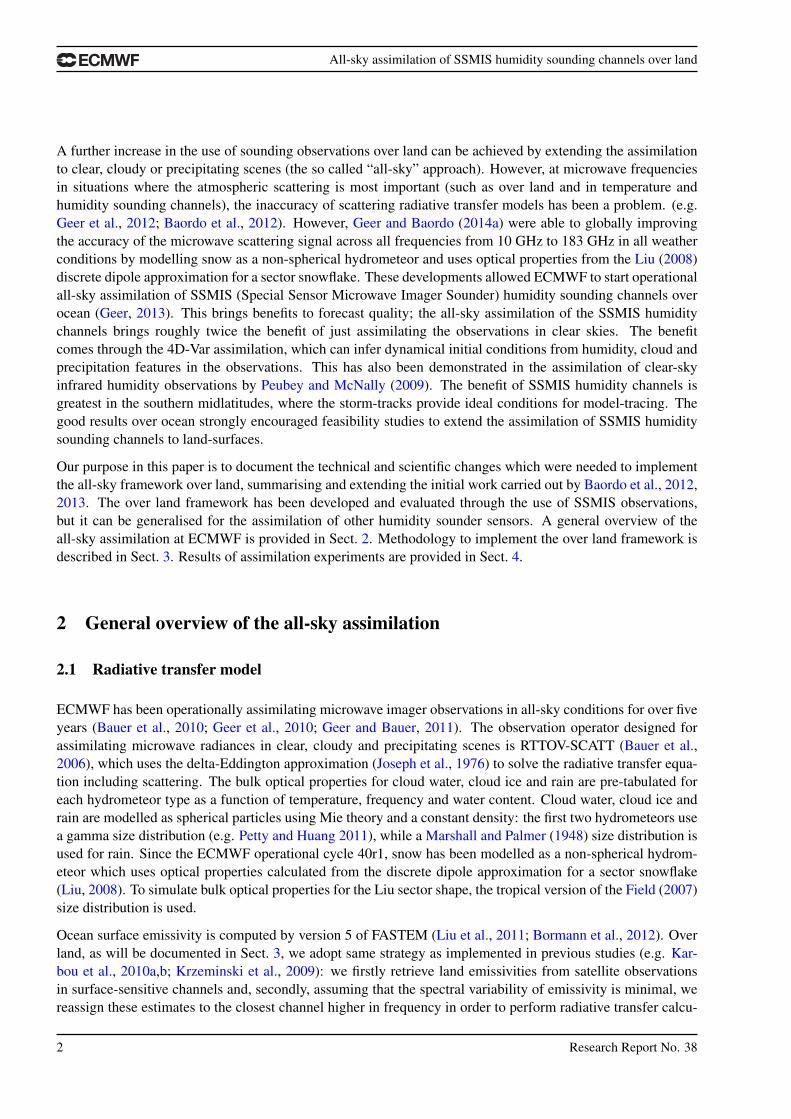
Figure 1: Mean of total (solid line) and ice (dashed-dotted line) hydrometeor content (kg m−2) binned as a function of theobserved (a) and the simulated (b) scattering index. The liquid hydrometeor content (LHC) is given by the sum of modelFG cloud water and rain, while the ice hydrometeor content (IHC) takes into account cloud ice and snow. Sample ofSSMIS data is for the month of June 2013 considering observations over land restricted to latitudes equatorward of 60◦.Bin size is 0.5 K.
Over land, the 37 GHz polarisation difference cannot be used as a cloud predictor for the symmetric errormodel, as it relies on the highly polarised nature of ocean surface emission. Instead, the greatest atmosphericsignal from hydrometeors comes in the higher frequencies from snow, so the scattering index (SI, e.g. Bennartzet al., 2002; Bennartz and Bauer, 2003), is a good parameter to identify precipitation and convective areas. ASI given by the difference between SSMIS channel 18 (91H) and channel 8 (150H) was found to give goodperformance as a symmetric predictor for the observation error model. (Baordo et al., 2012).
To check the capability of the SI to identify clear-sky areas as well as regions affected by clouds and precip-itation, we can compare the modelled SI to the total hydrometeor content in the model, given by the sum ofthe model FG cloud water, cloud ice, rain and snow. We can also distinguish between the liquid hydrometeorcontent (LHC), considering only cloud water and rain, and the ice hydrometeor content (IHC), taking into ac-count only cloud ice and snow. Fig. 1b shows that the model’s mean hydrometeor content is approximately alinear function of the simulated SI. Cloud-free regions (zero hydrometeor content) are characterised by SI lessthan 0 K, while for increasing values of SI, the hydrometeor content increases as well, representing the increas-ing influence of scattering as the modelled cloud and precipitation amount increases. The IHC and the totalhydrometeor content are relatively similar, suggesting that the LHC adds little information to the main signal,which comes from cloud ice and snow and appears to be well identified by the SI. There is not such an obviouslink between the observed SI and the IHC (Fig. 1a). This is the consequence of ‘mislocation’ errors. There aresome cases where the observation is cloudy (higher scattering index), but there is no corresponding cloud inthe model, counterbalanced by other cases where the observation is cloud-free (lower scattering index), but themodel has cloud.
Research Report No. 38 5

All-sky assimilation of SSMIS humidity sounding channels over land
−10 0 10 20 30SIsym [91H − 150H]
0
10
20
30
40
50
60
Err
or [K
]
Figure 2: Error model for SSMIS channel 9 (183±7 GHz), showing how the standard deviations of FG departures binnedas a function of the symmetric scattering index (solid line) are modelled by a linear fit (dotted line). FG departures arefor the month of June 2013 considering SSMIS observations over land restricted to latitudes equatorward of 60◦. Bin sizeis 0.5 K.
We can now derive the observation error formulation from the symmetric scattering index SIsym, which isthe mean of the observed and the simulated SI. Fig. 2 gives an example of how the standard deviations ofSSMIS channel 9 FG departures have been binned as a function of SIsym; results for SSMIS channel 10 and11 are similar in shape if not magnitude (not shown). For low scattering indexes, i.e. the clear-sky regime,the standard deviation is relatively constant at around 3 K. As the symmetric mean SI increases, so does thestandard deviation. This increase is reasonably well-modelled by a straight line. However, beyond a certainthreshold the errors seem to saturate. This behaviour is modelled by a piece-wise linear fit that is estimatedgraphically and shown on the figure. For this channel the model has a minimum clear-sky standard deviationEmin of 3 K and a maximum Emax of 57 K in strongly scattering situations. The start and end points of theup-slope are labelled SIclr and SIcld , with standard deviation of FG departures Terr being predicted as follows:
Terr = Emin ∈ SIsym ≤ SIclr; (2)
Terr = Emax +(Emax−Emin)SIsym−SIclr
SIcld−SIclr
∈ SIclr < SIsym < SIcld ;(3)
Terr = Emax ∈ SIsym ≥ SIcld . (4)
The standard deviation of the FG departures is a combination of background error and observation error, so toconvert Terr to a predicted observation error, we subtract (in quadrature) an estimated background error. This is1 K for all channels, converting a clear sky FG departure standard deviation of 3 K into an observation error of2.8 K. This is a little larger than the constant observation error of 2 K which has been used to assimilate MHShumidity sounding observations over both land and ocean in clear-sky. The slightly larger observation errorreflects the standard deviations in situations where SI is around 0 K; it is a cautious approach to assimilatingall-sky SSMIS data over land, even when nominally in clear skies. The effectiveness of the observation error isdiscussed later in Sect. 4.2.
6 Research Report No. 38

All-sky assimilation of SSMIS humidity sounding channels over land
3.2 Surface emissivity retrieval
For a non scattering plane-parallel atmosphere, assuming a flat and specular surface, for a given zenith (θ ) angleand frequency (ν), the brightness temperature (Tb) observed by a satellite sensor can be expressed as follows:
Tb = ε(θ ,ν)TsΓ(θ ,ν)+(1− ε(θ ,ν))T↓(θ ,ν)Γ(θ ,ν)+T ↑(θ ,ν), (5)
where ε(θ ,ν) represent the surface emissivity at observation zenith angle θ and frequency ν ; Ts, T ↓(θ ,ν) and T ↑(θ ,ν)are, respectively, the surface skin temperature, the atmospheric down-welling radiation at the surface and up-welling radiation at the top of the atmosphere; Γ(θ ,ν) is the net atmospheric transmissivity. The emissivity canbe retrieved from equation 5 (for simplicity we omit the dependency from zenith angle and frequency):
ε =Tb− (T ↑+T ↓Γ)
(Ts−T ↓)Γ. (6)
Eq. 6 represents the scheme that has been commonly used in literature to retrieve emissivity directly fromsatellite measurements for those channels which receive a strong contribution from the surface (e.g. Karbouet al., 2005; Prigent et al., 2005). In the case of NWP systems, the atmospheric contribution to the observedbrightness temperature (T ↓, T ↑ and Γ) is computed within the radiative transfer model using the atmosphericprofiles from short-range forecasts as input. The surface skin temperature, like emissivity, is also affected bythe land surface variability (e.g. soil-moisture, roughness, wetness, snow) so that it is a difficult parameter toestimate accurately (English, 2008). Skin temperature can be also retrieved from satellite measurements (e.g.Karbou et al., 2010a) and used within NWP systems. In our study, we did not investigate the impact of usingdifferent sources of skin temperature (e.g. retrieved or monthly-mean based on climatology), but following theexisting clear-sky approach at ECMWF, we relied on the estimate provided by the short-range forecasts.
In order to be consistent with the way the observations are used in the all-sky assimilation, we take account oftwo independent columns, one clear and one cloudy, which, weighted by the effective cloud fraction C, givethe simulated brightness temperature (Eq. 1). Assuming that skin temperature and emissivity are the same ineach sub-column, from Eq. 1 and Eq. 5, we have:
ε =Tb− (1−C)(T ↑clr +T ↓clrΓclr)−C(T ↑cld +T ↓cldΓcld)
(1−C)(Ts−T ↓clr)Γclr +C(Ts−T ↓cld)Γcld. (7)
The atmospheric terms are simulated for the clear and cloudy sub-column (T ↑clr, T ↓clr, Γclr and T ↑cld , T ↓cld , Γcld).When the contribution of the cloudy column is zero (C = 0), the emissivity computation is reduced to theemissivity scheme of Eq. 6.
Independently of the way the emissivity retrieval is done (Eq. 7 or Eq. 6) it is not free from error. The larger theerror in model skin temperature or atmospheric profile, the bigger the uncertainty on the emissivity estimate.The assumption of specular surface can also generate errors in those cases where the validity of such approxi-mation might be no longer valid (e.g. in presence of very rough terrain and surface scattering). Finally, wherethere is strong atmospheric scattering or high liquid water content, the increasing opacity of the atmosphere canamplify the magnitude of the error, to the point where the surface becomes invisible and an emissivity retrieval
Research Report No. 38 7

All-sky assimilation of SSMIS humidity sounding channels over land
is clearly impossible. Because the all-sky assimilation does not implement a cloud screening and observedbrightness temperatures can be from clear, cloudy or precipitating scenes, this can affect our retrievals; latersections will examine the errors caused by cloud and precipitation and ways of dealing with them. Essentially,we default to an emissivity atlas value where the emissivity retrieval appears to be erroneous.
3.3 Emissivity retrieval assessment
The technical implementation of the emissivity retrieval in the all-sky framework was first evaluated by Baordoet al. (2012) but here we will examine the impact of cloud in more detail and look at the benefit of usinginstantaneous emissivity estimates rather than values provided by climatology. This is organised as follows: InSect. 3.3.1, we look at emissivity retrievals obtained using cloud free observations. Secondly, in Sect. 3.3.2, weexamine the impact of cloud on the retrievals. Finally, in Sect. 3.3.3, we describe the the completed scheme forgenerating emissivities to be used for the 183 GHz channels.
To compare the clear-sky and all-sky emissivity retrievals outlined in the previous section, we ran two assim-ilation experiments (further details are provided in section 4). Both process SSMIS observations through theall-sky path of the ECMWF system but the first experiment implements Eq. 7, the second, forcing C = 0, re-trieves emissivity through Eq. 6. Even though the two experiments have slightly different backgrounds (e.g.different skin temperature and atmospheric profile coming from the natural chaotic variability that occurs whentwo non-identical assimilation experiments are performed) it is still reasonable to compare the two calculationsof surface emissivity as they use identical SSMIS observations.
Retrievals are performed globally but two screening criteria are applied. First, retrievals are restricted to lat-itudes equatorward of 60◦, particularly to avoid high-latitude areas where, during winter, snow and ice covermight introduce additional errors in the emissivity retrieval. Second, SSMIS observations are rejected in thoselocations where the model grid-point contains a mixture of water and land. Retrievals are computed only if themodel land-sea-mask is greater than 0.95.
It is worth mentioning that in this study, before the emissivity computation (Eq. 6 or Eq. 7), bias corrections areapplied to the satellite observations. In the ECMWF system, for microwave instruments, biases are inferred asa function of predictors including scan angle, the surface wind speed and the layer thickness. Bias coefficientsare derived within the analysis system using variational bias correction (Auligne et al., 2007). In the followingsections, we also refer to Eq. 6 and Eq. 7, respectively, as the clear-sky (εcs) and all-sky (εas) emissivity retrieval.
3.3.1 Retrieval in cloud free scenes
As an example of clear-sky retrievals we chose a bare soil point in North Africa. The location is in Algeria(28.42◦N;4.50◦E) and it was observed by 44 SSMIS overpasses for the period ranging from 1 (5 UTC) to 30(17 UTC) June 2013, shown in Fig. 3. The observations are most likely free from clouds and precipitationduring the entire month: the SSMIS observed and simulated SI are always less than 0; also images fromSEVIRI show no cloud systems over the selected location. The modelled atmospheric transmittance is alwayshigh (panel d) so the retrievals should be reliable. The retrieved emissivities are shown for channels 19Hand 91H, alongside the value from the TELSEM atlas (panels a and b). Because the model cloud fraction isalways nearly zero at this location, there is little difference between retrievals from the all-sky or the clear-sky approach. Retrieved emissivity is similar to the atlas but shows variability from one overpass to the next.Particularly at 19H it appears to be anticorrelated with the diurnal variability of skin temperature (correlationcoefficient is -0.90). Skin temperature varies around 15 K between the times of the early evening and earlymorning orbits (panel c). In dry desert soils the microwave emission may come from some distance below the
8 Research Report No. 38

All-sky assimilation of SSMIS humidity sounding channels over land
19H
0 10 20 30 40Number of SSMIS overpass
0.80
0.81
0.82
0.83
0.84
0.85
0.86
Em
issi
vity
a
91H
0 10 20 30 40Number of SSMIS overpass
0.77
0.78
0.79
0.80
0.81
0.82
0.83
Em
issi
vity
b
0 10 20 30 40Number of SSMIS overpass
290
295
300
305
310
315
320
Tem
pera
ture
[K]
c
0 10 20 30 40Number of SSMIS overpass
0.70
0.75
0.80
0.85
0.90
0.95
Tra
nsm
ittan
ce
d
19H91H
Figure 3: All-sky emissivity retrievals derived by SSMIS measurements in the Northern of Africa (28.42◦N;4.50◦E) from 1to 30 June 2013 (for a total of 44 overpasses): a) for 19 GHz horizontal polarisation b) for 91 GHz horizontal polarisation.The black thick line represents the TELSEM atlas value. To complete the figure, for each SSMIS overpass: c) model skintemperature; d) model transmittance at 19 and 91 GHz.
Research Report No. 38 9

All-sky assimilation of SSMIS humidity sounding channels over land
Table 2: RMSE of differences between simulated and SSMIS observed brightness temperatures in the Northern of Africa(28.42◦N;4.50◦E) from 1 to 30 June 2013 (for a total of 44 overpasses). T bas and T bcs indicate the simulations computedrespectively using εas and εcs.
RMSE [Tbas-Tb] RMSE [Tbcs-Tb]183±7 2.836 3.071183±3 1.925 1.922183±1 2.086 2.157
surface. The anticorrelation is consistent with an excessively strong diurnal cycle of skin temperature in themodel, perhaps because the diurnal cycle of sub-soil temperature is damped compared to the skin temperature(the forecast model skin temperature is a key part of radiative energy transfer at the surface, so it is morerepresentative of infrared and visible wavelengths where it is a genuine ‘skin’ temperature). Hence one benefitof doing an emissivity retrieval, rather than using an atlas, is that it reduces the impact of errors in the use ofmodel skin temperature, which is particularly evident in desert regions. Although it would be nice to estimate askin temperature simultaneously with the emissivity, that is not feasible (see Eq. 6). As a general consideration,the variability of our retrievals respect to TELSEM estimates might also be partially driven by the superobbedobservations: the exact location of raw SSMIS observations composing the superob is going to vary from day today and so we might see a slightly different bit of surface each time with a slightly different emissivity. Further,the 91H emissivity retrievals in Fig. 3 are lower than the equivalent atlas value. This is observed more generally,and might be explained considering that TELSEM estimates were derived from SSMI data at 85.5 GHz, andthere may be some change in the emissivity with frequency. So, even in a desert environment where surfaceemissivity is normally quite constant with time, there are some advantages of using emissivity retrievals ratherthan an atlas: compensating for skin temperature errors; matching the emissivity of the exact field of view andother sensor characteristics (such as polarisation); reducing the impact of frequency extrapolation.
The RMSE of differences between simulated and observed brightness temperatures can provide a general mea-sure of the error in the radiative transfer calculations. Table 2, for the Algeria case, provides the RMSE com-puted considering the 44 SSMIS observations in the 183 GHz humidity sounding channels, which are assignedthe emissivity retrieved at 91 GHz. We distinguish between RMSE computed using εas to simulate the bright-ness temperatures (T bas) and that coming from the use of εcs (T bcs), but results are very similar for both. Theerror is largest at 183±7 GHz in SSMIS channel 9. This is a lower tropospheric humidity channel and, con-sequently, in the relatively clear atmosphere of this example, it is likely to be more affected by errors in thesurface parameters (e.g. emissivity, skin temperature). In any case, the residual uncertainty in the first guessis consistent with the observation error model, which in this scenario would predict a total error of 3 K. All44 SSMIS humidity sounding observations in this example are actively assimilated and not rejected by qualitycontrol.
To generalise the behaviour of the retrieval for SSMIS window channels in cloud free scenes (observed SI ≤0K), Fig. 4 compares global mean and standard deviation of emissivities from εas, εcs and TELSEM for the monthof June 2013. As mentioned, statistics are computed between 60◦S and 60◦N, only considering land-sea-maskvalues greater than 0.95. The sample has been restricted slightly further by (a) only considering retrievals thathave generated emissivities between 0 and 1 and (b) requiring the availability of TELSEM atlas values. Theall-sky and clear-sky retrievals behave the same across all the frequencies and match the climatology valuesfairly well. Statistics at 91H are those particularly relevant for the goal of our assimilation and they show thenegative bias that was highlighted in the single observation case (Fig. 3).
10 Research Report No. 38

All-sky assimilation of SSMIS humidity sounding channels over land
19H 19V 37H 37V 50H 91H 91V 0.8
0.9
1.0E
mis
sivi
ty
Figure 4: Mean of land surface emissivity retrievals in SSMIS window channels for the month of June 2013. εas (thin line)and εcs (dashed line) retrieved from SSMIS cloud free observations are compared to TELSEM atlas values (thick line).Retrievals are restricted to latitudes equatorward of 60◦ and model land-sea-mask values greater than 0.95. Error barsrepresent the standard deviation.
Table 3: Impact of cloud contamination on εas and εcs for 3 observation cases over the north-east of Bolivia(15.09◦S;63.28◦W). The observed brightness temperatures (Tb) and the model surface to space transmittance (Γclr) arealso shown for the SSMIS window channels. Emissivity from TELSEM atlas (εt ) are provided as additional reference.
19H 19V 37H 37V 50H 91H 91Vεt 0.934 0.941 0.914 0.922 0.912 0.908 0.916
1. Intense scattering (observed SI 34 K)Tb [K] 287.11 286.11 277.73 278.25 268.44 253.11 254.43Γclr 0.806 0.807 0.788 0.788 0.460 0.400 0.400εas 0.938 0.953 0.893 0.919 0.751 0.193 0.279εcs 0.937 0.952 0.894 0.919 0.764 0.356 0.423
2. Intermediate scattering (observed SI 7 K)Tb [K] 286.94 285.60 281.72 281.09 274.10 273.91 273.410Γclr 0.809 0.811 0.790 0.790 0.462 0.406 0.406εas 0.941 0.953 0.924 0.935 0.832 0.655 0.702εcs 0.937 0.949 0.924 0.934 0.843 0.742 0.766
3. Moderate scattering (observed SI 1.2 K)Tb [K] 286.30 284.75 281.19 281.05 277.43 282.47 281.55Γclr 0.816 0.818 0.797 0.797 0.468 0.423 0.423εas 0.936 0.947 0.915 0.932 0.892 0.920 0.935εcs 0.938 0.949 0.924 0.938 0.900 0.920 0.938
Research Report No. 38 11

All-sky assimilation of SSMIS humidity sounding channels over land
3.3.2 Retrieval in cloud-affected scenes
At higher microwave frequencies, the presence of clouds and precipitation can substantially reduce the surfaceto space transmittance, leading to larger errors in the emissivity estimate. However, in the case of limited scat-tering and reasonably high surface to space transmittance, an instantaneous emissivity retrieval might still bepossible. To illustrate the impact of cloud contamination on the emissivity retrievals, we chose a densely veg-etated area in the north-east of Bolivia (15.09◦S;63.28◦W). Compared to the desert area examined earlier, thisarea exhibits higher emissivities and is often affected by deep convection. Looking at the SSMIS observed andsimulated SI, and cross-checking with images from GOES (Geostationary Operational Environmental Satel-lites), we chose 3 scenes which are cloud contaminated but are characterised by different amounts of scattering.It is important to remember that the all-sky assimilation is affected by ‘mislocation’ errors so what it is seen inthe observations it might or might not be present in the model with the same intensity. The 3 cases explore thesituation when the observations have more cloud than the model, or about the same:
1. Intense scattering (30 June 2013 22 UTC). Observations have much more cloud than model: observed SI34 K; simulated SI 7.5 K; model total hydrometeor content 0.47 kg m−2; model ice hydrometeor content0.39 kg m−2; model TCWV 52.4 kg m−2; model rain rate 0.040 mm h−1.
2. Intermediate scattering (24 June 2013 22 UTC). Observations have little bit more cloud than model: ob-served SI 7 K; simulated SI 3.5 K; model total hydrometeor content 0.35 kg m−2; model ice hydrometeorcontent 0.15 kg m−2; model TCWV 51 kg m−2; model rain rate 0.052 mm h−1.
3. Moderate scattering (25 June 2013 21 UTC). Observations and model have same amount of cloud: ob-served SI 1.2 K; simulated SI 1.2 K; model total hydrometeor content 0.26 kg m−2; model ice hydrome-teor content 0.04 kg m−2; model TCWV 48.5 kg m−2; model rain rate 0.144 mm h−1.
Note that even in the ‘moderate scattering’ case this is far from a clear-sky location: there is cloud and pre-cipitation present. Table 3 shows, for each observation case, εas and εcs retrievals, model surface to spacetransmittance and observed brightness temperatures for the SSMIS window channels. The magnitude of thescattering signal can be clearly distinguished within the 3 cases: moving from 19 to 91 GHz, the higher is thefrequency, the larger is the depression on the observation. In the intense scattering case, observed brightnesstemperatures at 37, 50 and 91 GHz are about 10, 20 and 30 K colder than those at 19 GHz. In the secondcase, the size of such differences is reduced by a half and, in the moderate scattering situation, the impact ofcloud is hard to identify. In general the lower microwave frequencies (19 and 37 GHz) are not affected bycloud contamination and, independently of the magnitude of the scattering, the emissivity retrievals appear tobe consistent with those provided by TELSEM atlas. However, at 50 GHz and above, the depressed brightnesstemperatures in the intermediate and intense scattering cases lead to unphysically low emissivity retrievals. Forexample, εas = 0.193 in the 91H channel. This problem affects the clear-sky and all-sky emissivity retrievalsequally. Even in the all-sky case, these are situations where the model has substantially less scattering than theobservations and will struggle to generate a good retrieval. The method of emissivity retrieval assumes that themodelled atmospheric parameters that go into the retrieval are correct, but that assumption is violated in the in-tense and intermediate scattering cases. However, the moderate scattering case demonstrates that instantaneousemissivity retrievals are still feasible. In this particular case, the emissivity retrieval at 91 GHz is similar tothe atlas values. The retrieved emissivity at 91 GHz can be given to the 183 GHz channels, leading first guessdepartures for SSMIS channel 9, 10 and 11 that are respectively 0.947 K, -0.801 K and 1.812 K, indicatinga good fit between model and observations. This shows that the retrieval is sufficiently good for our purposeof assimilating 183 GHz channels. Note that in all three cases, at higher microwave frequencies, the modelledclear-sky sensitivity to the surface is reduced (for instance the value of the surface to space transmittance at 91H
12 Research Report No. 38
All-sky assimilation of SSMIS humidity sounding channels over land
19H 19V 37H 37V 50H 91H 91V 0.6
0.7
0.8
0.9
1.0
1.1
Em
issi
vity
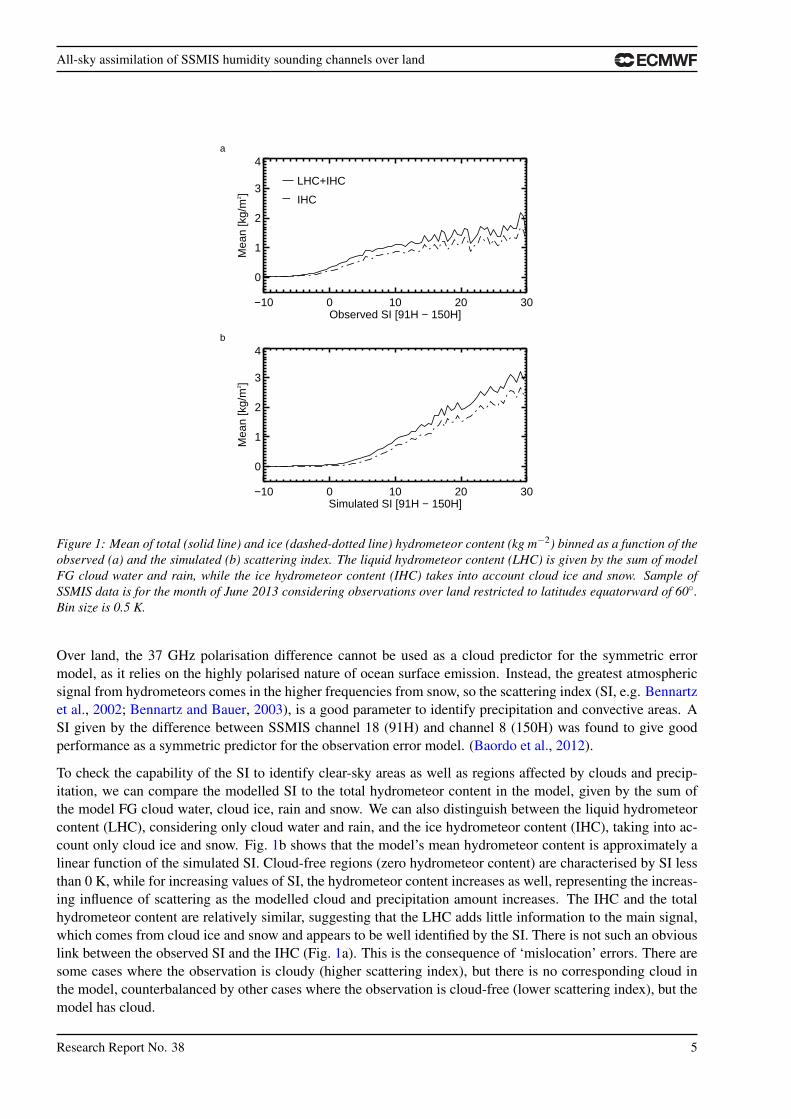
Figure 5: As Fig. 4, but considering only SSMIS cloudy affected observations.
is roughly half that at 19H) but that does not seem itself to be the cause of problems in retrieving emissivity;rather it is the strong depression of observed brightness temperatures in the intense and moderate scatteringcases.
Figure 5 generalises the impact of cloud contamination on SSMIS emissivity retrievals by showing global meanand standard deviation of emissivities from εas, εcs and TELSEM for the month of June 2013, selecting onlythose cases where observed SI >0 K, indicating scattering. Retrievals at frequencies less than 50 GHz areconsistent with the climatology estimates, but at 50 and 91 GHz, as a result of cloud contamination, meansand standard deviations of εas and εcs often diverge from those computed using TELSEM values, generallybecoming too low.
An issue unique to the all-sky approach is that the presence of cloud in the model profiles can also causeproblems. This is the opposite problem to the one just illustrated; here the model has much more cloud thanis present in the observation. In this situation in Eq. 7, the weight of the cloudy column in the emissivitycalculation is very high (C close to or equal 1) and Γcld is relatively small (much smaller than Γclr). This leadsto a small denominator in Eq. 7 and, if the observed brightness temperature is not consistent with the cloudand precipitation in the model, this generates unphysically high emissivities, often larger than 1. Once again,the number of these failures increases at higher frequencies where scattering is the dominant effect and Γcld ismuch smaller than Γclr. Overall this means that the all-sky method can generate more poor-quality retrievalsin strongly-scattering conditions than the clear-sky method, because there are roughly double the opportunitiesfor problems: if there is intense scattering in either the model or the observations. However, if we want to pushthe methodology into cloud and precipitation-affected regimes, it still seems desirable to do a retrieval that isconsistent with the radiative transfer model that is being used. However, clearly we need to be able to identifythose situations where an emissivity retrieval is still feasible and to discard those retrievals affected by largeerrors.
3.3.3 Surface emissivity for the 183 GHz channels
It appears to be useful to do an instantaneous emissivity retrieval in order to capture local changes in surfaceconditions that can affect the emissivity. We have chosen to use the all-sky emissivity retrieval, rather than theclear-sky one, for consistency with the way the simulations are done and with a view to the future. However,to eliminate poor-quality retrievals, a number of screening stages have been applied. First, we decided to rejectobservations where the value of the symmetric scattering index is greater than 20 K. As a reference, for 1month of SSMIS data, this quality control discards roughly 1.2% of observations. We are avoiding attempting
Research Report No. 38 13

All-sky assimilation of SSMIS humidity sounding channels over land
to assimilate profiles where scattering is most intense, either in the model or the observation. Second, we choseto reject emissivity retrievals (but still potentially use the observations) where they are outside of the rangeexpected physical behaviour, i.e. outside of the range 0.55 to 1.0. Third, we compared the retrieval to theemissivity atlas and rejected retrievals that were more than a certain threshold away from the atlas value. Thesethresholds have been estimated from the standard deviation of difference considering retrievals obtained onlyfrom cloudy-free observations (e.g. observed SI ≤0 K like those of Fig. 4) and the corresponding atlas values,calculated globally in every frequency in summer and winter time (e.g. June and January). An average of thetwo seasons’ standard deviations is used and can be labelled σ . The final threshold was chosen as roughly 2times σ in order to increase the chances to use an emissivity retrieval rather than the atlas. Thresholds used inevery frequency are as follows: 0.04 (19H), 0.03 (19V), 0.04 (37H), 0.03 (37V), 0.06 (50H), 0.09 (91H), 0.07(91V). The final sample of emissivities at 91H which has been used to simulate the brightness temperatures forthe 183 GHz channels is most relevant to our assimilation system. Mean land emissivity maps at 91H for themonth of June 2013 are shown in Fig. 6 which compares the retrieved emissivities (but where the 10% failingquality checks have been replaced by TELSEM atlas values) to the estimates provided by the climatology. Thestatistics are based on a total of 405577 SSMIS observations. The general offset between the retrievals and theatlas at 91 GHz is clearly visible. However, the retrieval does globally a good job in capturing the main featureswhich characterise different surface types (e.g. desert, high orography, densely vegetated areas).
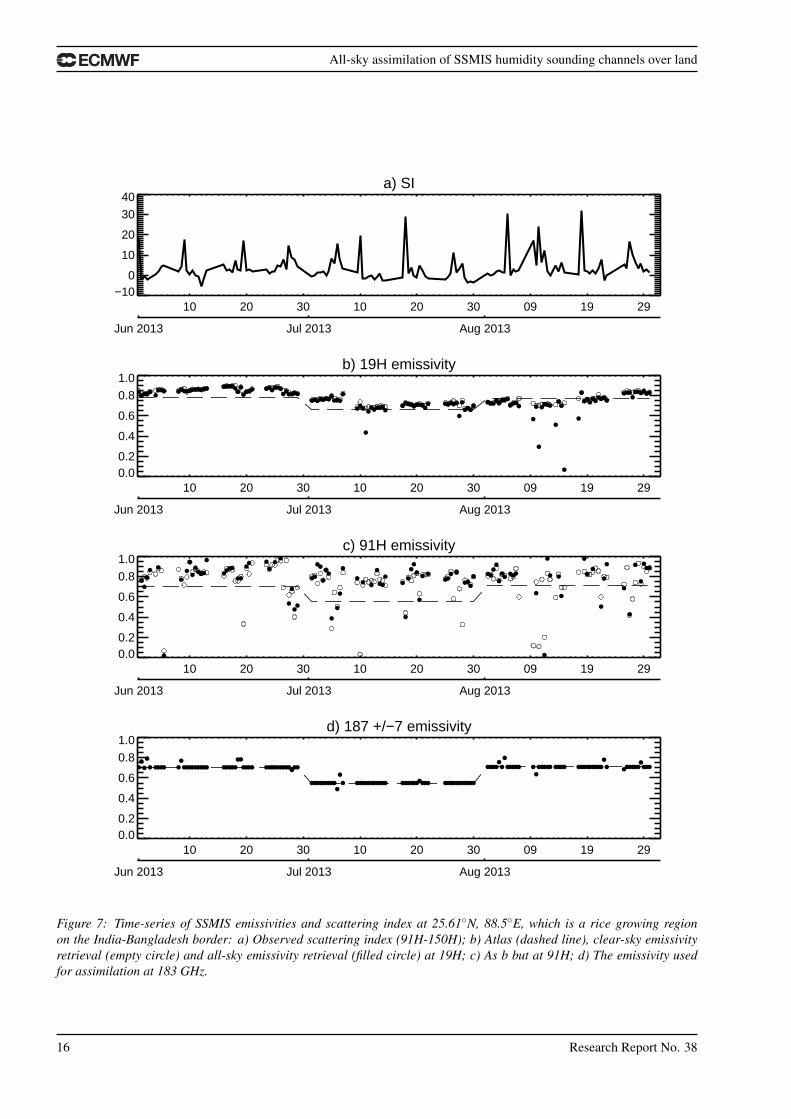
Figure 7 gives a final illustration of the strengths and weaknesses of emissivity retrieval methods in challengingconditions. It shows all-sky and clear-sky surface emissivity retrievals during the monsoon season over an areaon the border between Bangladesh and India where land usage is dominated by rice cultivation. The observedSI (panel a) is regularly larger than 5 K, indicating frequent episodes of precipitation. The simulated SI isnot shown; though it is often in reasonable agreement with the observed SI, it can become unreliable in thepresence of strong convection, because to simulate 91 GHz and 150 GHz brightness temperatures requiresuse of emissivity estimates (and we have chosen to use retrievals at 37 GHz and 91 GHz respectively) thatthemselves can become erroneous through the presence of scattering. The 19 GHz emissivity retrievals arelargely unaffected by scattering and clear-sky and all-sky retrievals are generally very similar through the period(panel b). Retrieved emissivity peaks at around 0.9 in late June and declines rapidly to 0.7 in mid-July; we couldspeculate that this is associated with irrigation of the rice fields. The atlas emissivities show a similar patternwhile missing the shorter-term variability. There are a few cases, particularly in mid-August, where the all-skyretrieval generates unphysically low emissivity retrievals and the clear-sky retrieval is OK: these are likely todo with the presence of heavy precipitation in the model that is not seen in the observations.
At 91 GHz (panel c) there is a larger scatter in the emissivity estimates from both clear-sky and all-sky and 2%of clear-sky and 27% of all-sky emissivity retrievals are outside the physical bounds (0-1) and are not shownon the figure. However, the majority of retrievals are around 0.75 – 0.9, similar to the 19 GHz retrievals andmuch higher than the atlas emissivity of 0.6 – 0.7. It is possible that the atlas itself is suffering from cloudcontamination here. Panel c shows the estimated emissivities given to the all-sky simulations at 183 GHz:because the quality check is based on atlas values, the retrieved emissivity is almost always rejected and atlasis used instead, even if it likely has problems in this location. However, the emissivity estimate is almostimmaterial for 183 GHz assimilation here: throughout the period the clear-sky surface-to-space transmittancein the 183±7 GHz channel is around 10−8. Overall, this example illustrates that atlas, clear-sky and all-skyretrievals can all have their problems, but at least for 183 GHz assimilation, the worst cases for emissivityretrieval are those where either the surface visibility is irrelevant anyway, or the strongly convective situationswill be given a large observation error through the symmetric error model. In these cases, using an emissivityretrieval or a value from climatology is a secondary problem to just achieving the assimilation of stronglyscattering-affected humidity sounding channels.
14 Research Report No. 38

All-sky assimilation of SSMIS humidity sounding channels over land
a
−135 −90 −45 0 45 90 135
−135 −90 −45 0 45 90 135
−30
030
−30
030
b
−135 −90 −45 0 45 90 135
−135 −90 −45 0 45 90 135
−30
030
−30
030
0.75 0.80 0.85 0.90 0.95
Figure 6: Mean land emissivity maps at 91H for the month of June 2013 for the mix generated retrieval/atlas emissivities(b) and the corresponding TELSEM atlas values (a). Grid spacing is 2.5◦.
4 Assimilation experiments
The all-sky microwave brightness temperatures are used alongside many other satellite and conventional obser-vations within a 12-hour assimilation window in the operational ECMWF 4D-Var assimilation system (Rabieret al., 2000) which produces global analyses and forecasts. The observation minus model differences (the socalled first guess departures), which drive the data assimilation system, are computed through the 12 h assimila-tion window using the non-linear forecast model at the highest available resolution to propagate the backgroundatmospheric state forward in time. The incremental 4D-Var, at lower resolution (about 80 km), finds the 12 hforecast evolution that optimally fits the available observations using a linearised forecast model. The atmo-spheric control variables, which consist of transforms of surface pressure, humidity, temperature and the twohorizontal wind components, are adjusted during the minimisation. Cloud and precipitation are not part of thecontrol vector, but during the minimisation, they are diagnosed from the dynamical and humidity fields everytime step. Hence, by adjusting the temperature and moisture profile at the observation location, it is possible tomodify cloud and precipitation to allow the analysis to fit the all-sky observations.
The next sections examine results from the all-sky and clear-sky assimilation of SSMIS humidity sounding
Research Report No. 38 15
All-sky assimilation of SSMIS humidity sounding channels over land
a) SI
10 20 30 10 20 30 09 19 29
Jun 2013 Jul 2013 Aug 2013
−100
10
20
30
40
b) 19H emissivity
10 20 30 10 20 30 09 19 29
Jun 2013 Jul 2013 Aug 2013
0.00.2
0.4
0.6
0.8
1.0
c) 91H emissivity
10 20 30 10 20 30 09 19 29
Jun 2013 Jul 2013 Aug 2013
0.00.2
0.4
0.6
0.8
1.0
d) 187 +/−7 emissivity
10 20 30 10 20 30 09 19 29
Jun 2013 Jul 2013 Aug 2013
0.00.2
0.4
0.6
0.8
1.0
Figure 7: Time-series of SSMIS emissivities and scattering index at 25.61◦N, 88.5◦E, which is a rice growing regionon the India-Bangladesh border: a) Observed scattering index (91H-150H); b) Atlas (dashed line), clear-sky emissivityretrieval (empty circle) and all-sky emissivity retrieval (filled circle) at 19H; c) As b but at 91H; d) The emissivity usedfor assimilation at 183 GHz.
16 Research Report No. 38
All-sky assimilation of SSMIS humidity sounding channels over land
channels. The full assimilation system was run from 1 June to 31 August 2013 using 137 levels in the verticaland a horizontal resolution of approximately 40 km (T511). Although this resolution is lower than the opera-tional system (which uses T1279, about 16 km) it is sufficient to generate realistic cloud and precipitation fieldsand at the time this work was done it was the normal resolution for testing at ECMWF. The experiments arebased on the research cycle 39r1. The 39r1 cycle contained two upgrades particularly relevant to the assim-ilation of microwave humidity sounding observations: a) extension of clear-sky MHS assimilation to sea-icesurfaces and cold oceans (e.g. sea surface temperature less than 278 K) (Di Tomaso et al., 2013); b) assimila-tion of SSMIS humidity channels over ocean in all-sky conditions (Geer, 2013). On top of this, we will test theaddition of the SSMIS humidity channels over land in either the all-sky or clear-sky approach.
4.1 All-sky and clear-sky assimilation
We run two experiments which both make use of the all-sky path of the ECMWF system: 1) an all-sky ex-periment which implements the methodology documented in the previous sections; 2) a clear-sky experimentwhich emulates the operational assimilation of MHS 183 GHz channels in clear-sky conditions. The unchangedversion of cycle 39r1 represents our control experiment which assimilates the same satellite and conventionalobservations as would the operational system. On top of cycle 39r1, the two experimental configurations usethe following settings for assimilation:
1. All-sky experiment a) observation operator includes cloud and precipitation effects using discrete dipolecalculations for a sector snowflake along with a Cmax approach to effective cloud fraction; b) no cloudscreening is applied; c) emissivity retrievals are made through Eq. 7; d) observation error formulationusing the symmetric scattering index.
2. Clear-sky experiment forces C to be zero and consequently: a) the simulated brightness temperature isdetermined only by the clear sub-column (e.g. Eq. 1); b) cloud-affected observations are identified andrejected by looking at the size of FG departures at 150 GHz (observation is considered cloud-free onlyif difference between observed and simulated radiance is less then 5 K); c) the emissivity retrievals arecomputed using Eq. 6; d) a constant observation error of 2 K is applied.
In both cases, as described earlier, the emissivity retrieval will have been replaced by atlas values if it fails orif it is too far from the climatology estimate. As already mentioned, the land sample is restricted to latitudesless than 60◦ and to grid-points where land cover is nearly unbroken (land-sea mask greater than 0.95). Furtherquality checks are applied to discard those observations which might be affected by difficult surface conditions,following the operational assimilation of MHS observations. To avoid possible snow-covered areas, which areprone to larger errors in the retrieval of the surface emissivity, we reject observations where the temperature islower than 278 K. There is also an orography check to avoid situations where the surface signal becomes toolarge. The three 183 GHz channels have weighting functions which peak at different levels in the troposphereand consequently they can be classified as the lower (183±7), mid (183±3) and upper (183±1) tropospherichumidity channels. Hence, observations are rejected where the surface altitude is higher than 800 m, 1000 mor 1500 m for channel 9, 10 or 11. As an example, the surface temperature check rejects about 5% (21414)of the total number of SSMIS data available for the month of June 2013. Loss of data is not particularly largein this period, i.e. summer period for the Northern hemisphere. In winter time, due to colder conditions overland, the percentage of rejected observations is larger. In both cases, many of the observations rejected for coldtemperatures would also have been rejected by the orography check. The orography check rejects 31%, 24%and 12% of data in channel 9, 10 and 11 (percentages are always respect to 1 month of SSMIS data).
Research Report No. 38 17

All-sky assimilation of SSMIS humidity sounding channels over land
183±7
−4 −2 0 2 4Normalised departure
0.01
0.10
1.00
183±1
−4 −2 0 2 4Normalised departure
0.01
0.10
1.00
All−sky
Clear−sky
a
b
Figure 8: Log histograms of normalised departures (bias corrected departure divided by the applied observation error) forSSMIS channel 9 (a) and 11 (b) for the month of June 2013 from the all-sky (solid line) and the clear-sky (dashed-dottedline) experiment. The dotted line shows a Gaussian with a standard deviation of 1. Bin size is 0.5.
4.2 Results
Fig. 8 examines the normalised departures in the lower and upper tropospheric humidity channels for the all-sky and the clear-sky experiment. Normalised departure is the FG departure divided by the observation errorpredicted by the symmetric error model, in the all-sky case, and by the constant observation error of 2 K, inthe clear-sky experiment. The normalised departure is strongly related to the data usage in the assimilation: thesquare of this quantity gives the observation’s weight in the 4D-Var cost function. The sample of data in Fig. 8is 1 month of SSMIS observations considering all available data over land (i.e. applying restrictions on latitudeand land-sea mask, but no additional screening is applied, even for cloud or orography). Fig. 8a and Fig. 8bindicate that, in the all-sky experiment the symmetric observation error is globally doing its job of providinga more Gaussian behaviour of FG departures. This is one of the necessary requirements of data assimilationalgorithms. As demonstrated earlier, in situations where convection is present in the model and absent in theobservation (or vice-versa) FG departures can be very large. However, the observation error model can assignerrors of up to 57 K (e.g. in channel 9) making the distribution of normalised departures relatively Gaussian.However, compared to an actual Gaussian PDF, the all-sky normalised departures are smaller and the peak ofthe distribution is higher. This suggests that the use of our data may be too cautious: the observation error mightbe too large and consequently the weight of the observation during the minimisation is smaller than it could be.Similar results were found for the all-sky assimilation of SSMIS humidity sounding over ocean (Geer, 2013)but it was still possible to get improvements in forecasts.
The clear-sky experiment shows a tail of negative departures (where the observation is colder than the simu-lated brightness temperature) which represents those cases where the observations are cloud-affected and theclear-sky radiative transfer, because it is not simulating cloud absorption or scattering, is not able to generateradiances cold enough. For assimilation, of course these situations are mostly removed by the cloud-screening.The negative tail is more obvious in the lower peaking channel, which overall observes clouds and precipitation
18 Research Report No. 38

All-sky assimilation of SSMIS humidity sounding channels over land
a All−sky
183±7
−135 −90 −45 0 45 90 135
−135 −90 −45 0 45 90 135
−40
−20
020
40
−40
−20
020
40
bClear−sky
183±7
−135 −90 −45 0 45 90 135
−135 −90 −45 0 45 90 135
−40
−20
020
40
−40
−20
020
40
c 183±1
−135 −90 −45 0 45 90 135
−135 −90 −45 0 45 90 135
−40
−20
020
40
−40
−20
020
40
d 183±1
−135 −90 −45 0 45 90 135
−135 −90 −45 0 45 90 135−
40−
200
2040
−40
−20
020
40
−1.0 −0.5 0.0 0.5 1.0
Figure 9: Maps of mean normalised FG departure (bias corrected departure divided by the applied observation error)for assimilated SSMIS humidity sounding observations for the month of June 2013: channel 9 and 11 from the all-sky (aand c) and the clear-sky experiment (b and d). Grid spacing is 2.5◦.
more frequently than the higher-peaking channels. In addition to the quality controls already described, SSMIShumidity sounding observations in both all-sky and clear-sky tests are quality-controlled by a first guess depar-ture check which rejects normalised first guess departures greater than 2.5. From Fig. 8, it can be inferred thata larger number of observations are discarded by the first guess check in the clear-sky case.
We can now compare the all-sky and clear-sky sample of assimilated observations in terms of maps of meannormalised FG departure for the month of June 2013 (Fig. 9). The general impression is that, in both the lowerand upper tropospheric channel, the all-sky experiment shows less residual bias in the sample of assimilatedobservations. Disagreement in normalised FG departures between the all-sky and clear-sky experiment might beexplained taking into account 3 main differences in modelling: a) radiative transfer; b) observation error; c) landsurface emissivity. The clear-sky experiment reduces complexity in radiative transfer computations and screensout cloud-affected observations which, as shown in Fig. 8a, would otherwise systematically generate negativeFG departures. Broadly the cloud-screening at 150 GHz is doing its job, considering that Fig. 9 b and d donot show large negative features. However, at 183±1 GHz in the clear-sky experiment there are some positivenormalised FG departures larger than those in the all-sky case (e.g. Northern South America and CentralAfrica, Fig. 9d). These cases most likely represent situations where the model has cloud and precipitation andthe observation is cloud-free. In the clear-sky assimilation, even though the cloud and precipitation radiativetransfer is ignored, the model humidity profile will likely be saturated, leading to colder simulated brightnesstemperatures, compared to the observations. Overall, the all-sky approach is doing well: the use of the scatteringradiative transfer and the observation error formulation is effective in handling ‘representivity’ errors of the
Research Report No. 38 19

All-sky assimilation of SSMIS humidity sounding channels over land
Table 4: Percentage of assimilated SSMIS humidity sounding observations over land for the month of June 2013 fromthe all-sky and clear-sky experiment. Assimilation is restricted to latitudes equatorward of 60◦. Percentage is computedrespect to the total number of observations.
Global (60◦S-60◦N) - Total number of observations 405577Channel All-sky Clear-sky9 49.2% 40.8%10 55.1% 44.9%11 65.2% 52.2%
NH (20◦N-60◦N) - Total number of observations 2430069 45.2% 36.3%10 51.8% 40.7%11 62.9% 48.0%
T (20◦S-20◦N) - Total number of observations 1111679 58.7% 50.3%10 63.5% 54.0%11 72.9% 61.7%
SH (60◦S-20◦S) - Total number of observations 514049 47.4% 41.7%10 52.1% 45.3%11 59.1% 51.7%
assimilation system and this brings smaller FG departure bias in the sample of assimilated observations.
The total number of assimilated observations is larger in the all-sky assimilation than in the clear-sky: theall-sky approach globally brings an additional 8%, 10% and 13% (relative to the total available) of assimilatedobservations respectively in channel 9, 10 and 11. Table 4 gives percentages of assimilated observations inthe all-sky and clear-sky experiment in different parts of the globe: Northern Hemisphere (NH), Tropics (T)and Southern Hemisphere (SH). The NH gains most observations when the all-sky approach is used. Globally,in channel 9, the lowest peaking channnel, data usage goes from 41% to 49%, but the other half of the datastill being lost due to high orography or potential snow cover. Baordo et al. (2013) describe some of theearly development of the all-sky assimilation of SSMIS humidity sounding channels over land, including aninvestigation of the use of the surface to space transmittance to guide the choice of which observations todiscard. Instead of using thresholds based on the surface orography and skin temperature, instead a fixedtransmittance threshold could be used to reject observations with too great a sensitivity to the surface. Thismight allow more observations to be assimilated. However, forecast scores of assimilation experiments werenot improved compared to those shown here (for summer period, June to August 2012, results showed nosignificant difference, while, for winter period, January to March 2012, forecast scores appeared degraded).However, it is clearly important to do more work to allow the use of data over high-altitude and colder landsurfaces, as they are still responsible for the rejection of half of all data over land in the lowest peaking channel.
The impact on analysis and forecasts of the all-sky and clear-sky experiments is examined in Fig. 10, look-ing at the normalised change in RMS forecast error for vector wind at 850 hPa for the Northern hemisphere.Assimilation of additional humidity observations over land in all-sky conditions is likely to have its greatestimpact on NH winds, through the 4D-Var model-tracing effect that helps to infer winds directly in the dataassimilation system. Both the all-sky and the clear-sky experiment are compared to the control (experimentminus control) so that negative values indicate reduced RMS forecast errors and consequently an improvementrespect to the control. No statistically significant reductions in RMS forecast error are observed in Fig. 10.This is not surprising considering that the number of observations that we are adding to the system, no matter
20 Research Report No. 38

All-sky assimilation of SSMIS humidity sounding channels over land
All−sky − Control
Clear−sky − Control
VW: 20° to 90°, 850hPa
0 1 2 3 4 5 6 7 8 9 10Forecast day
−0.02
−0.01
0.00
0.01
0.02
Nor
mal
ised
diff
eren
ce
Figure 10: Normalised change in RMS vector wind error at 850 hPa in the northern extratropics. Verification is againstown analysis. Scores are based on a maximum of 77 forecasts from summer 2013 (16 June to 31 August). A two weeksspinup are excluded from the beginning of each experiment. Error bars indicate the 95% confidence level.
which assimilation approach is used (clear-sky or all-sky), is small compared to those already available. Thecontrol experiment already benefits from microwave humidity sounding observations from four MHS instru-ments (in clear-sky over ocean, land and sea ice) and one Advanced Technology Microwave Sounder (ATMS)(clear-sky over ocean and land) and one SSMIS (all-sky over ocean). This means that it is difficult to obtainclear improvements in forecast scores. Nevertheless it is clear that forecasts are not degraded when the newobservations are assimilated and the RMS forecast error moves in the right direction (towards negative values)suggesting the new assimilated observations are not harmful for the system. A generally neutral impact is alsoseen in relative humidity, temperature and geopotential (not shown here).
Another way to spot the effect of all-sky assimilation is to look at fits to other assimilated observations. Areduction in standard deviations of FG departures is a sign that the short range forecast (and the analysis thatinitialised the forecast) is improving. As an example, Fig. 11 examines the normalised change in standarddeviation of FG departures for ATMS observations in the Northern Hemisphere. The clear-sky and all-skyexperiment behave roughly the same with few exceptions: the fit to ATMS temperature channel 9 is in favourof the clear-sky experiment counterbalanced by larger reduction in standard deviations in ATMS channel 18and 19 for the all-sky experiment (such changes are also statistically significant as shown by the error barswhich indicate 95% confidence level). Channel 18 and 19 (respectively 183±7 GHz and 183±4.5 GHz) aretwo of the ATMS humidity sounding channels and would be expected to be most sensitive to the assimilation ofsimilar water vapour sensitive channels on SSMIS. The improvements in the all-sky experiment are statisticallysignificant and are likely to be the result of the larger number of assimilated observations in the NH, comparedto clear-sky assimilation. This is one confirmation that the all-sky approach is bringing additional and beneficialinformation to the assimilation system.
As mentioned, Baordo et al. (2013) carried out a number of different assimilation experiments to initially in-vestigate the all-sky assimilation of SSMIS humidity sounding channels over land, using an earlier version ofthe ECMWF system. These experiments were run covering different seasons and used a variety of screeningconfigurations (e.g. cloud screening; rejecting observations for symmetric SI values greater than 10 K; black-listing channel 9; transmittance screening). The all-sky configuration as presented in this paper provided thebest results. However, the majority of configurations showed similar beneficial (if insignificant) changes in theforecast quality, like in Fig. 10 and beneficial, statistically significant improvements in observation fits, like inFig. 11.
Research Report No. 38 21

All-sky assimilation of SSMIS humidity sounding channels over land
99.4 99.6 99.8 100.0 100.2 100.4FG std. dev. [%, normalised]
6
7
8
9
10
11
12
13
14
15
18
19
20
21
22
Cha
nnel
num
ber
Instrument(s): NPP ATMS Tb Area(s): N.HemisFrom 00Z 16−Jun−2013 to 12Z 31−Aug−2013
All−sky
Clear−sky
Figure 11: Normalised standard deviation of FG departures in temperature (channels 6−15) and humidity-sensitive(channels 18−22) for ATMS observations in the Northern Hemisphere. The departures are normalised by the results ofthe control experiment, so that 100% corresponds to that experiment. A two weeks spinup are excluded from the beginningof each experiment. Error bars indicate the 95% confidence level.
5 Conclusions
Emissivity retrieval techniques have allowed clear-sky microwave observations to be assimilated over landsurfaces even when there is significant sensitivity to the surface. Developments in all-sky assimilation haveallowed the assimilation of cloudy and precipitating scenes, but only over ocean surfaces. This study combinesthe two new developments to try assimilating cloudy and precipitating observations over land surfaces. Par-ticular issues have been the development of a new observation error model and the estimation of land surfaceemissivity in cloudy and precipitating conditions. These developments are documented and tested in this workusing SSMIS 183 GHz channels as an example.
To handle the non-Gaussian behaviour of first-guess departures due to errors in the forecast model in predictingcloud and precipitation in the right place and with the right intensity, we formulated an observation errormodelling based on the symmetric (i.e. the average of observed and simulated) scattering index given bythe difference between SSMIS channel 18 (91 GHz) and channel 8 (150 GHz). This formulation, mainlydriven by scattering from deep convective cloud, is able to assign small errors in cloud-free scenes (2.8 K)and linearly increase the observation error where the influence of scattering, cloud and precipitation increases.The adaptive error modelling can generate observation errors as big as 57 K, but this allows us to deal withsituations where deep convection is present in the observations and not in the model (or vice-versa) and wherefirst guess departures can be as large as 90 K.
In the all-sky framework, we attempt emissivity retrievals for all SSMIS observations (e.g. clear, cloudy orprecipitating scenes) over land. In order to be consistent with the way the observations are used in the all-skyassimilation, we implemented an emissivity retrieval taking into account the presence of cloud and precipitationin the model. This follows the two independent column approach (one clear and one cloudy) used for all-skyradiative transfer simulations; these are weighted according to the effective cloud fraction. We call this theall-sky emissivity retrieval, although it is not intended to be valid in situations with significant scattering. Ithas been assessed using estimates from a monthly-mean emissivity database (TELSEM) and the more usualretrieval approach which considers the clear column only (what we call clear-sky retrieval). In most cases,
22 Research Report No. 38

All-sky assimilation of SSMIS humidity sounding channels over land
the all-sky and clear-sky retrievals are in agreement. In cloud-free scenes, the use of instantaneous emissivityretrievals might be helpful in capturing real adjustments in local surface conditions, as well as adapting betterto the specific instrument characteristics including the slightly varying fields of view associated with eachobservation. In these cloud-free cases, the use of emissivity estimates at 91 GHz is good enough to simulateobservations in the 183 GHz channels. We observed that a 5% change in the emissivity climatology leads to 1K error in the simulation at 183±7 and almost identical first guess at 183±3 and 183±1.
In the presence of clouds, it is feasible to retrieve emissivities in the lower window channels (e.g 19 and 37GHz), but at higher microwave frequencies (e.g. 50 and 91 GHz) all-sky and clear-sky retrievals are both af-fected by cloud contamination. As the amount of scattering increases in the observations, emissivity estimatescan become unphysically low. This generally happens when the observation has much more cloud than model.In the opposite case, when the model has much more cloud than the observation, the all-sky (but not the clear-sky) retrieval can generate emissivities greater than 1. This issue is directly related to the nature of ‘mislocation’errors which affects the all-sky assimilation. In these cases, the main source of error in the radiative transfercalculations is the wrong intensity of the cloud profile which can lead to first guess departures larger than 50K. This means that 1-2 K error due to uncertainty in the emissivity estimate is not important. However, in caseof moderate scattering and light rain, and where observation and model have roughly same amount of cloud,retrievals appear possible and the emissivity estimates look plausible compared to the TELSEM atlas values.Overall, the all-sky emissivity retrieval has been demonstrated to work well in most cases, and TELSEM atlasvalues can be used for quality control and to substitute an emissivity estimate when the retrieval is failed or con-sidered erroneous (about 10% of cases). The combination of an all-sky retrieval and all-sky assimilation doesseem to reduce the size of FG departures biases over land, compared to the clear-sky approach. We would arguethat treating the retrieval and assimilation problem symmetrically and working with a complete, all-sky sampleof observations (rather than just selected clear-sky observations) is likely to be less biased overall. Further,this approach looks to the future where short-range model forecasts of clouds and precipitation will becomeincreasingly reliable and ‘mislocation’ errors between model and observation will cause fewer problems.
The reliability of the all-sky land framework has also been investigated by running assimilation experimentsand comparing results of the all-sky assimilation of SSMIS 183 GHz channels with those provided by theequivalent clear-sky approach. Overall, the all-sky experiment not only reduces the magnitude of the bias inthe assimilated sample of normalised FG departure, but also globally increases the total number of assimilatedobservations. In channel 9, the lowest peaking 183 GHz channel, data usage over land is increased from 41%to 49%; in channel 11, the highest peaking, it increases from 52% to 65%. Remaining data rejections are dueto high orography or possible snow cover. The assimilation of either clear-sky and all-sky SSMIS humiditysounding observations over land has a generally neutral impact on forecasts. However, fits to other assimilatedobservations are improved (standard deviation of first guess departures decrease with respect to the controlexperiment) in both cases confirming that the assimilated humidity sounding observations are not harmful forthe system. In the all-sky experiment, fits to assimilated ATMS humidity sounding observations (channel 18and 19) in the Northern hemisphere are significantly improved. This is likely linked either to the larger numberof assimilated observations or the less-biased FG departures. This confirms that the all-sky approach is bringingadditional useful information into the assimilation system.
Further developments in the all-sky assimilation of humidity sounders are examined by Geer et al. (2014b),who extended the all-sky emissivity retrieval to sea-ice areas following the approach of Di Tomaso et al. (2013)and finally transferred the four MHS instruments into the all-sky framework. With five humidity soundinginstruments, and considering ocean, land and sea-ice surfaces, that work was able to demonstrate clear andstatistically significant benefits from all-sky humidity-sounder assimilation, with roughly double the impact ofthe clear-sky approach (these changes became operational at ECMWF in May 2015). The work described inthis paper was essential to making that possible.
Research Report No. 38 23

All-sky assimilation of SSMIS humidity sounding channels over land
6 Acknowledgements
Thanks to many colleagues across ECMWF for technical support and important scientific discussions, andparticularly Peter Bauer and Stephen English, who helped to develop and guide this project. Fatima Karbou isacknowledged for initial development work on emissivity retrievals in the all-sky system at ECMWF. FabrizioBaordo was funded through the EUMETSAT Research Fellowship Programme.
References
Aires, F., Prigent, C., Bernardo, F., Jimnez, C., Saunders, R., and Brunel, P.(2011). A Tool to Estimate Land-Surface Emissivities at Microwave frequencies (TELSEM) for use in numerical weather prediction. Quart.J. Roy. Meteorol. Soc. 137, 690–699.
Auligne, T., A. P. McNally, and D. P. Dee (2007). Adaptive bias correction for satellite data in a numericalweather prediction system. Quart. J. Roy. Meteorol. Soc. 133, 631–642.
Baordo, F., A. J. Geer, and S. English (2012). SSMI/S radiances over land in the all-sky framework: oneyear EUMETSAT fellowship report. EUMETSAT/ECMWF Fellowship Programme Research Report No. 27,available from http://www.ecmwf.int.
Baordo, F., A. J. Geer, and S. English (2013). All-sky assimilation of SSMI/S humidity sounding channels overland: second year EUMETSAT fellowship report. EUMETSAT/ECMWF Fellowship Programme ResearchReport No. 30, available from http://www.ecmwf.int.
Bauer, P., E. Moreau, F. Chevallier, and U. O’Keeffe (2006). Multiple-scattering microwave radiative transferfor data assimilation applications. Quart. J. Roy. Meteorol. Soc. 132, 1259–1281.
Bauer, P., A. J. Geer, P. Lopez, and D. Salmond (2010). Direct 4D-Var assimilation of all-sky radiances: Part I.Implementation. Quart. J. Roy. Meteorol. Soc. 136, 1868–1885.
Bell, W., B. Candy, N. Atkinson, F. Hilton, N. Baker, N. Bormann, G. Kelly, M. Kazumori, W. Campbell, andS. Swadley (2008). The assimilation of SSMIS radiances in numerical weather prediction models. IEEETrans. Geosci. Remote Sens. 46, 884–900.
Bennartz, R., Thoss, A., Dybbroe, A., and Michelson, B. (2002). Precipitation analysis using the AdvancedMicrowave Sounding Unit in support of nowcasting applications. Meteorol. Appl. 9, 177–189.
Bennartz, R. and Bauer, P. (2003). Sensitivity of microwave radiances at 85-183 GHz to precipitating iceparticles. Radio Sci. 38, 8075.
Bormann, N., Geer, A., and English, S. (2012). Evaluation of the microwave ocean surface emissivity modelFASTEM-5 in the IFS. ECMWF Tech. Memo., 667, available from http://www.ecmwf.int.
Di Tomaso, E., Bormann, N., and English, S. (2013). Assimilation of ATOVS radiances at ECMWF: thirdyear EUMETSAT fellowship report. EUMETSAT/ECMWF Fellowship Programme Research Report No. 29,available from http://www.ecmwf.int.
English, S. J. (2008). The importance of accurate skin temperature in assimilating radiances from satellitesounding instruments. Quart. J. Roy. Meteorol. Soc. 126, 2911–2931.
24 Research Report No. 38
All-sky assimilation of SSMIS humidity sounding channels over land
Fabry, F. and Sun, J. (2010). For how long should what data be assimilated for the mesoscale forecasting ofconvection and why? Part I: On the propagation of initial condition errors and their implications for dataassimilation. Mon. Weather Rev. 138, 242–255.
Field, P. R., Heymsfield, A. J., and Bansemer, A. (2007). Snow Size Distribution Parameterization for Midlati-tude and Tropical Ice Clouds. J. Atmos. Sci. 64, 4346–4365.
Geer, A. J., Bauer, P., and O’Dell, C. W. (2009a). A revised cloud overlap scheme for fast microwave radiativetransfer. J. App. Meteor. Clim. 48, 2257–2270.
Geer, A. J., Forbes, R., and Bauer, P. (2009b). Cloud and precipitation overlap in simplified scattering ra-diative transfer. ECMWF/EUMETSAT Fellowship Programme Research Report No. 18, available fromhttp://www.ecmwf.int
Geer, A. J., P. Bauer, and P. Lopez (2010). Direct 4D-Var assimilation of all-sky radiances: Part II. Assessment.Quart. J. Roy. Meteorol. Soc. 136, 1886–1905.
A. J. Geer and P. Bauer (2010). Enhanced use of all-sky microwave observations sensitive to water vapour,cloud and precipitation. Published simultaneously as ECMWF Tech. Memo. 620 and ECMWF/EUMETSATFellowship Report No. 20, available from http://www.ecmwf.int.
Geer, A. J. and P. Bauer (2011). Observation errors in all-sky data assimilation. Quart. J. Roy. Meteorol.Soc. 137, 2024–2037.
Geer, A. J., P. Bauer and S. J. English(2012). AMSU-A temperature sounding channels in presence of cloud andprecipitation. Published simultaneously as ECMWF Tech. Memo. 670 and ECMWF/EUMETSAT FellowshipReport No. 24, available from http://www.ecmwf.int.
Geer, A. J (2013). All-sky assimilation: better snow-scattering radiative transfer and addition of SSMIS hu-midity sounding channels. ECMWF Tech. Memo., 706, available from http://www.ecmwf.int.
Geer, A. J. and F. Baordo (2014). Improved scattering radiative transfer for frozen hydrometeors at microwavefrequencies. Atmos. Meas. Tech. 7, 1839–1860.
Geer, A. J., F. Baordo, N. Bormann, and S. English (2014). All-sky assimilation of microwave humiditysounders. ECMWF Tech. Memo., 741, available from http://www.ecmwf.int.
Joseph, J., W. J. Wiscombe, and J. A. Weinman (1976). The delta-Eddington approximation for radiative fluxtransfer. J. Atmos. Sci. 33, 2452–2459.
Karbou F., Prigent C., Eymard L., Pardo J. (2005). Microwave land emissivity calculations using AMSUA andAMSU-B measurements. IEEE Trans. Geosci. Remote Sens. 46, 863–883.
Karbou, F., E. Gerard, and F. Rabier (2010a). Global 4D-Var assimilation and forecast experiments usingAMSU observations over land. Part-I: Impact of various land surface emissivity parameterizations. Weatherand Forecasting 25, 5–19.
Karbou, F., F. Rabier, J-P. Lafore, J-L. Redelsperger, and O. Bock (2010b). Global Global 4D-Var assimila-tion and forecast experiments using AMSU observations over land. Part II: Impact of assimilating surfacesensitive channels on the African Monsoon during AMMA. Weather and Forecasting 25, 20–36.
Kazumori M. and S. English (2014). Use of the ocean surface wind direction signal in microwave radianceassimilation. Quart. J. Roy. Meteorol. Soc. in press.
Research Report No. 38 25

All-sky assimilation of SSMIS humidity sounding channels over land
Krzeminski, B., Bormann N., Karbou F., and Bauer P. (2009). Improved use of surface-sensitive microwaveradiances over land at ECMWF. Proceedings of the EUMETSAT Meteorological Satellite Conference, EU-METSAT, Darmstadt, Germany.
Kunkee, D., G. Poe, D. Boucher, S. Swadley, Y. Hong, J. Wessel, and E. Uliana (2008). Design and evaluationof the first Special Sensor Microwave Imager/Sounder. IEEE Trans. Geosci. Remote Sens. 46, 863–883.
Liu, G. (2008). A database of microwave single-scattering properties for nonspherical ice particles. Bull. Am.Met. Soc. 111, 1563–1570.
Liu, Q., Weng, F., and English, S. (2011). Water Emissivity Model. IEEE Trans. Geosci. Remote Sens. 49,1238–1250.
Marshall, J. S. and Palmer, W. M. K. (1948). The distribution of raindrops with size. J. Meteor. 5, 165–166.
Petty, G. W. and W. Huang (2011). The modified gamma size distribution applied to inhomogeneous andnonspherical particles: Key relationships and conversions. J. Atmos. Sci. 68, 1460–1473.
Peubey, C. and A. P. McNally (2009). Characterization of the impact of geostationary clear-sky radiances onwind analyses in a 4D-Var context. Quart. J. Roy. Meteorol. Soc. 135, 1863–1876.
Prigent C., Chevallier F., Karbou F., Bauer P., and Kelly G. (2005). AMSU-A surface emissivities for numericalweather prediction assimilation schemes. J. Applied Meteorology 44, 416–426.
Rabier, F., H. Jarvinen, E. Klinker, J.-F. Mahfouf, and A. Simmons (2000). The ECMWF operational im-plementation of four-dimensional variational assimilation. I: Experimental results with simplified physics.Quart. J. Roy. Meteorol. Soc. 126, 1148–1170.
Ruston, B., F. Weng, and B. Yan (2008). Use of one-dimensional variational retrieval to diagnose estimates ofinfrared and microwave surface emissivity over land for ATOVS sounding instruments. IEEE Trans. Geosci.Remote Sens. 46, 376–384.
26 Research Report No. 38