
Relative humidity changes in a warmer climate
11
Click Here for Full Article Relative humidity changes in a warmer climate Steven C. Sherwood, 1,2 William Ingram, 3,4 Yoko Tsushima, 5 Masaki Satoh, 5,6 Malcolm Roberts, 7 Pier Luigi Vidale, 8 and Paul A. O’Gorman 9 Received 4 June 2009; revised 1 December 2009; accepted 14 December 2009; published 7 May 2010. [1] Key climate feedback due to water vapor and clouds rest largely on how relative humidity R changes in a warmer climate, yet this has not been extensively analyzed in models. General circulation models (GCMs) from the CMIP3 archive and several higher‐ resolution atmospheric GCMs examined here generally predict a characteristic pattern of R trend with global temperature that has been reported previously in individual models, including increase around the tropopause, decrease in the tropical upper troposphere, and decrease in midlatitudes. This pattern is very similar to that previously reported for cloud cover in the same GCMs, confirming the role of R in controlling changes in simulated cloud. Comparing different models, the trend in each part of the troposphere is approximately proportional to the upward and/or poleward gradient of R in the present climate. While this suggests that the changes simply reflect a shift of the R pattern upward with the tropopause and poleward with the zonal jets, the drying trend in the subtropics is roughly 3 times too large to be attributable to shifts of subtropical features, and the subtropical R minima deepen in most models. R trends are correlated with horizontal model resolution, especially outside the tropics, where they show signs of convergence and latitudinal gradients become close to available observations for GCM resolutions near T85 and higher. We argue that much of the systematic change in R can be explained by the local specific humidity having been set (by condensation) in remote regions with different temperature changes, hence the gradients and trends each depend on a model’s ability to resolve moisture transport. Finally, subtropical drying trends predicted from the warming alone fall well short of those observed in recent decades. While this discrepancy supports previous reports of GCMs underestimating Hadley cell expansion, our results imply that shifts alone are not a sufficient interpretation of changes. Citation: Sherwood, S. C., W. Ingram, Y. Tsushima, M. Satoh, M. Roberts, P. L. Vidale, and P. A. O’Gorman (2010), Relative humidity changes in a warmer climate, J. Geophys. Res., 115, D09104, doi:10.1029/2009JD012585. 1. Introduction [2] It is now widely known that the water vapor feedback in general circulation models (GCMs) is close to that which would result from a climate‐invariant distribution of relative humidity [Soden and Held, 2006], as long anticipated before the advent of such models [e.g., Arrhenius, 1896; Manabe and Wetherald, 1967]. This sometimes gives the mistaken impression that models predict that relative humidity will remain invariant everywhere in warmer climates. In fact, several GCM studies have reported patterns of change in relative humidity [e.g., Wetherald and Manabe, 1980; Mitchell and Ingram, 1992]. These changes typically include a horseshoe‐shaped pattern of relative humidity reduction in the tropical upper troposphere and the midlatitudes. While a similar pattern has been reported in a number of GCMs, we are not aware of any systematic evaluation or established explanation of it. In light of continuing uncertainties about water vapor and cloud feedback in GCMs [Bony et al., 2006], it is worth investigating how robustly this pattern continues to hold in more recent GCMs, whether it can be explained physically, and whether it is consistent with observations. Only if we could answer yes to such questions could we be confident that model predictions were likely to be accurate. [3] While GCM‐predicted changes in R are modest and of variable sign, thus not significantly affecting the global radiative feedback of water vapor [Soden and Held, 2006], 1 Department of Geology and Geophysics, Yale University, New Haven, Connecticut, USA. 2 Also at Climate Change Research Centre, University of New South Wales, Sydney, Australia. 3 Met Office Hadley Centre, Exeter, UK. 4 Also at Department of Physics, Oxford University, Oxford, UK. 5 JAMSTEC Frontier Research Center for Global Change, Yokohama City, Japan. 6 Center for Climate System Research, University of Tokyo, Tokyo, Japan. 7 Met Office Hadley Centre, Exeter, UK. 8 National Centre for Atmospheric Science, University of Reading, Reading, UK. 9 Department of Earth, Atmospheric and Planetary Sciences, Massachusetts Institute of Technology, Cambridge, Massachusetts, USA. Copyright 2010 by the American Geophysical Union. 0148‐0227/10/2009JD012585 JOURNAL OF GEOPHYSICAL RESEARCH, VOL. 115, D09104, doi:10.1029/2009JD012585, 2010 D09104 1 of 11
Transcript of Relative humidity changes in a warmer climate

ClickHere
for
FullArticle
Relative humidity changes in a warmer climate
Steven C. Sherwood,1,2 William Ingram,3,4 Yoko Tsushima,5 Masaki Satoh,5,6
Malcolm Roberts,7 Pier Luigi Vidale,8 and Paul A. O’Gorman9
Received 4 June 2009; revised 1 December 2009; accepted 14 December 2009; published 7 May 2010.
[1] Key climate feedback due to water vapor and clouds rest largely on how relativehumidity R changes in a warmer climate, yet this has not been extensively analyzed inmodels. General circulation models (GCMs) from the CMIP3 archive and several higher‐resolution atmospheric GCMs examined here generally predict a characteristic patternof R trend with global temperature that has been reported previously in individual models,including increase around the tropopause, decrease in the tropical upper troposphere,and decrease in midlatitudes. This pattern is very similar to that previously reported forcloud cover in the same GCMs, confirming the role of R in controlling changes insimulated cloud. Comparing different models, the trend in each part of the troposphere isapproximately proportional to the upward and/or poleward gradient of R in the presentclimate. While this suggests that the changes simply reflect a shift of the R pattern upwardwith the tropopause and poleward with the zonal jets, the drying trend in the subtropics isroughly 3 times too large to be attributable to shifts of subtropical features, and thesubtropical R minima deepen in most models. R trends are correlated with horizontalmodel resolution, especially outside the tropics, where they show signs of convergence andlatitudinal gradients become close to available observations for GCM resolutions nearT85 and higher. We argue that much of the systematic change in R can be explained bythe local specific humidity having been set (by condensation) in remote regions withdifferent temperature changes, hence the gradients and trends each depend on a model’sability to resolve moisture transport. Finally, subtropical drying trends predicted from thewarming alone fall well short of those observed in recent decades. While this discrepancysupports previous reports of GCMs underestimating Hadley cell expansion, our resultsimply that shifts alone are not a sufficient interpretation of changes.
Citation: Sherwood, S. C., W. Ingram, Y. Tsushima, M. Satoh, M. Roberts, P. L. Vidale, and P. A. O’Gorman (2010), Relativehumidity changes in a warmer climate, J. Geophys. Res., 115, D09104, doi:10.1029/2009JD012585.
1. Introduction
[2] It is now widely known that the water vapor feedbackin general circulation models (GCMs) is close to that whichwould result from a climate‐invariant distribution of relativehumidity [Soden and Held, 2006], as long anticipated before
the advent of such models [e.g., Arrhenius, 1896; Manabeand Wetherald, 1967]. This sometimes gives the mistakenimpression that models predict that relative humidity willremain invariant everywhere in warmer climates. In fact,several GCM studies have reported patterns of change inrelative humidity [e.g., Wetherald and Manabe, 1980;Mitchell and Ingram, 1992]. These changes typically includea horseshoe‐shaped pattern of relative humidity reduction inthe tropical upper troposphere and the midlatitudes. While asimilar pattern has been reported in a number of GCMs, weare not aware of any systematic evaluation or establishedexplanation of it. In light of continuing uncertainties aboutwater vapor and cloud feedback in GCMs [Bony et al., 2006],it is worth investigating how robustly this pattern continues tohold in more recent GCMs, whether it can be explainedphysically, and whether it is consistent with observations.Only if we could answer yes to such questions could we beconfident that model predictions were likely to be accurate.[3] While GCM‐predicted changes in R are modest and
of variable sign, thus not significantly affecting the globalradiative feedback of water vapor [Soden and Held, 2006],
1Department of Geology and Geophysics, Yale University, New Haven,Connecticut, USA.
2Also at Climate Change Research Centre, University of New SouthWales, Sydney, Australia.
3Met Office Hadley Centre, Exeter, UK.4Also at Department of Physics, Oxford University, Oxford, UK.5JAMSTEC Frontier Research Center for Global Change, Yokohama
City, Japan.6Center for Climate System Research, University of Tokyo, Tokyo,
Japan.7Met Office Hadley Centre, Exeter, UK.8National Centre for Atmospheric Science, University of Reading,
Reading, UK.9Department of Earth, Atmospheric and Planetary Sciences,
Massachusetts Institute of Technology, Cambridge, Massachusetts, USA.
Copyright 2010 by the American Geophysical Union.0148‐0227/10/2009JD012585
JOURNAL OF GEOPHYSICAL RESEARCH, VOL. 115, D09104, doi:10.1029/2009JD012585, 2010
D09104 1 of 11

this does not mean they are unimportant. First, changes inrelative humidity that are small compared to the strongClausius‐Clapeyron dependence of saturation vapor pres-sure on temperature (des/dT = 6–18% K−1 depending on T)could still affect processes such as cloud formation or pre-cipitation efficiency. In fact, a correspondence between pat-terns of R change and those of cloud cover change has beennoted in the aforementioned GCM studies, with cloud chan-ges driven by those of relative humidity [Wetherald andManabe, 1980], indicating that the changes in R may haveimportant indirect effects on radiative transfer. We will showthat this remains true in the more recent Coupled ModelIntercomparison Project (CMIP3) models. Also, observa-tional and modeling results show that the behavior of con-vective precipitation is sensitive to relative humidity in thefree troposphere [e.g., Redelsperger et al., 2002], althoughthis may not be well represented in GCM convective schemes[e.g., Derbyshire et al., 2004]. Thus changes in the patternof R could directly influence that of precipitation, regard-less of any impact on the global mean radiation budget.[4] Another reason to take interest in theR changes is that
uncertainty remains as to the ability of GCMs to reproducecertain global or regional climate changes, and R changesmay provide a useful constraint. In particular, several studieshave noted recently that observed poleward shifts of thesubtropical and midlatitude jets, precipitation zones, andother measures of the latitudinal extent of the tropics orHadley circulation appear to be underpredicted by GCMs[Seidel et al., 2008; Johanson and Fu, 2009; Lu et al., 2009]claim, however, that trends in tropopause characteristics canbe explained by those of radiative forcing by greenhousegases (including ozone). Paleoclimate studies also suggestsurprising expansions of the Hadley cell in warmer climates[Brierly et al., 2009]. The magnitude of such poleward shiftsis important due to the regional hydrological changes theycause, which loom as a daunting climate‐change impact onthe flanks of current precipitation zones. Since relativehumidity distributions are strongly controlled by dynamicalfields rather than local temperatures [Sherwood, 1996a],changes in these are relevant; Hu and Fu [2006], forexample, used the location of a threshold of observed out-going radiation (determined largely by upper‐troposphericrelative humidity) to identify widening of the Hadley cell.In examining humidity changes, we will quantitatively testhow well they can be explained by expansion of the Hadleycell, poleward shifts of storm tracks, and raising of thetropopause.
2. Models
[5] We begin with 18 ocean‐atmosphere GCMs from theCMIP3 archive of simulations for the IPCC Fourth Assess-ment in 2007, with dynamical oceans and CO2 increasing at1%/yr to doubling, hereafter referred to as AR4 models[Intergovernmental Panel on Climate Change, 2007]. Themodels used here are those that submitted the humidityfields needed for this study. We compare the model stateaveraged for 10 years from the time of CO2 doubling withthat of the first 10 years, dividing the change in relativehumidity R by the change in global mean surface temper-ature to obtain a climate sensitivity R of relative humidity.
[6] Initial results from the AR4 models showed a cleardependence of the changes on model resolution, whichmotivated us to examine a few available climate‐changeruns conducted at higher resolutions. Each of these models isatmosphere‐only and one is an aquaplanet. First, we includetwoAtmosphere‐only General CirculationModels (AGCMs)based on the Met Office Unified Model: a slightly modifiedversion of HadAM3 [Ingram, 2002] run at three differenthorizontal resolutions from 60 to 1600 km, with 19 verticallevels, in perpetual July; and NUGAM, a nonhydrostaticmodel initially based on the HadGEM1 AR4 model [Johns etal., 2006], developed to 90 km resolution by the UK‐HiGEMproject [Shaffrey et al., 2010] and then 60 km resolution bythe UK‐Japan Climate Collaboration, using 38 vertical levels.Although the first of these is modified from the originalHadAM3 it will be denoted HadAM3 herein. Finally, weinclude results from a 14 km resolution, 58‐vertical‐levelglobal aquaplanet simulation [Miura et al., 2005] by theNon‐hydrostatic ICosahedral Atmospheric Model (NICAM)[Tomita and Satoh, 2004; Satoh et al., 2008]. In each of thesemodels, different climates were simulated by prescribinguniform changes in ocean surface temperatures: +2 K (vs. 0)for NICAM, +2 K vs. −2 K difference for HadAM3, and twoperturbed runs (−2 K and +4 K vs. 0) for NUGAM. Allwere based on at least 10 years of simulation time exceptHadAM3, which was based on 2 years, though each yearshowed similar dR.
3. Results
3.1. GCM Simulations
[7] The mean R (Figure 1) and dR (Figure 2) patternswith latitude and height among the AR4 models are similarto those reported previously for individual models [e.g.,Wetherald and Manabe, 1980]. The dR pattern in particularis qualitatively similar among all models (see Figure 3),including the high‐resolution AGCMs, though not all placethe maxima in the same places (shading in Figure 2 indicateswhere at least 16 of the 18 models agree on the sign of dR).The near symmetry of the response above the boundary layeris interesting and indicates that it is unlikely to depend onthe presence of continents or details of the surface warmingpattern. The symmetry and robustness of the dR patternsuggests that it is caused by relatively simple physical/dynamical mechanisms.[8] The largest R changes are increases around the extra-
tropical tropopause and just above the tropical tropopause,each of which reaches ∼2% or more per kelvin of warming.Negative dR occurs in a horseshoe‐shaped region, includingthe midlatitude and tropical uppermost tropospheres. Zonaland model‐mean dR (relative to meanR) in the tropospherenever exceeds ∼20% of the relative change in local spe-cific humidity at constant relative humidity according tothe Clausius‐Clapeyron equation, which ranges from 6 to18% K−1 of local air temperature. Since dR is small andvaries in sign, it is not surprising that the global water vaporfeedback in GCMs is close to that expected under constantrelative humidity [Soden and Held, 2006].[9] A simple explanation of the dR pattern would be to
ascribe it to upward and poleward expansion of the originalR distribution associated with previously documented risingof the tropopause and poleward shifts of climate zones and
SHERWOOD ET AL.: RELATIVE HUMIDITY AND WARMING D09104D09104
2 of 11

circulation features. Indeed, regions of dR < 0 coincideroughly with where R increases in the poleward (in themidlatitudes) or upward (below the tropical tropopause)directions and vice versa for the increase near and abovethe midlatitude tropopause. To explore the humidity changes,and this “shift” explanation in particular, more quantitatively,we examine means within the rectangular regions indicatedin Figure 2, named TL, TU, XL, and XU for tropical‐lower,tropical‐upper, extratropical‐lower, and extratropical‐upperones, respectively. (Data are interpolated to standard (man-datory reporting) pressure levels, these are averaged, and thenzonal means are averaged with cosine‐latitude weighting;averages for XL and XU include both hemispheres.) TheTL and TU regions correspond to lower and upper parts ofthe tropical troposphere, while the XL is roughly the freetroposphere in subtropical to midlatitudes, and XU spans theextratropical tropopause and lowermost stratosphere. To testthe robustness of the results, we tried an alternative definitionof these regions in which the box positions were adjusted foreach model to locate over the region of strongest signal;this made the dR values on average about 20% strongerbut did not qualitatively affect any of the relationshipsreported below.[10] Figure 4 compares dR in each region to the relevant
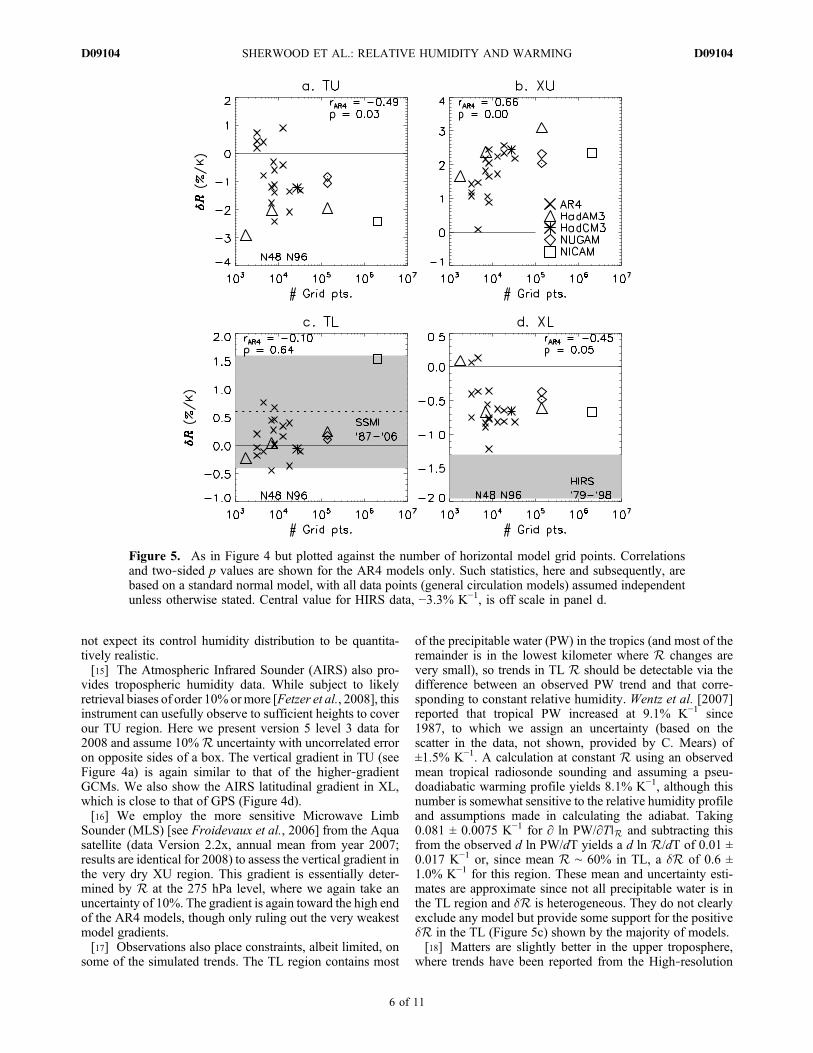
gradient rR of R in the region, computed by taking thedifference between R at the top and bottom (for the upperregions), two sides (XL region), or center and side (TLregion) and dividing by the distance (in hectopascals ordegrees). In each region except TL, dR andrR vary roughlyproportionally among the models. This correspondence isstrongest in TU (Figure 4a), even holding for the models(save one) whose rR is reversed from the average. Thiswould be consistent with the changes being driven by a shiftat a rate consistent across models—but see section 4.[11] Meanwhile, Figure 5 shows that the magnitude of
dR tends to increase with model horizontal resolution in
all four regions. This relationship is highly significant inall regions except TL, even among only the AR4 models(p < 0.05, assuming models are independent; if only halfof the models were assumed independent, only the XUresult would be significant at 95%). (Our use of two‐sidedtests for all regions is conservative, since once the rela-tionship is established in one region and an anticipatedsign of the response has been determined, a one‐sided testwould be sufficient to confirm that the same effect wasoccurring in other regions; this would halve the quoted pvalues for the other regions and allow TU to be significantat 95% even with a degree of freedom equal to only half thenumber of models.) In the extratropics (Figures 5b and 5d),results from all models suggest a plateauing or convergenceonce grid spacing falls below about 2°. This is supported notonly by the AGCMs but also by the half dozen or so highest‐resolution AR4 models and by the HadAM3 trend. All butone of the AGCMs are related and are thus not fully inde-pendent, so more high‐resolution models would be neededto make a conclusive statement. Signals do not differ by morethan ∼20–30% between HadCM3 and the two NUGAM runs,suggesting that the response is mainly temperature drivenand that interactive oceans and changing greenhouse gasconcentrations (present in HadCM3 but not the AGCMs) donot play a major role. This also implies that details in therate of warming (e.g., 1% per year vs. a more realistic 20th‐century scenario) should not be important.[12] In the tropics, the role of resolution is less clear. In
the TL region, there is little correlation among differentmodels, but the HadAM3 runs show dR increasing somewhatwith model resolution. In TU the reverse is true: modelsgenerally show a correlation between dR and resolution(statistically significant at 95% even with only the AR4
Figure 2. Change in R per Kelvin of surface warmingaveraged over 18 AR4 model simulations. Change foundby computing the difference between R initially and at thetime of CO2 doubling and then dividing that by the simulatedglobal mean temperature increase over the same time period.Solid/dashed contours are positive/negative. Shading showsregions where ∼90% of models (at least 16 of the 18) agreeon the sign of the change.
Figure 1. Mean R averaged over 18 AR4 model simula-tions of present‐day climate. Dotted lines show averagingregions discussed in text: TL (25°S–25°N, 450–900 hPa);TU (25°S–25°N, 175–350 hPa); XL (30°–65°N/S, 350–900 hPa); XU (40°–90°N/S, 175–350 hPa).
SHERWOOD ET AL.: RELATIVE HUMIDITY AND WARMING D09104D09104
3 of 11

Figure
3.R
foreach
individualmodel.L
asttwopanelsshow
the60‐km
versions
ofHadGEM
andHadAM3.The
NICAM
result,
show
nby
Miura
etal.[2005],isqualitativ
elysimilarto
mostof
these.
SHERWOOD ET AL.: RELATIVE HUMIDITY AND WARMING D09104D09104
4 of 11

models), but not HadAM3 at different resolutions. Thissuggests that other model characteristics (perhaps convectivephysics) are equally or more important in affecting tropicalresults. The low‐resolution run of HadAM3 is an outlier inTU, having large dR despite low resolution and small rR.The reasons for this are unclear.[13] We found no clear evidence of sensitivity to vertical
resolution. Among the AR4 models, none of the signals herewas related to the number of model levels (although thisnumber is an imperfect index of tropospheric resolution).Furthermore, NUGAM signals were not stronger than thoseof HadAM3 despite NUGAM having twice as many levels.Since the number of tropospheric levels among AR4 modelsgenerally varies by less than a factor of 2, it is not surprisingthat no relationship was observed in that ensemble, andhorizontal resolution appears to be the overriding factorthough further studies of vertical resolution are warranted.
3.2. Comparison to Observations
[14] Observations are available to test a few of these sig-nals. GPS data are well suited for measuring the latitudinal
gradient in the lower and middle troposphere in the currentclimate, as they are measured by the same instrument at dif-ferent latitudes (thus minimizing spatially varying biases),have global coverage, are self‐calibrated, and are uniqueamong remotely sensed data in being essentially immune tocloud contamination [Hajj et al., 2004] that, if present, wouldcause significant latitude‐dependent biases. We use thezonal means of GPS R distributions reported by Sherwoodet al. [2006]. GPS can retrieve humidity consistently onlyfor the first few kilometers in mid latitudes due to the sensi-tivity limitations of the instrument; we estimated the overallgradient in XL by multiplying that observed at 700 hPa by0.8, a ratio taken from that exhibited by the GCMs (this isan average, but the ratio does not vary much among themodels). The resulting estimate of the latitudinal gradient inXL matches that of the highest‐resolution AR4 GCMs (seeFigure 4d), an encouraging sign that the apparent conver-gence of the models is toward something realistic (similarresults occur if we compare 700 hPa values from the GCMsand GPS). The gradient in NICAM is somewhat too strong,but as this model is simulating an aqua planet one should
Figure 4. Change inR per kelvin of surface warming, averaged over four regions shown in Figures 1–2,plotted against (a, b) vertical or (c, d) horizontal gradient of R. Cross, triangle, star, diamond, and squareindicate AR4, HadAM3, HadCM3, NUGAM, and NICAM, respectively (see also Figure 5), with dotteddiamonds indicating the NUGAM run with 2 K cooling. Dashed lines show best‐fit linear relationshipsfor the AR4 models, constrained to include the origin; slopes are printed in each panel. No fit is attemptedin the TL region. Each observational estimate (see text) is shown by a dotted line, with shading indicatingan uncertainty range.
SHERWOOD ET AL.: RELATIVE HUMIDITY AND WARMING D09104D09104
5 of 11
not expect its control humidity distribution to be quantita-tively realistic.[15] The Atmospheric Infrared Sounder (AIRS) also pro-
vides tropospheric humidity data. While subject to likelyretrieval biases of order 10% ormore [Fetzer et al., 2008], thisinstrument can usefully observe to sufficient heights to coverour TU region. Here we present version 5 level 3 data for2008 and assume 10%R uncertainty with uncorrelated erroron opposite sides of a box. The vertical gradient in TU (seeFigure 4a) is again similar to that of the higher‐gradientGCMs. We also show the AIRS latitudinal gradient in XL,which is close to that of GPS (Figure 4d).[16] We employ the more sensitive Microwave Limb
Sounder (MLS) [see Froidevaux et al., 2006] from the Aquasatellite (data Version 2.2x, annual mean from year 2007;results are identical for 2008) to assess the vertical gradient inthe very dry XU region. This gradient is essentially deter-mined by R at the 275 hPa level, where we again take anuncertainty of 10%. The gradient is again toward the high endof the AR4 models, though only ruling out the very weakestmodel gradients.[17] Observations also place constraints, albeit limited, on
some of the simulated trends. The TL region contains most
of the precipitable water (PW) in the tropics (and most of theremainder is in the lowest kilometer where R changes arevery small), so trends in TL R should be detectable via thedifference between an observed PW trend and that corre-sponding to constant relative humidity. Wentz et al. [2007]reported that tropical PW increased at 9.1% K−1 since1987, to which we assign an uncertainty (based on thescatter in the data, not shown, provided by C. Mears) of±1.5% K−1. A calculation at constant R using an observedmean tropical radiosonde sounding and assuming a pseu-doadiabatic warming profile yields 8.1% K−1, although thisnumber is somewhat sensitive to the relative humidity profileand assumptions made in calculating the adiabat. Taking0.081 ± 0.0075 K−1 for ∂ ln PW/∂T∣R and subtracting thisfrom the observed d ln PW/dT yields a d ln R/dT of 0.01 ±0.017 K−1 or, since mean R ∼ 60% in TL, a dR of 0.6 ±1.0% K−1 for this region. These mean and uncertainty esti-mates are approximate since not all precipitable water is inthe TL region and dR is heterogeneous. They do not clearlyexclude any model but provide some support for the positivedR in the TL (Figure 5c) shown by the majority of models.[18] Matters are slightly better in the upper troposphere,
where trends have been reported from the High‐resolution
Figure 5. As in Figure 4 but plotted against the number of horizontal model grid points. Correlationsand two‐sided p values are shown for the AR4 models only. Such statistics, here and subsequently, arebased on a standard normal model, with all data points (general circulation models) assumed independentunless otherwise stated. Central value for HIRS data, −3.3% K−1, is off scale in panel d.
SHERWOOD ET AL.: RELATIVE HUMIDITY AND WARMING D09104D09104
6 of 11

InfraRed Sounder (HIRS) for the years 1979–1998 [Batesand Jackson, 2001]. The reported UTH (upper tropospherichumidity) is a weighted mean of relative humidity from levelsof roughly 250–560 hPa in midlatitudes, which includes theupper part of the XL region but may also be influenced byhumidity nearer the tropopause (e.g., in XU). HIRS UTH isbiased due to cloud clearing, but this bias (of order 20%)should be stable enough over time that changes in bias aresmall compared to the expected signal. Time trends reportedby Bates and Jackson [2001] occurred in a pattern verysimilar to dR found here: moistening near the equator, mid-latitude drying peaking near 40°N/S and somewhat strongerin the southern hemisphere, and slight moistening towardthe poles. Averaging their values within our XL regionyielded −0.5% per decade or about −3% K−1 if due entirelyto the roughly 0.15 K per decade global‐mean warmingduring the period. A 2‐sigma error bar for this observation(based on errors given by Bates and Jackson [2001]) isshown in Figure 5d. The observed drying well exceeds thatpredicted in any of the GCMs as a consequence of warming,even though we have not accounted for the impact of UT/LSmoistening on the UTH signal. Either most of the actualdrying was not caused by warming per se, or the models areall significantly underestimating a key aspect of climatechange (see section 7) even though many of them are gettingthe spatial gradients in today’s climate about right. Whileerroneous drying in HIRS cannot be ruled out, calibrationproblems do not seem to fit as an explanation since the sameinstrument reports moistening at other latitudes of similaramplitude and the overall pattern qualitatively resemblespredictions.
4. Evaluation of the “Shift” Explanationfor Simulated dRRRRRRR[19] We now turn to possible explanations of the model
behavior, in particular the “shift” idea noted earlier. Forexample, Kushner et al. [2001] found that most of the sim-ulated wind and temperature changes in a warmed climatecould be explained by simple shifts of the climatology. Inview of the fairly linear relationships of the data in Figure 4,we infer an effective shift rate (in hectopascals per Kelvin orlatitudinal degrees per kelvin) by taking the slope of the best‐fit line through the origin, indicated by numbers in each panel.We then compare these to shift rates reported elsewherebased on indices of the circulation (winds, temperature, etc.).
4.1. Tropopause Lifting
[20] A CO2‐warmed climate exhibits a higher tropopause[Santer et al., 2003] due to the contrast between the warmingof the troposphere and the cooling of the stratosphere, whichcauses a tropospheric adiabat and a stratospheric radiative‐equilibrium profile to intersect at a lower pressure. Thus ifthe upward displacement in the R pattern were directlyassociated with tropopause height change, we might haveexpected it to be weaker in the AGCMs (which lack changesin CO2) than in the AR4 models. The data do not show this,however.[21] In the XU region, the inferred rise rate of −6 to
−7 hPa K−1 (Figure 4b) is ∼30% greater than the ∼4–5 hPa K−1
mean tropopause rise rate in the AR4 models [Lu et al.,2007]; the spread of previously reported rise rates is also
similar to that of rates inferred here (about a factor of 2 fromlowest to highest). Thus, a rising tropopause does seem toexplain most of the dR signal in the extratropics, thoughperhaps not all.[22] In the TU, the inferred rise rate, −13 hPa K−1, is
roughly 4 times the ∼3 hPa K−1 average tropopause rise ratedocumented in the AR4 models [Lu et al., 2007]. Thisconfirms that tropopause lifting per se is not the main causeof drying in this region. As pointed out by Hartmann andLarson [2002], however, the height reached by convectiveoverturning in the tropics tends to be tied to an isothermbelow the tropopause where radiative cooling by water vaporbecomes significant (not the cold‐point tropopause). Thissuggests that the R pattern might track isotherms within theTU region, which rise faster (in hectopascals per kelvin)than the tropopause. But that would still only yield a shiftrate of ∼6 hPa K−1 based on the mean shift rates of iso-therms in the TU region, only half that necessary to explainthe drying in the GCMs.
4.2. Poleward Migration
[23] Poleward shifts of subtropical dry zones [Previdi andLiepert, 2007] and storm tracks [Lu et al., 2008] have beenreported in the AR4 models. Their cause is debated, andmultiple mechanisms involving changes in either the lapserate or tropopause height are possible [Lu et al., 2008]. It hasalso been argued that they may not actually be caused bywarming per se [Lu et al., 2009] but by the direct radiativeforcing of greenhouse gases.[24] The poleward shift required to explain the XL signal,
1.15° latitude per kelvin on average, well exceeds the aver-age expansion of the Hadley cell (0.3°–0.35° K−1 [Previdiand Liepert, 2007; Lu et al., 2007]) or poleward retreat ofthe storm track (roughly 0.7° K−1[Lu et al., 2008]). This isalso evident from examining (Figure 6) the 500 hPa Raveraged over all models in the control climate and with 2 Kof warming. The data at storm‐track latitudes (near 45°N/S)are consistent with reported shifts of ∼0.6°–0.7° K−1 onaverage, with data at higher latitudes suggesting little shift,but the curves near 30°–35°N (S) shift by 1° K−1 or more,which is at least 3 times the reported mean expansion rate.Also of interest, the NICAM aquaplanet produces a similardR to other models of relatively high resolution, despite itsR gradient being too strong (and the same happens inXU). Finally, the deepening of the subtropical minimum inR cannot result from a shift.[25] Interestingly, this deepening occurs in all but three of
the CGCMs but not in any of the AGCMs: changes in thelatter are all less than 0.5% −1, except for NICAM whichshows a shallowing of 2% K−1. This indicates that thedeepening is not caused by the atmospheric warming per sebut by the changes in the tropical SST pattern or increases ingreenhouse gases that are absent in the AGCM runs. Acursory study revealed no significant relationships amongthe AR4 models between the amount of deepening and anyidentifiable feature of the tropical or equator‐to‐pole SSTchange, nor to changes in stratospheric cooling, so it remainsunclear what exactly causes the deepening. However, thisresult may be relevant to the finding of Lu et al. [2009] thatgreenhouse gas increases can directly shift subtropical fea-tures poleward independent of tropospheric warming.
SHERWOOD ET AL.: RELATIVE HUMIDITY AND WARMING D09104D09104
7 of 11

[26] As an additional test of whether shifting subtropicscould still somehow account for the dR signal despite theevident mismatch in the expected and observed magnitudeof the drying, we computed a multiple regression of dR inXL onto the two predictors rR and dlat, the latter being therate of expansion of the Hadley cell in each model accordingto Previdi and Liepert [2007]. The regression coefficientwith rR was highly significant (p = 0.002) while that withdlat was not statistically significant (p > 0.1). This arguesagainst Hadley cell expansion as the primary cause of dR.
5. An Alternative Explanation: Last‐SaturationTemperature Changes
[27] Increased dryness has been noted in individual modelsand explanations have been put forward. For example,Wetherald and Manabe [1980] suggested that this may bedue to increased variance of the vertical velocity due tostronger latent heat release with higher specific humidities.However, they concluded that this was not fully satisfactory,andmore recent work suggests that higher specific humiditiesshould, if anything, lead to weaker transient vertical motions[Vecchi and Soden, 2007; O’Gorman and Schneider, 2009].Mitchell and Ingram [1992] argued that an elevated tropo-pause should lead to a drier troposphere but did not propose aquantitative model for this.[28] We propose that the parts of dR not attributable to
dynamical shifts may be explained by the nonlocal deter-mination of R coupled with nonuniform changes of tem-perature as climate warms. Numerous studies show thatspecific humidity is determined approximately by the mostrecently experienced saturation value [Sherwood, 1996b;Pierrehumbert and Roca, 1998] so relative humidity isdetermined by the difference between current and last‐
saturation temperature and pressure. If last saturation (LS)events for a given target location tend to be far away, thisallows R to change either because this distance changes orbecause the temperature difference between LS and targetpoints change.[29] Most air in the TU was last saturated in deep con-
vective outflow regions, which tend to move upward asclimate warms so that their temperature does not keep upwith that in the upper troposphere itself. The resulting,negative dR was noted by Mitchell and Ingram [1992] andinvestigated more recently by Minschwaner and Dessler[2004] using a one‐dimensional equilibrium mass‐fluxmodel. (Their study also analyzed observed variations, butthese were dominated by El Niño–Southern Oscillation(ENSO), a poor analog for global warming [Lu et al.,2008].) Predicted dR was large: roughly −5% K−1 of trop-ical convective‐region SST, equivalent to at least −3% K−1
on the basis of the global‐mean temperature according totypical GCM warming patterns. This is roughly twice theaverage dR in AR4 GCMs [see Minschwaner et al., 2006].While their simulated dR/dp (approximately 0.2%/hPa) wasalso large; it lies within the range of the GCMs, so their dRwas larger than that implied by the linear relationship inFigure 4a. The GCM dR thus lies between that of a simplepattern shift and that predicted by a 1‐D model. This is nottoo surprising given that the 1‐D model treated convectivedetrainment as a source of saturated air free of condensate(thus with no reevaporation of condensate), ignored anyvapor transports not required by the large‐scale overturningand neglected subsequent condensation in the environmentdue to variable temperatures. Since these processes tend toact as moisture sinks that activate only at sufficiently highR(or sources that act only when it is low), one would expectthem to have a stabilizing influence on R if accounted for.[30] Air in the TL region was last saturated at higher
levels in the troposphere [e.g., Sherwood and Meyer, 2006;Dessler and Minschwaner, 2007]. The tropical warmingincreases with height (approximating a moist adiabat), whilethe rate of reduction in R per K of parcel warming is less athigher temperature (from the C‐C equation); both theserobust and physically based effects will tend to make dR > 0,barring changes in the circulation. Inserting a moist adiabaticlapse rate change (1% K−1) and T2 increase of 0.7% K−1 intothe simple distribution of R calculated by Sherwood et al.[2006] yields a dR ∼ 0.5% K−1, near the average GCM pre-diction. This could change by a factor of several with rea-sonable circulation changes due to the sensitivity of the resultto small changes in the time scales involved [Sherwood et al.,2006] and will depend on where last‐saturation occurs, whichmay explain the lack of GCM consensus in this region.[31] The most interesting region is the subtropics, where
there is a definite (though variable) drying signal indepen-dent of Hadley cell expansion. Due to the steep slope ofmidlatitude isentropes, subtropical air often was last satu-rated near the extratropical tropopause [Galewsky et al.,2005] where temperatures rise less than in the troposphere(or even fall) as climate warms. This would tend to push dRtoward negative values, as could any diffusive or shallow‐convective transport of water from near the surface wherewarming is also slightly slower. However, some last‐saturationlocations for tropospheric subtropical air also occur fartheraloft in the tropics [Dessler and Minschwaner, 2007]; since
Figure 6. (a) Mean R at 500 hPa in the AR4 models intoday’s climate (solid line) and with 2 K of warming(dashed line). (b) Latitudinal shift rate required to accountfor the data in Figure 6a.
SHERWOOD ET AL.: RELATIVE HUMIDITY AND WARMING D09104D09104
8 of 11

warming rates increase with height in the tropics, thiswould tend to push dR toward positive values. Finally, to theextent that dehydration occurs locally, this should push dRtoward zero if local temperature variability is not stronglyclimate sensitive. Thus we expect dR to be sensitive to wheredehydration tends to occur in a particular model.[32] One may also expect spatial gradients of R to be
similarly affected. For example, if last saturation occursgeographically locally with relatively little unsaturated lati-tudinal transport, then climatological R might be relativelysimilar across latitudes; with robust diathermal transports ofdry air, on the other hand, large latitudinal variations in Rwould become possible given the widely varying eddyregimes, for example, traversing the subtropical jet region.Such synoptic transports are likely to be more vigorous inmodels with horizontal grids capable of fully resolving themand do not appear to be easily resolved in at least some coarsermodels [Bauer and Del Genio, 2006]. A common rule ofthumb in computational fluid dynamics (often forgotten inatmospheric modeling) is that one needs 10 grid points toresolve a feature; this would imply that to fully resolvesynoptic eddies or jets of 1000 km scale would require a100 km mesh, which roughly accords with the convergenceresolution found here [see also Orlanski, 2008].[33] In view of this argument, the correlations of dR,rR,
and model resolution found here are intriguing. The fidelityof moisture transports, and effects on R distributions andtheir climate sensitivity, are worthy of further investigation.
6. Effects on Clouds and Radiation
[34] Casual comparison of Figure 2with IntergovernmentalPanel on Climate Change–published changes in cloud coverin the same models [Meehl and Stocker, 2007, Figure10.10]reveals detailed agreement between the patterns of change
in relative humidity and cloud cover above the boundarylayer. Similarities in changes in these fields, noted in earlyGCM studies [e.g.,Wetherald and Manabe, 1980], evidentlypersists today despite advances in cloud parameterization,although model averages mask some deviations in individualmodels due, for example, to cloud phase changes [Tsushimaet al., 2006]. Changes in R were similar when cloud coverwas prescribed [Wetherald and Manabe, 1980], confirmingthat model cloud changes are mainly driven byR rather thanthe reverse. This is not surprising since cloudiness in modelsis typically predicted based at least in part on the local relativehumidity. Such model physics should hold for trends as wellas for smaller‐scale variations.[35] We regressed midlatitude (30°–60°S or N) monthly
mean model cloud forcing ontoR (separately for each monthof the year) to estimate the impact on the global energy budgetof a given change in midlatitude relative humidity. As this isthe sum of long‐wave and short‐wave effects of oppositesign that each intensify with R (e.g., Figure 7), it is not sur-prising that there is no consensus among the AR4 models,with results ranging from −0.15 to +0.25 W m−2 per % RH.Given the decreases in annual mean R reported above oforder 1% K−1 of surface warming for global warming simu-lations, this would imply feedback contributions of −0.15 to+0.25 W m−2 K−1 on global climate if the R‐cloud relation-ship held for warming. Similar positive feedbacks are likelythrough the UT/LS midlatitude cloud, due to the increasesin humidity there. These would contribute significantly tooverall cloud feedback, which ranges from roughly 0–1.0 W m−2 K−1 in the AR4 GCMs [Soden and Held, 2006].[36] We expect that these cloud cover changes will be
underestimated in models with insufficient resolution.Indeed, one recent climate simulation at very high resolutionhas produced an unusually strong increase in high cloud cover(Tsushima et al., unpublished manuscript, 2009). Althoughthis particular result requires further analysis, it highlightsthe possibility that stronger feedbacks may become possiblewhen synoptic motions are fully resolved. Having said this,we did not find either long‐wave or short‐wave global‐mean cloud feedbacks to be significantly correlated withmodel resolution or dR, but this does not rule out moresubtle effects, including the effects of regional variations incloud forcing or effects that require a resolution threshold tobe reached. Clearly, the above calculations only scratchthe surface, and much could be done to better understandhow clouds and water vapor are related in models andobservations.
7. Discussion and Conclusions
[37] We find that modeled changes in relative humidity(dR) occur in a robust pattern but that their amplitude variessignificantly. We have investigated this pattern quantitative-ly. In most places it varies in rough proportion to latitudinal orvertical gradients in the background R field. Outside thetropics, these gradients—hence, the R changes—correlatewith model resolution. Many aspects cannot be evaluatedwith current observations, but horizontal R gradients appearto have converged and to be consistent with what observa-tions there are, once model grids reach 2° or so. In modelswith coarser horizontal resolution, humidity fields are oftentoo smooth and dR smaller. In particular, the low resolutions
Figure 7. Relationship in one AR4 GCM (HadCM3)between interannual variations in cloud shortwave forcing(net reflection of sunlight to space) and relative humidityat 700 hPa in the Southern Hemisphere midlatitudes (30°–60°S) during December (asterisks) and February (plusses)of the first 10 years of the 1%/yr simulation.
SHERWOOD ET AL.: RELATIVE HUMIDITY AND WARMING D09104D09104
9 of 11

(e.g., T31) typical of past global, coupled paleoclimatesimulations are unlikely to properly capture humiditybehavior. With predicted cloud changes driven by those ofrelative humidity, this may limit the ability of low‐resolutionmodels to correctly simulate regional climate feedbacks,although we find no evidence that global‐mean cloud orwater vapor feedbacks are resolution dependent.[38] The dR pattern appears to result only partly from
well‐known upward and poleward expansions of simulatedcirculation features. Changes in the subtropics and belowthe tropical tropopause are 2–3 times too large for thisexplanation, and subtropical R minima deepen in all but afew coupled models under climate warming. We suggestthat this is because air in these regions tends to have beenlast saturated elsewhere in locations that do not warm as fast,with this effect being stronger in models where synoptictransport across mean isothermal surfaces is more vigorous.A similar effect has been simulated for the tropical uppertroposphere and would explain both the relation of dR tosimulated climatological gradients and to model horizontalresolution. We have not tested this hypothesis directly,which ideally would exploit dedicated runs of a modelequipped with suitable tracers of transport such as those ofGalewsky et al. [2005].[39] Our results are relevant to previous findings that
“widening of the tropics” (poleward shift of subtropicalfeatures) is several times too weak in models compared toobservations [Seidel and Randel, 2007], that the observedtrends appear to lie well outside modeled decadal variability[Johanson and Fu, 2009], but that the discrepancy could bedue to under prediction of direct radiative forcing of ozoneor CO2 changes [Lu et al., 2009]. We also find that pre-dicted, warming‐induced trends in subtropical R are severaltimes too small, corroborating that a discrepancy exists—butwe also find that the model trends are due mostly tomechanisms other than tropical widening. This complicatesthe discussion and suggests a possible link between themechanisms controlling tropical widening and dehydration,even if the observed trend is not due to warming. Radiativeforcings that cool the stratosphere as the troposphere warms,thereby driving circulation changes, could also contributeindependently to dR by cooling the regions where some air isdehydrated, so we cannot rule out this explanation for thediscrepancy. Further work should investigate controls onsubtropical moisture and their possible connections to theHadley cell characteristics—especially since reductions insubtropical relative humidity may directly or indirectlyenhance the regional precipitation and/or cloud changescaused by shifting climate zones.
[40] Acknowledgments. S.C.S. completed part of this work whilesupported as a visitor to the Hadley Centre and was supported by NSFATM‐0453639; M.R. and W.I. were suppored by the ICP. We thankC. Mears for providing precipitable water data, E. R. Kursinski for pro-viding GPS data, and J.‐H. Chae for providing average R from MLS.The NUGAM model was developed as part of the UK‐Japan ClimateCollaboration project, supported by the Foreign and Commonwealth OfficeGlobal Opportunities Fund, and is funded by the Joint DECC, Defra andMoD Integrated Climate Programme–DECC/Defra (GA01101), MoD(CBC/2B/0417Annex C5). TheNUGAM integration described in this articlewas performed using the Japanese Earth Simulator supercomputer under thesupport of JAMSTEC. We acknowledge the modeling groups, the Programfor Climate Model Diagnosis and Intercomparison (PCMDI), and theWCRP’s Working Group on Coupled Modeling (WGCM) for their roles
in making available the WCRP CMIP3 multimodel data set. Support of thisdata set is provided by the Office of Science, U.S. Department of Energy.We also thank the NASAGoddard ESDISC for making AIRS data available.
ReferencesArrhenius, S. (1896), On the influence of carbonic acid in the air upon thetemperature of the ground, Philos. Mag., 41, 237–276.
Bates, J. J., and D. L. Jackson (2001), Trends in upper‐tropospherichumidity, Geophys. Res. Lett., 28, 1695–1698.
Bauer, M., and A. D. Del Genio (2006), Composite analysis of wintercyclones in a GCM: Influence on climatological humidity, J. Clim., 19,1652–1672.
Bony, S., et al. (2006), How well do we understand and evaluate climatechange feedback processes?, J. Clim., 19, 3445–3482.
Brierly, C. M., A. V. Fedorov, Z. Liu, T. D. Herbert, K. T. Lawrence,and J. P. La Riviere (2009), Greatly expanded tropical warm pooland weakened Hadley circulation in the early Pliocene, Science, 323,1713–1718.
Derbyshire, S. H., I. Beau, P. Bechtold, J.‐Y. Grandpeix, J.‐M. Pirou, J.‐L.Redelsperger, and P. Soares (2004), Sensitivity of moist convection toenvironmental humidity, Q. J. R. Meteorol. Soc., 130, 3055–3079.
Dessler, A. E., and K. Minschwaner (2007), An analysis of the regulationof tropical tropospheric water vapor, J. Geophys.Res., 112(D10), 120.
Fetzer, E. J., et al. (2008), Comparison of upper tropospheric water vaporobservations from the microwave limb sounder and atmospheric infraredsounder, J. Geophys. Res., 113, D22110, doi:10.1029/2008JD010000.
Froidevaux, L., et al. (2006), Early validation analyses of atmospheric pro-files from EOS MLS on the Aura satellite, IEEE Trans. Geosci. RemoteSens., 44, 1106–1121.
Galewsky, J., A. Sobel, and I. Held (2005), Diagnosis of subtropicalhumidity dynamics using tracers of last saturation, J. Atmos. Sci.,62, 3353–3367.
Hajj, G. A., C. O. Ao, B. A. Iijima, D. Kuang, E. R. Kursinski, A. J.Mannucci, T. K. Meehan, T. P. Y. L. J. Romans, and M. de la TorreJuarez (2004), CHAMP and SAC‐C atmospheric occultation resultsand intercomparisons, J. Geophys. Res., 109, D06109, doi:10.1029/2003JD003909.
Hartmann, D. L., and K. Larson (2002), An important constraint on tropicalcloud–climate feedback, Geophys. Res. Lett., 29(20), 1951, doi:10.1029/2002GL015835.
Hu, Y., and Q. Fu (2006), Observed poleward expansion of the Hadley cir-culation since 1979, Atmos. Chem. Phys., 7, 5229–5236.
Ingram, W. J. (2002), On the robustness of the water vapor feedback: GCMvertical resolution and formulation, J. Climate, 15, 917–921.
Intergovernmental Panel on Climate Change (2007), Working Group I: ThePhysical Science Basis of Climate Change, Cambridge University Press,New York.
Johanson, C., and Q. Fu (2009), Hadley cell widening: Model simulationsvs. observations, J. Clim., 22, 2713–2725.
Johns, T. C., et al. (2006), The new Hadley Centre Climate Model(HadGEM1): Evaluation of coupled simulations, J. Clim., 19,1327–1353.
Kushner, P. J., I. M. Held, and T. L. Delworth (2001), Southern Hemi-sphere atmospheric circulation response to global warming, J. Clim.,14, 2238–2249.
Lu, J., G. A. Vecchi, and T. Reichler (2007), Expansion of the Hadley cellunder global warming, Geophys. Res. Lett., 34, L06805, doi:10.1029/2006GL028443.
Lu, J., G. Chen, and D. M. W. Frierson (2008), Response of the zonal meanatmospheric circulation to El Niño versus global warming, J. Clim., 21,5835–5851.
Lu, J., C. Deser, and T. Reichler (2009), Cause of the widening of the trop-ical belt since 1958, Geophys. Res. Lett., 36, L03803, doi:10.1029/2008GL036076.
Manabe, S., and R. T. Wetherald (1967), Thermal equilibrium of the atmo-sphere with a given distribution of relative humidity, J. Atmos. Sci., 24,241–259.
Meehl, G. A., and T. F. Stocker (2007), Global climate projections, inWorking Group I: The Physical Science Basis of Climate Change,pp. 747–845, Cambridge University Press, Cambridge, UK.
Minschwaner, K., and A. E. Dessler (2004), Water vapor feedback in thetropical upper troposphere: Model results and observations, J. Clim.,17, 1272–1282.
Minschwaner, K., A. E. Dessler, and P. Sawaengphokhai (2006), Multi-model analysis of the water vapor feedback in the tropical upper tropo-sphere, J. Clim., 19, 5455–5464.
Mitchell, J. F. B., and W. J. Ingram (1992), Carbon dioxide and climate:Mechanisms of changes in cloud, J. Clim., 5, 5–21.
SHERWOOD ET AL.: RELATIVE HUMIDITY AND WARMING D09104D09104
10 of 11

Miura, H., H. Tomita, T. Nasuno, S. Iga, M. Satoh, and T. Matsuno (2005),A climate sensitivity test using a global cloud resolving model under anaqua planet condition, Geophys. Res. Lett., 32, L19717, doi:10.1029/2005GL023672.
O’Gorman, P. A., and T. Schneider (2009), Scaling of precipitationextremes over a wide range of climates simulated with an idealizedGCM, J. Clim., 22, 5676–5685.
Orlanski, I. (2008), The rationale for why climate models should adequatelyresolve the mesoscale, High Res. Numer. Mod. Atm. Ocean, YokohamaInst Earth Sci, Springer, p. 29, proceedings of the International Workshopon High Resolution Modeling.
Pierrehumbert, R. T., and R. Roca (1998), Evidence for control of Atlanticsubtropical humidity by large scale advection,Geophys. Res. Lett., 25(24),4537–4540.
Previdi, M., and B. G. Liepert (2007), Annular modes and Hadley cellexpansion under global warming, Geophys. Res. Lett., 34, L22701,doi:10.1029/2007GL031243.
Redelsperger, J. L., D. B. Parsons, and F. Guichard (2002), Recovery pro-cesses and factors limiting cloud‐top height following the arrival of adry intrusion observed during TOGA COARE, J. Atmos. Sci., 59,2438–2457.
Santer, B. D., et al. (2003), Contributions of anthropogenic and naturalforcing to recent tropopause height changes, Science, 301, 479–483.
Satoh, M., T. Matsuno, H. Tomita, H. Miura, T. Nasuno, and S. Iga (2008),Nonhydrostatic icosahedral atmospheric model (NICAM) for globalcloud resolving simulations, J. Computat. Phys., 227, 3486–3514.
Seidel, D. J., and W. J. Randel (2007), Recent widening of the tropical belt:Evidence from tropopause observations, J. Geophys. Res., 112, D20113,doi:10.1029/2007JD008861.
Seidel, D. J., Q. Fu, W. J. Randel, and T. J. Reichler (2008), Widening ofthe tropical belt in a changing climate, Nature Geosci., 1, 21–24.
Shaffrey, L., et al. (2010), UK‐HiGEM: The new UK High ResolutionGlobal Environment Model–Model description and basic evaluation,J. Clim., 22, 1861–1896.
Sherwood, S. C. (1996a), Maintenance of the free‐tropospheric tropicalwater vapor distribution, Part I: Clear regime budget, J. Clim., 9,2903–2918.
Sherwood, S. C. (1996b), Maintenance of the free‐tropospheric tropicalwater vapor distribution, Part II: Simulation by large‐scale advection,J. Clim., 9, 2919–2934.
Sherwood, S. C., and C. L. Meyer (2006), The general circulation and robustrelative humidity, J. Clim., 19, 6278–6290.
Sherwood, S. C., E. R. Kursinski, and W. G. Read (2006), A distributionlaw for free‐tropospheric relative humidity, J. Clim., 19, 6267–6277.
Soden, B. J., and I. M. Held (2006), An assessment of climate feedbacks incoupled ocean‐atmosphere models, J. Clim., 19, 3354–3360.
Tomita, H., and M. Satoh (2004), A new dynamical framework of non-hydrostatic global model using the icosahedral grid, Fluid Dyn. Res.,34, 357–400.
Tsushima, Y., et al. (2006), Importance of the mixed‐phase cloud distribu-tion in the control climate for assessing the response of clouds to carbondioxide increase: a multi‐model study, Climate Dyn., 27, 113–126.
Vecchi, G. A., and B. J. Soden (2007), Global warming and the weakeningof the tropical circulation, J. Clim., 20, 4316–4340.
Wentz, F. J., L. Ricciardulli, K. Hilburn, and C. Mears (2007), How muchmore rain will global warming bring?, Science, 317, 233–235.
Wetherald, R. T., and S.Manabe (1980), Cloud cover and climate sensitivity,J. Atmos. Sci., 37, 1485–1510.
W. Ingram and M. Roberts, Met Office Hadley Centre, Exeter, UK.P. A. O’Gorman, Department of Earth, Atmospheric and Planetary
Sciences, Massachusetts Institute of Technology, Cambridge, MA 02139, USA.M. Satoh and Y. Tsushima, JAMSTEC Frontier Research Center for
Global Change, Yokohama City, Japan.S. Sherwood, Climate Change Research Centre, UNSW, Kensington
NSW 2052, Australia. ([email protected])P. L. Vidale, National Centre for Atmospheric Science, University of
Reading, Reading, UK.
SHERWOOD ET AL.: RELATIVE HUMIDITY AND WARMING D09104D09104
11 of 11