Effect of incubation and storage temperatures on quality of set ...
Upload
khangminh22Category
view
9download
0
Contribution to Special Issue: ‘Towards a Broader Perspective on Ocean Acidification Research’
Original Article
Impact of high pCO2 and warmer temperatures on the processof silica biomineralization in the sponge Mycale grandis
Jan Vicente1, Nyssa J. Silbiger2, Billie A. Beckley1, Charles W. Raczkowski3, and Russell T. Hill1*1Institute of Marine and Environmental Technology, University of Maryland Center for Environmental Science, 701 E Pratt St Suite 236,Baltimore, MD 21202, USA2Hawai’i Institute of Marine Biology, University of Hawai’i at Manoa, PO Box 1346, Kane’ohe, HI 96744, USA3Department of Natural Resources, North Carolina A&T State University, Greensboro, NC 27411, USA
*Corresponding author: tel: +1 410 234 8802; fax: +1 410 234 8818; e-mail: [email protected]
Vicente, J., Silbiger, N. J., Beckley, B. A., Raczkowski, C. W., and Hill, R. T. Impact of high pCO2 and warmer temperatures on theprocess of silica biomineralization in the sponge Mycale grandis. – ICES Journal of Marine Science, 73: 704–714.
Received 23 April 2015; revised 10 November 2015; accepted 13 November 2015; advance access publication 18 December 2015.
Siliceous sponges have survived pre-historical mass extinction events caused by ocean acidification and recent studies suggest that siliceous spongeswill continue to resist predicted increases in ocean acidity. In this study, we monitored silica biomineralization in the Hawaiian sponge Mycalegrandis under predicted pCO2 and sea surface temperature scenarios for 2100. Our goal was to determine if spicule biomineralization was enhancedor repressed by ocean acidification and thermal stress by monitoring silica uptake rates during short-term (48 h) experiments and comparing bio-mineralized tissue ratios before and after a long-term (26 d) experiment. In the short-term experiment, we found that silica uptake rates were notimpacted by high pCO2 (1050 matm), warmer temperatures (278C), or combined high pCO2 with warmer temperature (1119 matm; 278C) treat-ments. The long-term exposure experiments revealed no effect on survival or growth rates of M. grandis to high pCO2 (1198 matm), warmer tem-peratures (25.68C), or combined high pCO2 with warmer temperature (1225 matm, 25.78C) treatments, indicating that M. grandis will continue toprosper under predicted increases in pCO2 and sea surface temperature. However, ash-free dry weight to dry weight ratios, subtylostyle lengths, andsilicified weight to dry weight ratios decreased under conditions of high pCO2 and combined pCO2 warmer temperature treatments. Our resultsshow that rising ocean acidity and temperature have marginal negative effects on spicule biomineralization and will not affect sponge survival ratesof M. grandis.
Keywords: marine sponges, Mycale grandis, ocean acidification, silica biomineralization, silica uptake, spicules.
IntroductionSkeleton mineralogy plays an important role in the sensitivityof marineinvertebrates to ocean acidification and warming. Calcifying organismsare particularly vulnerable to rising ocean acidity and temperatures(Hoegh-Guldberg et al., 2007; Fabry et al., 2008; Hofmann et al.,2010), but non-calcifying organisms such as siliceous sponges arethought to be less affected (Bell et al., 2013). Studies testing the physio-logical response of calcifying and non-calcifying organisms to oceanacidification have led to predictions about which invertebrates willdominate in tropical, benthic ecosystems in a more acidified ocean.For example, small-scale benthic community shifts have been reportedin pH gradients caused by natural volcanic CO2 seeps of Papua NewGuinea (Morrow et al., 2014), where a transition from coral to
sponge dominance was observed with closer proximity to the seep(higher pCO2). Large-scale shifts of coral to sponge-dominated reefsare already being observed in coral reefs of the Caribbean (Diaz andRutzler, 2001; Pawlik, 2011; Loh et al., 2015; McMurray et al., 2015).Transitions from coral to sponge-dominated reefs may cause carbonrelease rates to increase (de Goeij et al., 2013) which could play an im-portant role in structuring higher trophic levels of the ecosystem(Silveira et al., 2015). Because of results from these studies andothers, predicting the impact of ocean acidification and warming onsponges is gaining considerable attention (Duckworth et al., 2012;Webster et al., 2013; Goodwin et al., 2014; Stubler et al., 2014).
Sponge skeletons can be composed of calcium carbonate, silica,or collagen fibres (Hooper and Van Soest, 2002). Like corals,
# International Council for the Exploration of the Sea 2015. All rights reserved.For Permissions, please email: [email protected]
ICES Journal of
Marine ScienceICES Journal of Marine Science (2016), 73(3), 704–714. doi:10.1093/icesjms/fsv235
Dow
nloaded from https://academ
ic.oup.com/icesjm
s/article/73/3/704/2459091 by guest on 03 June 2022
calcifying sponges are vulnerable to dissolution when exposed tolower pH levels (Smith et al., 2013), but siliceous and collagenoussponges are believed to resist dissolution in more acidified oceanconditions (Bell et al., 2013). For example, growth and survivalrates in six Caribbean sponges with skeletons composed of silicaand collagen fibre were not affected by a 24-d exposure period toincreased ocean acidity and temperatures relative to ambient condi-tions (Duckworth et al., 2012). In fact, studies have shown that somesponges may even benefit from predicted ocean acidification condi-tions; bioerosion rates from clionid boring sponges increased in lowpH treatments relative to controls (Wisshak et al., 2012, 2013;Stubler et al., 2014; Enochs et al., 2015). Despite the number ofstudies showing an increase in bioerosion by marine sponges andno detrimental impacts on sponges under high CO2 scenarios,little is known about the response of sponge morphology or skeletonsynthesis to warmer and more acidic conditions.
Like ocean acidification, thermal tolerance may vary across spongespecies with different skeletal compositions. In the Caribbean and inthe Mediterranean Sea, warmer seawater temperatures have causedlocal extinction events in keratose (aspiculated) sponges (Vicente,1989; Cebrian et al., 2011). In mesocosm studies, thermal stresscaused necrosis and eliminated key bacterial symbionts from the ker-atose sponge Rhopaloeides odorabile at 338C (Webster et al., 2008).While several species of keratose sponges are sensitive to warmer tem-peratures, spiculated sponges are able to tolerate these conditions andactually accelerate their attachment rates to substrates (Duckworthet al., 2012). However, studies that measure thermal tolerance ofsponges have not considered whether resistance to thermal stressby sponges correlates with a particular skeleton type. Looking atthe process of siliceous skeleton synthesis under high pCO2 andwarmer temperatures will help us understand whether sponges witha siliceous skeleton could be at an advantage under different pCO2
and temperature regimes.Many studies support the hypothesis that siliceous sponges will
adapt to ocean acidification (Duckworth and Peterson, 2012;Duckworth et al., 2012; Wisshak et al., 2012; Stubler et al., 2014);however, it is not clear whether having a siliceous skeleton is actuallyan advantageous trait for sponges under these conditions. Silicauptakes rates for sponges with a siliceous skeleton are believedto follow a Michaelis–Menten kinetic model and are also heavily de-pendent on silica concentrations—silica uptake rates increase expo-nentially when exposed to higher silica concentrations (Maldonadoet al., 2012b). Other environmental factors such as high nutrientsin upwelling habitats influence the shape and size of spicules (Urizet al., 2003). Although the process by which silica is taken upremains speculative, there is a preliminary model that suggests thatsilicate assimilated by the sponge Suberites domuncula for spicule syn-thesis is co-transported through sclerocyte cells with a Na+- HCO3
−
symporter protein (Schroder et al., 2004). Polycondensation of silicain S. domuncula primmorph cells occurs within vesicles by silicateinproteins in the intracellular space of sclerocytes where the axial fila-ment of a spicule is formed (Wang et al., 2012). Fibrils then associatewith one end of the spicule and extrude it out of the cell where silicatecontinues to deposit in layers around the axial filament. Mycalegrandis may have a similar mechanism of silica uptake to S. domun-cula because these two sponges belong to the same class and bothhave densely spiculated skeletons. If all siliceous Demosponges use aNa+- HCO3
− symporter mechanism to take up Si(OH)4 throughthe cell membrane, we speculate that siliceous sponges may benefitfrom high pCO2 during spicule synthesis. In addition, the chemicalequilibrium shift of dissolved silica (DSi) caused by high pCO2
will favour the speciation of Si(OH)4 and HCO3− which could
make Si(OH)4 and HCO3− substrates more available for the
Na+- HCO3− symporter protein to transport and facilitate uptake
of silica through the cell membrane (Zeebe and Wolf-Gladrow,2001).
In this study, we used end of the century pCO2 (1100 ppm) andtemperature (+38C) values from the Representative ConcentrationPathway (RCP) 8.5 climate scenario (Riahi et al., 2011) to test theimpact of rising ocean acidity and temperature on spicule biominer-alization in the Hawaiian invasive sponge M. grandis (Gray, 1867).Mycale grandis was introduced in Kane‘ohe Bay in the mid-1990sand was found aggressively overgrowing the hermatypic coralspecies Montipora capitata and Porites compressa by 2005 (Colesand Bolick, 2007). Studies have shown that M. grandis per centcover doubled in some reefs of Kane‘ohe Bay between 2005 and2006 (Coles et al., 2006). Mycale grandis is a fast-growing spongewith a densely spiculated siliceous skeleton, making it a fittingmodel organism to measure silica uptake and spicule biomineraliza-tion in short periods.
We measured DSi uptake rates usingclosed system 48-h incubationexperiments, exposing individuals of M. grandis to increased tempera-ture (+38C), increased pCO2 (1100 matm), combined increasedpCO2 and temperature (+38C; 1100 matm), and ambient tempera-ture and pCO2 from Kane‘ohe Bay (248C, 580 matm). Sponges werealso exposed to similar conditions during a 26-d flow-through experi-ment to test the impact of high pCO2 and temperature on spiculesynthesis.
Based on the silica uptake models proposed for other siliceoussponges, like S. domuncula, we hypothesize that: (i) treatmentswith pCO2 enrichment will accelerate silica uptake rates of M.grandis resulting in enhanced spicule production and denser skele-tons (more silicification) and (ii) temperature increments of 38Cwill increase silica uptake rates through increased metabolism(Nwewll and Northcroft, 1967), although there are currently nopublished studies on the impacts of temperature on spongespicule production and morphology. This is the first study thataddresses the impact of high pCO2 and thermal stress on theprocess of spicule biomineralization in marine sponges.
MethodsSilica uptake closed system experimentSponge collectionOne sponge piece from each of 72 individuals of M. grandis (wetweight: 4–56 g) was collected with a sterile scalpel around Mokuo Lo‘e (Coconut Island) in Kane‘ohe Bay at a depth of 3–9 m. Weconfirmed that the sponge individuals used for our experimentswere M. grandis by comparing partial sequences of the 18S and28S rRNA genes with those in GenBank. For a full description ofthe phylogenetic analysis, see Supplementary Figure S1.
Mycale grandis grows as thickly encrusting cushions in betweencoral colonies making it difficult to collect without causing a largearea of injury (injury area size: 1–35 cm2). Brittlestars foundliving on the surface of the sponge tissue were removed to avoidinterference with ash-free dry weight/dry weight (AFDW/DW)ratio calculations. Brittlestars that were embedded deep inside thesponge tissue were left and removed after the experiment to avoidfurther injury to the sponge. To stabilize the sponges in incubationchambers, we gently tied fishing weights (85 g) with small (6 cm) tiewraps around each sponge. Sponge individuals were acclimatedto their intended pH and temperature treatment conditions in
Impact of high pCO2 and warmer temperatures on M. grandis 705
Dow
nloaded from https://academ
ic.oup.com/icesjm
s/article/73/3/704/2459091 by guest on 03 June 2022
flow-through tanks and were allowed to heal for 36 h at backgroundsilica concentrations (6–7 mM).
Silica uptake ratesTo test the impact of high pCO2 and temperature on silica uptake insponges, we used a closed system experimental set-up at the Hawai’iInstitute of Marine Biology (HIMB) mesocosm facility. This facilitywas well suited for our experimental conditions (Putnam, 2012;Silbiger and Donahue, 2015). All experiments were performedbetween March and May 2014.
Incubation chambers(plasticbuckets) were prepared with 4 l of fil-tered seawater (3 mm pore size Pentair bag filter) and a water pump toensure a well-mixed system. Chambers were sealed with Saranw wrapwith clips to prevent evaporation and off-gassing. In each incubationchamber, pCO2 was maintained by bubbling in CO2 or CO2-free airwith airlines equipped with air-stones. A gas blending system wasused to manipulate pCO2 by mixing pure CO2 -free atmosphericair with pure CO2 using mass flow controllers (C100L SierraInstruments). pCO2 conditions were controlled using a calibratedCO2 analyzer (A151, Qubit System) that measured the output CO2
going into each chamber. pCO2 conditions were monitored andadjusted every 8 h. Temperature was controlled with dual-stagetemperature controllers (Aqualogic TR115DN) and aquariumheaters. An LED system (AI Sol, 72 W 100–240 VAC/50–60 Hz, C2Development Inc., Ames, IA, USA) was used to control lighting.Lights were set over each tank and were switched on at sunrise(06:15), and ramped up for 4 h until 600 mmol photons m22 s21
irradiance was reached which resembled similar conditions to thereefs in Kane‘ohe Bay. Irradiance was held at maximum for 4 hbefore ramping down to zero by sunset (18:15; Gibbin et al., 2015).All buckets, air-stones, air lines, and water pumps were pre-cleanedwith 5% hydrochloric acid (HCl) and rinsed with DI water beforeevery experiment.
Wehadfourexperimental treatments: control (C; 248C, 593 matm),high temperature(T;+38C),highpCO2 (pCO2;1050 matm),andhightemperature and pCO2 (pCO2T; +38C, 1119 matm; Table 1,Supplementary Table S1 and Supplementary Figure S2). The condi-tions closely simulated ambient Kane‘ohe Bay conditions (Silbigerand Donahue, 2015) and future temperature and pCO2 values pre-dicted by 2100 (+38C, 1100 ppm; Riahi et al., 2011). A+38C tempera-ture increase also closely resembles sea surface temperature values forsummer in Kane‘ohe Bay. Treatments were randomly assigned to incu-bation chambers. Incubation chambers were preconditioned for 12 hwithout sponges until the desired pCO2 and temperature conditionswere achieved: experiments began only when parameters were consist-ent across all incubation chambers. Sponges were rinsed with filteredseawater to remove any diatom contamination and transferred fromtheir flow-through acclimation tank to the incubation chamber.Sponges were acclimated to incubation chamber conditions for12 h before each experimental run. Background silica concentrations(6–7 mM) were calculated for each bucket before the start of each ex-periment. After incubation chambers were at the desired pCO2 andtemperature conditions, they were enriched with 45–50 mg ofsodium hexafluorosilicate to bring the DSi concentration to 60–70 mM in each bucket. We chose to increase the silica concentrationrather than using background concentrations to increase the likeli-hood of finding detectable differences in silica uptake over the shortperiod of the experiment. The experiment was run four times. Onthe first run, we used three incubation chambers (replicates) per treat-ment. On runstwo, three, andfour, weused four incubationchambers(replicates) per treatment in each run resulting in a total of
15 replicates per treatment. A 48-h period was chosen to assure thatthe absorbed silica was biomineralized into spicules and thatsponges did not starve (Weissenfels, 1981; Maldonado et al., 2011).We added an additional no-sponge control to test for silica uptakefrom diatoms in the filtered seawater (Supplementary Figure S3).We analysed silica concentration in empty incubation chambers foreach treatment (3 per treatment) during each experimental run. Toexamine silica uptake rates of M. grandis at normal silica concentra-tions (6 mM DSi), we ran eight uptake experiments with spongesheld at control temperature and pCO2 concentrations. Salinity, tem-perature, pHt, and DSi were monitored every 8 for 48 h. Total alkalin-ity (AT) samples (250 ml) were collected from the pre-filteredseawater before the start of each experiment and subsequentsamples were taken from individual incubation chamber after the48-h period.
After each experiment, we recorded the sponge wet weight on ananalytical scale and sponge volume via volume displacement. To cal-culate size of injury (cm2) per individual, we took photographs ofeach individual and analysed them in ImageJw (Abramoff et al.,2004; http://imagej.nih.gov/ij/). Samples were then combusted(5008C) for 12 h to determine the AFDW.
Silica uptake rates were normalized to sponge volume (ml),AFDW (g), and injury area (cm2) caused by the incision producedat the time of collection. Sponge volume and AFDW have previouslybeen used to determine uptake rates from sponges (Maldonado et al.,2011, 2012a). The size of injury was considered an additional variableas sponge silica uptake rates are shown to increase when sponges areinjured (Ayling, 1983; Maldonado et al., 2011). Sponges that showedsigns of necrosisor incubation chambers that showed signsof diatoms(dramatic DSi uptake) at the end of the experiment were discardedand were not used in the statistical analysis. Uptake rates were calcu-lated at each 8 h interval [Uptake ¼ (DSit2,i 2 DSit1,i)/(time × Vi)],where DSi is the concentration of dissolved Si inmmol from sponge i,t1 the first time point, t2 the second time point, time the time betweencollections in hours, and V the volume of water in the bucket forsponge i. Total uptake rates across 48 h were also calculated forsponges exposed to each treatment by calculating the difference insilica concentrations between 0 and 48 h.
Flow-through system experimentSponge collectionSponge pieces from individuals (n¼ 72) of M. grandis (wet weight: 29–263 g) were collected around Moku o Lo‘e (Coconut Island) inKane‘ohe Bay at a depth of 3–9 m. Sponge samples were acclimatedto aquaria facilities with ambient Kane‘ohe Bay seawater for 3 weeksbefore the experiment. Sponges were tagged with pigeon tags using asmall tie wrap. The morphological characteristics used to determinespicule biomineralization were spicule size dimensions (L × W),ash-free dry weight to dry weight (AFDW/DW) ratios, and silicifiedweight to dry weight (SIW/DW) ratios. One thick section(�500 mm) from the surface of each sponge was cut by hand and col-lected to compare spicule sizes, and six, smaller, 1 cm3 (1–2 g) sectionswere cut from each individual to calculate AFDW/DW and SIW/DWratios in triplicate. To determine SIW/DW, we exposed sponge tissuesto 5% hydrofluoric acid (HF). All incisions were performed next to eachother to reduce potential variance of spicule types or silica densities inthe irregular sponge body.
All samples for spicule measurements, AFDW/DW, and SIW/DW ratio analyses were collected again using the same methods atthe end of the experiment (day 26) to compare morphological
706 J. Vicente et al.
Dow
nloaded from https://academ
ic.oup.com/icesjm
s/article/73/3/704/2459091 by guest on 03 June 2022
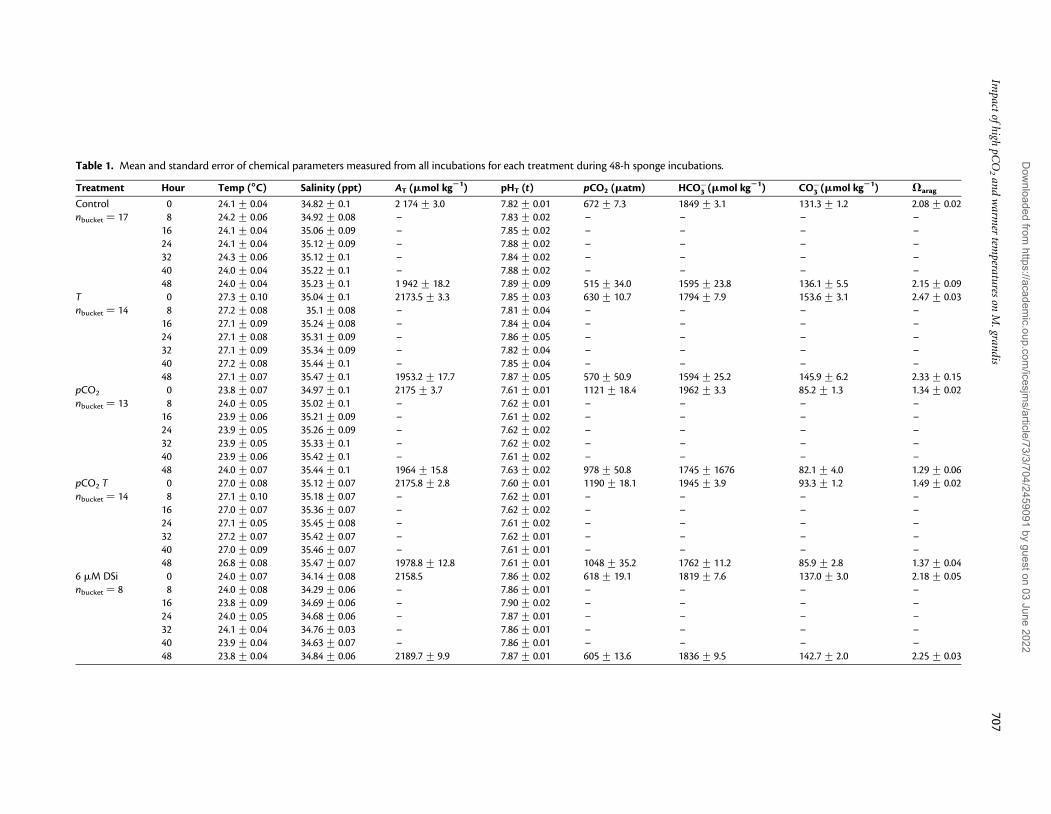
Table 1. Mean and standard error of chemical parameters measured from all incubations for each treatment during 48-h sponge incubations.
Treatment Hour Temp (88888C) Salinity (ppt) AT (mmol kg21) pHT (t) pCO2 (matm) HCO−3 (mmol kg21) CO−
3 (mmol kg21) Varag
Control 0 24.1+ 0.04 34.82+ 0.1 2 174+ 3.0 7.82+ 0.01 672+ 7.3 1849+ 3.1 131.3+ 1.2 2.08+ 0.02nbucket ¼ 17 8 24.2+ 0.06 34.92+ 0.08 – 7.83+ 0.02 – – – –
16 24.1+ 0.04 35.06+ 0.09 – 7.85+ 0.02 – – – –24 24.1+ 0.04 35.12+ 0.09 – 7.88+ 0.02 – – – –32 24.3+ 0.06 35.12+ 0.1 – 7.84+ 0.02 – – – –40 24.0+ 0.04 35.22+ 0.1 – 7.88+ 0.02 – – – –48 24.0+ 0.04 35.23+ 0.1 1 942+ 18.2 7.89+ 0.09 515+ 34.0 1595+ 23.8 136.1+ 5.5 2.15+ 0.09
T 0 27.3+ 0.10 35.04+ 0.1 2173.5+ 3.3 7.85+ 0.03 630+ 10.7 1794+ 7.9 153.6+ 3.1 2.47+ 0.03nbucket ¼ 14 8 27.2+ 0.08 35.1+ 0.08 – 7.81+ 0.04 – – – –
16 27.1+ 0.09 35.24+ 0.08 – 7.84+ 0.04 – – – –24 27.1+ 0.08 35.31+ 0.09 – 7.86+ 0.05 – – – –32 27.1+ 0.09 35.34+ 0.09 – 7.82+ 0.04 – – – –40 27.2+ 0.08 35.44+ 0.1 – 7.85+ 0.04 – – – –48 27.1+ 0.07 35.47+ 0.1 1953.2+ 17.7 7.87+ 0.05 570+ 50.9 1594+ 25.2 145.9+ 6.2 2.33+ 0.15
pCO2 0 23.8+ 0.07 34.97+ 0.1 2175+ 3.7 7.61+ 0.01 1121+ 18.4 1962+ 3.3 85.2+ 1.3 1.34+ 0.02nbucket ¼ 13 8 24.0+ 0.05 35.02+ 0.1 – 7.62+ 0.01 – – – –
16 23.9+ 0.06 35.21+ 0.09 – 7.61+ 0.02 – – – –24 23.9+ 0.05 35.26+ 0.09 – 7.62+ 0.02 – – – –32 23.9+ 0.05 35.33+ 0.1 – 7.62+ 0.02 – – – –40 23.9+ 0.06 35.42+ 0.1 – 7.61+ 0.02 – – – –48 24.0+ 0.07 35.44+ 0.1 1964+ 15.8 7.63+ 0.02 978+ 50.8 1745+ 1676 82.1+ 4.0 1.29+ 0.06
pCO2 T 0 27.0+ 0.08 35.12+ 0.07 2175.8+ 2.8 7.60+ 0.01 1190+ 18.1 1945+ 3.9 93.3+ 1.2 1.49+ 0.02nbucket ¼ 14 8 27.1+ 0.10 35.18+ 0.07 – 7.62+ 0.01 – – – –
16 27.0+ 0.07 35.36+ 0.07 – 7.62+ 0.02 – – – –24 27.1+ 0.05 35.45+ 0.08 – 7.61+ 0.02 – – – –32 27.2+ 0.07 35.42+ 0.07 – 7.62+ 0.01 – – – –40 27.0+ 0.09 35.46+ 0.07 – 7.61+ 0.01 – – – –48 26.8+ 0.08 35.47+ 0.07 1978.8+ 12.8 7.61+ 0.01 1048+ 35.2 1762+ 11.2 85.9+ 2.8 1.37+ 0.04
6 mM DSi 0 24.0+ 0.07 34.14+ 0.08 2158.5 7.86+ 0.02 618+ 19.1 1819+ 7.6 137.0+ 3.0 2.18+ 0.05nbucket ¼ 8 8 24.0+ 0.08 34.29+ 0.06 – 7.86+ 0.01 – – – –
16 23.8+ 0.09 34.69+ 0.06 – 7.90+ 0.02 – – – –24 24.0+ 0.05 34.68+ 0.06 – 7.87+ 0.01 – – – –32 24.1+ 0.04 34.76+ 0.03 – 7.86+ 0.01 – – – –40 23.9+ 0.04 34.63+ 0.07 – 7.86+ 0.01 – – – –48 23.8+ 0.04 34.84+ 0.06 2189.7+ 9.9 7.87+ 0.01 605+ 13.6 1836+ 9.5 142.7+ 2.0 2.25+ 0.03
Impact
ofh
ighpC
O2
and
warm
ertem
peratures
onM
.grand
is707
Dow
nloaded from https://academ
ic.oup.com/icesjm
s/article/73/3/704/2459091 by guest on 03 June 2022
differences before and after exposure to treatments. Thin sectionsfor spicule analysis were made on healed tissue from the first sam-pling incision to ensure that the spicules collected were biominera-lized during the time of the experiment.
Morphological response of M. grandisTo measure morphological differences in silica biomineralization,we used a 26-d, flow-through experimental set-up with similarpCO2 and temperature conditions to the silica uptake experiment.The control conditions were changed to mimic ambient Kane’oheseawater temperature which cooled by 18C at the time of the experi-ment (NOAA.NOS.CO-OPS Moku o Lo’e station 1612480). Thefour treatments were: control (C; 238C, 692 matm), high tempera-ture (T; +38C), high pCO2 (pCO2; 1100 matm), and a combinationof high temperature and pCO2 (pCO2T; +38C, 1100 matm;Table 2, Supplementary Table S1 and Supplementary Figure S4).Ambient water from Kane’ohe Bay passed through a water chiller(Aqualogic Multi Temp MT-1 model no. 2TTB3024A1000AA)and was fed into one of two 150 l header tanks. pCO2 was manipu-lated in each header with gas-lines pumping in pre-mixed pCO2
and then water from each header tank was fed into six 50 l experi-mental tanks (a total of six high CO2 and six control CO2 tanks).Temperature was controlled in each tank with aquarium heatersand dual-stage temperature controllers (Aqualogic TR115DN)similarly to the silica uptake experiment. There were three tankreplicates per treatment in a completely randomized design; sixsponges were placed in each tank for a total of 18 individuals perexperimental treatment. The flow rate in each tank was maintainedat 200 ml min21 with a turnover every 4.2 h. Each incubationchamber was equipped with a submersible power head pump(Sedra KSP-7000 power head) to keep seawater well mixed. Thesame light parameters described in the silica uptake experimentwere used. Temperature, pHT, salinity, and dissolved oxygen ofeach tank were measured daily in each aquarium and seawaterflow was monitored and adjusted twice a day to ensure consistencyfor all tanks. AT and silica concentrations were measured every 3 d(Table 2).
Sponges were weighed with an analytical scale before and after theexperiment byplacing them in a 500 ml beaker withseawater; spongeswere briefly exposed to air during the transfer from the tank to thebeaker (Pawlik et al., 2013). To determine differences in spicule sizeacross treatments, the mean spicule dimensions (L × W) were com-pared before and after exposure to treatments. To measure spiculesizes, sponge sections (n ¼ 18 per treatment) were submerged in1 ml of 65% nitric acid using a 2 ml Eppendorf tube. Tubes were
hand shaken and incubated at room temperature for 24 h. Sampleswere then centrifuged (110g) and supernatant discarded. Pelletswere rinsed with distilled water and a few drops of liquid containingspicules were mounted on a microscope slide. Photographic imagesof 20 subtylostyle spicules per sponge (a total of 360 spicules per treat-ment) were photographed and measured (L × W) using ImageJ.Subtylostyles were chosen as the response variable because theymade up .90% of spicule content.
Triplicate samples collected for AFDW measurements were dried(608C) and weighed until a consistent weight was reached. Dryweights of samples were recorded and samples were then combusted(5008C) for 8–12 h, following the protocol of Maldonado et al.(2012a). To measure desilicification of sponge samples, triplicatesof each individual were dried at 608C until a consistent weight wasreached. Samples were then submerged in HFA (5%) in 15 mlFalcon tubes and incubated at room temperature for 48 h. Sampleswere centrifuged (2700g) and the supernatant was discarded. Thepellets were rinsed with distilled water and centrifuged again. Thesupernatant was discarded and pellets were dried (608C) for 3 d oruntil a consistent weight was reached. To obtain silicified weight,we subtracted the desilicified weight (DSI) and divided by DW toobtain the DSI/DW ratio. To determine treatment differencesbetween AFDW/DW and SIW/DW ratios, the average of eachtriplicate sample for each individual was taken. All averages showeda precision within +0.02 S.E. (standard error). Differences inADFW/DW and SIW/DW ratios were used to examine biominera-lized silica in proportion to the whole mass of the sponge.
Measuring seawater chemistry parametersAll sample vials and stoppers were prewashed with 10% HCl for 24 hand rinsed three times with MilliQ water. Containers for all watersamples collected to measure chemical parameters were rinsedthree times with sampled water before a final sample was taken.
Samples (250 ml) for AT analysis were collected and processedwithin 4 h using open cell potentiometric titrations on a MettlerT50 autotitrator (Dickson et al., 2007). A certified reference material(CRM- Reference Material for Oceanic CO2 Measurements,A. Dickson, Scripps Institution of Oceanography) was run at the be-ginning of each sample set. Titrator accuracy was within +0.8%from the CRM standard and AT measurements were corrected forthis error. The precision was 4.75 mEq (measured as the standard de-viation of the duplicate water samples).
Seawater pH was measured on the total scale. For the open-system experiment, borosilicate glass vials (20 ml) were used totake duplicate pHT samples. Samples were immediately processed
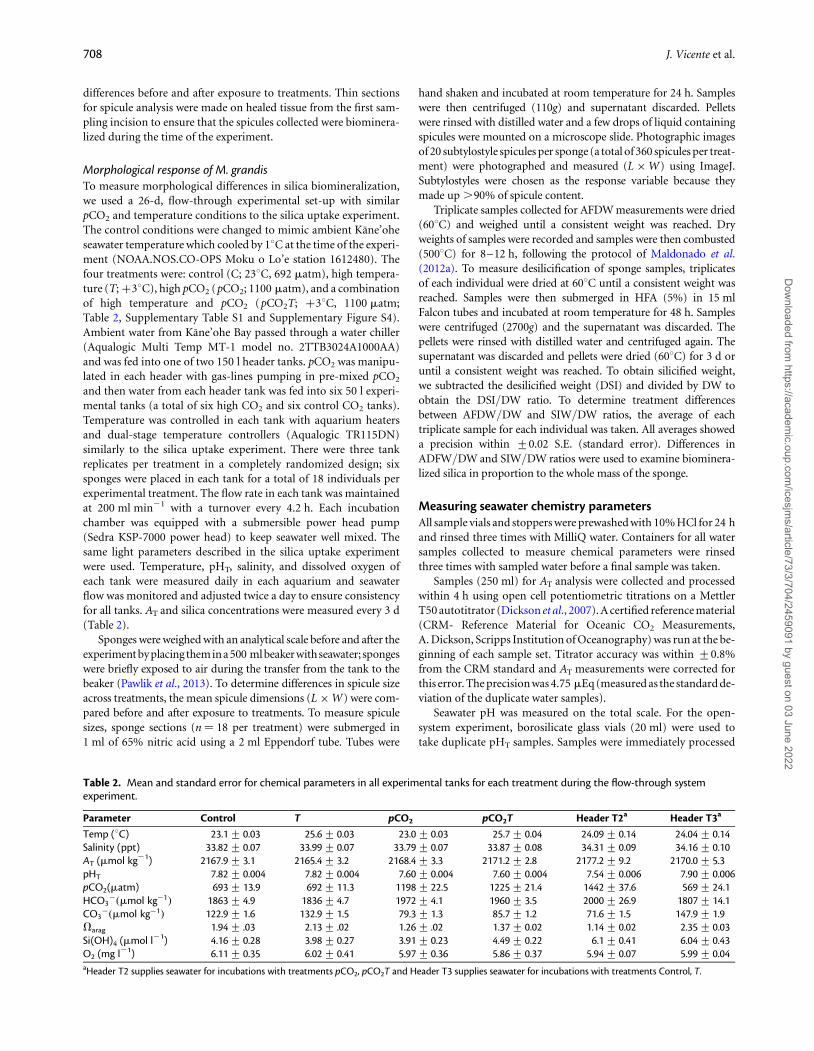
Table 2. Mean and standard error for chemical parameters in all experimental tanks for each treatment during the flow-through systemexperiment.
Parameter Control T pCO2 pCO2T Header T2a Header T3a
Temp (8C) 23.1+ 0.03 25.6+ 0.03 23.0+ 0.03 25.7+ 0.04 24.09+ 0.14 24.04+ 0.14Salinity (ppt) 33.82+ 0.07 33.99+ 0.07 33.79+ 0.07 33.87+ 0.08 34.31+ 0.09 34.16+ 0.10AT (mmol kg21) 2167.9+ 3.1 2165.4+ 3.2 2168.4+ 3.3 2171.2+ 2.8 2177.2+ 9.2 2170.0+ 5.3pHT 7.82+ 0.004 7.82+ 0.004 7.60+ 0.004 7.60+ 0.004 7.54+ 0.006 7.90+ 0.006pCO2(matm) 693+ 13.9 692+ 11.3 1198+ 22.5 1225+ 21.4 1442+ 37.6 569+ 24.1HCO3
−(mmol kg−1) 1863+ 4.9 1836+ 4.7 1972+ 4.1 1960+ 3.5 2000+ 26.9 1807+ 14.1CO3
−(mmol kg−1) 122.9+ 1.6 132.9+ 1.5 79.3+ 1.3 85.7+ 1.2 71.6+ 1.5 147.9+ 1.9Varag 1.94+ .03 2.13+ .02 1.26+ .02 1.37+ 0.02 1.14+ 0.02 2.35+ 0.03Si(OH)4 (mmol l21) 4.16+ 0.28 3.98+ 0.27 3.91+ 0.23 4.49+ 0.22 6.1+ 0.41 6.04+ 0.43O2 (mg l21) 6.11+ 0.35 6.02+ 0.41 5.97+ 0.36 5.86+ 0.37 5.94+ 0.07 5.99+ 0.04aHeader T2 supplies seawater for incubations with treatments pCO2, pCO2T and Header T3 supplies seawater for incubations with treatments Control, T.
708 J. Vicente et al.
Dow
nloaded from https://academ
ic.oup.com/icesjm
s/article/73/3/704/2459091 by guest on 03 June 2022
and brought to a constant temperature of 258C in a water bath. Anm-cresol dye was added to each sample and analysed using a spectro-photometric technique (Dickson et al., 2007). The precision for pHT
measurements was 0.003 pHt units (measured as the standard devi-ation of the duplicate water samples). During the closed systemexperiments, pHT was measured using a Tris calibrated MettlerToledo DG 115-SC pH probe with an Orion 3star pH portablemeter. Calibrations for the pH probe were performed each week fol-lowing the SOP 6a protocol from Dickson et al. (2007). Othercarbon parameters ( pCO2,HCO3
−,CO3−,Varag) were calculated
using the CO2SYS_V2.1 (Lewis et al., 1998) with known pHT, AT,temperature, and salinity values. The K1K2 equilibrium constantswere taken from Mehrbach et al. (1973) and refitted according toDickson and Millero (1987). The HSO4
− dissociation constantsfrom Uppstrom (1974) and Dickson (1990) were used. Dissolvedoxygen measurements in open system experiments were takenusing a ROXTM Optical Dissolved Oxygen mg l21 6150 Sensor inte-grated in a YSI 6920 V2 sonde that was calibrated using the one-point saturated water following standard calibration protocols.Salinity measurements were taken with a YSI conductivity, salinity,temperature meter (model # 30–50), and calibrated using a50 mS cm21 conductivity standard (YSI Catalogue# 3169) follow-ing standard calibration protocols.
Triplicate samples were taken with 15 ml sterile falcon tubes tomeasure DSi concentrations. A Hach ultra low range (0–6 mM)silica reagent set was used to measure DSi for flow-through experi-ments and a Hach low range (20–120 mM) silica test kit was used forclosed system experiments. These two silica test kits with differentdetection limits were used because the open and closed system experi-ments had different silica concentrations. Both of these methodsfollow a molybdate-reactive standard colorimetric method for meas-uring silicate (Grasshoff et al., 2009). Standard curves were generatedbefore each run using a wavelength of 820 nm. Only dilutions thatgenerated a standard curve with an R2 . 0.99 were used to calculateDSi concentrations. Chemical reagents were added at 248C followingthe Hach protocol guidelines. Precision for silica samples was.0.4 mM l21 (measured as the standard deviation of the triplicatewater samples).
Statistical analysisWe used two-way repeated-measures ANOVA to test for differencesin silica uptake rates normalized to three different variables (AFDW,sponge volume, and injury size) across the treatments. Time (each8-h interval over the 48 h experiment), treatment, and the inter-action between time and treatment were included in the analysis.ANOVAs were also done by period for all variables with partitioningof the treatment effect into the pCO2 and temperature main effectsand the interaction between these two factors. Because we had anunbalanced design (i.e. there were missing data points), we used ageneral linear model procedure (Proc GLM). pH, temperature,pCO2, and AT for each 8-h period was also analysed with a two-wayrepeated-measures ANOVA to ensure that treatments were kept atthe intended pH and temperature values. F-tests were performed totest the homogeneity of the error variances obtained in the ANOVAsfor the six periods for both analysis. We removed 12 sponges(Control ¼ 1, pCO2¼ 4, T¼ 3, pCO2T¼ 1, 6 mMDSi ¼ 3) fromthe analysis that showed signs of necrosis, which caused silica concen-trations to increase inside the incubation chamber. A total of 54sponge individuals (Control ¼ 14, pCO2 ¼ 11, T¼ 10, pCO2T¼11, 6 mMDSi ¼ 8) remained healthy throughout the 48-h incubationsand were used in the analysis.
In the flow-through experiment, sponge weight loss, spiculesizes, AFDW/DW, and SIW/DW ratio differences were log-transformed to meet assumptions of normality. We used anANOVA to assess differences in spicule size, AFDW/DW, SIW/DW ratios, pH, temperature, pCO2, and AT across treatments(Control, T, pCO2, and pCO2T) during the 26-d flow-through ex-periment. A two-way ANOVA was run for carbonate chemistryand temperature variables (pH, temperature, pCO2, and AT) usingfactors treatment, time, and treatment by time. Time refers to thenumber of days of the experiment. ANOVAs were also done byperiod for all variables with partitioning of the treatment effectinto the pCO2 and temperature main effects and the interactionbetween these two factors. All data were analysed using StatisticalAnalysis Systems (SAS; Statistical Analysis Systems Institute,2001). Duncan’s multiple range tests was used to test for significantdifferences between treatment means. All statistical test interpreta-tions were made at the 5% level of significance.
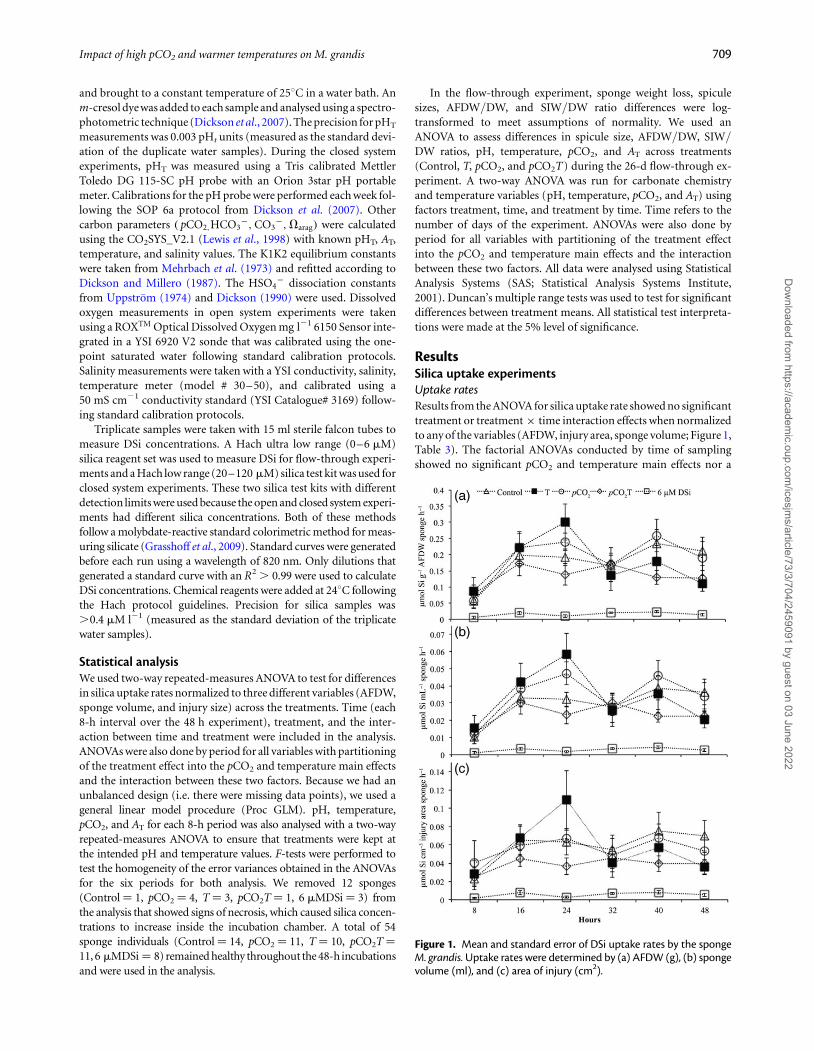
ResultsSilica uptake experimentsUptake ratesResults from the ANOVA for silica uptake rate showed no significanttreatment or treatment × time interaction effects when normalizedto any of the variables (AFDW, injury area, sponge volume; Figure 1,Table 3). The factorial ANOVAs conducted by time of samplingshowed no significant pCO2 and temperature main effects nor a
Figure 1. Mean and standard error of DSi uptake rates by the spongeM. grandis. Uptake rates were determined by (a) AFDW (g), (b) spongevolume (ml), and (c) area of injury (cm2).
Impact of high pCO2 and warmer temperatures on M. grandis 709
Dow
nloaded from https://academ
ic.oup.com/icesjm
s/article/73/3/704/2459091 by guest on 03 June 2022
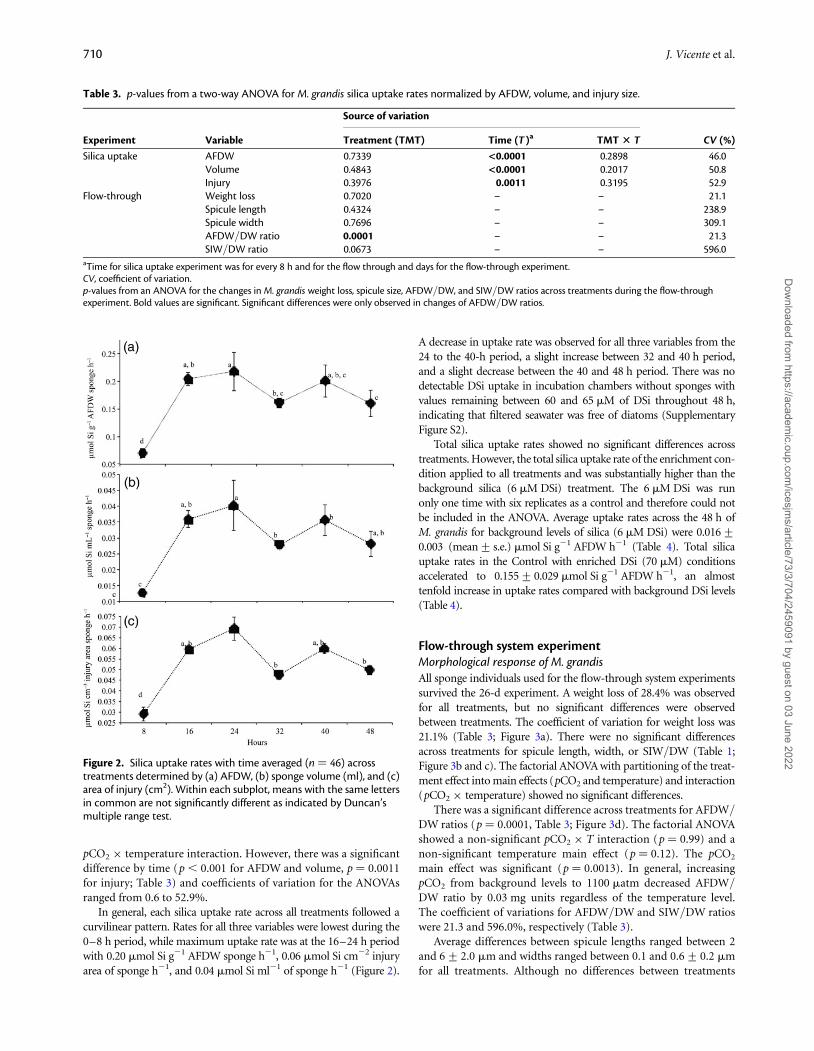
pCO2 × temperature interaction. However, there was a significantdifference by time (p , 0.001 for AFDW and volume, p ¼ 0.0011for injury; Table 3) and coefficients of variation for the ANOVAsranged from 0.6 to 52.9%.
In general, each silica uptake rate across all treatments followed acurvilinear pattern. Rates for all three variables were lowest during the0–8 h period, while maximum uptake rate was at the 16–24 h periodwith 0.20 mmol Si g21 AFDW sponge h21, 0.06 mmol Si cm22 injuryarea of sponge h21, and 0.04 mmol Si ml21 of sponge h21 (Figure 2).
A decrease in uptake rate was observed for all three variables from the24 to the 40-h period, a slight increase between 32 and 40 h period,and a slight decrease between the 40 and 48 h period. There was nodetectable DSi uptake in incubation chambers without sponges withvalues remaining between 60 and 65 mM of DSi throughout 48 h,indicating that filtered seawater was free of diatoms (SupplementaryFigure S2).
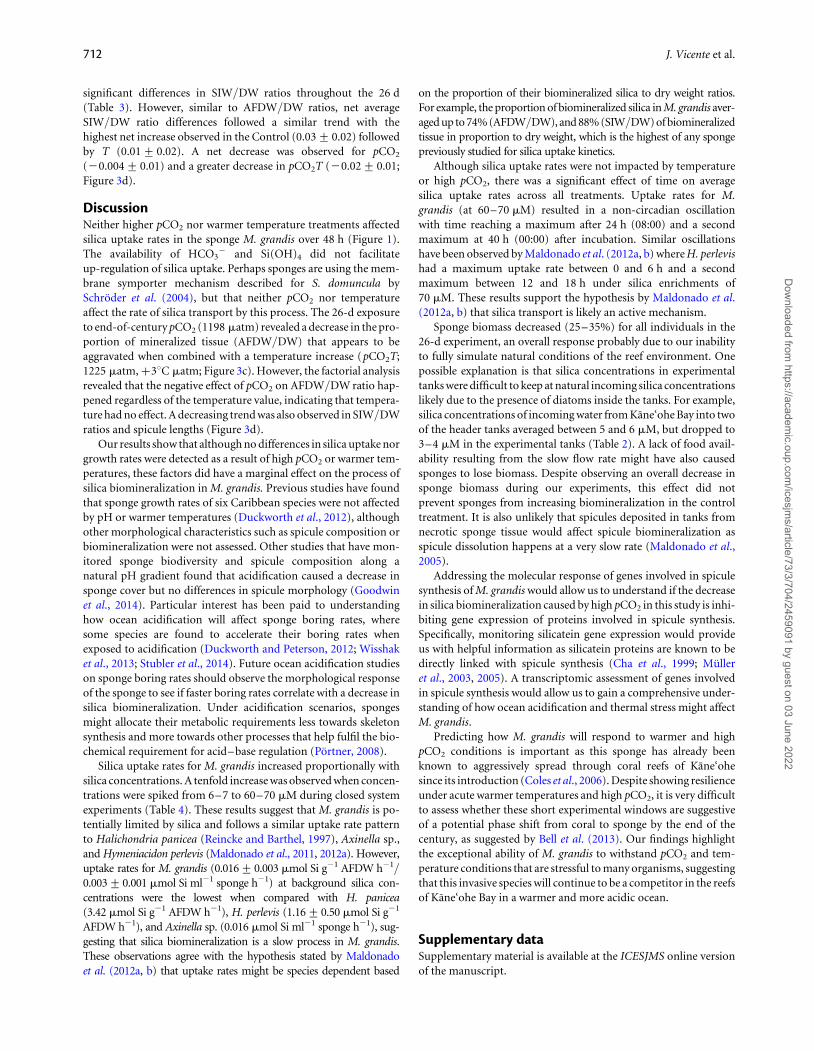
Total silica uptake rates showed no significant differences acrosstreatments. However, the total silica uptake rate of the enrichment con-dition applied to all treatments and was substantially higher than thebackground silica (6 mM DSi) treatment. The 6 mM DSi was runonly one time with six replicates as a control and therefore could notbe included in the ANOVA. Average uptake rates across the 48 h ofM. grandis for background levels of silica (6 mM DSi) were 0.016+0.003 (mean+ s.e.) mmol Si g21 AFDW h21 (Table 4). Total silicauptake rates in the Control with enriched DSi (70 mM) conditionsaccelerated to 0.155+0.029 mmol Si g21 AFDW h21, an almosttenfold increase in uptake rates compared with background DSi levels(Table 4).
Flow-through system experimentMorphological response of M. grandisAll sponge individuals used for the flow-through system experimentssurvived the 26-d experiment. A weight loss of 28.4% was observedfor all treatments, but no significant differences were observedbetween treatments. The coefficient of variation for weight loss was21.1% (Table 3; Figure 3a). There were no significant differencesacross treatments for spicule length, width, or SIW/DW (Table 1;Figure 3b and c). The factorial ANOVA with partitioning of the treat-ment effect into main effects (pCO2 and temperature) and interaction(pCO2 × temperature) showed no significant differences.
There was a significant difference across treatments for AFDW/DW ratios (p ¼ 0.0001, Table 3; Figure 3d). The factorial ANOVAshowed a non-significant pCO2 × T interaction (p ¼ 0.99) and anon-significant temperature main effect (p ¼ 0.12). The pCO2
main effect was significant (p ¼ 0.0013). In general, increasingpCO2 from background levels to 1100 matm decreased AFDW/DW ratio by 0.03 mg units regardless of the temperature level.The coefficient of variations for AFDW/DW and SIW/DW ratioswere 21.3 and 596.0%, respectively (Table 3).
Average differences between spicule lengths ranged between 2and 6+ 2.0 mm and widths ranged between 0.1 and 0.6+ 0.2 mmfor all treatments. Although no differences between treatments
Figure 2. Silica uptake rates with time averaged (n ¼ 46) acrosstreatments determined by (a) AFDW, (b) sponge volume (ml), and (c)area of injury (cm2). Within each subplot, means with the same lettersin common are not significantly different as indicated by Duncan’smultiple range test.
Table 3. p-values from a two-way ANOVA for M. grandis silica uptake rates normalized by AFDW, volume, and injury size.
Experiment Variable
Source of variation
CV (%)Treatment (TMT) Time (T)a TMT 3 T
Silica uptake AFDW 0.7339 <0.0001 0.2898 46.0Volume 0.4843 <0.0001 0.2017 50.8Injury 0.3976 0.0011 0.3195 52.9
Flow-through Weight loss 0.7020 – – 21.1Spicule length 0.4324 – – 238.9Spicule width 0.7696 – – 309.1AFDW/DW ratio 0.0001 – – 21.3SIW/DW ratio 0.0673 – – 596.0
aTime for silica uptake experiment was for every 8 h and for the flow through and days for the flow-through experiment.CV, coefficient of variation.p-values from an ANOVA for the changes in M. grandis weight loss, spicule size, AFDW/DW, and SIW/DW ratios across treatments during the flow-throughexperiment. Bold values are significant. Significant differences were only observed in changes of AFDW/DW ratios.
710 J. Vicente et al.
Dow
nloaded from https://academ
ic.oup.com/icesjm
s/article/73/3/704/2459091 by guest on 03 June 2022
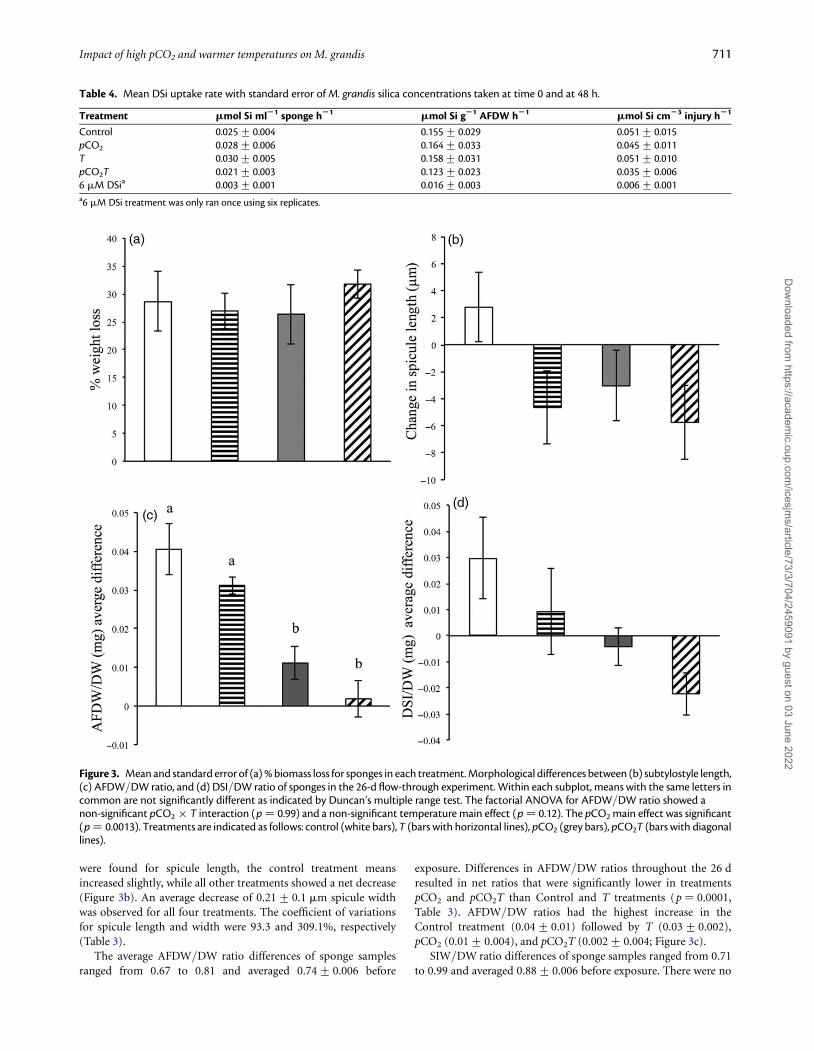
were found for spicule length, the control treatment meansincreased slightly, while all other treatments showed a net decrease(Figure 3b). An average decrease of 0.21+ 0.1 mm spicule widthwas observed for all four treatments. The coefficient of variationsfor spicule length and width were 93.3 and 309.1%, respectively(Table 3).
The average AFDW/DW ratio differences of sponge samplesranged from 0.67 to 0.81 and averaged 0.74+ 0.006 before
exposure. Differences in AFDW/DW ratios throughout the 26 dresulted in net ratios that were significantly lower in treatmentspCO2 and pCO2T than Control and T treatments (p ¼ 0.0001,Table 3). AFDW/DW ratios had the highest increase in theControl treatment (0.04+ 0.01) followed by T (0.03+ 0.002),pCO2 (0.01+ 0.004), and pCO2T (0.002+ 0.004; Figure 3c).
SIW/DW ratio differences of sponge samples ranged from 0.71to 0.99 and averaged 0.88+ 0.006 before exposure. There were no
Figure 3. Mean and standard error of (a) % biomass loss for sponges in each treatment. Morphological differences between (b) subtylostyle length,(c) AFDW/DW ratio, and (d) DSI/DW ratio of sponges in the 26-d flow-through experiment. Within each subplot, means with the same letters incommon are not significantly different as indicated by Duncan’s multiple range test. The factorial ANOVA for AFDW/DW ratio showed anon-significant pCO2 × T interaction (p ¼ 0.99) and a non-significant temperature main effect (p ¼ 0.12). The pCO2 main effect was significant(p ¼ 0.0013). Treatments are indicated as follows: control (white bars), T (bars with horizontal lines), pCO2 (grey bars), pCO2T (bars with diagonallines).
Table 4. Mean DSi uptake rate with standard error of M. grandis silica concentrations taken at time 0 and at 48 h.
Treatment mmol Si ml21 sponge h21 mmol Si g21 AFDW h21 mmol Si cm23 injury h21
Control 0.025+ 0.004 0.155+ 0.029 0.051+ 0.015pCO2 0.028+ 0.006 0.164+ 0.033 0.045+ 0.011T 0.030+ 0.005 0.158+ 0.031 0.051+ 0.010pCO2T 0.021+ 0.003 0.123+ 0.023 0.035+ 0.0066 mM DSia 0.003+ 0.001 0.016+ 0.003 0.006+ 0.001a6 mM DSi treatment was only ran once using six replicates.
Impact of high pCO2 and warmer temperatures on M. grandis 711
Dow
nloaded from https://academ
ic.oup.com/icesjm
s/article/73/3/704/2459091 by guest on 03 June 2022
significant differences in SIW/DW ratios throughout the 26 d(Table 3). However, similar to AFDW/DW ratios, net averageSIW/DW ratio differences followed a similar trend with thehighest net increase observed in the Control (0.03+ 0.02) followedby T (0.01+ 0.02). A net decrease was observed for pCO2
(20.004+ 0.01) and a greater decrease in pCO2T (20.02+ 0.01;Figure 3d).
DiscussionNeither higher pCO2 nor warmer temperature treatments affectedsilica uptake rates in the sponge M. grandis over 48 h (Figure 1).The availability of HCO3
− and Si(OH)4 did not facilitateup-regulation of silica uptake. Perhaps sponges are using the mem-brane symporter mechanism described for S. domuncula bySchroder et al. (2004), but that neither pCO2 nor temperatureaffect the rate of silica transport by this process. The 26-d exposureto end-of-century pCO2 (1198 matm) revealed a decrease in the pro-portion of mineralized tissue (AFDW/DW) that appears to beaggravated when combined with a temperature increase (pCO2T;1225 matm, +38C matm; Figure 3c). However, the factorial analysisrevealed that the negative effect of pCO2 on AFDW/DW ratio hap-pened regardless of the temperature value, indicating that tempera-ture had no effect. A decreasing trend was also observed in SIW/DWratios and spicule lengths (Figure 3d).
Our results show that although no differences in silica uptake norgrowth rates were detected as a result of high pCO2 or warmer tem-peratures, these factors did have a marginal effect on the process ofsilica biomineralization in M. grandis. Previous studies have foundthat sponge growth rates of six Caribbean species were not affectedby pH or warmer temperatures (Duckworth et al., 2012), althoughother morphological characteristics such as spicule composition orbiomineralization were not assessed. Other studies that have mon-itored sponge biodiversity and spicule composition along anatural pH gradient found that acidification caused a decrease insponge cover but no differences in spicule morphology (Goodwinet al., 2014). Particular interest has been paid to understandinghow ocean acidification will affect sponge boring rates, wheresome species are found to accelerate their boring rates whenexposed to acidification (Duckworth and Peterson, 2012; Wisshaket al., 2013; Stubler et al., 2014). Future ocean acidification studieson sponge boring rates should observe the morphological responseof the sponge to see if faster boring rates correlate with a decrease insilica biomineralization. Under acidification scenarios, spongesmight allocate their metabolic requirements less towards skeletonsynthesis and more towards other processes that help fulfil the bio-chemical requirement for acid–base regulation (Portner, 2008).
Silica uptake rates for M. grandis increased proportionally withsilica concentrations. A tenfold increase was observed when concen-trations were spiked from 6–7 to 60–70 mM during closed systemexperiments (Table 4). These results suggest that M. grandis is po-tentially limited by silica and follows a similar uptake rate patternto Halichondria panicea (Reincke and Barthel, 1997), Axinella sp.,and Hymeniacidon perlevis (Maldonado et al., 2011, 2012a). However,uptake rates for M. grandis (0.016+0.003 mmol Si g21 AFDW h21/0.003+0.001 mmol Si ml21 sponge h21) at background silica con-centrations were the lowest when compared with H. panicea(3.42 mmol Si g21 AFDW h21), H. perlevis (1.16+0.50 mmol Si g21
AFDW h21), and Axinella sp. (0.016 mmol Si ml21 sponge h21), sug-gesting that silica biomineralization is a slow process in M. grandis.These observations agree with the hypothesis stated by Maldonadoet al. (2012a, b) that uptake rates might be species dependent based
on the proportion of their biomineralized silica to dry weight ratios.For example, the proportion of biomineralized silica in M. grandis aver-aged up to 74% (AFDW/DW), and 88% (SIW/DW) of biomineralizedtissue in proportion to dry weight, which is the highest of any spongepreviously studied for silica uptake kinetics.
Although silica uptake rates were not impacted by temperatureor high pCO2, there was a significant effect of time on averagesilica uptake rates across all treatments. Uptake rates for M.grandis (at 60–70 mM) resulted in a non-circadian oscillationwith time reaching a maximum after 24 h (08:00) and a secondmaximum at 40 h (00:00) after incubation. Similar oscillationshave been observed by Maldonado et al. (2012a, b) where H. perlevishad a maximum uptake rate between 0 and 6 h and a secondmaximum between 12 and 18 h under silica enrichments of70 mM. These results support the hypothesis by Maldonado et al.(2012a, b) that silica transport is likely an active mechanism.
Sponge biomass decreased (25–35%) for all individuals in the26-d experiment, an overall response probably due to our inabilityto fully simulate natural conditions of the reef environment. Onepossible explanation is that silica concentrations in experimentaltanks were difficult to keep at natural incoming silica concentrationslikely due to the presence of diatoms inside the tanks. For example,silica concentrations of incoming water from Kane‘ohe Bay into twoof the header tanks averaged between 5 and 6 mM, but dropped to3–4 mM in the experimental tanks (Table 2). A lack of food avail-ability resulting from the slow flow rate might have also causedsponges to lose biomass. Despite observing an overall decrease insponge biomass during our experiments, this effect did notprevent sponges from increasing biomineralization in the controltreatment. It is also unlikely that spicules deposited in tanks fromnecrotic sponge tissue would affect spicule biomineralization asspicule dissolution happens at a very slow rate (Maldonado et al.,2005).
Addressing the molecular response of genes involved in spiculesynthesis of M. grandis would allow us to understand if the decreasein silica biomineralization caused by high pCO2 in this study is inhi-biting gene expression of proteins involved in spicule synthesis.Specifically, monitoring silicatein gene expression would provideus with helpful information as silicatein proteins are known to bedirectly linked with spicule synthesis (Cha et al., 1999; Mulleret al., 2003, 2005). A transcriptomic assessment of genes involvedin spicule synthesis would allow us to gain a comprehensive under-standing of how ocean acidification and thermal stress might affectM. grandis.
Predicting how M. grandis will respond to warmer and highpCO2 conditions is important as this sponge has already beenknown to aggressively spread through coral reefs of Kane‘ohesince its introduction (Coles et al., 2006). Despite showing resilienceunder acute warmer temperatures and high pCO2, it is very difficultto assess whether these short experimental windows are suggestiveof a potential phase shift from coral to sponge by the end of thecentury, as suggested by Bell et al. (2013). Our findings highlightthe exceptional ability of M. grandis to withstand pCO2 and tem-perature conditions that are stressful to many organisms, suggestingthat this invasive species will continue to be a competitor in the reefsof Kane‘ohe Bay in a warmer and more acidic ocean.
Supplementary dataSupplementary material is available at the ICESJMS online versionof the manuscript.
712 J. Vicente et al.
Dow
nloaded from https://academ
ic.oup.com/icesjm
s/article/73/3/704/2459091 by guest on 03 June 2022

AcknowledgementsWe thank Hollie Putnam for her logistical support and MeganDonahue for advice on experimental design for this study.Funding for this project was supported by NOAA’s Nancy FosterScholarship award NA12NOS4290142 to JV and NJS. Support forsequencing of sponge samples was provided by the NSF BIO/IOSProgramme (IOS-0919728) grant to RTH. We thank reviewers forconstructive suggestions and in particular thank one reviewer forrecommendations that greatly improved our statistical analyses.All samples were collected under collection permit No. 2014-52.
ReferencesAbramoff, M. D., Magalhaes, P. J., and Ram, S. J. 2004. Image processing
with ImageJ. Biophotonics International, 11: 36–42.
Ayling, A. L. 1983. Growth and regeneration rates in thinly encrustingdemospongiae from temperate waters. The Biological Bulletin,165: 343–352.
Bell, J. J., Davy, S. K., Jones, T., Taylor, M. W., and Webster, N. S. 2013.Could some coral reefs become sponge reefs as our climate changes?Global Change Biology, 19: 2613–2624.
Cebrian, E., Uriz, M. J., Garrabou, J., and Ballesteros, E. 2011. Spongemass mortalities in a warming Mediterranean Sea: arecyanobacteria-harboring species worse off? PLoS One, 6: e20211.
Cha, J. N., Shimizu, K., Zhou, Y., Christiansen, S. C., Chmelka, B. F.,Stucky, G. D., and Morse, D. E. 1999. Silicatein filaments and subu-nits from a marine sponge direct the polymerization of silica and sili-cones in vitro. Proceedings of the National Academy of Sciences ofthe United States of America, 96: 361–365.
Coles, S., and Bolick, H. 2007. Invasive introduced sponge Mycalegrandis overgrows reef corals in Kane ‘ohe Bay, O ‘ahu, Hawai ‘i.Coral Reefs, 26: 911.
Coles, S. L., Bolick, H., and Longenecker, K. 2006. Assessment ofInvasiveness of the Orange Keyhole Sponge Mycale armata in Kane‘ohe Bay, O ‘ahu, Hawai ‘i. Final Report Year, 1: 2006-2002.
de Goeij, J. M., van Oevelen, D., Vermeij, M. J., Osinga, R., Middelburg,J. J., de Goeij, A. F., and Admiraal, W. 2013. Surviving in a marinedesert: the sponge loop retains resources within coral reefs.Science, 342: 108–110.
Diaz, M. C., and Rutzler, K. 2001. Sponges: an essential component ofCaribbean coral reefs. Bulletin of Marine Science, 69: 535–546.
Dickson, A., and Millero, F. 1987. A comparison of the equilibriumconstants for the dissociation of carbonic acid in seawater media.Deep Sea Research Part A. Oceanographic Research Papers, 34:1733–1743.
Dickson, A. G. 1990. Standard potential of the reaction: AgCl (s)+ 12H2
(g) ¼ Ag (s)+ HCl (aq), and the standard acidity constant of the ionHSO4
2 in synthetic sea water from 273.15 to 318.15 K. Journal ofChemical Thermodynamics, 22: 113–127.
Dickson, A. G., Sabine, C. L., and Christian, J. R. (Eds) 2007. Guide tobest practices for ocean CO2 measurements. PICES SpecialPublication 3, 191 pp.
Duckworth, A. R., and Peterson, B. J. 2012. Effects of seawater tempera-ture and pH on the boring rates of the sponge Cliona celata in scallopshells. Marine Biology, 160: 27–35.
Duckworth, A. R., West, L., Vansach, T., Stubler, A., and Hardt, M. 2012.Effects of water temperature and pH on growth and metabolite bio-synthesis of coral reef sponges. Marine Ecology Progress Series, 462:67–77.
Enochs, I. C., Manzello, D. P., Carlton, R. D., Graham, D. M., Ruzicka,R., and Colella, M. A. 2015. Ocean acidification enhances the bioero-sion of a common coral reef sponge: implications for the persistenceof the Florida Reef Tract. Bulletin of Marine Science, 91: 271–290.
Fabry, V. J., Seibel, B. A., Feely, R. A., and Orr, J. C. 2008. Impacts ofocean acidification on marine fauna and ecosystem processes.ICES Journal of Marine Science, 65: 414–432.
Gibbin, E. M., Putnam, H. M., Gates, R. D., Nitschke, M. R., and Davy,S. K. 2015. Species-specific differences in thermal tolerance maydefine susceptibility to intracellular acidosis in reef corals. MarineBiology, 162: 717–723.
Goodwin, C., Rodolfo-Metalpa, R., Picton, B., and Hall-Spencer, J. M.2014. Effects of ocean acidification on sponge communities. MarineEcology, 35: 41–49.
Grasshoff, K., Kremling, K., and Ehrhardt, M. 2009. Methods ofSeawater Analysis. John Wiley & Sons, Federal Republic of Germany.
Gray, J. 1867. Notes on the arrangement of sponges, with the descriptionof some new genera. In Proceedings of the Zoological Society ofLondon, pp. 492–558.
Hoegh-Guldberg, O., Mumby, P., Hooten, A., Steneck, R., Greenfield,P., Gomez, E., Harvell, C., et al. 2007. Coral reefs under rapidclimate change and ocean acidification. Science, 318: 1737–1742.
Hofmann, G. E., Barry, J. P., Edmunds, P. J., Gates, R. D., Hutchins,D. A., Klinger, T., and Sewell, M. A. 2010. The effect of ocean acidifi-cation on calcifying organisms in marine ecosystems: anorganism-to-ecosystem perspective. Annual Review of Ecology,Evolution, and Systematics, 41: 127–147.
Hooper, J. N., and Van Soest, R. W. 2002. Systema Porifera. A Guide tothe Classification of Sponges. Springer.
Lewis, E., Wallace, D., and Allison, L. J. 1998. Program developed forCO2 system calculations. Carbon Dioxide Information AnalysisCenter. Managed by Lockheed Martin. Energy ResearchCorporation for the US Department of Energy Tennessee.
Loh, T-L., McMurray, S. E., Henkel, T. P., Vicente, J., and Pawlik, J. R.2015. Indirect effects of overfishing on Caribbean reefs: spongesovergrow reef-building corals. PeerJ, 3: e901.
Maldonado, M., Carmona, M. C., Velasquez, Z., Puig, A., Cruzado, A.,Lopez, A., and Young, C. M. 2005. Siliceous sponges as a silicon sink:an overlooked aspect of benthopelagic coupling in the marine siliconcycle. Limnology and Oceanography, 50: 799–809.
Maldonado, M., Cao, H., Cao, X., Song, Y., Qu, Y., and Zhang, W. 2012a.Experimental silicon demand by the sponge Hymeniacidon perlevisreveals chronic limitation in field populations. Hydrobiologia,687: 251–257.
Maldonado, M., Navarro, L., Grasa, A., Gonzalez, A., and Vaquerizo, I.2011. Silicon uptake by sponges: a twist to understanding nutrientcycling on continental margins. Scientific Reports, 1: 30.
Maldonado, M., Ribes, M., and van Duyl, F. C. 2012b. 3 Nutrient fluxesthrough sponges: biology, budgets, and ecological implications.Advances in Marine Biology, 62: 113.
McMurray, S. E., Finelli, C. M., and Pawlik, J. R. 2015. Population dy-namics of giant barrel sponges on Florida coral reefs. Journal ofExperimental Marine Biology and Ecology, 473: 73–80.
Mehrbach, C., Culberson, C., Hawley, J., and Pytkowicx, R. 1973.Measurement of the apparent dissociation constants of carbonic acidin seawater at atmospheric pressure. Limnology and Oceanography,18: 897–907.
Morrow, K. M., Bourne, D. G., Humphrey, C., Botte, E. S., Laffy, P.,Zaneveld, J., Uthicke, S., et al. 2014. Natural volcanic CO2 seepsreveal future trajectories for host-microbial associations in coralsand sponges. ISME Journal, 9: 894–908.
Muller, W. E., Krasko, A., Le Pennec, G., Steffen, R., Wiens, M., Ammar,M. S. A., Muller, I. M., et al. 2003. Molecular mechanism ofspicule formation in the demosponge Suberites domuncula:silicatein-collagen-myotrophin. In Silicon Biomineralization, pp.195–221. Springer, Berlin Heidelberg.
Muller, W. E., Rothenberger, M., Boreiko, A., Tremel, W., Reiber, A., andSchroder, H. C. 2005. Formation of siliceous spicules in the marinedemosponge Suberites domuncula. Cell and Tissue Research, 321:285–297.
Nwewll, R., and Northcroft, H. 1967. A re-interpretation of the effect oftemperature on the metabolism of certain marine invertebrates.Journal of Zoology, 151: 277–298.
Impact of high pCO2 and warmer temperatures on M. grandis 713
Dow
nloaded from https://academ
ic.oup.com/icesjm
s/article/73/3/704/2459091 by guest on 03 June 2022

Pawlik, J. R. 2011. The chemical ecology of sponges on Caribbean reefs:natural products shape natural systems. Bioscience, 61: 888–898.
Pawlik, J. R., Loh, T-L., McMurray, S. E., and Finelli, C. M. 2013. Spongecommunities on Caribbean coral reefs are structured by factors thatare top-down, not bottom-up. PLoS One, 8: e62573.
Portner, H. 2008. Ecosystem effects of ocean acidification in times ofocean warming: a physiologist’s view. Marine Ecology ProgressSeries, 373: 203–217.
Putnam, H. M. 2012. Resilience and acclimatization potential of reefcorals under predicted climate change stressors. PhD thesis.University of Hawai’i Manoa.
Reincke, T., and Barthel, D. 1997. Silica uptake kinetics of Halichondriapanicea in Kiel Bight. Marine Biology, 129: 591–593.
Riahi, K., Rao, S., Krey, V., Cho, C., Chirkov, V., Fischer, G.,Kindermann, G., et al. 2011. RCP 8.5—a scenario of comparativelyhigh greenhouse gas emissions. Climatic Change, 109: 33–57.
Schroder, H-C., Perovic-Ottstadt, S., Rothenberger, M., Wiens, M.,Schwertner, H., Batel, R., Korzhev, M., et al. 2004. Silica transportin the demosponge Suberites domuncula: fluorescence emission ana-lysis using the PDMPO probe and cloning of a potential transporter.Biochemistry Journal, 381: 665–673.
Silbiger, N., and Donahue, M. 2015. Secondary calcification and dissolutionrespond differently to future ocean conditions. Biogeosciences, 12:567–578.
Silveira, C. B., SilvaLima, A. W., FranciniFilho, R. B., Marques, J. S.,Almeida, M. G., Thompson, C. C., Rezende, C. E., et al. 2015.Microbial and sponge loops modify fish production in phase-shift-ing coral reefs. Environmental Microbiology, 17: 3832–3846.
Smith, A. M., Berman, J., Key, M. M., and Winter, D. J. 2013. Not allsponges will thrive in a high-CO2 ocean: review of the mineralogyof calcifying sponges. Palaeogeography, Palaeoclimatology,Palaeoecology, 392: 463–472.
Stubler, A. D., Furman, B. T., and Peterson, B. J. 2014. Effects of pCO2 onthe interaction between an excavating sponge, Cliona varians, and ahermatypic coral, Porites furcata. Marine Biology, 161: 1851–1859.
Uppstrom, L. R. 1974. The boron/chlorinity ratio of deep-sea waterfrom the Pacific Ocean. Deep Sea Research and OceanographicAbstracts, 21: 161–162.
Uriz, M. J., Turon, X., and Becerro, M. A. 2003. Silica deposition indemosponges. In Silicon Biomineralization, pp. 163–193.Springer, Berlin Heidelberg.
Vicente, V. P. 1989. Regional commercial sponge extinctions in the WestIndies: are recent climatic changes responsible? Marine Ecology, 10:179–191.
Wang, X., Schroder, H. C., Wiens, M., Schlobmacher, U., and Muller, W.E. 2012. 5 Biosilica: molecular biology, biochemistry and function inDemosponges as well as its applied aspects for tissue engineering.Advances in Marine Biology, 62: 231.
Webster, N., Pantile, R., Botte, E., Abdo, D., Andreakis, N., and Whalan,S. 2013. A complex life cycle in a warming planet: gene expression inthermally stressed sponges. Molecular Ecology, 22: 1854–1868.
Webster, N. S., Cobb, R. E., and Negri, A. P. 2008. Temperaturethresholds for bacterial symbiosis with a sponge. ISME Journal, 2:830–842.
Weissenfels, N. 1981. Bau und Funktion des SußwasserschwammsEphydatia fluviatilis L.(Porifera). Zoomorphology, 98: 35–45.
Wisshak, M., Schonberg, C. H., Form, A., and Freiwald, A. 2012. Oceanacidification accelerates reef bioerosion. PLoS One, 7: e45124.
Wisshak, M., Schonberg, C. H. L., Form, A., and Freiwald, A. 2013. Effectsofocean acidificationand global warming onreef bioerosion—lessonsfrom a clionaid sponge. Aquatic Biology, 19: 111–127.
Zeebe,R.E., and Wolf-Gladrow, D. A.2001. CO2 inseawater: equilibrium,kinetics, isotopes. Vol. 65. Gulf Professional Publishing.
Handling editor: Howard Browman
714 J. Vicente et al.
Dow
nloaded from https://academ
ic.oup.com/icesjm
s/article/73/3/704/2459091 by guest on 03 June 2022
Copyright © 2022 FDOKUMEN