Seasonal dynamics of autotrophic and heterotropic plankton metabolism and pCO2 in a subarctic...
15
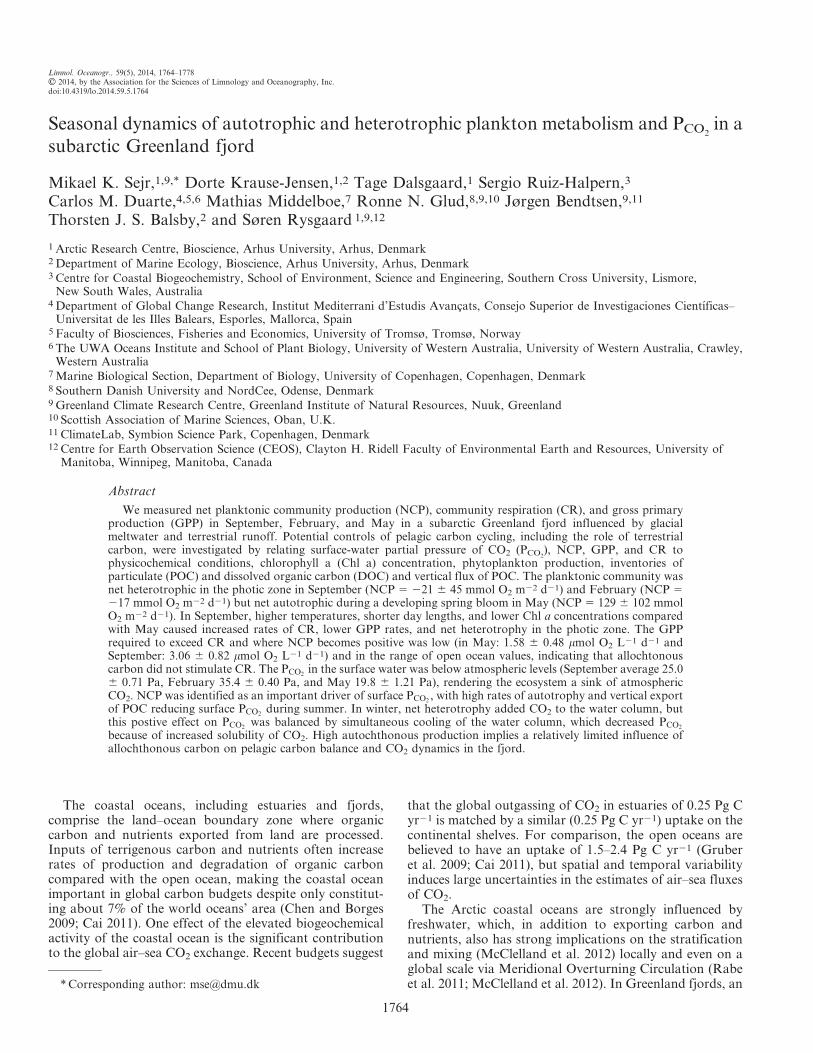
Seasonal dynamics of autotrophic and heterotrophic plankton metabolism and P CO 2 in a subarctic Greenland fjord Mikael K. Sejr, 1,9,* Dorte Krause-Jensen, 1,2 Tage Dalsgaard, 1 Sergio Ruiz-Halpern, 3 Carlos M. Duarte, 4,5,6 Mathias Middelboe, 7 Ronne N. Glud, 8,9,10 Jørgen Bendtsen, 9,11 Thorsten J. S. Balsby, 2 and Søren Rysgaard 1,9,12 1 Arctic Research Centre, Bioscience, Arhus University, Arhus, Denmark 2 Department of Marine Ecology, Bioscience, Arhus University, Arhus, Denmark 3 Centre for Coastal Biogeochemistry, School of Environment, Science and Engineering, Southern Cross University, Lismore, New South Wales, Australia 4 Department of Global Change Research, Institut Mediterrani d’Estudis Avanc ¸ats, Consejo Superior de Investigaciones Cientı ´ficas– Universitat de les Illes Balears, Esporles, Mallorca, Spain 5 Faculty of Biosciences, Fisheries and Economics, University of Tromsø, Tromsø, Norway 6 The UWA Oceans Institute and School of Plant Biology, University of Western Australia, University of Western Australia, Crawley, Western Australia 7 Marine Biological Section, Department of Biology, University of Copenhagen, Copenhagen, Denmark 8 Southern Danish University and NordCee, Odense, Denmark 9 Greenland Climate Research Centre, Greenland Institute of Natural Resources, Nuuk, Greenland 10 Scottish Association of Marine Sciences, Oban, U.K. 11 ClimateLab, Symbion Science Park, Copenhagen, Denmark 12 Centre for Earth Observation Science (CEOS), Clayton H. Ridell Faculty of Environmental Earth and Resources, University of Manitoba, Winnipeg, Manitoba, Canada Abstract We measured net planktonic community production (NCP), community respiration (CR), and gross primary production (GPP) in September, February, and May in a subarctic Greenland fjord influenced by glacial meltwater and terrestrial runoff. Potential controls of pelagic carbon cycling, including the role of terrestrial carbon, were investigated by relating surface-water partial pressure of CO 2 (P CO 2 ), NCP, GPP, and CR to physicochemical conditions, chlorophyll a (Chl a) concentration, phytoplankton production, inventories of particulate (POC) and dissolved organic carbon (DOC) and vertical flux of POC. The planktonic community was net heterotrophic in the photic zone in September (NCP 5 221 6 45 mmol O 2 m 22 d 21 ) and February (NCP 5 217 mmol O 2 m 22 d 21 ) but net autotrophic during a developing spring bloom in May (NCP 5 129 6 102 mmol O 2 m 22 d 21 ). In September, higher temperatures, shorter day lengths, and lower Chl a concentrations compared with May caused increased rates of CR, lower GPP rates, and net heterotrophy in the photic zone. The GPP required to exceed CR and where NCP becomes positive was low (in May: 1.58 6 0.48 mmol O 2 L 21 d 21 and September: 3.06 6 0.82 mmol O 2 L 21 d 21 ) and in the range of open ocean values, indicating that allochtonous carbon did not stimulate CR. The P CO2 in the surface water was below atmospheric levels (September average 25.0 6 0.71 Pa, February 35.4 6 0.40 Pa, and May 19.8 6 1.21 Pa), rendering the ecosystem a sink of atmospheric CO 2 . NCP was identified as an important driver of surface P CO2 , with high rates of autotrophy and vertical export of POC reducing surface P CO2 during summer. In winter, net heterotrophy added CO 2 to the water column, but this postive effect on P CO2 was balanced by simultaneous cooling of the water column, which decreased P CO2 because of increased solubility of CO 2 . High autochthonous production implies a relatively limited influence of allochthonous carbon on pelagic carbon balance and CO 2 dynamics in the fjord. The coastal oceans, including estuaries and fjords, comprise the land–ocean boundary zone where organic carbon and nutrients exported from land are processed. Inputs of terrigenous carbon and nutrients often increase rates of production and degradation of organic carbon compared with the open ocean, making the coastal ocean important in global carbon budgets despite only constitut- ing about 7% of the world oceans’ area (Chen and Borges 2009; Cai 2011). One effect of the elevated biogeochemical activity of the coastal ocean is the significant contribution to the global air–sea CO 2 exchange. Recent budgets suggest that the global outgassing of CO 2 in estuaries of 0.25 Pg C yr 21 is matched by a similar (0.25 Pg C yr 21 ) uptake on the continental shelves. For comparison, the open oceans are believed to have an uptake of 1.5–2.4 Pg C yr 21 (Gruber et al. 2009; Cai 2011), but spatial and temporal variability induces large uncertainties in the estimates of air–sea fluxes of CO 2 . The Arctic coastal oceans are strongly influenced by freshwater, which, in addition to exporting carbon and nutrients, also has strong implications on the stratification and mixing (McClelland et al. 2012) locally and even on a global scale via Meridional Overturning Circulation (Rabe et al. 2011; McClelland et al. 2012). In Greenland fjords, an * Corresponding author: [email protected] Limnol. Oceanogr., 59(5), 2014, 1764–1778 E 2014, by the Association for the Sciences of Limnology and Oceanography, Inc. doi:10.4319/lo.2014.59.5.1764 1764
-
Upload
independent -
Category
Documents
-
view
4 -
download
0
Transcript of Seasonal dynamics of autotrophic and heterotropic plankton metabolism and pCO2 in a subarctic...
Seasonal dynamics of autotrophic and heterotrophic plankton metabolism and PCO2in a
subarctic Greenland fjord
Mikael K. Sejr,1,9,* Dorte Krause-Jensen,1,2 Tage Dalsgaard,1 Sergio Ruiz-Halpern,3
Carlos M. Duarte,4,5,6 Mathias Middelboe,7 Ronne N. Glud,8,9,10 Jørgen Bendtsen,9,11
Thorsten J. S. Balsby,2 and Søren Rysgaard 1,9,12
1 Arctic Research Centre, Bioscience, Arhus University, Arhus, Denmark2 Department of Marine Ecology, Bioscience, Arhus University, Arhus, Denmark3 Centre for Coastal Biogeochemistry, School of Environment, Science and Engineering, Southern Cross University, Lismore,
New South Wales, Australia4 Department of Global Change Research, Institut Mediterrani d’Estudis Avancats, Consejo Superior de Investigaciones Cientıficas–
Universitat de les Illes Balears, Esporles, Mallorca, Spain5 Faculty of Biosciences, Fisheries and Economics, University of Tromsø, Tromsø, Norway6 The UWA Oceans Institute and School of Plant Biology, University of Western Australia, University of Western Australia, Crawley,
Western Australia7 Marine Biological Section, Department of Biology, University of Copenhagen, Copenhagen, Denmark8 Southern Danish University and NordCee, Odense, Denmark9 Greenland Climate Research Centre, Greenland Institute of Natural Resources, Nuuk, Greenland10 Scottish Association of Marine Sciences, Oban, U.K.11 ClimateLab, Symbion Science Park, Copenhagen, Denmark12 Centre for Earth Observation Science (CEOS), Clayton H. Ridell Faculty of Environmental Earth and Resources, University of
Manitoba, Winnipeg, Manitoba, Canada
Abstract
We measured net planktonic community production (NCP), community respiration (CR), and gross primaryproduction (GPP) in September, February, and May in a subarctic Greenland fjord influenced by glacialmeltwater and terrestrial runoff. Potential controls of pelagic carbon cycling, including the role of terrestrialcarbon, were investigated by relating surface-water partial pressure of CO2 (PCO2
), NCP, GPP, and CR tophysicochemical conditions, chlorophyll a (Chl a) concentration, phytoplankton production, inventories ofparticulate (POC) and dissolved organic carbon (DOC) and vertical flux of POC. The planktonic community wasnet heterotrophic in the photic zone in September (NCP 5 221 6 45 mmol O2 m22 d21) and February (NCP 5217 mmol O2 m22 d21) but net autotrophic during a developing spring bloom in May (NCP 5 129 6 102 mmolO2 m22 d21). In September, higher temperatures, shorter day lengths, and lower Chl a concentrations comparedwith May caused increased rates of CR, lower GPP rates, and net heterotrophy in the photic zone. The GPPrequired to exceed CR and where NCP becomes positive was low (in May: 1.58 6 0.48 mmol O2 L21 d21 andSeptember: 3.06 6 0.82 mmol O2 L21 d21) and in the range of open ocean values, indicating that allochtonouscarbon did not stimulate CR. The PCO2
in the surface water was below atmospheric levels (September average 25.06 0.71 Pa, February 35.4 6 0.40 Pa, and May 19.8 6 1.21 Pa), rendering the ecosystem a sink of atmosphericCO2. NCP was identified as an important driver of surface PCO2
, with high rates of autotrophy and vertical exportof POC reducing surface PCO2
during summer. In winter, net heterotrophy added CO2 to the water column, butthis postive effect on PCO2
was balanced by simultaneous cooling of the water column, which decreased PCO2
because of increased solubility of CO2. High autochthonous production implies a relatively limited influence ofallochthonous carbon on pelagic carbon balance and CO2 dynamics in the fjord.
The coastal oceans, including estuaries and fjords,comprise the land–ocean boundary zone where organiccarbon and nutrients exported from land are processed.Inputs of terrigenous carbon and nutrients often increaserates of production and degradation of organic carboncompared with the open ocean, making the coastal oceanimportant in global carbon budgets despite only constitut-ing about 7% of the world oceans’ area (Chen and Borges2009; Cai 2011). One effect of the elevated biogeochemicalactivity of the coastal ocean is the significant contributionto the global air–sea CO2 exchange. Recent budgets suggest
that the global outgassing of CO2 in estuaries of 0.25 Pg Cyr21 is matched by a similar (0.25 Pg C yr21) uptake on thecontinental shelves. For comparison, the open oceans arebelieved to have an uptake of 1.5–2.4 Pg C yr21 (Gruberet al. 2009; Cai 2011), but spatial and temporal variabilityinduces large uncertainties in the estimates of air–sea fluxesof CO2.
The Arctic coastal oceans are strongly influenced byfreshwater, which, in addition to exporting carbon andnutrients, also has strong implications on the stratificationand mixing (McClelland et al. 2012) locally and even on aglobal scale via Meridional Overturning Circulation (Rabeet al. 2011; McClelland et al. 2012). In Greenland fjords, an* Corresponding author: [email protected]
Limnol. Oceanogr., 59(5), 2014, 1764–1778
E 2014, by the Association for the Sciences of Limnology and Oceanography, Inc.doi:10.4319/lo.2014.59.5.1764
1764
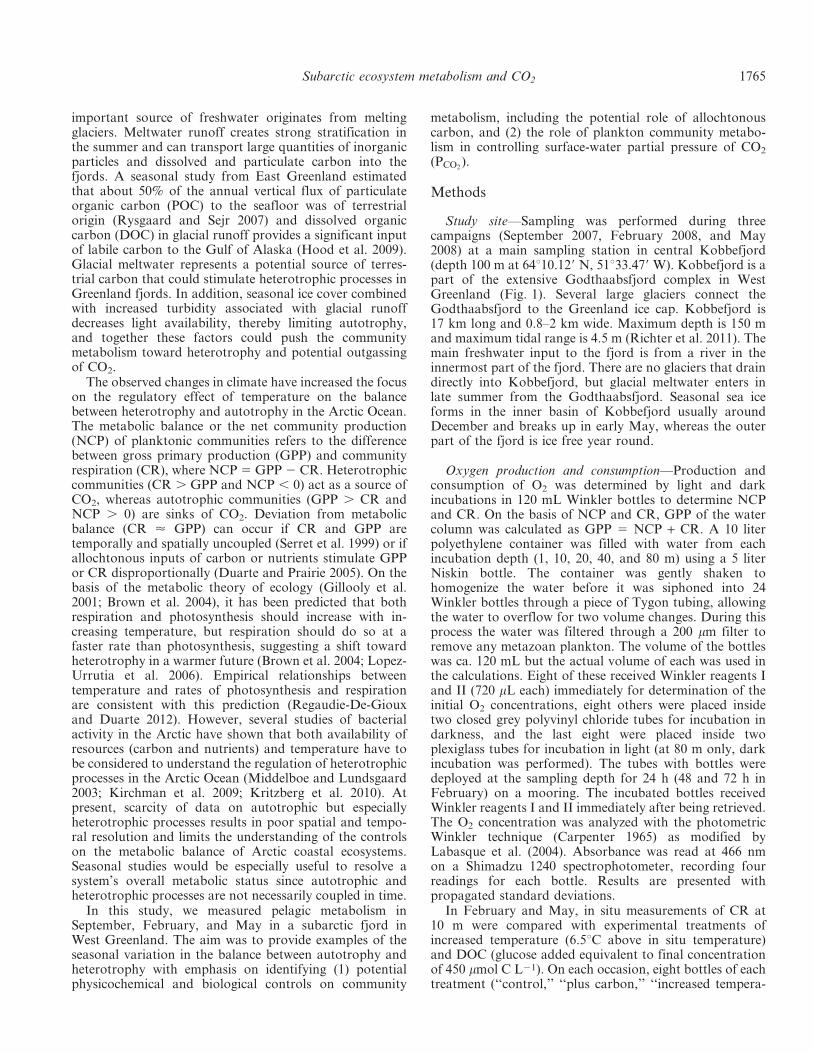
important source of freshwater originates from meltingglaciers. Meltwater runoff creates strong stratification inthe summer and can transport large quantities of inorganicparticles and dissolved and particulate carbon into thefjords. A seasonal study from East Greenland estimatedthat about 50% of the annual vertical flux of particulateorganic carbon (POC) to the seafloor was of terrestrialorigin (Rysgaard and Sejr 2007) and dissolved organiccarbon (DOC) in glacial runoff provides a significant inputof labile carbon to the Gulf of Alaska (Hood et al. 2009).Glacial meltwater represents a potential source of terres-trial carbon that could stimulate heterotrophic processes inGreenland fjords. In addition, seasonal ice cover combinedwith increased turbidity associated with glacial runoffdecreases light availability, thereby limiting autotrophy,and together these factors could push the communitymetabolism toward heterotrophy and potential outgassingof CO2.
The observed changes in climate have increased the focuson the regulatory effect of temperature on the balancebetween heterotrophy and autotrophy in the Arctic Ocean.The metabolic balance or the net community production(NCP) of planktonic communities refers to the differencebetween gross primary production (GPP) and communityrespiration (CR), where NCP 5 GPP 2 CR. Heterotrophiccommunities (CR . GPP and NCP , 0) act as a source ofCO2, whereas autotrophic communities (GPP . CR andNCP . 0) are sinks of CO2. Deviation from metabolicbalance (CR < GPP) can occur if CR and GPP aretemporally and spatially uncoupled (Serret et al. 1999) or ifallochtonous inputs of carbon or nutrients stimulate GPPor CR disproportionally (Duarte and Prairie 2005). On thebasis of the metabolic theory of ecology (Gillooly et al.2001; Brown et al. 2004), it has been predicted that bothrespiration and photosynthesis should increase with in-creasing temperature, but respiration should do so at afaster rate than photosynthesis, suggesting a shift towardheterotrophy in a warmer future (Brown et al. 2004; Lopez-Urrutia et al. 2006). Empirical relationships betweentemperature and rates of photosynthesis and respirationare consistent with this prediction (Regaudie-De-Giouxand Duarte 2012). However, several studies of bacterialactivity in the Arctic have shown that both availability ofresources (carbon and nutrients) and temperature have tobe considered to understand the regulation of heterotrophicprocesses in the Arctic Ocean (Middelboe and Lundsgaard2003; Kirchman et al. 2009; Kritzberg et al. 2010). Atpresent, scarcity of data on autotrophic but especiallyheterotrophic processes results in poor spatial and tempo-ral resolution and limits the understanding of the controlson the metabolic balance of Arctic coastal ecosystems.Seasonal studies would be especially useful to resolve asystem’s overall metabolic status since autotrophic andheterotrophic processes are not necessarily coupled in time.
In this study, we measured pelagic metabolism inSeptember, February, and May in a subarctic fjord inWest Greenland. The aim was to provide examples of theseasonal variation in the balance between autotrophy andheterotrophy with emphasis on identifying (1) potentialphysicochemical and biological controls on community
metabolism, including the potential role of allochtonouscarbon, and (2) the role of plankton community metabo-lism in controlling surface-water partial pressure of CO2
(PCO2).
Methods
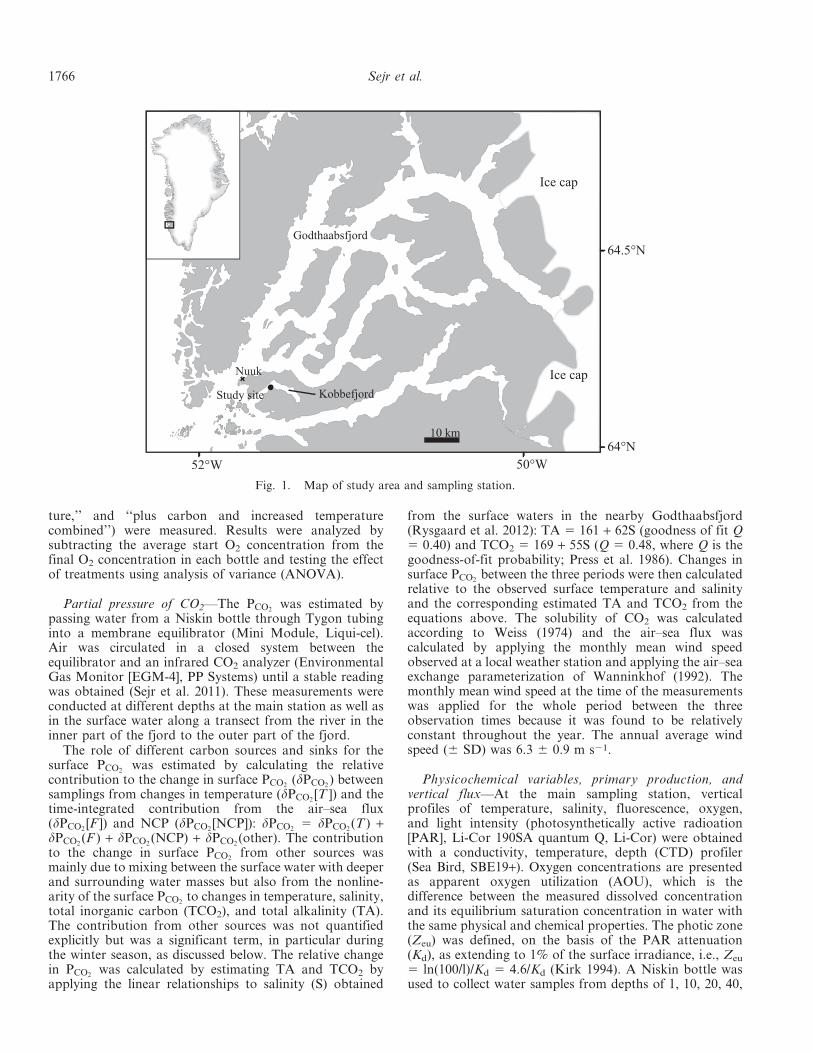
Study site—Sampling was performed during threecampaigns (September 2007, February 2008, and May2008) at a main sampling station in central Kobbefjord(depth 100 m at 64u10.129 N, 51u33.479 W). Kobbefjord is apart of the extensive Godthaabsfjord complex in WestGreenland (Fig. 1). Several large glaciers connect theGodthaabsfjord to the Greenland ice cap. Kobbefjord is17 km long and 0.8–2 km wide. Maximum depth is 150 mand maximum tidal range is 4.5 m (Richter et al. 2011). Themain freshwater input to the fjord is from a river in theinnermost part of the fjord. There are no glaciers that draindirectly into Kobbefjord, but glacial meltwater enters inlate summer from the Godthaabsfjord. Seasonal sea iceforms in the inner basin of Kobbefjord usually aroundDecember and breaks up in early May, whereas the outerpart of the fjord is ice free year round.
Oxygen production and consumption—Production andconsumption of O2 was determined by light and darkincubations in 120 mL Winkler bottles to determine NCPand CR. On the basis of NCP and CR, GPP of the watercolumn was calculated as GPP 5 NCP + CR. A 10 literpolyethylene container was filled with water from eachincubation depth (1, 10, 20, 40, and 80 m) using a 5 literNiskin bottle. The container was gently shaken tohomogenize the water before it was siphoned into 24Winkler bottles through a piece of Tygon tubing, allowingthe water to overflow for two volume changes. During thisprocess the water was filtered through a 200 mm filter toremove any metazoan plankton. The volume of the bottleswas ca. 120 mL but the actual volume of each was used inthe calculations. Eight of these received Winkler reagents Iand II (720 mL each) immediately for determination of theinitial O2 concentrations, eight others were placed insidetwo closed grey polyvinyl chloride tubes for incubation indarkness, and the last eight were placed inside twoplexiglass tubes for incubation in light (at 80 m only, darkincubation was performed). The tubes with bottles weredeployed at the sampling depth for 24 h (48 and 72 h inFebruary) on a mooring. The incubated bottles receivedWinkler reagents I and II immediately after being retrieved.The O2 concentration was analyzed with the photometricWinkler technique (Carpenter 1965) as modified byLabasque et al. (2004). Absorbance was read at 466 nmon a Shimadzu 1240 spectrophotometer, recording fourreadings for each bottle. Results are presented withpropagated standard deviations.
In February and May, in situ measurements of CR at10 m were compared with experimental treatments ofincreased temperature (6.5uC above in situ temperature)and DOC (glucose added equivalent to final concentrationof 450 mmol C L21). On each occasion, eight bottles of eachtreatment (‘‘control,’’ ‘‘plus carbon,’’ ‘‘increased tempera-
Subarctic ecosystem metabolism and CO2 1765
ture,’’ and ‘‘plus carbon and increased temperaturecombined’’) were measured. Results were analyzed bysubtracting the average start O2 concentration from thefinal O2 concentration in each bottle and testing the effectof treatments using analysis of variance (ANOVA).
Partial pressure of CO2—The PCO2was estimated by
passing water from a Niskin bottle through Tygon tubinginto a membrane equilibrator (Mini Module, Liqui-cel).Air was circulated in a closed system between theequilibrator and an infrared CO2 analyzer (EnvironmentalGas Monitor [EGM-4], PP Systems) until a stable readingwas obtained (Sejr et al. 2011). These measurements wereconducted at different depths at the main station as well asin the surface water along a transect from the river in theinner part of the fjord to the outer part of the fjord.
The role of different carbon sources and sinks for thesurface PCO2
was estimated by calculating the relativecontribution to the change in surface PCO2
(dPCO2) between
samplings from changes in temperature (dPCO2[T ]) and the
time-integrated contribution from the air–sea flux(dPCO2
[F ]) and NCP (dPCO2[NCP]): dPCO2
5 dPCO2(T ) +
dPCO2(F ) + dPCO2
(NCP) + dPCO2(other). The contribution
to the change in surface PCO2from other sources was
mainly due to mixing between the surface water with deeperand surrounding water masses but also from the nonline-arity of the surface PCO2
to changes in temperature, salinity,total inorganic carbon (TCO2), and total alkalinity (TA).The contribution from other sources was not quantifiedexplicitly but was a significant term, in particular duringthe winter season, as discussed below. The relative changein PCO2
was calculated by estimating TA and TCO2 byapplying the linear relationships to salinity (S) obtained
from the surface waters in the nearby Godthaabsfjord(Rysgaard et al. 2012): TA 5 161 + 62S (goodness of fit Q5 0.40) and TCO2 5 169 + 55S (Q 5 0.48, where Q is thegoodness-of-fit probability; Press et al. 1986). Changes insurface PCO2
between the three periods were then calculatedrelative to the observed surface temperature and salinityand the corresponding estimated TA and TCO2 from theequations above. The solubility of CO2 was calculatedaccording to Weiss (1974) and the air–sea flux wascalculated by applying the monthly mean wind speedobserved at a local weather station and applying the air–seaexchange parameterization of Wanninkhof (1992). Themonthly mean wind speed at the time of the measurementswas applied for the whole period between the threeobservation times because it was found to be relativelyconstant throughout the year. The annual average windspeed (6 SD) was 6.3 6 0.9 m s21.
Physicochemical variables, primary production, andvertical flux—At the main sampling station, verticalprofiles of temperature, salinity, fluorescence, oxygen,and light intensity (photosynthetically active radioation[PAR], Li-Cor 190SA quantum Q, Li-Cor) were obtainedwith a conductivity, temperature, depth (CTD) profiler(Sea Bird, SBE19+). Oxygen concentrations are presentedas apparent oxygen utilization (AOU), which is thedifference between the measured dissolved concentrationand its equilibrium saturation concentration in water withthe same physical and chemical properties. The photic zone(Zeu) was defined, on the basis of the PAR attenuation(Kd), as extending to 1% of the surface irradiance, i.e., Zeu
5 ln(100/l)/Kd 5 4.6/Kd (Kirk 1994). A Niskin bottle wasused to collect water samples from depths of 1, 10, 20, 40,
Fig. 1. Map of study area and sampling station.
1766 Sejr et al.
and 80 m for analysis of nutrients, chlorophyll a (Chl a),POC, and DOC. The concentration of NO{
3 + NO{2 was
determined as NO on a NOx analyzer (Model 42C, ThermoEnvironmental Instruments) after reduction to NO in hotvanadium chloride (Braham and Hendrix 1989). Phosphateand silicate were determined by standard colorimetricmethods and analyzed automatically on a robotic sampleprocessor coupled to a spectrophotometer (Gilson 222 XLand Shimadzu 1600 PC). Detection limits for NO{
3 + NO{2 ,
phosphate, and silicate were 0.15, 0.20, and 0.25 mmol L21
respectively. Chl a was determined by filtration onto GF/Cfilters (max. 0.3 bar), after which filters were extracted in96% ethanol for 24 h (at 4uC in the dark) and analyzedfluorometrically (Turner Designs TD-700). Phytoplanktonprimary production was determined by in situ incubationof 120 mL Winkler glass bottles at 5, 10, 20, 30, and 40 mdepth after adding 200 mL of Na2
14CO3 with an activity of20 mCi mL21 (Steemann Nielsen 1952). Two bottles wereincubated in the light and one bottle in the dark at eachdepth for 2 h close to noon. The content of each bottle wasfiltered onto GF/F filters that were transferred toscintillation vials and 100 mL of 1 mol L21 HCl was addedand the filters were fumed for 8 h. After addition ofscintillation fluid (UltimaGold+), the samples were mea-sured on a PerkinElmer scintillation counter. On oneoccasion in May, the total primary production (particulateand dissolved) was measured following the protocol byMoran et al. (2001). Activity in dark bottles was subtractedfrom light bottles.
Vertical sinking flux of particulate carbon was measuredusing duplicate free-drifting sediment traps deployed for 2 hat 60 m as described in Sejr et al. (2007). Contents of thetraps were filtered onto GF/F filters. Samples for POCcontent in the water column were also filtered ontoprecombusted GF/F filters. Filters were frozen andanalyzed on an elemental analyzer (Roboprep-CN, EuropeScientific). Water samples for determination of DOC werefiltered through precombusted GF/F filters and frozen(218uC) in combusted 20 mL vials until analysis on aShimadzu total organic carbon TOC-5000 analyzer.
Statistical analysis—We used a principal componentanalysis to investigate the effect of the abiotic variablesaffecting NCP and CR. However, the loadings for both setsof independent variables gave numerically similar loadingsfor all variables except for chlorophyll and POC (data notshown). This means that the principal component analysisdoes not enable identification of specific variables thatinfluence the first principal component and therefore doesnot clarify effects of individual variables. Instead, we firsttested the effects of month, day, and depth on NCP and CRusing a general linear model followed by tests of theinfluence that abiotic factors have on CR, GPP, and NCP.Tests were conducted using a general linear model for eachmonth to avoid mixing several different seasonally depen-dent mechanisms. For February there were too few data torun general linear models. The general linear models onlyincluded main factors. For this test CR and NCP were logtransformed (log[x + 5.2]) for residuals to be normallydistributed.
In the experiment on the effects of temperature andcarbon substrate on CR we subtracted the average (n 5 8)start O2 concentration from the final O2 concentration ineach of eight bottles and tested the effect of treatments(control, plus carbon, increased temperature, and pluscarbon and increased temperature combined) using AN-OVA. All statistics were calculated in SAS version 9.2 (SASInstitute).
Results
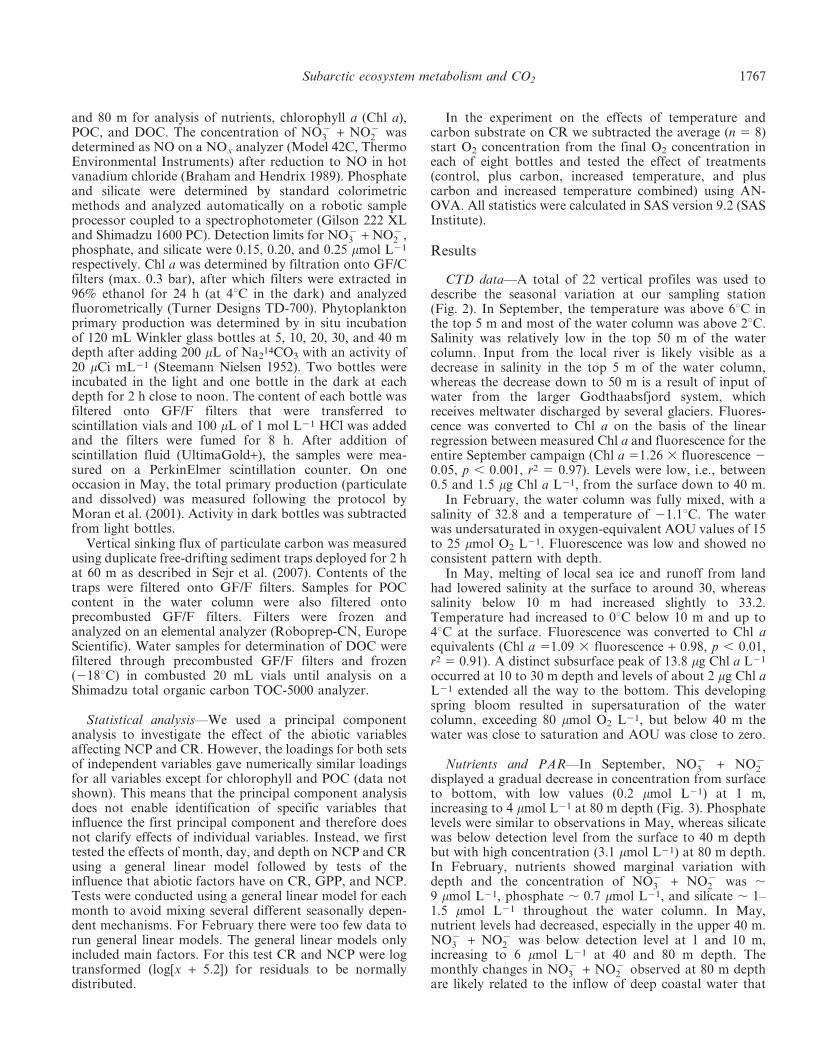
CTD data—A total of 22 vertical profiles was used todescribe the seasonal variation at our sampling station(Fig. 2). In September, the temperature was above 6uC inthe top 5 m and most of the water column was above 2uC.Salinity was relatively low in the top 50 m of the watercolumn. Input from the local river is likely visible as adecrease in salinity in the top 5 m of the water column,whereas the decrease down to 50 m is a result of input ofwater from the larger Godthaabsfjord system, whichreceives meltwater discharged by several glaciers. Fluores-cence was converted to Chl a on the basis of the linearregression between measured Chl a and fluorescence for theentire September campaign (Chl a 51.26 3 fluorescence 20.05, p , 0.001, r2 5 0.97). Levels were low, i.e., between0.5 and 1.5 mg Chl a L21, from the surface down to 40 m.
In February, the water column was fully mixed, with asalinity of 32.8 and a temperature of 21.1uC. The waterwas undersaturated in oxygen-equivalent AOU values of 15to 25 mmol O2 L21. Fluorescence was low and showed noconsistent pattern with depth.
In May, melting of local sea ice and runoff from landhad lowered salinity at the surface to around 30, whereassalinity below 10 m had increased slightly to 33.2.Temperature had increased to 0uC below 10 m and up to4uC at the surface. Fluorescence was converted to Chl aequivalents (Chl a 51.09 3 fluorescence + 0.98, p , 0.01,r2 5 0.91). A distinct subsurface peak of 13.8 mg Chl a L21
occurred at 10 to 30 m depth and levels of about 2 mg Chl aL21 extended all the way to the bottom. This developingspring bloom resulted in supersaturation of the watercolumn, exceeding 80 mmol O2 L21, but below 40 m thewater was close to saturation and AOU was close to zero.
Nutrients and PAR—In September, NO{3 + NO{
2displayed a gradual decrease in concentration from surfaceto bottom, with low values (0.2 mmol L21) at 1 m,increasing to 4 mmol L21 at 80 m depth (Fig. 3). Phosphatelevels were similar to observations in May, whereas silicatewas below detection level from the surface to 40 m depthbut with high concentration (3.1 mmol L21) at 80 m depth.In February, nutrients showed marginal variation withdepth and the concentration of NO{
3 + NO{2 was ,
9 mmol L21, phosphate , 0.7 mmol L21, and silicate , 1–1.5 mmol L21 throughout the water column. In May,nutrient levels had decreased, especially in the upper 40 m.NO{
3 + NO{2 was below detection level at 1 and 10 m,
increasing to 6 mmol L21 at 40 and 80 m depth. Themonthly changes in NO{
3 + NO{2 observed at 80 m depth
are likely related to the inflow of deep coastal water that
Subarctic ecosystem metabolism and CO2 1767
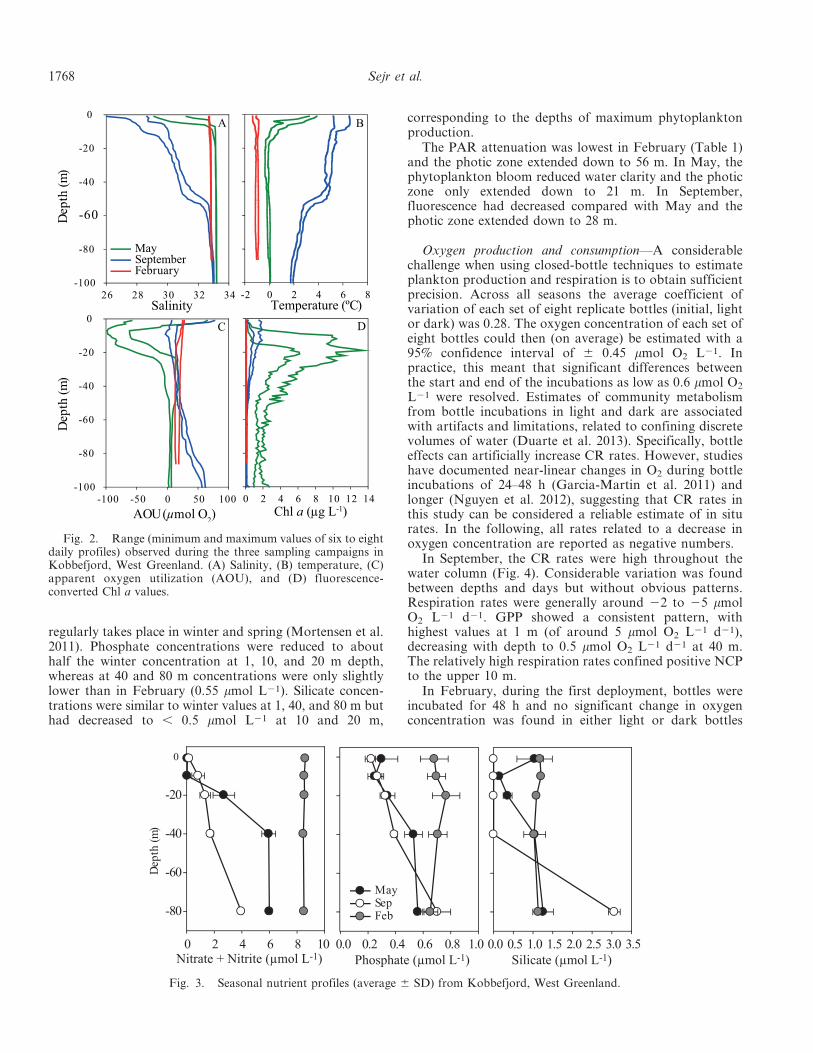
regularly takes place in winter and spring (Mortensen et al.2011). Phosphate concentrations were reduced to abouthalf the winter concentration at 1, 10, and 20 m depth,whereas at 40 and 80 m concentrations were only slightlylower than in February (0.55 mmol L21). Silicate concen-trations were similar to winter values at 1, 40, and 80 m buthad decreased to , 0.5 mmol L21 at 10 and 20 m,
corresponding to the depths of maximum phytoplanktonproduction.
The PAR attenuation was lowest in February (Table 1)and the photic zone extended down to 56 m. In May, thephytoplankton bloom reduced water clarity and the photiczone only extended down to 21 m. In September,fluorescence had decreased compared with May and thephotic zone extended down to 28 m.
Oxygen production and consumption—A considerablechallenge when using closed-bottle techniques to estimateplankton production and respiration is to obtain sufficientprecision. Across all seasons the average coefficient ofvariation of each set of eight replicate bottles (initial, lightor dark) was 0.28. The oxygen concentration of each set ofeight bottles could then (on average) be estimated with a95% confidence interval of 6 0.45 mmol O2 L21. Inpractice, this meant that significant differences betweenthe start and end of the incubations as low as 0.6 mmol O2
L21 were resolved. Estimates of community metabolismfrom bottle incubations in light and dark are associatedwith artifacts and limitations, related to confining discretevolumes of water (Duarte et al. 2013). Specifically, bottleeffects can artificially increase CR rates. However, studieshave documented near-linear changes in O2 during bottleincubations of 24–48 h (Garcia-Martin et al. 2011) andlonger (Nguyen et al. 2012), suggesting that CR rates inthis study can be considered a reliable estimate of in siturates. In the following, all rates related to a decrease inoxygen concentration are reported as negative numbers.
In September, the CR rates were high throughout thewater column (Fig. 4). Considerable variation was foundbetween depths and days but without obvious patterns.Respiration rates were generally around 22 to 25 mmolO2 L21 d21. GPP showed a consistent pattern, withhighest values at 1 m (of around 5 mmol O2 L21 d21),decreasing with depth to 0.5 mmol O2 L21 d21 at 40 m.The relatively high respiration rates confined positive NCPto the upper 10 m.
In February, during the first deployment, bottles wereincubated for 48 h and no significant change in oxygenconcentration was found in either light or dark bottles
Fig. 2. Range (minimum and maximum values of six to eightdaily profiles) observed during the three sampling campaigns inKobbefjord, West Greenland. (A) Salinity, (B) temperature, (C)apparent oxygen utilization (AOU), and (D) fluorescence-converted Chl a values.
Fig. 3. Seasonal nutrient profiles (average 6 SD) from Kobbefjord, West Greenland.
1768 Sejr et al.
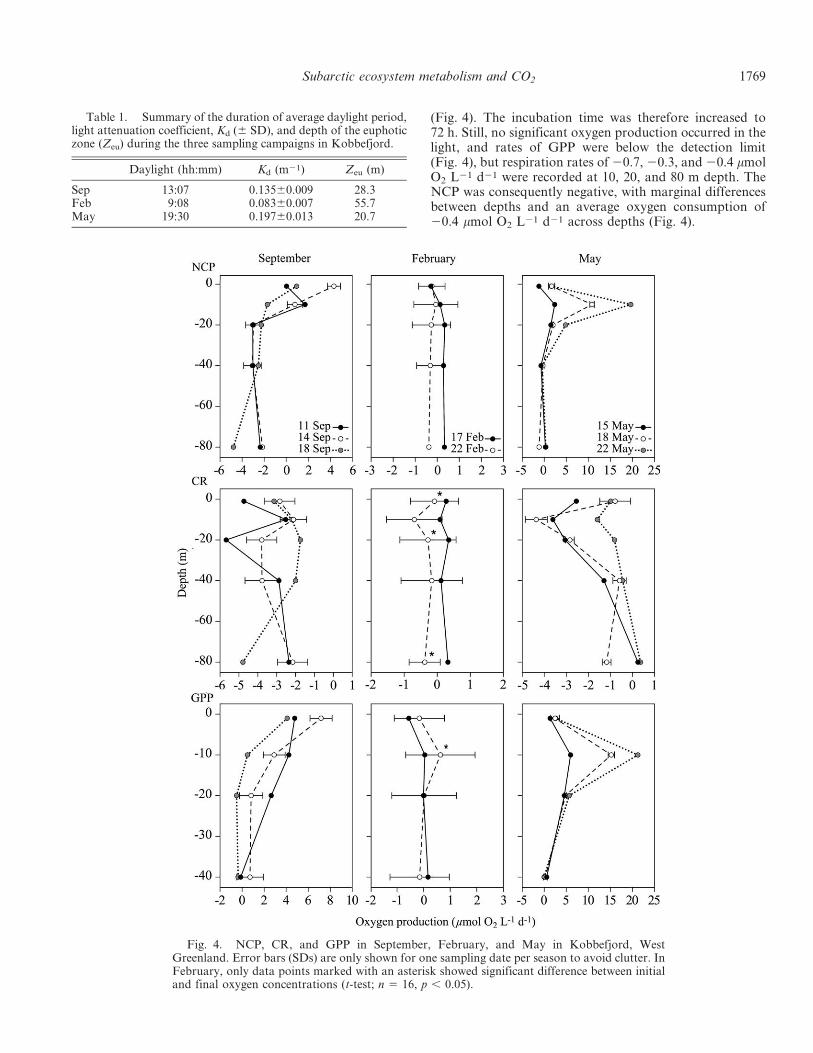
(Fig. 4). The incubation time was therefore increased to72 h. Still, no significant oxygen production occurred in thelight, and rates of GPP were below the detection limit(Fig. 4), but respiration rates of 20.7, 20.3, and 20.4 mmolO2 L21 d21 were recorded at 10, 20, and 80 m depth. TheNCP was consequently negative, with marginal differencesbetween depths and an average oxygen consumption of20.4 mmol O2 L21 d21 across depths (Fig. 4).
Table 1. Summary of the duration of average daylight period,light attenuation coefficient, Kd (6 SD), and depth of the euphoticzone (Zeu) during the three sampling campaigns in Kobbefjord.
Daylight (hh:mm) Kd (m21) Zeu (m)
Sep 13:07 0.13560.009 28.3Feb 9:08 0.08360.007 55.7May 19:30 0.19760.013 20.7
Fig. 4. NCP, CR, and GPP in September, February, and May in Kobbefjord, WestGreenland. Error bars (SDs) are only shown for one sampling date per season to avoid clutter. InFebruary, only data points marked with an asterisk showed significant difference between initialand final oxygen concentrations (t-test; n 5 16, p , 0.05).
Subarctic ecosystem metabolism and CO2 1769
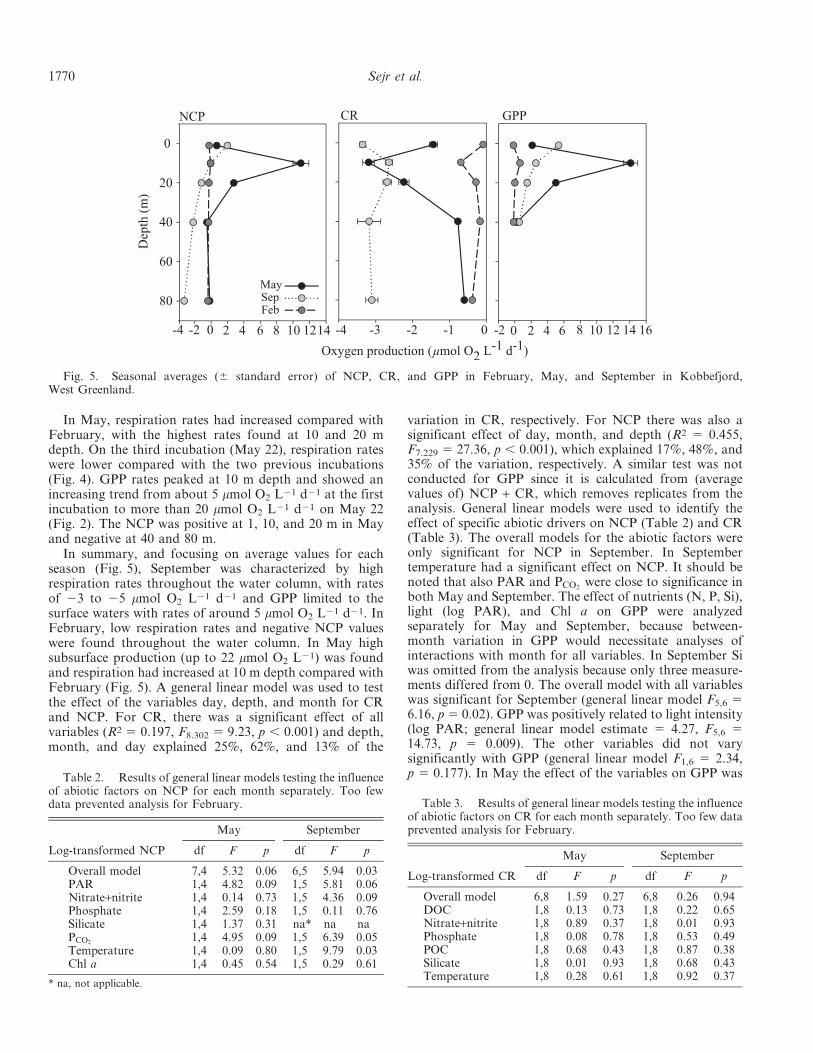
In May, respiration rates had increased compared withFebruary, with the highest rates found at 10 and 20 mdepth. On the third incubation (May 22), respiration rateswere lower compared with the two previous incubations(Fig. 4). GPP rates peaked at 10 m depth and showed anincreasing trend from about 5 mmol O2 L21 d21 at the firstincubation to more than 20 mmol O2 L21 d21 on May 22(Fig. 2). The NCP was positive at 1, 10, and 20 m in Mayand negative at 40 and 80 m.
In summary, and focusing on average values for eachseason (Fig. 5), September was characterized by highrespiration rates throughout the water column, with ratesof 23 to 25 mmol O2 L21 d21 and GPP limited to thesurface waters with rates of around 5 mmol O2 L21 d21. InFebruary, low respiration rates and negative NCP valueswere found throughout the water column. In May highsubsurface production (up to 22 mmol O2 L21) was foundand respiration had increased at 10 m depth compared withFebruary (Fig. 5). A general linear model was used to testthe effect of the variables day, depth, and month for CRand NCP. For CR, there was a significant effect of allvariables (R2 5 0.197, F8.302 5 9.23, p , 0.001) and depth,month, and day explained 25%, 62%, and 13% of the
variation in CR, respectively. For NCP there was also asignificant effect of day, month, and depth (R2 5 0.455,F7.229 5 27.36, p , 0.001), which explained 17%, 48%, and35% of the variation, respectively. A similar test was notconducted for GPP since it is calculated from (averagevalues of) NCP + CR, which removes replicates from theanalysis. General linear models were used to identify theeffect of specific abiotic drivers on NCP (Table 2) and CR(Table 3). The overall models for the abiotic factors wereonly significant for NCP in September. In Septembertemperature had a significant effect on NCP. It should benoted that also PAR and PCO2
were close to significance inboth May and September. The effect of nutrients (N, P, Si),light (log PAR), and Chl a on GPP were analyzedseparately for May and September, because between-month variation in GPP would necessitate analyses ofinteractions with month for all variables. In September Siwas omitted from the analysis because only three measure-ments differed from 0. The overall model with all variableswas significant for September (general linear model F5,6 56.16, p 5 0.02). GPP was positively related to light intensity(log PAR; general linear model estimate 5 4.27, F5,6 514.73, p 5 0.009). The other variables did not varysignificantly with GPP (general linear model F1,6 5 2.34,p 5 0.177). In May the effect of the variables on GPP was
Fig. 5. Seasonal averages (6 standard error) of NCP, CR, and GPP in February, May, and September in Kobbefjord,West Greenland.
Table 2. Results of general linear models testing the influenceof abiotic factors on NCP for each month separately. Too fewdata prevented analysis for February.
May September
Log-transformed NCP df F p df F p
Overall model 7,4 5.32 0.06 6,5 5.94 0.03PAR 1,4 4.82 0.09 1,5 5.81 0.06Nitrate+nitrite 1,4 0.14 0.73 1,5 4.36 0.09Phosphate 1,4 2.59 0.18 1,5 0.11 0.76Silicate 1,4 1.37 0.31 na* na naPCO2
1,4 4.95 0.09 1,5 6.39 0.05Temperature 1,4 0.09 0.80 1,5 9.79 0.03Chl a 1,4 0.45 0.54 1,5 0.29 0.61
* na, not applicable.
Table 3. Results of general linear models testing the influenceof abiotic factors on CR for each month separately. Too few dataprevented analysis for February.
May September
Log-transformed CR df F p df F p
Overall model 6,8 1.59 0.27 6,8 0.26 0.94DOC 1,8 0.13 0.73 1,8 0.22 0.65Nitrate+nitrite 1,8 0.89 0.37 1,8 0.01 0.93Phosphate 1,8 0.08 0.78 1,8 0.53 0.49POC 1,8 0.68 0.43 1,8 0.87 0.38Silicate 1,8 0.01 0.93 1,8 0.68 0.43Temperature 1,8 0.28 0.61 1,8 0.92 0.37
1770 Sejr et al.
not detectable, since the overall model was not significant(general linear model R2 5 0.598 F5,6 5 1.24, p 5 0.41).
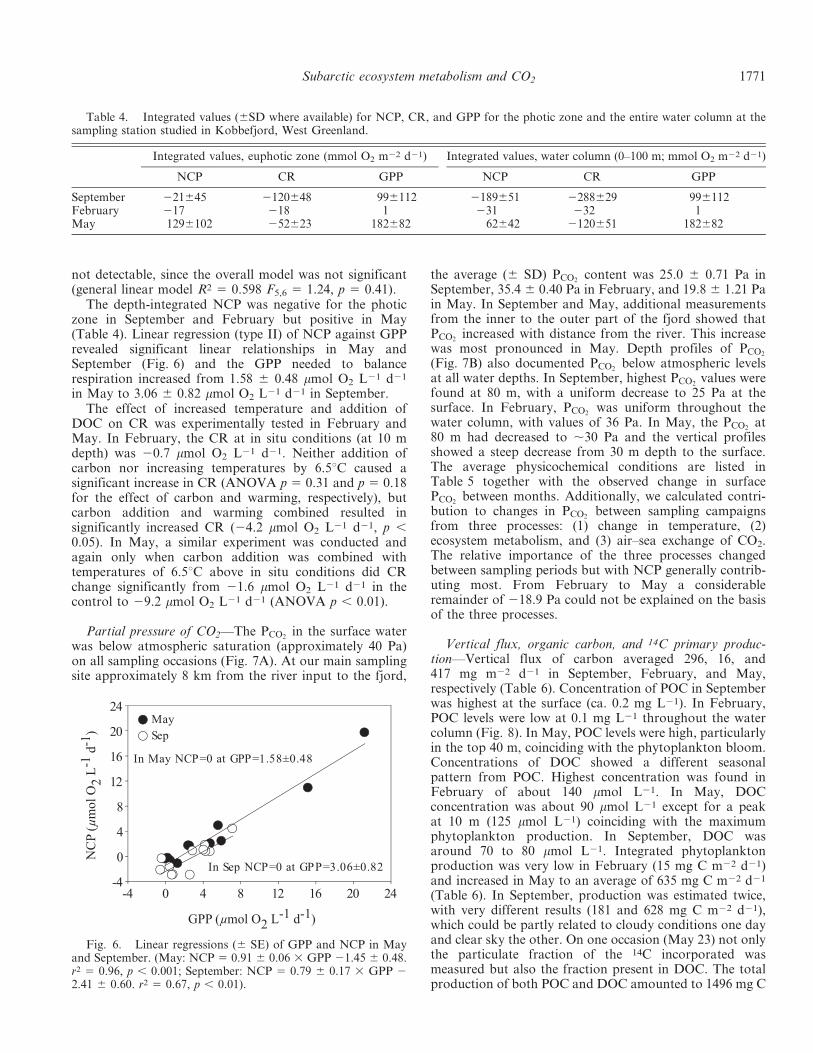
The depth-integrated NCP was negative for the photiczone in September and February but positive in May(Table 4). Linear regression (type II) of NCP against GPPrevealed significant linear relationships in May andSeptember (Fig. 6) and the GPP needed to balancerespiration increased from 1.58 6 0.48 mmol O2 L21 d21
in May to 3.06 6 0.82 mmol O2 L21 d21 in September.The effect of increased temperature and addition of
DOC on CR was experimentally tested in February andMay. In February, the CR at in situ conditions (at 10 mdepth) was 20.7 mmol O2 L21 d21. Neither addition ofcarbon nor increasing temperatures by 6.5uC caused asignificant increase in CR (ANOVA p 5 0.31 and p 5 0.18for the effect of carbon and warming, respectively), butcarbon addition and warming combined resulted insignificantly increased CR (24.2 mmol O2 L21 d21, p ,0.05). In May, a similar experiment was conducted andagain only when carbon addition was combined withtemperatures of 6.5uC above in situ conditions did CRchange significantly from 21.6 mmol O2 L21 d21 in thecontrol to 29.2 mmol O2 L21 d21 (ANOVA p , 0.01).
Partial pressure of CO2—The PCO2in the surface water
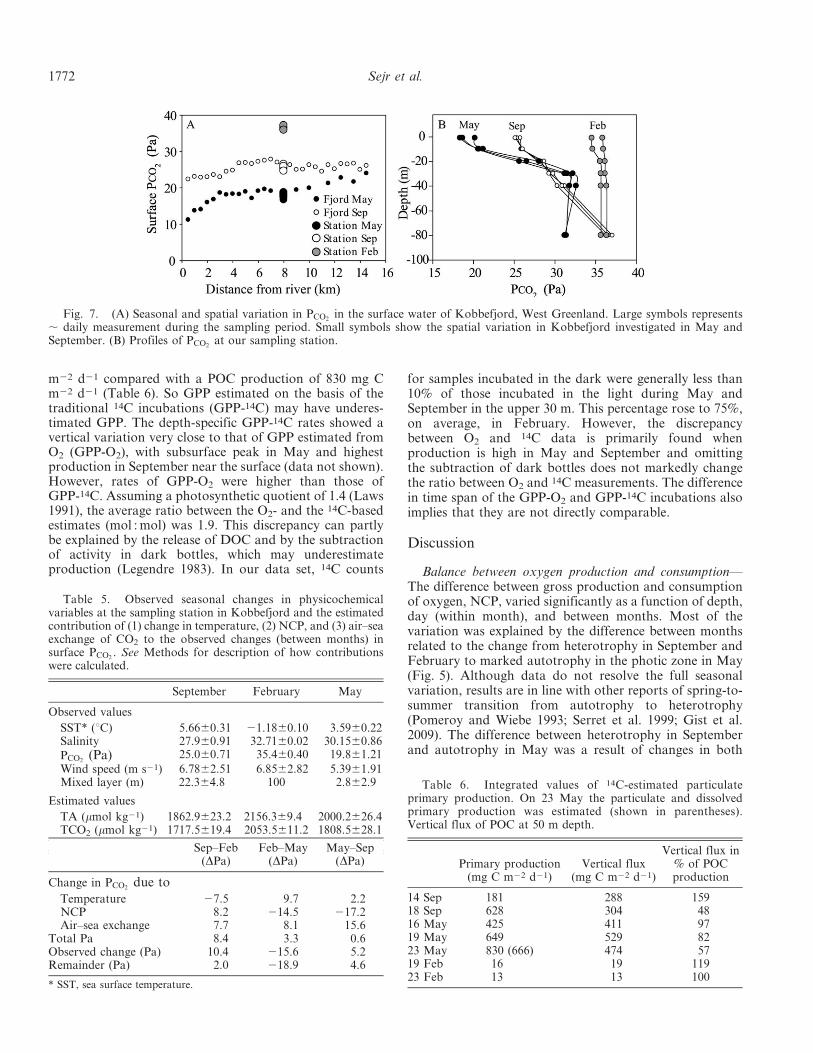
was below atmospheric saturation (approximately 40 Pa)on all sampling occasions (Fig. 7A). At our main samplingsite approximately 8 km from the river input to the fjord,
the average (6 SD) PCO2content was 25.0 6 0.71 Pa in
September, 35.4 6 0.40 Pa in February, and 19.8 6 1.21 Pain May. In September and May, additional measurementsfrom the inner to the outer part of the fjord showed thatPCO2
increased with distance from the river. This increasewas most pronounced in May. Depth profiles of PCO2
(Fig. 7B) also documented PCO2below atmospheric levels
at all water depths. In September, highest PCO2values were
found at 80 m, with a uniform decrease to 25 Pa at thesurface. In February, PCO2
was uniform throughout thewater column, with values of 36 Pa. In May, the PCO2
at80 m had decreased to ,30 Pa and the vertical profilesshowed a steep decrease from 30 m depth to the surface.The average physicochemical conditions are listed inTable 5 together with the observed change in surfacePCO2
between months. Additionally, we calculated contri-bution to changes in PCO2
between sampling campaignsfrom three processes: (1) change in temperature, (2)ecosystem metabolism, and (3) air–sea exchange of CO2.The relative importance of the three processes changedbetween sampling periods but with NCP generally contrib-uting most. From February to May a considerableremainder of 218.9 Pa could not be explained on the basisof the three processes.
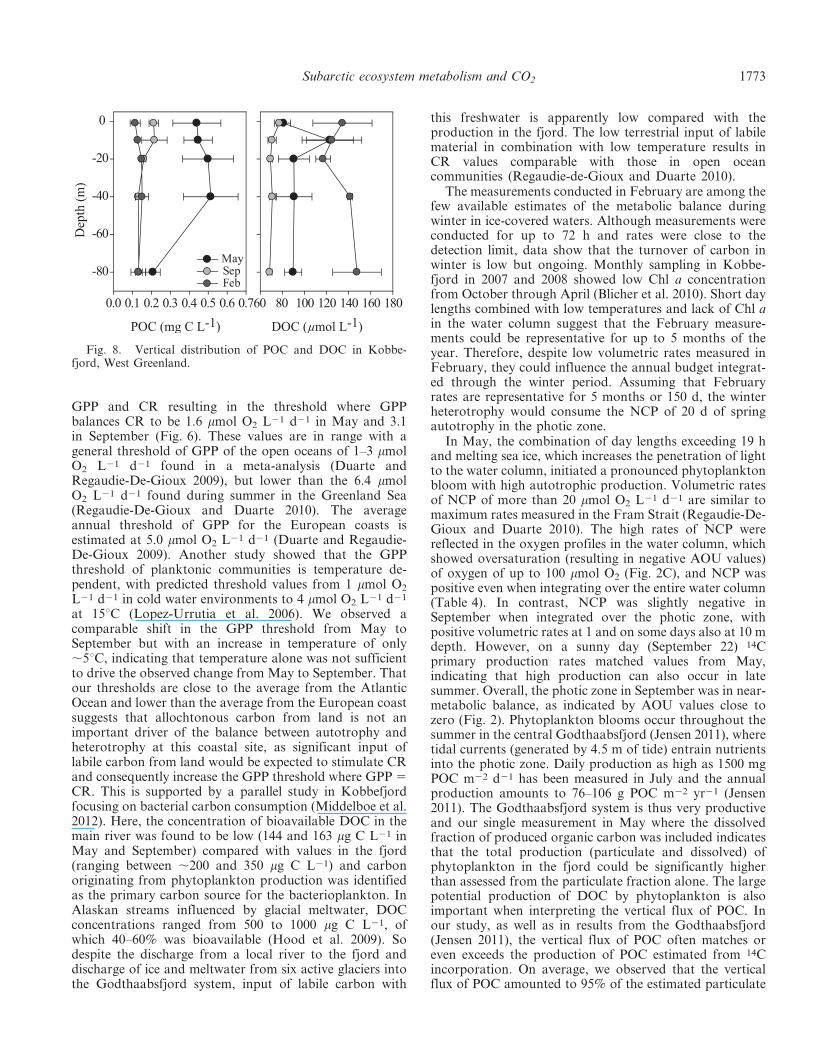
Vertical flux, organic carbon, and 14C primary produc-tion—Vertical flux of carbon averaged 296, 16, and417 mg m22 d21 in September, February, and May,respectively (Table 6). Concentration of POC in Septemberwas highest at the surface (ca. 0.2 mg L21). In February,POC levels were low at 0.1 mg L21 throughout the watercolumn (Fig. 8). In May, POC levels were high, particularlyin the top 40 m, coinciding with the phytoplankton bloom.Concentrations of DOC showed a different seasonalpattern from POC. Highest concentration was found inFebruary of about 140 mmol L21. In May, DOCconcentration was about 90 mmol L21 except for a peakat 10 m (125 mmol L21) coinciding with the maximumphytoplankton production. In September, DOC wasaround 70 to 80 mmol L21. Integrated phytoplanktonproduction was very low in February (15 mg C m22 d21)and increased in May to an average of 635 mg C m22 d21
(Table 6). In September, production was estimated twice,with very different results (181 and 628 mg C m22 d21),which could be partly related to cloudy conditions one dayand clear sky the other. On one occasion (May 23) not onlythe particulate fraction of the 14C incorporated wasmeasured but also the fraction present in DOC. The totalproduction of both POC and DOC amounted to 1496 mg C
Table 4. Integrated values (6SD where available) for NCP, CR, and GPP for the photic zone and the entire water column at thesampling station studied in Kobbefjord, West Greenland.
Integrated values, euphotic zone (mmol O2 m22 d21) Integrated values, water column (0–100 m; mmol O2 m22 d21)
NCP CR GPP NCP CR GPP
September 221645 2120648 996112 2189651 2288629 996112February 217 218 1 231 232 1May 1296102 252623 182682 62642 2120651 182682
Fig. 6. Linear regressions (6 SE) of GPP and NCP in Mayand September. (May: NCP 5 0.91 6 0.06 3 GPP 21.45 6 0.48.r2 5 0.96, p , 0.001; September: NCP 5 0.79 6 0.17 3 GPP 22.41 6 0.60. r2 5 0.67, p , 0.01).
Subarctic ecosystem metabolism and CO2 1771
m22 d21 compared with a POC production of 830 mg Cm22 d21 (Table 6). So GPP estimated on the basis of thetraditional 14C incubations (GPP-14C) may have underes-timated GPP. The depth-specific GPP-14C rates showed avertical variation very close to that of GPP estimated fromO2 (GPP-O2), with subsurface peak in May and highestproduction in September near the surface (data not shown).However, rates of GPP-O2 were higher than those ofGPP-14C. Assuming a photosynthetic quotient of 1.4 (Laws1991), the average ratio between the O2- and the 14C-basedestimates (mol : mol) was 1.9. This discrepancy can partlybe explained by the release of DOC and by the subtractionof activity in dark bottles, which may underestimateproduction (Legendre 1983). In our data set, 14C counts
for samples incubated in the dark were generally less than10% of those incubated in the light during May andSeptember in the upper 30 m. This percentage rose to 75%,on average, in February. However, the discrepancybetween O2 and 14C data is primarily found whenproduction is high in May and September and omittingthe subtraction of dark bottles does not markedly changethe ratio between O2 and 14C measurements. The differencein time span of the GPP-O2 and GPP-14C incubations alsoimplies that they are not directly comparable.
Discussion
Balance between oxygen production and consumption—The difference between gross production and consumptionof oxygen, NCP, varied significantly as a function of depth,day (within month), and between months. Most of thevariation was explained by the difference between monthsrelated to the change from heterotrophy in September andFebruary to marked autotrophy in the photic zone in May(Fig. 5). Although data do not resolve the full seasonalvariation, results are in line with other reports of spring-to-summer transition from autotrophy to heterotrophy(Pomeroy and Wiebe 1993; Serret et al. 1999; Gist et al.2009). The difference between heterotrophy in Septemberand autotrophy in May was a result of changes in both
Fig. 7. (A) Seasonal and spatial variation in PCO2in the surface water of Kobbefjord, West Greenland. Large symbols represents
, daily measurement during the sampling period. Small symbols show the spatial variation in Kobbefjord investigated in May andSeptember. (B) Profiles of PCO2
at our sampling station.
Table 5. Observed seasonal changes in physicochemicalvariables at the sampling station in Kobbefjord and the estimatedcontribution of (1) change in temperature, (2) NCP, and (3) air–seaexchange of CO2 to the observed changes (between months) insurface PCO2
. See Methods for description of how contributionswere calculated.
September February May
Observed values
SST* (uC) 5.6660.31 21.1860.10 3.5960.22Salinity 27.960.91 32.7160.02 30.1560.86PCO2
(Pa) 25.060.71 35.460.40 19.861.21
Wind speed (m s21) 6.7862.51 6.8562.82 5.3961.91Mixed layer (m) 22.364.8 100 2.862.9
Estimated values
TA (mmol kg21) 1862.9623.2 2156.369.4 2000.2626.4TCO2 (mmol kg21) 1717.5619.4 2053.5611.2 1808.5628.1
Sep–Feb(DPa)
Feb–May(DPa)
May–Sep(DPa)
Change in PCO2due to
Temperature 27.5 9.7 2.2NCP 8.2 214.5 217.2Air–sea exchange 7.7 8.1 15.6
Total Pa 8.4 3.3 0.6Observed change (Pa) 10.4 215.6 5.2Remainder (Pa) 2.0 218.9 4.6
* SST, sea surface temperature.
Table 6. Integrated values of 14C-estimated particulateprimary production. On 23 May the particulate and dissolvedprimary production was estimated (shown in parentheses).Vertical flux of POC at 50 m depth.
Primary production(mg C m22 d21)
Vertical flux(mg C m22 d21)
Vertical flux in% of POCproduction
14 Sep 181 288 15918 Sep 628 304 4816 May 425 411 9719 May 649 529 8223 May 830 (666) 474 5719 Feb 16 19 11923 Feb 13 13 100
1772 Sejr et al.
GPP and CR resulting in the threshold where GPPbalances CR to be 1.6 mmol O2 L21 d21 in May and 3.1in September (Fig. 6). These values are in range with ageneral threshold of GPP of the open oceans of 1–3 mmolO2 L21 d21 found in a meta-analysis (Duarte andRegaudie-De-Gioux 2009), but lower than the 6.4 mmolO2 L21 d21 found during summer in the Greenland Sea(Regaudie-De-Gioux and Duarte 2010). The averageannual threshold of GPP for the European coasts isestimated at 5.0 mmol O2 L21 d21 (Duarte and Regaudie-De-Gioux 2009). Another study showed that the GPPthreshold of planktonic communities is temperature de-pendent, with predicted threshold values from 1 mmol O2
L21 d21 in cold water environments to 4 mmol O2 L21 d21
at 15uC (Lopez-Urrutia et al. 2006). We observed acomparable shift in the GPP threshold from May toSeptember but with an increase in temperature of only,5uC, indicating that temperature alone was not sufficientto drive the observed change from May to September. Thatour thresholds are close to the average from the AtlanticOcean and lower than the average from the European coastsuggests that allochtonous carbon from land is not animportant driver of the balance between autotrophy andheterotrophy at this coastal site, as significant input oflabile carbon from land would be expected to stimulate CRand consequently increase the GPP threshold where GPP 5CR. This is supported by a parallel study in Kobbefjordfocusing on bacterial carbon consumption (Middelboe et al.2012). Here, the concentration of bioavailable DOC in themain river was found to be low (144 and 163 mg C L21 inMay and September) compared with values in the fjord(ranging between ,200 and 350 mg C L21) and carbonoriginating from phytoplankton production was identifiedas the primary carbon source for the bacterioplankton. InAlaskan streams influenced by glacial meltwater, DOCconcentrations ranged from 500 to 1000 mg C L21, ofwhich 40–60% was bioavailable (Hood et al. 2009). Sodespite the discharge from a local river to the fjord anddischarge of ice and meltwater from six active glaciers intothe Godthaabsfjord system, input of labile carbon with
this freshwater is apparently low compared with theproduction in the fjord. The low terrestrial input of labilematerial in combination with low temperature results inCR values comparable with those in open oceancommunities (Regaudie-de-Gioux and Duarte 2010).
The measurements conducted in February are among thefew available estimates of the metabolic balance duringwinter in ice-covered waters. Although measurements wereconducted for up to 72 h and rates were close to thedetection limit, data show that the turnover of carbon inwinter is low but ongoing. Monthly sampling in Kobbe-fjord in 2007 and 2008 showed low Chl a concentrationfrom October through April (Blicher et al. 2010). Short daylengths combined with low temperatures and lack of Chl ain the water column suggest that the February measure-ments could be representative for up to 5 months of theyear. Therefore, despite low volumetric rates measured inFebruary, they could influence the annual budget integrat-ed through the winter period. Assuming that Februaryrates are representative for 5 months or 150 d, the winterheterotrophy would consume the NCP of 20 d of springautotrophy in the photic zone.
In May, the combination of day lengths exceeding 19 hand melting sea ice, which increases the penetration of lightto the water column, initiated a pronounced phytoplanktonbloom with high autotrophic production. Volumetric ratesof NCP of more than 20 mmol O2 L21 d21 are similar tomaximum rates measured in the Fram Strait (Regaudie-De-Gioux and Duarte 2010). The high rates of NCP werereflected in the oxygen profiles in the water column, whichshowed oversaturation (resulting in negative AOU values)of oxygen of up to 100 mmol O2 (Fig. 2C), and NCP waspositive even when integrating over the entire water column(Table 4). In contrast, NCP was slightly negative inSeptember when integrated over the photic zone, withpositive volumetric rates at 1 and on some days also at 10 mdepth. However, on a sunny day (September 22) 14Cprimary production rates matched values from May,indicating that high production can also occur in latesummer. Overall, the photic zone in September was in near-metabolic balance, as indicated by AOU values close tozero (Fig. 2). Phytoplankton blooms occur throughout thesummer in the central Godthaabsfjord (Jensen 2011), wheretidal currents (generated by 4.5 m of tide) entrain nutrientsinto the photic zone. Daily production as high as 1500 mgPOC m22 d21 has been measured in July and the annualproduction amounts to 76–106 g POC m22 yr21 (Jensen2011). The Godthaabsfjord system is thus very productiveand our single measurement in May where the dissolvedfraction of produced organic carbon was included indicatesthat the total production (particulate and dissolved) ofphytoplankton in the fjord could be significantly higherthan assessed from the particulate fraction alone. The largepotential production of DOC by phytoplankton is alsoimportant when interpreting the vertical flux of POC. Inour study, as well as in results from the Godthaabsfjord(Jensen 2011), the vertical flux of POC often matches oreven exceeds the production of POC estimated from 14Cincorporation. On average, we observed that the verticalflux of POC amounted to 95% of the estimated particulate
Fig. 8. Vertical distribution of POC and DOC in Kobbe-fjord, West Greenland.
Subarctic ecosystem metabolism and CO2 1773
production, which is in line with other observations inGreenland (Sejr et al. 2007) and also with the observationof high carbon demand by the dominant benthic species inKobbefjord (Blicher et al. 2009). A 95% loss rate due tovertical flux combined with an estimated bacterioplanktoncarbon demand in Kobbefjord of 80% of the 14C-derivedPOC production (Middelboe et al. 2012) suggest that suchshort-term fluxes are often not closely coupled. Thefraction of dissolved to total production averages 45% inour limited measurements (one station, four depths in May)and could contribute substrate to the bacterioplankton.The dissolved fraction can originate from passive diffusionthrough the cell membrane but may also represent anadaptive process to cope with high light and low nutrientconditions. Our observations in May are high but in therange of other observations in the Arctic (Gosselin 1997).
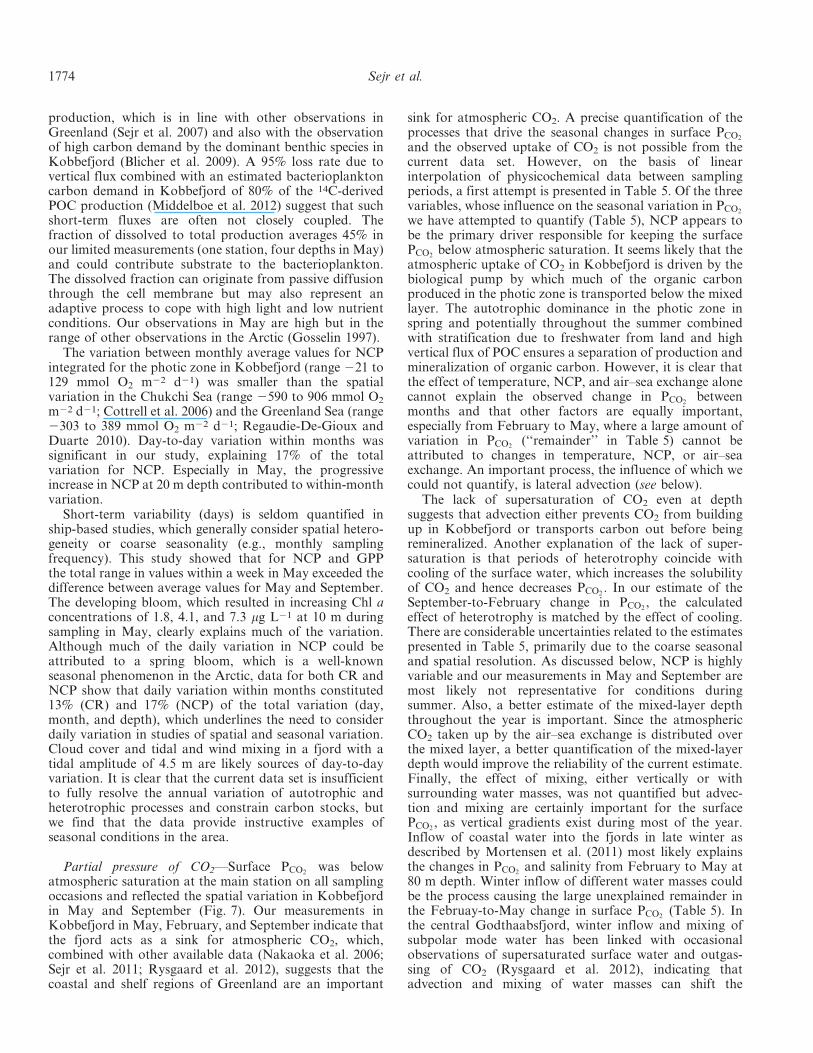
The variation between monthly average values for NCPintegrated for the photic zone in Kobbefjord (range 221 to129 mmol O2 m22 d21) was smaller than the spatialvariation in the Chukchi Sea (range 2590 to 906 mmol O2
m22 d21; Cottrell et al. 2006) and the Greenland Sea (range2303 to 389 mmol O2 m22 d21; Regaudie-De-Gioux andDuarte 2010). Day-to-day variation within months wassignificant in our study, explaining 17% of the totalvariation for NCP. Especially in May, the progressiveincrease in NCP at 20 m depth contributed to within-monthvariation.
Short-term variability (days) is seldom quantified inship-based studies, which generally consider spatial hetero-geneity or coarse seasonality (e.g., monthly samplingfrequency). This study showed that for NCP and GPPthe total range in values within a week in May exceeded thedifference between average values for May and September.The developing bloom, which resulted in increasing Chl aconcentrations of 1.8, 4.1, and 7.3 mg L21 at 10 m duringsampling in May, clearly explains much of the variation.Although much of the daily variation in NCP could beattributed to a spring bloom, which is a well-knownseasonal phenomenon in the Arctic, data for both CR andNCP show that daily variation within months constituted13% (CR) and 17% (NCP) of the total variation (day,month, and depth), which underlines the need to considerdaily variation in studies of spatial and seasonal variation.Cloud cover and tidal and wind mixing in a fjord with atidal amplitude of 4.5 m are likely sources of day-to-dayvariation. It is clear that the current data set is insufficientto fully resolve the annual variation of autotrophic andheterotrophic processes and constrain carbon stocks, butwe find that the data provide instructive examples ofseasonal conditions in the area.
Partial pressure of CO2—Surface PCO2was below
atmospheric saturation at the main station on all samplingoccasions and reflected the spatial variation in Kobbefjordin May and September (Fig. 7). Our measurements inKobbefjord in May, February, and September indicate thatthe fjord acts as a sink for atmospheric CO2, which,combined with other available data (Nakaoka et al. 2006;Sejr et al. 2011; Rysgaard et al. 2012), suggests that thecoastal and shelf regions of Greenland are an important
sink for atmospheric CO2. A precise quantification of theprocesses that drive the seasonal changes in surface PCO2
and the observed uptake of CO2 is not possible from thecurrent data set. However, on the basis of linearinterpolation of physicochemical data between samplingperiods, a first attempt is presented in Table 5. Of the threevariables, whose influence on the seasonal variation in PCO2
we have attempted to quantify (Table 5), NCP appears tobe the primary driver responsible for keeping the surfacePCO2
below atmospheric saturation. It seems likely that theatmospheric uptake of CO2 in Kobbefjord is driven by thebiological pump by which much of the organic carbonproduced in the photic zone is transported below the mixedlayer. The autotrophic dominance in the photic zone inspring and potentially throughout the summer combinedwith stratification due to freshwater from land and highvertical flux of POC ensures a separation of production andmineralization of organic carbon. However, it is clear thatthe effect of temperature, NCP, and air–sea exchange alonecannot explain the observed change in PCO2
betweenmonths and that other factors are equally important,especially from February to May, where a large amount ofvariation in PCO2
(‘‘remainder’’ in Table 5) cannot beattributed to changes in temperature, NCP, or air–seaexchange. An important process, the influence of which wecould not quantify, is lateral advection (see below).
The lack of supersaturation of CO2 even at depthsuggests that advection either prevents CO2 from buildingup in Kobbefjord or transports carbon out before beingremineralized. Another explanation of the lack of super-saturation is that periods of heterotrophy coincide withcooling of the surface water, which increases the solubilityof CO2 and hence decreases PCO2
. In our estimate of theSeptember-to-February change in PCO2
, the calculatedeffect of heterotrophy is matched by the effect of cooling.There are considerable uncertainties related to the estimatespresented in Table 5, primarily due to the coarse seasonaland spatial resolution. As discussed below, NCP is highlyvariable and our measurements in May and September aremost likely not representative for conditions duringsummer. Also, a better estimate of the mixed-layer depththroughout the year is important. Since the atmosphericCO2 taken up by the air–sea exchange is distributed overthe mixed layer, a better quantification of the mixed-layerdepth would improve the reliability of the current estimate.Finally, the effect of mixing, either vertically or withsurrounding water masses, was not quantified but advec-tion and mixing are certainly important for the surfacePCO2
, as vertical gradients exist during most of the year.Inflow of coastal water into the fjords in late winter asdescribed by Mortensen et al. (2011) most likely explainsthe changes in PCO2
and salinity from February to May at80 m depth. Winter inflow of different water masses couldbe the process causing the large unexplained remainder inthe Februay-to-May change in surface PCO2
(Table 5). Inthe central Godthaabsfjord, winter inflow and mixing ofsubpolar mode water has been linked with occasionalobservations of supersaturated surface water and outgas-sing of CO2 (Rysgaard et al. 2012), indicating thatadvection and mixing of water masses can shift the
1774 Sejr et al.
direction of the flux of CO2 between sea and atmosphere.Variation in both NCP and PCO2
in the Godthaabsfjordsystem is most likely linked to the degree of vertical mixing,as this directly influences the transport of both nutrientsand CO2 from deep water to the surface.
The very-low PCO2values in May resulting from high
NCP in the spring bloom and freshening of the fjordsuggests that CO2 may be limiting primary productionduring the late spring and early summer. Enhanced primaryproduction in response to increasing CO2 concentrations iswell documented experimentally (Riebesell et al. 2007; Fenget al. 2009) and Hein and Sand-Jensen (1997) reportedwidespread increased primary production in response toexperimentally enhanced CO2 across the Atlantic Ocean.Thus, phytoplankton photosynthesis may experience CO2
limitation in situations where mineral nutrients areabundant and PCO2
in the photic zone is low, as is thecase in the Arctic during the spring bloom (Takahashi et al.2002; Sakshaug et al. 2009). CO2 limitation of primaryproduction in Greenland coastal waters could possibly leadto a fertilization effect of increased atmospheric concen-trations of CO2 on phytoplankton, as suggested for otherareas (Riebesell et al. 2007; Feng et al. 2009).
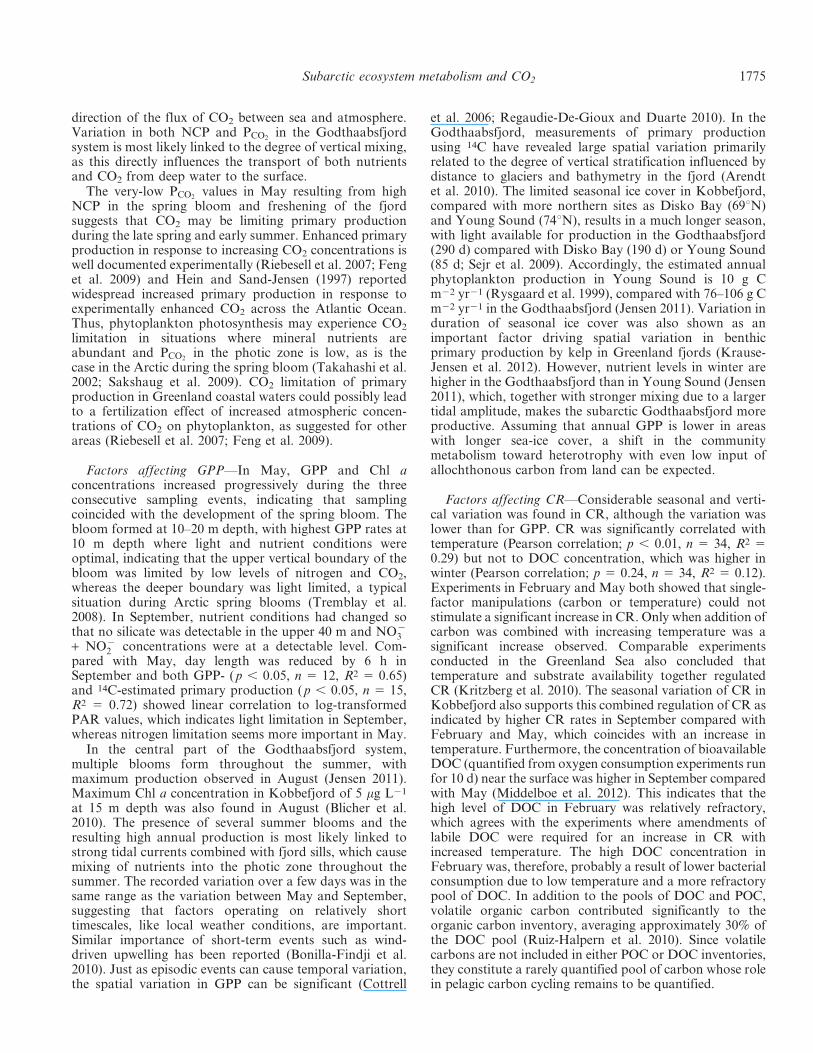
Factors affecting GPP—In May, GPP and Chl aconcentrations increased progressively during the threeconsecutive sampling events, indicating that samplingcoincided with the development of the spring bloom. Thebloom formed at 10–20 m depth, with highest GPP rates at10 m depth where light and nutrient conditions wereoptimal, indicating that the upper vertical boundary of thebloom was limited by low levels of nitrogen and CO2,whereas the deeper boundary was light limited, a typicalsituation during Arctic spring blooms (Tremblay et al.2008). In September, nutrient conditions had changed sothat no silicate was detectable in the upper 40 m and NO{
3+ NO{
2 concentrations were at a detectable level. Com-pared with May, day length was reduced by 6 h inSeptember and both GPP- ( p , 0.05, n 5 12, R2 5 0.65)and 14C-estimated primary production ( p , 0.05, n 5 15,R2 5 0.72) showed linear correlation to log-transformedPAR values, which indicates light limitation in September,whereas nitrogen limitation seems more important in May.
In the central part of the Godthaabsfjord system,multiple blooms form throughout the summer, withmaximum production observed in August (Jensen 2011).Maximum Chl a concentration in Kobbefjord of 5 mg L21
at 15 m depth was also found in August (Blicher et al.2010). The presence of several summer blooms and theresulting high annual production is most likely linked tostrong tidal currents combined with fjord sills, which causemixing of nutrients into the photic zone throughout thesummer. The recorded variation over a few days was in thesame range as the variation between May and September,suggesting that factors operating on relatively shorttimescales, like local weather conditions, are important.Similar importance of short-term events such as wind-driven upwelling has been reported (Bonilla-Findji et al.2010). Just as episodic events can cause temporal variation,the spatial variation in GPP can be significant (Cottrell
et al. 2006; Regaudie-De-Gioux and Duarte 2010). In theGodthaabsfjord, measurements of primary productionusing 14C have revealed large spatial variation primarilyrelated to the degree of vertical stratification influenced bydistance to glaciers and bathymetry in the fjord (Arendtet al. 2010). The limited seasonal ice cover in Kobbefjord,compared with more northern sites as Disko Bay (69uN)and Young Sound (74uN), results in a much longer season,with light available for production in the Godthaabsfjord(290 d) compared with Disko Bay (190 d) or Young Sound(85 d; Sejr et al. 2009). Accordingly, the estimated annualphytoplankton production in Young Sound is 10 g Cm22 yr21 (Rysgaard et al. 1999), compared with 76–106 g Cm22 yr21 in the Godthaabsfjord (Jensen 2011). Variation induration of seasonal ice cover was also shown as animportant factor driving spatial variation in benthicprimary production by kelp in Greenland fjords (Krause-Jensen et al. 2012). However, nutrient levels in winter arehigher in the Godthaabsfjord than in Young Sound (Jensen2011), which, together with stronger mixing due to a largertidal amplitude, makes the subarctic Godthaabsfjord moreproductive. Assuming that annual GPP is lower in areaswith longer sea-ice cover, a shift in the communitymetabolism toward heterotrophy with even low input ofallochthonous carbon from land can be expected.
Factors affecting CR—Considerable seasonal and verti-cal variation was found in CR, although the variation waslower than for GPP. CR was significantly correlated withtemperature (Pearson correlation; p , 0.01, n 5 34, R2 50.29) but not to DOC concentration, which was higher inwinter (Pearson correlation; p 5 0.24, n 5 34, R2 5 0.12).Experiments in February and May both showed that single-factor manipulations (carbon or temperature) could notstimulate a significant increase in CR. Only when addition ofcarbon was combined with increasing temperature was asignificant increase observed. Comparable experimentsconducted in the Greenland Sea also concluded thattemperature and substrate availability together regulatedCR (Kritzberg et al. 2010). The seasonal variation of CR inKobbefjord also supports this combined regulation of CR asindicated by higher CR rates in September compared withFebruary and May, which coincides with an increase intemperature. Furthermore, the concentration of bioavailableDOC (quantified from oxygen consumption experiments runfor 10 d) near the surface was higher in September comparedwith May (Middelboe et al. 2012). This indicates that thehigh level of DOC in February was relatively refractory,which agrees with the experiments where amendments oflabile DOC were required for an increase in CR withincreased temperature. The high DOC concentration inFebruary was, therefore, probably a result of lower bacterialconsumption due to low temperature and a more refractorypool of DOC. In addition to the pools of DOC and POC,volatile organic carbon contributed significantly to theorganic carbon inventory, averaging approximately 30% ofthe DOC pool (Ruiz-Halpern et al. 2010). Since volatilecarbons are not included in either POC or DOC inventories,they constitute a rarely quantified pool of carbon whose rolein pelagic carbon cycling remains to be quantified.
Subarctic ecosystem metabolism and CO2 1775
The following conclusions could be made with regard tocarbon cycling in this seasonally ice-covered Greenlandfjord. (1) Production estimated as GPP on the basis of 14Cincorporation was high, with a spring bloom in May butwith production throughout the summer and fall. InSeptember, light rather than nutrients appears to be limitingGPP. (2) CR was generally low, resulting in thresholds whereGPP 5 CR is in range with values of the open ocean,indicating that allochtonous carbon from land was notimportant for ecosystem metabolism, a finding supported byconcentrations of labile DOC in the river discharging into inKobbefjord being lower than the concentration in the fjord(Middelboe et al. 2012). (3) CR in winter was low (average20.4 mmol L21 d21), and is one of the few availableestimates of winter respiration in Arctic waters. On anannual scale, winter respiration was significant and couldrepresent conditions existing for up to 150 d. (4) PCO2
wasbelow atmospheric saturation in surface water and invertical profiles on all sample dates, indicating that the fjordwas an annual sink for atmospheric carbon. (5) Communitymetabolism appears to be an important driver of theseasonal variation in surface PCO2
. Autotrophy combinedwith high vertical transport of particulate carbon out of thephotic zone drives uptake of atmospheric carbon in summer.(6) During winter, the influence of heterotrophy on surfacePCO2
appears to be equivalent to the opposite effect exertedby cooling, resulting in surface water below atmosphericsaturation also in February.
The influence of terrestrial carbon on coastal marineecosystems depends on the ratio between autochthonous andallochthonous carbon, which varies locally depending on thedistance from the meltwater source. In the Godthaabsfjordthe input of glacial meltwater has been shown to influencepelagic (Tang 2011) and benthic (Sejr et al. 2010) ecosystemstructure. At the site of this study, high autochthonousproduction limits the relative influence of terrestrial carbonand the primary effect of the freshwater is on the physicalstructure of the water column. In fjords with morepronounced ice cover the autochtonous production can beexpected to be lower and hence terrestrial carbon could exerta stronger control on the metabolic balance. The high ArcticYoung Sound in East Greenland is ice covered 8–9 monthsper year, which limits annual pelagic production to about10 g C m22 yr21 (Rysgaard et al. 1999) or about 10% of theestimated annual production in the Godthaabsfjord. InYoung Sound, it has been estimated that 40% of the annualflux of organic particles to the seafloor is of terrestrial origin,indicating that allochthonous carbon can be an importantfactor for the coastal ecosystems in Greenland (Rysgaardand Sejr 2007). More studies on the local and regionalvariability are needed before the effects of a melting ice capon Greenland coastal water can be assessed.
AcknowledgmentsThomas Juul-Pedersen and Flemming Heinrich from the
Greenland Institute of Natural Resources are greatly acknowledgedfor help during fieldwork. Asiaq kindly provided wind data. Tworeviewers are greatly acknowledged for constructive comments thatimproved the manuscript.
This study was financed by a grant from the Commission forScientific Research in Greenland (KVUG) and by the European
Union’s Seventh Framework Programme, grant agreement 226248–Arctic Tipping Points and is a contribution to the GreenlandEcosystem Monitoring program. M.M. was supported by the DanishCouncil for Independent Research (09-072829) and the Carlsbergfoundation. S.R. was supported from the project ‘‘DepictingEcosystem–Climate Feedbacks from Permafrost, Snow and Ice’’(DEFROST) of the Nordic Centre of Excellence programme‘‘Interaction between Climate Change and the Cryosphere’’. Wegratefully acknowledge the contributions of Arctic Research Centre(ARC), Aarhus University. Support was also provided by theCanada Excellence Research Chair (CERC). This work is acontribution to the Arctic Science Partnership (ASP) asp-net.org.
References
ARENDT, K. E., T. G. NIELSEN, S. RYSGAARD, AND K. TONNESSON.2010. Differences in plankton community structure along theGodthabsfjord, from the Greenland Ice Sheet to offshorewaters. Mar. Ecol. Prog. Ser. 401: 49–62, doi:10.3354/meps08368
BLICHER, M. E., S. RYSGAARD, AND M. K. SEJR. 2010. Seasonalgrowth variation in Chlamys islandica (Bivalvia) from sub-Arctic Greenland is linked to food availability and tempera-ture. Mar. Ecol. Prog. Ser. 407: 71–86, doi:10.3354/meps08536
———, M. K. SEJR, AND S. RYSGAARD. 2009. High carbondemand of dominant macrozoobenthic species indicates theircentral role in ecosystem carbon flow in a sub-Arctic fjord.Mar. Ecol. Prog. Ser. 383: 127–140, doi:10.3354/meps07978
BONILLA-FINDJI, O., J. P. GATTUSO, M. D. PIZAY, AND M. G.WEINBAUER. 2010. Autotrophic and heterotrophic metabolismof microbial planktonic communities in an oligotrophic coastalmarine ecosystem: Seasonal dynamics and episodic events.Biogeosciences 7: 3491–3503, doi:10.5194/bg-7-3491-2010
BRAMAN, R. S., AND S. A. HENDRIX. 1989. Nanogram nitrite andnitrate determination in environmental and biological mate-rials by vanadium (III) reduction with chemilumimescence.Anal. Chem. 61: 2715–2718, doi:10.1021/ac00199a007
BROWN, J. H., J. F. GILLOOLY, A. P. ALLEN, V. M. SAVAGE, AND
G. B. WEST. 2004. Toward a metabolic theory of ecology.Ecology 85: 1771–1789, doi:10.1890/03-9000
CAI, W.-J. 2011. Estuarine and coastal ocean carbon paradox:CO2 sinks or sites of terrestrial carbon incineration? Annu.Rev. Mar. Sci. 3: 123–145, doi:10.1146/annurev-marine-120709-142723
CARPENTER, J. H. 1965. The Chesapeake Bay Institute techniquefor the Winkler dissolved oxygen method. Limnol. Oceanogr.10: 141–143, doi:10.4319/lo.1965.10.1.0141
CHEN, C. T. A., AND A. V. BORGES. 2009. Reconciling opposing viewson carbon cycling in the coastal ocean: Continental shelves assinks and near-shore ecosystems as sources of atmospheric CO2.Deep Sea Res. II 56: 578–590, doi:10.1016/j.dsr2.2009.01.001
COTTRELL, M. T., R. R. MALMSTROM, V. HILL, A. E. PARKER, AND
D. L. KIRCHMAN. 2006. The metabolic balance betweenautotrophy and heterotrophy in the western Arctic Ocean.Deep Sea Res. I 53: 1831–1844, doi:10.1016/j.dsr.2006.08.010
DUARTE, C., AND Y. PRAIRIE. 2005. Prevalence of heterotrophyand atmospheric CO2 emissions from aquatic ecosystems.Ecosystems 8: 862–870, doi:10.1007/s10021-005-0177-4
———, AND A. REGAUDIE-DE-GIOUX. 2009. Threshold of grossprimary production for the metabolic balance of marineplanktonic communities. Limnol. Oceanogr. 54: 1015–1022,doi:10.4319/lo.2009.54.3.1015
———, ———, J. M. ARRIETA, A. DELGADO-HUERTAS, AND S.AGUSTI. 2013. The oligotrophic ocean is heterotrophic. Annu.Rev. Mar. Sci. 5: 551–269, doi:10.1146/annurev-marine-121211-172337
1776 Sejr et al.
FENG, Y., AND OTHERS. 2009. Effects of increased PCO2and
temperature on the North Atlantic spring bloom. I. Thephytoplankton community and biogeochemical response.Mar. Ecol. Prog. Ser. 388: 13–25, doi:10.3354/meps08133
GARCIA-MARTIN, E., P. SERRET, AND M. PEREZ-LORENZO. 2011.Testing potential bias in marine plankton respiration rates bydark bottle incubations in the NW Iberian shelf: Incubationtime and bottle volume. Cont. Shelf Res. 31: 496–506,doi:10.1016/j.csr.2010.07.006
GILLOOLY, J. F., J. H. BROWN, G. B. WEST, V. M. SAVAGE, AND E. L.CHARNOV. 2001. Effects of size and temperature on metabolicrate. Science 293: 2248–2251, doi:10.1126/science.1061967
GIST, N., P. SERRET, E. M. S. WOODWARD, K. CHAMBERLAIN, AND
C. ROBINSON. 2009. Seasonal and spatial variability inplankton production and respiration in the Subtropical Gyresof the Atlantic Ocean. Deep Sea Res. II 56: 931–940,doi:10.1016/j.dsr2.2008.10.035
GOSSELIN, M. 1997. New measurements of phytoplankton and icealgal production in the Arctic Ocean. Deep Sea Res. II 44:1623–1644, doi:10.1016/S0967-0645(97)00054-4
GRUBER, N., AND OTHERS. 2009. Oceanic sources, sinks, andtransport of atmospheric CO2. Global Biogeochem. Cycles23: GB1005, doi:10.1029/2008GB003349
HEIN, M., AND K. SAND-JENSEN. 1997. CO2 increases oceanicprimary production. Nature 388: 526–527, doi:10.1038/41457
HOOD, E., J. FELLMAN, R. G. M. SPENCER, P. J. HERNES, R.EDWARDS, D. D’AMORE, AND D. SCOTT. 2009. Glaciers as asource of ancient and labile organic matter to the marineenvironment. Nature 462: 1044-U1100, doi:10.1038/nature08580
JENSEN, L. M. [ED.], Nuuk ecological research operations, 5thAnnual Report, 2011. Aarhus University, DCE–DanishCentre for Environment and Energy.
KIRCHMAN, D. L., X. A. G. MORAN, AND H. DUCKLOW. 2009.Microbial growth in the polar oceans—role of temperatureand potential impact of climate change. Nat. Rev. Microbiol.7: 451–459.
KIRK, J. 1994. Light and photosynthesis in aquatic ecosystems,2nd ed. Cambridge Univ. Press.
KRAUSE-JENSEN, D., AND OTHERS. 2012. Seasonal sea ice cover asprincipal driver of spatial and temporal variation in depthextension and annual production of kelp in Greenland.Global Change Biol. 18: 2981–2994, doi:10.1111/j.1365-2486.2012.02765.x
KRITZBERG, E. S., C. M. DUARTE, AND P. WASSMANN. 2010.Changes in Arctic marine bacterial carbon metabolism inresponse to increasing temperature. Polar Biol. 33: 1673–1682,doi:10.1007/s00300-010-0799-7
LABASQUE, T., C. CHAUMERY, A. AMINOT, AND G. KERGOAT. 2004.Spectrophotometric Winkler determination of dissolvedoxygen: Re-examination of critical factors and reliability.Mar. Chem. 88: 53–60, doi:10.1016/j.marchem.2004.03.004
LAWS, E. A. 1991. Photosynthetic quotients, new production andnet community production in the open ocean. Deep Sea Res.38: 143–167, doi:10.1016/0198-0149(91)90059-O
LEGENDRE, L. 1983. The 14C method: Patterns of dark CO2 fixationand DCMU correction to replace the dark bottle. Limnol.Oceanogr. 28: 996–1003, doi:10.4319/lo.1983.28.5.0996
LOPEZ-URRUTIA, A., E. SAN MARTIN, R. P. HARRIS, AND X.IRIGOIEN. 2006. Scaling the metabolic balance of the oceans.Proc. Natl. Acad. Sci. USA 103: 8739–8744, doi:10.1073/pnas.0601137103
MCCLELLAND, J. W., R. M. HOLMES, K. H. DUNTON, AND R. W.MACDONALD. 2012. The Arctic Ocean estuary. EstuariesCoasts 35: 353–368, doi:10.1007/s12237-010-9357-3
MIDDELBOE, M., R. N. GLUD, AND M. K. SEJR. 2012. Bacterio-plankton—key players in subarctic carbon cycling: A seasonalstudy on microbial activity and virus-induced mortality inKobbefjord, Greenland. Limnol. Oceanogr. 57: 1732–1742,doi:10.4319/lo.2012.57.6.1732
———, AND C. LUNDSGAARD. 2003. Microbial activity in theGreenland Sea: Role of DOC lability, mineral nutrients andtemperature. Aquat. Microb. Ecol. 32: 151–163, doi:10.3354/ame032151
MORAN, X. A. G., J. M. GASOL, C. PEDROS-ALIO, AND M.ESTRADA. 2001. Dissolved and particulate primary productionand bacterial production in offshore Antarctic waters duringaustral summer: Coupled or uncoupled? Mar. Ecol. Prog. Ser.222: 25–39, doi:10.3354/meps222025
MORTENSEN, J., K. LENNERT, J. BENDTSEN, AND S. RYSGAARD. 2011.Heat sources for glacial melt in a sub-Arctic fjord (God-thabsfjord) in contact with the Greenland Ice Sheet. J.Geophys. Res. Oceans 116: C01013, doi:10.1029/2010JC006528
NAKAOKA, S.-I., S. AOKI, T. NAKAZAWA, G. HASHIDA, S.MORIMOTO, T. YAMANOUCHI, AND H. YOSHIKAWA-INOUE.2006. Temporal and spatial variations of oceanic pCO2
and air–sea CO2 flux in the Greenland Sea and the BarentsSea. Tellus 58: 148–161, doi:10.1111/j.1600-0889.2006.00178.x
NGUYEN, D., R. MARANGER, J. E. TREMBLAY, AND M. GOSSELIN.2012. Respiration and bacterial carbon dynamics in theAmundsen Gulf, western Canadian Arctic. J. Geophys. Res.Oceans 117: C00G16, doi:10.1029/2011JC007343
POMEROY, L. R., AND W. J. WIEBE. 1993. Seasonal uncoupling ofthe microbial loop and its potential significance for the globalcycle of carbon. Span. Soc. Microbiol.
PRESS, W., B. FLANNERY, S. TEUKOLSKY, AND W. VETTERLING.1986. Numerical recipes: the art of scientific computing.Cambridge University Press.
RABE, B., AND OTHERS. 2011. An assessment of Arctic Oceanfreshwater content changes from the 1990s to the 2006–2008period. Deep Sea Res. I 58: 173–185, doi:10.1016/j.dsr.2010.12.002
REGAUDIE-DE-GIOUX, A., AND C. M. DUARTE. 2010. Planktonmetabolism in the Greenland Sea during the polar summerof 2007. Polar Biol. 33: 1651–1660, doi:10.1007/s00300-010-0792-1
———, AND ———. 2012. Temperature dependence of planktonicmetabolism in the ocean. Global Biogeochem. Cycles 26:GB1015, doi:10.1029/2010gb003907
RICHTER, A., S. RYSGAARD, R. DIETRICH, J. MORTENSEN, AND D.PETERSEN. 2011. Coastal tides in West Greenland derived fromtide gauge records. Ocean Dyn. 61: 39–49, doi:10.1007/s10236-010-0341-z
RIEBESELL, U., AND OTHERS. 2007. Enhanced biological carbonconsumption in a high CO2 ocean. Nature 450: 545–548,doi:10.1038/nature06267
RUIZ-HALPERN, S., M. K. SEJR, C. M. DUARTE, D. KRAUSE-JENSEN,T. DALSGAARD, J. DACHS, AND S. RYSGAARD. 2010. Air–waterexchange and vertical profiles of organic carbon in a subarcticfjord. Limnol. Oceanogr. 55: 1733–1740, doi:10.4319/lo.2010.55.4.1733
RYSGAARD, S., T. NIELSEN, AND B. HANSEN. 1999. Seasonalvariation in nutrients, pelagic primary production and grazingin a high-Arctic coastal marine ecosystem, Young Sound,Northeast Greenland. Mar. Ecol. Prog. Ser. 179: 13–25,doi:10.3354/meps179013
———, AND M. SEJR. 2007. Vertical flux of particulate organicmatter in a High Arcic fjord: Relative importance ofterrestrial and marine sources, p. 109–121. In S. Rysgaardand R. Glud [eds.], Carbon cycling in Arctic marineecosystems: Case study Young Sound. Medd Groenland.
Subarctic ecosystem metabolism and CO2 1777
———, AND OTHERS. 2012. High air–sea CO2 uptake rates innearshore and shelf areas of Southern Greenland: Temporaland spatial variability. Mar. Chem. 128: 26–33, doi:10.1016/j.marchem.2011.11.002
SAKSHAUG, E., G. JOHNSEN, AND K. KOVACS. 2009. EcosystemBarents Sea. Tapir Academic Press.
SEJR, M. K., M. BLICHER, AND S. RYSGAARD. 2009. Spatial andtemporal variation in sea ice cover influence annual growth ofthe Arctic cockle Clinocardium ciliatum in Greenland. Mar.Ecol. Prog. Ser. 389: 149–158, doi:10.3354/meps08200
———, D. KRAUSE-JENSEN, S. RYSGAARD, L. L. SORENSEN, P. B.CHRISTENSEN, AND R. N. GLUD. 2011. Air–sea flux of CO2 inarctic coastal waters influenced by glacial meltwater and seaice. Tellus B 63: 815–822, doi:10.1111/j.1600-0889.2011.00540.x
———, T. G. NIELSEN, S. RYSGAARD, N. RISGAARD-PETERSEN, M.STURLUSON, AND M. E. BLICHER. 2007. Fate of pelagic organiccarbon and importance of pelagic–benthic coupling in ashallow cove in Disko Bay, West Greenland. Mar. Ecol. Prog.Ser. 341: 75–88, doi:10.3354/meps341075
———, M. WłODARSKA-KOWALCZUK, J. LEGEZ_YNSKA, AND M.BLICHER. 2010. Macrobenthic species composition and diver-sity in the Godthaabsfjord system, SW Greenland. Polar Biol.33: 421–431, doi:10.1007/s00300-009-0717-z
SERRET, P., E. FERNANDEZ, J. A. SOSTRES, AND R. ANADON. 1999.Seasonal compensation of microbial production and respira-tion in a temperate sea. Mar. Ecol.-Prog. Ser. 187: 43–57,doi:10.3354/meps187043
STEEMANN NIELSEN, E. 1952. The use of radioactive carbon (CM)for measuring organic production in the sea. J. Cons. Cons.Int. Explor. Mer 18: 117–140, doi:10.1093/icesjms/18.2.117
TAKAHASHI, T., AND OTHERS. 2002. Global sea–air CO2 flux basedon climatological surface ocean P CO2, and seasonal biologicaland temperature effects. Deep Sea Res. II 49: 1601–1622,doi:10.1016/S0967-0645(02)00003-6
TANG, K. W. 2011. Metazooplankton community structure,feeding rate estimates, and hydrography in a meltwater-influenced Greenlandic fjord. Mar. Ecol. Prog. Ser. 434:77–90, doi:10.3354/meps09188
TREMBLAY, J.-E., K. G. SIMPSON, J. MARTIN, L. MILLER, Y.GRATTON, D. BARBER, AND N. M. PRICE. 2008. Verticalstability and the annual dynamics of nutrients and chloro-phyll fluorescence in the coastal, southeast Beaufort Sea. J.Geophys. Res. 113: C07S90, doi:10.1029/2007jc004547
WANNINKHOF, R. 1992. Relationship between wind speed and gasexchange over the ocean. J. Geophys. Res. 97: 7373–7382,doi:10.1029/92JC00188
WEISS, R. 1974. Carbon dioxide in water and seawater: Thesolubility of a non-ideal gas Mar. Chem. 2: 203–215.
Associate editor: George W. Kling
Received: 23 August 2013Accepted: 29 April 2014Amended: 26 June 2014
1778 Sejr et al.