Spatial distribution of autotrophic picoplankton in relation to physical forcings: the Gulf of...
13
Spatial distribution of autotrophic picoplankton in relation to physical forcings: the Gulf of Ca ´diz, Strait of Gibraltar and Albora ´n Sea case study FIDEL ECHEVARRI ´ A 1,3 , LAURA ZABALA 1 , ALFONSO CORZO 1 , GABRIEL NAVARRO 2,3 , LAURA PRIETO 2,3 AND DIEGO MACI ´ AS 1,4 * 1 DEPARTAMENTO DE BIOLOGI ´ A, FACULTAD DE CIENCIAS DEL MARY AMBIENTALES, UNIVERSIDAD DE CA ´ DIZ, CA ´ DIZ, SPAIN, 2 DEPARTAMENTO DE ECOLOGI ´ AY GESTIO ´ N COSTERA, INSTITUTO DE CIENCIAS MARINAS DE ANDALUCI ´ A, CSIC, CA ´ DIZ, SPAIN, 3 UNIDAD ASOCIADA DE OCEANOGRAFI ´ A INTERDISCIPLINAR, UCA-CSIC, CA ´ DIZ, SPAIN AND 4 INTEGRATIVE OCEANOGRAPHY DIVISION, SCRIPPS INSTITUTION OF OCEANOGRAPHY , LA JOLLA, CALIFORNIA, USA *CORRESPONDING AUTHOR: [email protected]; [email protected] Received May 4, 2009;accepted in principle July 8, 2009; accepted for publication July 18, 2009; published online 12 August, 2009 Corresponding editor: William Li In this paper, we analyze the pattern of distribution of three populations of picoplanktonic autotrophs measured using flow cytometry. Prochlorococcus sp., Synechococcus sp. and eukaryotic picoplankton were investigated at 58 stations to the south of the Iberian Peninsula including the northeastern Gulf of Ca ´diz, Strait of Gibraltar and northwestern Albora ´n Sea, during July 1995. There were important differences in the oceanographic conditions in these regions, with warmer, low-nutrient and low-chlorophyll waters in the Atlantic sector and colder, high-nutrient and high- chlorophyll waters in the Albora ´n sector in which upwelling occurred. The biomass concentration of picoplanktonic cells was two times higher in the Atlantic area than in the richer Albora ´n Sea waters. The average integrated abundance of picophytoplankton was negatively correlated with chlorophyll a concentration as well as with inorganic nitrogen availability. Prochlorococcus and Synechococcus were the most abundant groups, and they showed a complementarity in their spatial distribution, with a shallower and more coastal distribution of Synechococcus and the presence of Prochlorococcus mainly at offshore stations and at deeper depths. The ratio of autotrophic pico- plankton/total autotrophic biomass showed significant differences on both sides of the Strait, with much higher values in the Gulf of Ca ´diz sector. INTRODUCTION Southern Iberian coastal systems consist of two adjacent basins, the Gulf of Ca ´diz and the Albora ´n Sea (con- nected by the narrow Strait of Gibraltar), with very different hydrographic characteristics. Owing to their proximity, external forcing (i.e. meterological, climatic etc.) to both basins is very similar so it is possible to isolate the effects on the ecosystems of the differential hydrographic structures present in both areas. The Gulf of Ca ´diz is a warm basin during spring and summer (Huertas et al., 2005; Navarro and Ruiz, 2006; Prieto et al., 2009), especially in the coastal areas (Garcı ´a-Lafuente et al., 2006) where marshes and river- ine influence is particularly high. The central area of the Gulf is highly oligotrophic with the presence of a quasi-permanent anticyclonic gyre (Vargas et al., 2003), whereas in specific coastal areas intermittent upwelling processes occur mainly due to wind forcing (Stevenson, 1977). On the other hand, the northwestern (NW) Albora ´n Sea is strongly influenced by the circulation through the Strait of Gibraltar, as the incoming Atlantic Jet (AJ) feeds and maintains the surface structures in the area (Viudez and Haney, 1997) including a strong frontal area that divides a sector of intense upwelling doi:10.1093/plankt/fbp070, available online at www.plankt.oxfordjournals.org # The Author 2009. Published by Oxford University Press. All rights reserved. For permissions, please email: [email protected] JOURNAL OF PLANKTON RESEARCH j VOLUME 31 j NUMBER 11 j PAGES 1339 – 1351 j 2009
Transcript of Spatial distribution of autotrophic picoplankton in relation to physical forcings: the Gulf of...

Spatial distribution of autotrophicpicoplankton in relation to physicalforcings: the Gulf of Cadiz, Strait ofGibraltar and Alboran Sea case study
FIDEL ECHEVARRIA1,3, LAURA ZABALA1, ALFONSO CORZO1, GABRIEL NAVARRO2,3, LAURA PRIETO2,3 AND DIEGO MACIAS1,4*1
DEPARTAMENTO DE BIOLOGIA, FACULTAD DE CIENCIAS DEL MAR Y AMBIENTALES, UNIVERSIDAD DE CADIZ, CADIZ, SPAIN, 2DEPARTAMENTO DE ECOLOGIA Y
GESTION COSTERA, INSTITUTO DE CIENCIAS MARINAS DE ANDALUCIA, CSIC, CADIZ, SPAIN, 3UNIDAD ASOCIADA DE OCEANOGRAFIA INTERDISCIPLINAR,
UCA-CSIC, CADIZ, SPAIN AND4
INTEGRATIVE OCEANOGRAPHY DIVISION, SCRIPPS INSTITUTION OF OCEANOGRAPHY, LA JOLLA, CALIFORNIA, USA
*CORRESPONDING AUTHOR: [email protected]; [email protected]
Received May 4, 2009; accepted in principle July 8, 2009; accepted for publication July 18, 2009; published online 12 August, 2009
Corresponding editor: William Li
In this paper, we analyze the pattern of distribution of three populations of picoplanktonic
autotrophs measured using flow cytometry. Prochlorococcus sp., Synechococcus sp. and eukaryotic
picoplankton were investigated at 58 stations to the south of the Iberian Peninsula including the
northeastern Gulf of Cadiz, Strait of Gibraltar and northwestern Alboran Sea, during July 1995.
There were important differences in the oceanographic conditions in these regions, with warmer,
low-nutrient and low-chlorophyll waters in the Atlantic sector and colder, high-nutrient and high-
chlorophyll waters in the Alboran sector in which upwelling occurred. The biomass concentration
of picoplanktonic cells was two times higher in the Atlantic area than in the richer Alboran Sea
waters. The average integrated abundance of picophytoplankton was negatively correlated with
chlorophyll a concentration as well as with inorganic nitrogen availability. Prochlorococcus and
Synechococcus were the most abundant groups, and they showed a complementarity in their spatial
distribution, with a shallower and more coastal distribution of Synechococcus and the presence of
Prochlorococcus mainly at offshore stations and at deeper depths. The ratio of autotrophic pico-
plankton/total autotrophic biomass showed significant differences on both sides of the Strait, with
much higher values in the Gulf of Cadiz sector.
I N T RO D U C T I O N
Southern Iberian coastal systems consist of two adjacentbasins, the Gulf of Cadiz and the Alboran Sea (con-nected by the narrow Strait of Gibraltar), with verydifferent hydrographic characteristics. Owing to theirproximity, external forcing (i.e. meterological, climaticetc.) to both basins is very similar so it is possible toisolate the effects on the ecosystems of the differentialhydrographic structures present in both areas.
The Gulf of Cadiz is a warm basin during springand summer (Huertas et al., 2005; Navarro and Ruiz,2006; Prieto et al., 2009), especially in the coastal areas
(Garcıa-Lafuente et al., 2006) where marshes and river-ine influence is particularly high. The central area ofthe Gulf is highly oligotrophic with the presence of aquasi-permanent anticyclonic gyre (Vargas et al., 2003),whereas in specific coastal areas intermittent upwellingprocesses occur mainly due to wind forcing (Stevenson,1977). On the other hand, the northwestern (NW)Alboran Sea is strongly influenced by the circulationthrough the Strait of Gibraltar, as the incoming AtlanticJet (AJ) feeds and maintains the surface structures in thearea (Viudez and Haney, 1997) including a strongfrontal area that divides a sector of intense upwelling
doi:10.1093/plankt/fbp070, available online at www.plankt.oxfordjournals.org
# The Author 2009. Published by Oxford University Press. All rights reserved. For permissions, please email: [email protected]
JOURNAL OF PLANKTON RESEARCH j VOLUME 31 j NUMBER 11 j PAGES 1339–1351 j 2009

in the coastal zone (Viudez et al., 1996) and a moreoligotrophic area far offshore.
Plankton community structure might respond tothese physical settings that affect nutrient availabilityand hence the trophic status of the different areas.Moreover, in these regions, a number of differentwater masses coexist both in the Atlantic and theMediterranean basins (Gascard and Richez, 1985; Armiand Farmer, 1988), creating intense and marked frontalareas and interfaces which have been suggested to actas accumulation structures for phytoplankton biomass(e.g. Navarro et al., 2006; Macıas et al., 2008a, b, 2009).
A number of studies of the biological oceanography ofthe south of the Iberian Peninsula can be found in the lit-erature, most of them been centered in one of the threesectors: Alboran Sea (i.e. Rodrıguez et al., 1998; Reulet al., 2005; Macıas et al., 2008a, 2009), Gulf of Cadiz (i.e.Garcıa et al., 2002; Navarro et al., 2006; Reul et al., 2006;Garcıa-Lafuente and Ruiz, 2007; Prieto et al., 2009) orStrait of Gibraltar (i.e. Echevarrıa et al., 2002; Gomezet al., 2004; Macıas et al., 2006, 2007a, b). However, therehave been very few efforts to analyze jointly these basins.In this sense, the cruise “IctioAlboran-Cadiz 95” (onwhich the present study is based) was especially plannedto satisfy such combined analysis (e.g. Prieto et al., 1999;Rubın et al., 1999).
By performing a joint study of the hydrographiccharacteristics of both basins during the cruise, weaimed to be able to isolate the effect of such processeson the dynamics and distribution of the planktoniccommunity. We focus in this paper on the smallestorganisms in the system and especially on the auto-trophic picoplankton measured by flow cytometry toanalyze the abundance of each group in different areasand hydrographic conditions and to assess the relativecontribution of these small cells to the total autotrophiccommunity.
These small cells are widely distributed in the worldocean, being responsible for an important fraction ofthe primary productivity especially in oligotrophic zones(e.g. Legendre and Rassoulzadegan, 1996; Agawin et al.,2000). The paradigm shows that these small cells arepresent in the ocean with low density fluctuations indensity, whereas the larger cells are subject to largerfluctuations, appearing at higher concentrations ineutrophic regions (Malone, 1980; Rodrıguez et al., 2001;Li, 2002; Cozar and Echevarrıa, 2005). The relativecontribution of small cells in the picoplankton sizerange to the total phytoplankton biomass largely deter-mines the structure of the pelagic food web and thefraction of phytoplankton available to export (Legendreand Lefebvre, 1995; Legendre and Rassoulzadegan,1996; Calbet, 2001). Recently, Sherr et al. (Sherr et al.,
2005) have shown a decrease in autotrophic picoplanktonabundance at eutrophic stations in the Oregon upwellingsystem. They found a negative correlation betweeneukaryotic picoplankton abundance and total chloro-phyll, a result that confirms the finding of Li (Li, 2002),who showed that the abundance of picophytoplanktonwas inversely correlated with total chlorophyll, whereassmall nanoplankton were relatively invariant across theorders of magnitude of chlorophyll a concentration.
The spatial extension of the present study and thevery different oceanographic features encountered inthe areas studied allow a detailed study of the connec-tion of these small organisms with the hydrodynamicsand the trophic status of the different zones. So, themain objective of this paper is to analyze the distri-bution of the autotrophic picoplankton in the Gulf ofCadiz, Strait of Gibraltar and Alboran Sea in relationto the hydrodynamics and environmental conditions ofthis area. From these patterns, and given the heterogen-eity of both adjacent basins, we will try to bring outgeneral control mechanisms of picoplankton distributionin the marine systems.
M E T H O D
The “IctioAlboran-Cadiz 95” oceanographic cruise wascarried out from 5 to 17 July 1995 aboard the R/VFrancisco de Paula Navarro. The sampling area covered58 stations in the NW sector of the Alboran Sea, theStrait of Gibraltar and the northeastern sector of theGulf of Cadiz (Fig. 1).
Thermal images were accessible via ISIS andEOWEB on the German Remote Sensing Data Centerwebsite (DLR). Daily maps of sea surface temperature(SST) are composed using up to seven different NOAA(National Oceanic and Atmospheric Administration)acquisitions, through Advanced Very High ResolutionRadiometers (AVHRR) on board the NOAA. Thespatial resolution is 1.1 km at the nadir. The details ofnavigation, calibration, cloud screening and algorithmscan be seen in http://isis.dlr.de/.
Vertical profiles of conductivity and temperature to adepth of 250 m at each station were made using anInterOceans Systems S4 CTD probe. Water sampleswere collected at each station with Niskin bottles at fivediscrete depths (10, 25, 50, 75 and 100 m). Nitrate con-centrations were determined following the Treguer andLe Corre (Treguer and Le Corre, 1975) technique usinga Technicon TRAACS 800 autoanalyser. Chlorophyll a
concentrations were measured using particulate materialretained on Whatmann GF/F filters by fluorometryon 90% acetone extracts (Holm-Hansen et al., 1965).
JOURNAL OF PLANKTON RESEARCH j VOLUME 31 j NUMBER 11 j PAGES 1339–1351 j 2009
1340

Daily wind data in the zone for the days of the cruisewere obtained from local meteorological stations atMalaga, Cadiz and Huelva (Fig. 1).
Samples for flow cytometry were fixed with 1% glu-taraldehyde and immediately stored in liquid N2 untiltheir analysis (Vaulot et al., 1989). Samples were ana-lyzed in a flow cytometer FACSCALIBUR (BectonDickinson, emission wave-length at 488 nm) using high-gain settings (FSC ¼ E01, SSC ¼ 400, FL1 ¼ 555,FL2 ¼ 650, FL3 ¼ 650) and red fluorescence asthreshold parameter (FL3 ¼ 100). Acquisition time wasset to 200 s with acquisition ending if the total numberof acquired particles exceeded 50 000. MilliQ waterwas used as sheath fluid. The flow velocity was set athigh flow and measured several times during the pro-cessing of samples (61+ 72 mL min21). The flow vel-ocity was measured by the difference in weight ofMilliQ water after a given acquisition time and double-checked with the analysis by flow cytometry, using theprevious flow velocity, and microscopic quantificationwith a Nuebauer chamber of a culture of Chlorella
stigmatofora. No significant differences were foundbetween both approaches (P , 0.05). Acquisition wascarried out with the software CELL QuestTM (BectonDickinson) and data analysis with CELL QuestTM andAttractorsTM (Becton Dickinson).
Enumeration of Prochlorococcus [mean biovolume(BV) ¼ 0.071 mm3, SD ¼ 0.006, n ¼ 204], Synechococcus
(mean BV ¼ 0.118 mm3, SD ¼ 0.03, n ¼ 204) andeukaryotic picoplankton (mean BV ¼ 0.619 mm3, SD ¼0.32, n ¼ 204) populations was made using a three-dimensional gate based on red fluorescence, orange flu-orescence and side scatter signals. Only particles thatappear in the selected regions in these three plots werecounted.
Cell size in the picoplankton size range was estimatedfrom the SSC signal (Dubelaar and Jonker, 2000;Lebaron et al., 2002; Corzo et al., 2005) which providesthe best cell size estimation when MilliQ water is usedas a sheath fluid (Phinney and Cucci, 1989). To cali-brate the SSC signal, a set of cultures of seven microal-gal species of different sizes were analyzed by flowcytometry. Cell size of the different cultures wasmeasured by image analysis (VIDS V software) using aninverted microscope (Leitz Fluovert FU). Cell volumeswere calculated from minor and major cell axes usingappropriate equations for each cell form (Echevarrıaand Rodrıguez, 1994; Ruız et al., 1996). At least 400single cells of every species were analyzed by this tech-nique and the mean cell volume correlated with themean SSC signal of a population of 6000 cells from thesame culture analyzed by flow cytometry. This databaseallowed calculation of a regression equation betweencell volume, determined by optical microscopy, and theSSC signal, determined by flow cytometry. Cell size foreach individual cell was then estimated from their indi-vidual SSC signal and transformed to cell volume or toequivalent spherical diameter by means of the appropri-ate regression equation [equation (1)].
BVðmm3Þ ¼ 0:3534� SSCþ 2:885
ðr2 ¼ 0:928; n ¼ 4; p , 0:01Þð1Þ
Cell abundance was transformed to carbon content(pgC mL21) according to DuRand et al. (DuRand et al.,2001) using the ratios 0.112 and 0.056 pgC cell21 forSynechococcus and Prochlorococcus, respectively. For eukary-otic picoplankton, BV obtained from equation (1) wasconverted to carbon using equation (2), proposed byVerity et al. (Verity et al., 1992).
pgC ¼ 0:433� BV0:863 ðr2 ¼ 0:984Þ ð2Þ
To analyze the relative contribution of picoplankton tototal autotrophic biomass, we converted chlorophyll valuesto carbon biomass using the factor 58 mgC mg Chl21.This value comes from data from the same study areathough taken on a different cruise (Macıas, unpublishedresearch) and fits well in the range proposed bySherr et al. (Sherr et al., 2005) for coastal systems(30–90 mgC mg Chl21).
Fig. 1. Study area and location of the sampling stations. The threetransects analyzed in more detail are also shown.
F. ECHEVARRIA ET AL. j PICOPLANKTON SPATIAL DISTRIBUTION AT SOUTH IBERIA
1341
R E S U LT S
Hydrography
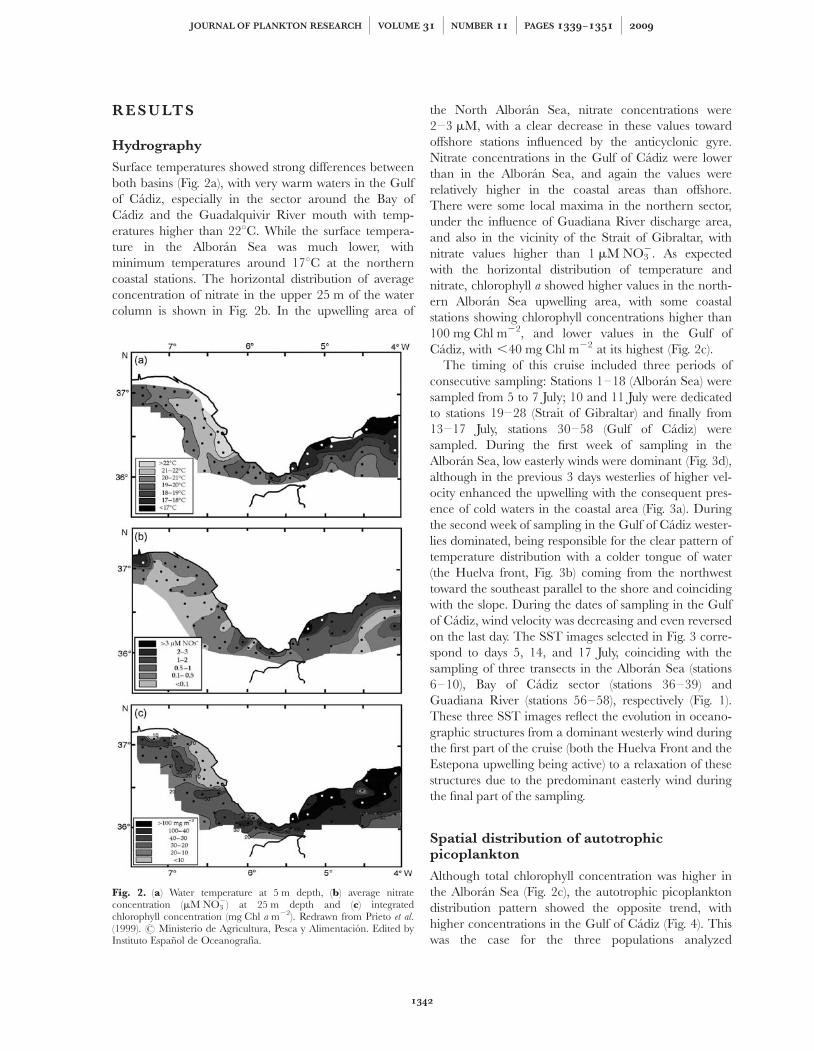
Surface temperatures showed strong differences betweenboth basins (Fig. 2a), with very warm waters in the Gulfof Cadiz, especially in the sector around the Bay ofCadiz and the Guadalquivir River mouth with temp-eratures higher than 228C. While the surface tempera-ture in the Alboran Sea was much lower, withminimum temperatures around 178C at the northerncoastal stations. The horizontal distribution of averageconcentration of nitrate in the upper 25 m of the watercolumn is shown in Fig. 2b. In the upwelling area of
the North Alboran Sea, nitrate concentrations were2–3 mM, with a clear decrease in these values towardoffshore stations influenced by the anticyclonic gyre.Nitrate concentrations in the Gulf of Cadiz were lowerthan in the Alboran Sea, and again the values wererelatively higher in the coastal areas than offshore.There were some local maxima in the northern sector,under the influence of Guadiana River discharge area,and also in the vicinity of the Strait of Gibraltar, withnitrate values higher than 1 mM NO3
2. As expectedwith the horizontal distribution of temperature andnitrate, chlorophyll a showed higher values in the north-ern Alboran Sea upwelling area, with some coastalstations showing chlorophyll concentrations higher than100 mg Chl m22, and lower values in the Gulf ofCadiz, with ,40 mg Chl m22 at its highest (Fig. 2c).
The timing of this cruise included three periods ofconsecutive sampling: Stations 1–18 (Alboran Sea) weresampled from 5 to 7 July; 10 and 11 July were dedicatedto stations 19–28 (Strait of Gibraltar) and finally from13–17 July, stations 30–58 (Gulf of Cadiz) weresampled. During the first week of sampling in theAlboran Sea, low easterly winds were dominant (Fig. 3d),although in the previous 3 days westerlies of higher vel-ocity enhanced the upwelling with the consequent pres-ence of cold waters in the coastal area (Fig. 3a). Duringthe second week of sampling in the Gulf of Cadiz wester-lies dominated, being responsible for the clear pattern oftemperature distribution with a colder tongue of water(the Huelva front, Fig. 3b) coming from the northwesttoward the southeast parallel to the shore and coincidingwith the slope. During the dates of sampling in the Gulfof Cadiz, wind velocity was decreasing and even reversedon the last day. The SST images selected in Fig. 3 corre-spond to days 5, 14, and 17 July, coinciding with thesampling of three transects in the Alboran Sea (stations6–10), Bay of Cadiz sector (stations 36–39) andGuadiana River (stations 56–58), respectively (Fig. 1).These three SST images reflect the evolution in oceano-graphic structures from a dominant westerly wind duringthe first part of the cruise (both the Huelva Front and theEstepona upwelling being active) to a relaxation of thesestructures due to the predominant easterly wind duringthe final part of the sampling.
Spatial distribution of autotrophicpicoplankton
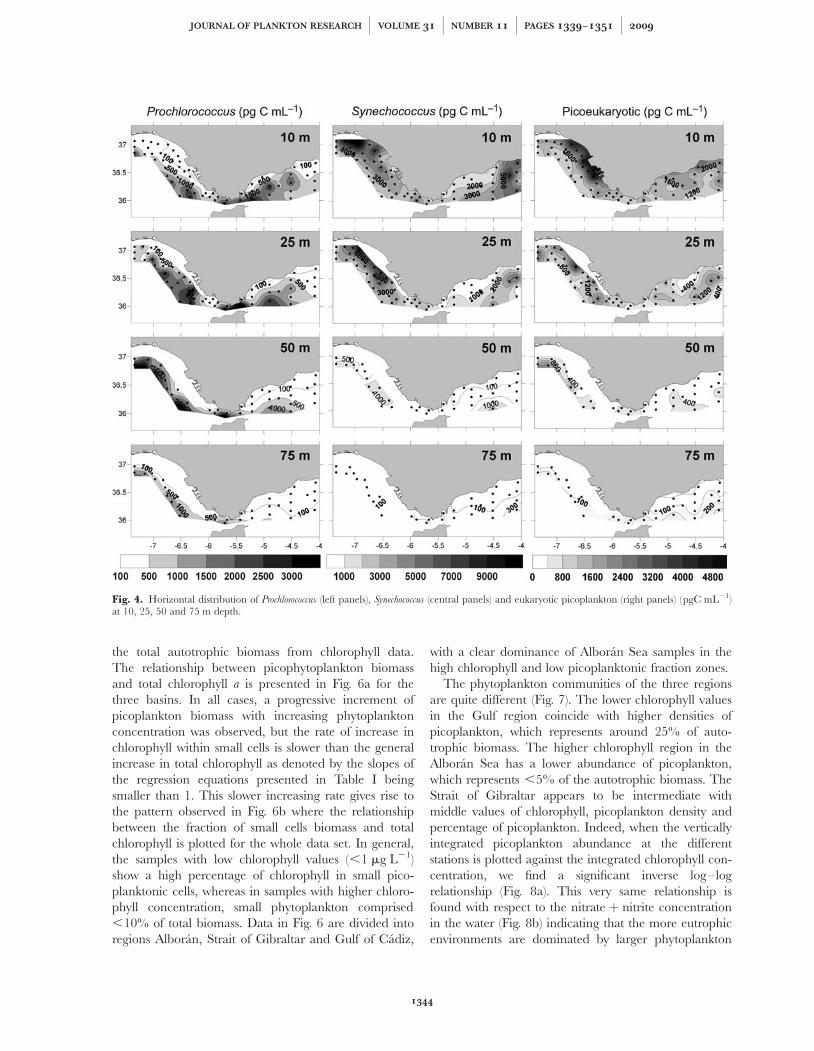
Although total chlorophyll concentration was higher inthe Alboran Sea (Fig. 2c), the autotrophic picoplanktondistribution pattern showed the opposite trend, withhigher concentrations in the Gulf of Cadiz (Fig. 4). Thiswas the case for the three populations analyzed
Fig. 2. (a) Water temperature at 5 m depth, (b) average nitrateconcentration (mM NO3
2) at 25 m depth and (c) integratedchlorophyll concentration (mg Chl a m22). Redrawn from Prieto et al.(1999). # Ministerio de Agricultura, Pesca y Alimentacion. Edited byInstituto Espanol de Oceanografıa.
JOURNAL OF PLANKTON RESEARCH j VOLUME 31 j NUMBER 11 j PAGES 1339–1351 j 2009
1342

including Prochlorococcus, Synechococcus and eukaryoticpicoplankton. On average, the biomass of each of thesephytoplankton groups was two times higher in the Gulfof Cadiz compared with the Alboran Sea (multipli-cation factors for individual populations were 2.51, 1.86and 1.58 for Prochlorococcus, Synechococcus and eukaryoticpicoplankton, respectively).
Figure 4 shows the horizontal distribution of biomassfor each cell type at the different depths analyzed (100 mexcluded). Prochlorococcus showed an increase in biomassfrom coast to offshore stations, a trend that was apparentin both basins, Gulf of Cadiz and Alboran Sea, beingmore abundant at intermediate-deep waters (75–100 m,Fig. 4). Synechococcus higher concentrations appeared atthe coastal stations of the Gulf of Cadiz (especially in thenorthern sector close to the Huelva shore), wherebiomass values .10 000 pgC mL21 were measured. Inthe Alboran Sea, the highest values were found also atcoastal stations near Malaga, but with lower biomassthan in the Gulf of Cadiz (around 6000 pgC mL21).Biomass distribution patterns of eukaryotic picoplanktonwere similar to Synechococcus with biomass maxima(around 1000 pgC mL21) at coastal stations in the Gulfof Cadiz, especially between Cadiz and Huelva. In theAlboran Sea, higher concentrations were observed atcoastal stations between Malaga and Estepona (Fig. 4).
The vertical distribution of density anomaly (sigma-t,kg m23) and biomass of Prochlorococcus and Synechococcus onthe three transects highlighted in Fig. 1 are shown inFig. 5. These three transects were sampled coincidingwith the dates of the SST images shown in Fig. 3. Densityanomaly distribution showed an ascent of the isopycnalstowards the coast in the Alboran Sea (Fig. 5a) with thewell-developed upwelling process on the coast and the AJon the southern side. In the Gulf of Cadiz, on the otherhand, the distribution of isopycnals was much more hori-zontal being the Surface Atlantic Water (SAW)–NorthAtlantic Central Water (NACW) interface marked by the26.6 isopycnal (thick black line in Fig. 5b and c).Therewas a clear complementarily in the biomass distributionof these two populations of picoplankters. On both trans-ects in the Gulf (Fig. 5b and c), Prochlorococcus tended toappear at offshore stations and in deeper layers comparedwith Synechococcus, being always associated with the SAW–NACW interface. Synechococcus, on the other hand, is moreabundant in inshore waters and above that interface (i.e.in the SAW water mass). On the Alboran Sea transect(Fig. 5a), both populations appeared in surface waters fol-lowing the shallowing of the Atlantic–Mediterraneaninterface (AMI), although there was a horizontal separ-ation between them, with Synechococcus being more abun-dant at offshore stations (within the AJ), whereasProchlorococcus appears at intermediate stations coincidingwith the presence of the frontal zone between the surfaceMediterranean waters and the incoming AJ.
Structure of the phytoplankton community
To calculate the contribution of these picoplankton cellsto the whole autotrophic community, we have calculated
Fig. 3. (a–c) SST images at days 5, 14 and 17 July 1995, datescorresponding with the sampling of transects in the Alboran Sea(stations 6–10), Cadiz Bay (stations 36–39) and Guadiana Riversector (stations 56–58). (d) Wind zonal direction and speed (km h21)at Cadiz, Malaga and Huelva meteorological stations during July1995.
F. ECHEVARRIA ET AL. j PICOPLANKTON SPATIAL DISTRIBUTION AT SOUTH IBERIA
1343
the total autotrophic biomass from chlorophyll data.The relationship between picophytoplankton biomassand total chlorophyll a is presented in Fig. 6a for thethree basins. In all cases, a progressive increment ofpicoplankton biomass with increasing phytoplanktonconcentration was observed, but the rate of increase inchlorophyll within small cells is slower than the generalincrease in total chlorophyll as denoted by the slopes ofthe regression equations presented in Table I beingsmaller than 1. This slower increasing rate gives rise tothe pattern observed in Fig. 6b where the relationshipbetween the fraction of small cells biomass and totalchlorophyll is plotted for the whole data set. In general,the samples with low chlorophyll values (,1 mg L21)show a high percentage of chlorophyll in small pico-planktonic cells, whereas in samples with higher chloro-phyll concentration, small phytoplankton comprised,10% of total biomass. Data in Fig. 6 are divided intoregions Alboran, Strait of Gibraltar and Gulf of Cadiz,
with a clear dominance of Alboran Sea samples in thehigh chlorophyll and low picoplanktonic fraction zones.
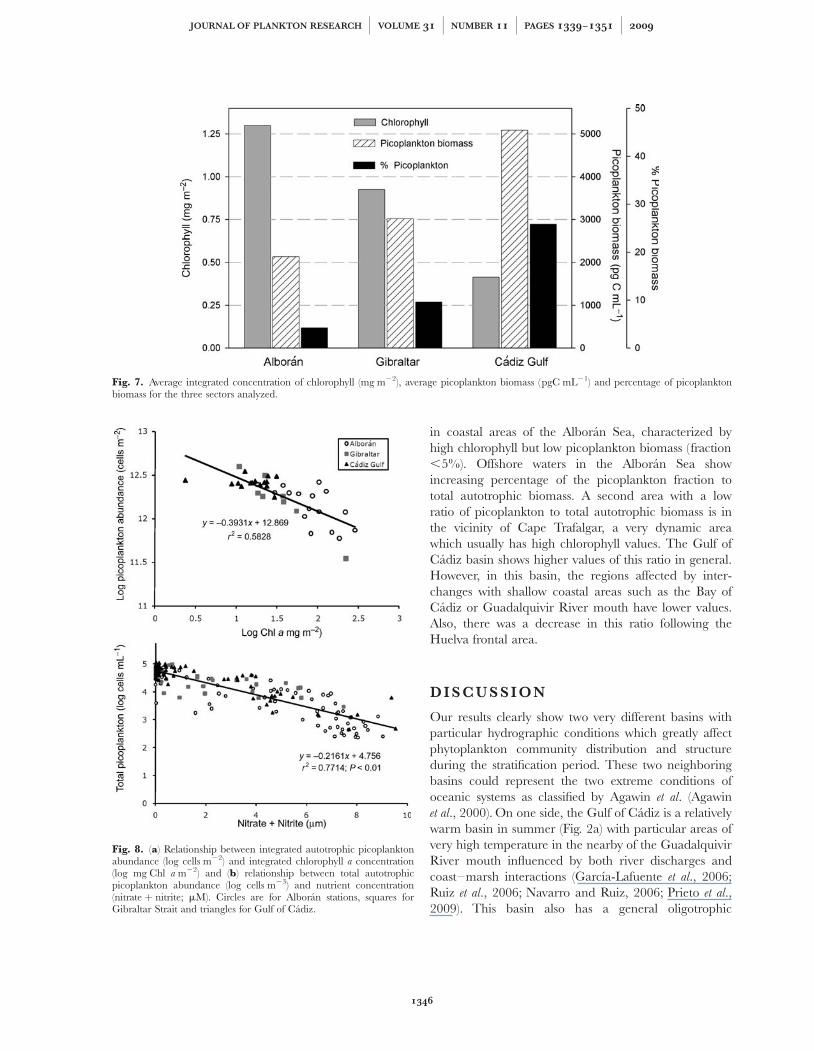
The phytoplankton communities of the three regionsare quite different (Fig. 7). The lower chlorophyll valuesin the Gulf region coincide with higher densities ofpicoplankton, which represents around 25% of auto-trophic biomass. The higher chlorophyll region in theAlboran Sea has a lower abundance of picoplankton,which represents ,5% of the autotrophic biomass. TheStrait of Gibraltar appears to be intermediate withmiddle values of chlorophyll, picoplankton density andpercentage of picoplankton. Indeed, when the verticallyintegrated picoplankton abundance at the differentstations is plotted against the integrated chlorophyll con-centration, we find a significant inverse log–logrelationship (Fig. 8a). This very same relationship isfound with respect to the nitrate þ nitrite concentrationin the water (Fig. 8b) indicating that the more eutrophicenvironments are dominated by larger phytoplankton
Fig. 4. Horizontal distribution of Prochlorococcus (left panels), Synechococcus (central panels) and eukaryotic picoplankton (right panels) (pgC mL21)at 10, 25, 50 and 75 m depth.
JOURNAL OF PLANKTON RESEARCH j VOLUME 31 j NUMBER 11 j PAGES 1339–1351 j 2009
1344

cells in respect to the picoplanktonic fraction which pre-vails in the oligotrophic regions.
The percentage of picoplankton biomass showed alarge horizontal heterogeneity (Fig. 9). There was aclear difference between the two basins, with low values
Fig. 5. Vertical distribution of density anomaly (kg m23; upperpanels), biomass of Prochlorococcus (pgC mL21; central panels) andbiomass of Synechococcus (pgC mL21; lower panels). (a) Alboran Seatransect (stations 6–10), dashed area represents the position of the AJ.(b) Cadiz Bay transect (stations 36–39), thick line marks the 26.6isopycnal. (c) Guadiana River transect (stations 56–58), thick linemarks the 26.6 isopycnal.
Fig. 6. (a) Relationship between picophytoplankton biomass andtotal phytoplankton biomass (mg Chl a L21), dashed line representsthe 1 : 1 relationship and (b) the fraction of autotrophic picoplanktonto the total phytoplankton carbon biomass (calculated fromchlorophyll a concentration) with respect to total chlorophyll aconcentration. Data are divided into three sectors: Alboran Sea (opencircle), Gibraltar Strait (grey square) and Gulf of Cadiz (blacktriangle). The inset plot in b represents data for chlorophyll aconcentrations ,2 mg L21.
Table I: Summary of regression analysisbetween absolute picoplankton biomass and totalphytoplankton (expressed as mg Chl a L21)
Independent variable (x) ! Total phytoplankton biomass (mg Chl a L21)Dependent variable (y) ! Picophytoplankton biomass (mg Chl a L21)Alboran Sea log(y) ¼ 0.8086 � log(x) 2 1.672 (r2 ¼ 0.43; P , 0.01)Strait of Gibraltar log(y) ¼ 0.205 � log(x) 2 1.4008 (r2 ¼ 0.039; P . 0.1)Gulf of Cadiz log(y) ¼ 0.7987 � log(x) 2 0.876 (r2 ¼ 0.39; P , 0.01)
Data are shown in Fig. 6a.
F. ECHEVARRIA ET AL. j PICOPLANKTON SPATIAL DISTRIBUTION AT SOUTH IBERIA
1345
in coastal areas of the Alboran Sea, characterized byhigh chlorophyll but low picoplankton biomass (fraction,5%). Offshore waters in the Alboran Sea showincreasing percentage of the picoplankton fraction tototal autotrophic biomass. A second area with a lowratio of picoplankton to total autotrophic biomass is inthe vicinity of Cape Trafalgar, a very dynamic areawhich usually has high chlorophyll values. The Gulf ofCadiz basin shows higher values of this ratio in general.However, in this basin, the regions affected by inter-changes with shallow coastal areas such as the Bay ofCadiz or Guadalquivir River mouth have lower values.Also, there was a decrease in this ratio following theHuelva frontal area.
D I S C U S S I O N
Our results clearly show two very different basins withparticular hydrographic conditions which greatly affectphytoplankton community distribution and structureduring the stratification period. These two neighboringbasins could represent the two extreme conditions ofoceanic systems as classified by Agawin et al. (Agawinet al., 2000). On one side, the Gulf of Cadiz is a relativelywarm basin in summer (Fig. 2a) with particular areas ofvery high temperature in the nearby of the GuadalquivirRiver mouth influenced by both river discharges andcoast–marsh interactions (Garcıa-Lafuente et al., 2006;Ruiz et al., 2006; Navarro and Ruiz, 2006; Prieto et al.,2009). This basin also has a general oligotrophic
Fig. 7. Average integrated concentration of chlorophyll (mg m22), average picoplankton biomass (pgC mL21) and percentage of picoplanktonbiomass for the three sectors analyzed.
Fig. 8. (a) Relationship between integrated autotrophic picoplanktonabundance (log cells m22) and integrated chlorophyll a concentration(log mg Chl a m22) and (b) relationship between total autotrophicpicoplankton abundance (log cells m23) and nutrient concentration(nitrate þ nitrite; mM). Circles are for Alboran stations, squares forGibraltar Strait and triangles for Gulf of Cadiz.
JOURNAL OF PLANKTON RESEARCH j VOLUME 31 j NUMBER 11 j PAGES 1339–1351 j 2009
1346

condition (Fig. 2b) with low nutrient concentrationsexcept in some localized areas as in the vicinity of theriver plumes and near the Strait of Gibraltar where thecombination of hydrodynamics and topography fuelsvertical motion at both Trafalgar Cape (Vargas-Yanezet al., 2002) and the Camarinal Sill (Gomez et al., 2000;Echevarrıa et al., 2002; Macıas et al., 2006, 2007a). Thesehydrographic characteristics result in the chlorophyllconcentration in the Gulf being extremely low exceptfor some coastal enrichment in the region of theGuadalquivir River mouth, the Cadiz Bay or theTrafalgar Cape (Fig. 2c) where intense upwellingphenomena had been described (i.e. Garcıa et al., 2002).The NW Alboran Sea, on the other side, has intensecoastal upwelling in its northernmost part which is usualin the region when westerlies are present (e.g. Perkinset al., 1990; Sarhan et al., 2000; Macıas et al., 2007b).These coastal upwelling regions are characterized by alower temperature (Fig. 2a), high nutrient concentrations(Fig. 2b) and high chlorophyll values (Fig. 2c).
In the oligotrophic oceanic waters (such as the Gulf ofCadiz), picoplankton dominates the phytoplanktonbiomass (Chisholm, 1992; Partensky et al., 1996; Agawinet al., 2000; Bell and Kalff, 2001). The factors that allowthe selection of different cellular sizes in relation toenvironmental conditions are still under debate (e.g.Cozar and Echevarrıa, 2005; Sherr et al., 2005),although it is accepted that small cells are better adaptedto low-nutrient conditions due to their larger surface perunit volume that benefits the incorporation of nutrients,decreased sedimentation rate and the enhancement ofgrowth rates at the same nutrient concentration(Chisholm, 1992). It has also been quite well establishedthat Prochlorococcus and Synechococcus are usually found inthe same oligotrophic regions, although they have a ten-dency to separate their distribution maxima in space
and time (Olson et al., 1990; Chisholm, 1992). In sucholigotrophic waters, Prochlorococcus appear at greaterdepth, creating a subsurface biomass maximum;whereas Synechococcus is more abundant in surface layers(Partensky et al., 1999; Goericke et al., 2000). AlsoProchlorococcus is more abundant under more oligotrophicconditions than Synechococcus, which appears in moremesotrophic areas (Chisholm, 1992). The distributionpattern we found in our study corresponds well with thisidea, with higher densities of both picoplankters in theGulf of Cadiz sector (more oligotrophic than the upwel-ling area of the Alboran Sea), and a vertical distributionwhich shows a subsurface maxima of Prochlorococcus inthe Gulf waters (Fig. 4). The spatial distribution withineach basin also shows a complementarity of both popu-lations, with Prochlorococcus in deeper waters offshore,whereas Synechococcus accumulated in surface waters closeto the shore (Figs 4 and 5). Similar results have beenobtained by other authors in different areas (e.g.Partensky et al., 1996; Jacquet et al., 2002; Pan et al.,2004) and by Reul et al. (Reul et al., 2005) for the NWAlboran Sea. At a larger spatial scale, Zubkov et al.
(Zubkov et al., 2000) analyzed the abundance of thesesmall cells on the Atlantic Meridional Transect, andthey also showed higher abundance of Prochlorococcus inoligotrophic equatorial environments and a substitutionwith Synechococcus at higher latitudes (.308) more meso-trophic and affected by upwelling mechanisms.
However, to get the complete picture of the pico-plankton distribution and its relation to the hydro-graphic structures in the region of study, we mustconsider the particularities of such regions where differ-ent water masses meet (Gascard and Richez, 1985). So,Prochlorococcus in the Gulf of Cadiz mainly appears indeeper waters offshore, associated with the interfacebetween SAW and NACW usually described to be at the
Fig. 9. Depth averaged spatial distribution of the percentage of picoplankton to total autotrophic biomass (chlorophyll derived).
F. ECHEVARRIA ET AL. j PICOPLANKTON SPATIAL DISTRIBUTION AT SOUTH IBERIA
1347

26.6 isopycnal (Navarro et al., 2006; Reul et al., 2006).The distribution of both populations in the Gulf(Fig. 5b and c) agrees well with this general pattern asProchlorococcus was found associated with this interface(where a strong nutricline develops) and Synechococcus ispresent far inshore and in shallower waters. The verticalposition of Prochlorococcus in the Alboran sea is clearlyshallower (Figs 4 and 5), with an accumulation insurface waters associated with the frontal area createdbetween the Mediterranean waters and the AJ (Fig. 5a).The dynamics of these chlorophyll maxima both withinthe Strait and in the Alboran Sea have been recentlyassessed by Macıas et al. (Macıas et al., 2008b) showingthat, effectively, Prochlorococcus could cross the Straitalong with the NACW at some periods of the tidal cyclefollowing the shallowing of the AMI in its eastwardmovement within the AJ. The particular hydrodynamicsof the NW Alboran region, with the coastal upwellingand the strong far offshore frontal area, condition thedistribution of plankton assemblages (Macıas et al.,2009), with the species associated with Atlantic waters(such as both picoplankters) separated from the coastalwaters, as is also observed in our results (Fig. 9).
On the other hand, nutrient-rich zones, with higherchlorophyll values, are dominated by larger cells,mainly diatoms (Malone, 1980) as overall biodiversity ofeutrophic marine ecosystem is usually lower than inmesotrophic environments (Irigoien et al., 2004). Thisfact allows to consider the predominance of small cellsin oligotrophic environments as a consequence of thediminution of larger cells, with a relatively uniformbackground of small cells (Chisholm, 1992; Chen, 2000)or maybe due to smaller variations in small cell concen-tration between different trophic states (e.g. Agawin et al.,2000; Bell and Kalff, 2001). However, there are differ-ences when representing picoplankton biomass (expressedas chlorophyll a content) or picoplankton abundances(cell number) with respect to total phytoplankton biomass(in terms of chlorophyll a content). In a previous work,performed with an extensive data review of many differ-ent marine environments, Agawin et al. (Agawin et al.,2000) found a positive relationship between picoplanktonbiomass and total autotrophic biomass. These authorsobserved that the slope of the regression equation wasalways lower than one explaining why in eutrophicenvironments the relative contribution of picoplankton tototal biomass was lower than at more oligotrophic sites.This very same pattern is observed in our data (Fig. 6)when biomass (expressed as chlorophyll a content) is usedas an estimator of abundance.
However, if we make the same comparison usingpicoplankton cell abundance instead of chlorophyll a
content, the relationship shifts to a negative one
(Fig. 8a) indicating a higher abundance of these smallcells in the lower nutrient and chlorophyll Gulf ofCadiz basin, with an average biomass two times higherthan that in the Alboran Sea. This apparent incongru-ence obtained with the two different proxies of phyto-plankton abundance could be partially explained by achange in the effective Chl a/cell ratio in the eutrophicenvironments. The effect of shelf-shading is expected tobe important in such environments (Irigoien et al., 2004)which could drive a higher chlorophyll production perbiomass unit to better use the lower available ambientlight, thereby explaining why cell number reduces(Fig. 8a) while chlorophyll concentration slightlyincreases (Fig. 6a).
Analyzing our own data, this pattern becomes evidentas Chl a/cell ratio is significantly lower in oligotrophicwaters (mean ¼ 1.5 fg Chl a cell21; SD¼ 0.5; n ¼ 135)than in eutrophic waters (mean ¼ 2.8 fg Chl a cell21;SD¼ 0.6; n ¼ 23). Another explanation for this shift inthe ratio could be a simple change in the picophyto-plankton assemblage composition, being more abundantin eutrophic waters cells with higher chlorophyll contentper unit. This is also shown by our data as in oligo-trophic environments (Chl a , 1 mg L21), the moreabundant taxa were Synechococcus representing almost49% of total picoplankton cells, whereas in eutrophicwaters (Chl a . 2 mg L21), they drop to ,26% whileeukaryotic picoplankton increases to 26.2% (while theyrepresent barely a 9% in oligotrophic environments).
So it seems that the relative decrease in small cells inhigh-nutrient areas is a consequence of both, the higherpresence of large cells and the effective density decreaseof small organisms. The same result has been observedby other authors in many different oceanographicregions, for example, Hirata and Brewin (Hirata andBrewin, 2009) in the world’s ocean using satelliteimagery, Li (Li, 2002) in north Atlantic waters or Sherret al. (Sherr et al., 2005) offshore Oregon, or even in lab-oratory mesocom experiments (Wetz and Wheeler,2003). Until now, no satisfactory explanation for thisdecrease in small cell biomass in nutrient-rich environ-ments has been proposed. For example, Sherr et al.(Sherr et al., 2005) hypothesized that trace metals (par-ticularly cadmium) present in upwelled waters may bedifferentially toxic to large versus small phytoplankton.However, this is a rather local characteristics of the sitestudied by those authors (the Oregon coast) which isvery unlikely to explain the same patterns observed byLi (Li, 2002) throughout the North Atlantic Ocean, ourown data in southern Spain and by Hirata and Brewin(Hirata and Brewin, 2009) in the whole of the worldocean. So, to explain this macro-ecological pattern,which seems to occur in many different marine
JOURNAL OF PLANKTON RESEARCH j VOLUME 31 j NUMBER 11 j PAGES 1339–1351 j 2009
1348

environments, we should look for more general mech-anisms of plankton physiology or ecology.
One explanation could be related with the temporaldynamics of nutrient inputs to the surface layers in theupwelling regions. Owing to its dependence on meteor-ological forcing (wind, atmospheric pressure distri-butions), coastal upwelling in the NW Alboran Sea ishighly intermittent in time (Reul et al., 2006; Macıaset al., 2007b) which means a discontinuity in the nutri-ent pumping to the photic layer. This temporaldynamic has consequences for the structure of theplankton community as has been described byRykaczewski and Checkley (Rykaczewski and Checkley,2008) for the California upwelling system. Theseauthors found that shifts between anchovy and sardinedominance in the pelagic realm off California wererelated to changes in the upwelling mechanisms, whichinduce predominance of either bigger phytoplankters(with strong coastal-induced upwelling) or smaller ones(related with the less-intense wind-curl upwelling). Thisvery same aspect has been studied by Macıas et al.(Macıas et al., submitted for publication) very recentlyusing a modeling approach. These authors found thatdiscontinuous nutrient input to a virtual pelagic ecosystemfavored the predominance of bigger phytoplankton cells(mainly diatoms) to the detriment of the smaller ones. Sothe predominance of these larger cells with pulsatingnutrient inputs could be attributable to physiologicaladvantages of such cells as internal nutrient storage ormore effective nutrient uptake at higher nutrients loads.
Another hypothesis that could explain the lowerabundance of picophytoplankton in eutrophic waters isrelated to the grazing pressure on this plankton group.It is already known that microzooplankton grazingactivity is the main source of phytoplankton mortality inthe oceans (Calbet and Landry, 2004) and that ingestionrates increase non-linearly with increasing primary pro-ductivity (e.g. Calbet, 2001). Also, it has been demon-strated that, in nutrient-rich conditions, grazing couldbe higher on the smaller cells (due to microzooplankton,accounting of almost 60% of primary production) thanover the larger ones (which is mainly because of meso-zooplankton, only reaching some 10% of PP) (e.g.Barquero et al., 1998; Watson and McCauly, 1988;Calbet, 2001, 2008). This could partially explain thecompetitive advantage of nano- and microplanktonover the smaller cells in these trophic conditions, as theyshould be less intensively predated than the latter.
These two mechanisms could explain the lower abun-dance of picophytoplankton in the eutrophic waters ofthe NW Alboran Sea observed in our data set.Discontinuous nutrient pumping to the coastal areasfavors the predominance of diatoms and selective
grazing could be diminishing the number of smallercells. These two processes are common to many differ-ent oceanic ecosystems so they could be the reason forthe macro-ecological patterns of picoplankton distri-butions observed by Li (Li, 2002) and Sherr et al. (Sherret al., 2005) in two distant and very different ecosystemsor by Hirata and Brewin (Hirata and Brewin, 2009) inthe whole ocean (also coinciding with our own data).However, the exact mechanism of this selection is stillunclear and it could be a number of other factors inter-acting in the bloom environment such as the effect ofshelf-shading (Irigoien et al., 2004), selective protectionagainst grazing both by mechanical (Hamm et al., 2004;Strom et al., 2003) and chemical (Strom et al., 2003)mechanisms, excretion of allelopathic substances bydiatoms (e.g. Legrand et al., 2003) or maybe a differen-tial retention in upwelling areas associated with mesos-cale vertical motion (Rodrıguez et al., 2001). Thesealternative explanations do not exclude each other, beingmore probably a joint action of some (or many) of themat the same time, forcing and modulating the macroeco-logical pattern of plankton biomass distribution.
AC K N OW L E D G E M E N T S
The authors gratefully acknowledge the officers andcrew of the R/V “Francisco de Paula Navarro” forhelpful collaboration during the cruises. SST imageshave been processed in Ocean Colour Remote SensingService at ICMAN (CSIC) -CACYTMAR. Dr AndresCozar and two anonymous referees made helpful com-ments on a previous version of this manuscript. Weacknowledge Instituto Espanol de Oceanografıa aseditor and Ministerio de Agricultura, Pesca yAlimentacion as the copyright holder, for permission offigure 2 reproduction.
F U N D I N G
Projects REN2001-2733-CO2-02; REN2002-01281;CTM2005-08142-C03-01 and CTM2006-04015/MARpartially funded this study.
R E F E R E N C E S
Agawin, N. S. R., Duarte, C. M. and Agustı, S. (2000) Nutrient andtemperature control of the contributions of picoplankton to phyto-plankton biomass and production. Limnol. Oceanogr., 45, 591–600.
Armi, L. and Farmer, D. (1988) The flow of Mediterranean waterthrough the Strait of Gibraltar. Prog. Oceanogr., 21, 41–82.
F. ECHEVARRIA ET AL. j PICOPLANKTON SPATIAL DISTRIBUTION AT SOUTH IBERIA
1349

Barquero, S., Cabal, J. A., Anadon, R. et al. (1998) Ingestion ratesof phytoplankton by copepod size fractions on a bloomassociated with an off-shelf front off NW Spain. J. Plankton Res., 20,957–972.
Bell, T. and Kalff, J. (2001) The contribution of picophytoplankton inmarine and freshwater systems of different trophic status and depth.Limnol. Oceanogr., 46, 1243–1248.
Calbet, A. (2001) Mesozooplankton grazing effect on primary pro-duction: a global comparative analysis in marine ecosystems. Limnol.
Oceanogr., 46, 1824–1830.
Calbet, A. (2008) The trophic roles of microzooplankton in marineecosystems. ICES J. Mar. Sci., 65, 325–331.
Calbet, A. and Landry, M. (2004) Phytoplankton growth, microzoo-plankton grazing and carbon cycling in marine systems. Limnol.
Oceanogr., 49, 51–57.
Chen, Y. L. L. (2000) Comparisons of primary productivity and phyto-plankton size structure in the marginal regions of southern EastChina Sea. Cont. Shelf Res., 20, 437–458.
Chisholm, S. W. (1992) Phytoplankton size. In Falkowski, P. G. andWoodhead, A. D. (eds), Primary Productivity Biogeochemical Cycles in the
Sea. Plenum Press, New York, pp. 213–237.
Corzo, A., Rodrıguez-Galvez, S., Lubian, L. et al. (2005) Antarcticmarine bacterioplankton subpopulations discriminated by theirapparent content of nucleic acids differ in their response to ecologi-cal factors. Polar Biol., 29, 27–39.
Cozar, A. and Echevarrıa, F. (2005) Size structure of the planktoniccommunity in microcosms with different levels of turbulence. Sci.
Mar., 69, 187–197.
Dubelaar, G. B. J. and Jonker, B. R. (2000) Flow cytometry as a toolfor the study of phytoplankton. Sci. Mar., 64, 135–156.
DuRand, M. D., Olson, R. J. and Chisholm, S. W. (2001)Phytoplankton population dynamics at the Bermuda Atlantic time-series station in the Sargasso Sea. Deep-Sea Res. Part II, 48,1983–2003.
Echevarrıa, F. and Rodrıguez, J. (1994) The size structure of planktonduring a deep bloom in a stratified reservoir. Hydrobiologia, 284,113–124.
Echevarrıa, F., Lafuente, J. G., Bruno, M. et al. (2002)Physical-biological coupling in the Strait of Gibraltar. Deep-Sea Res.
Part II, 49, 4115–4130.
Garcıa, C. M., Prieto, L., Vargas, M. et al. (2002) Hydrodynamics andthe spatial distribution of plankton and TEP in the Gulf of Cadiz(SW Iberian Peninsula). J. Plankton Res., 24, 817–833.
Garcıa Lafuente, J. and Ruiz, J. (2007) The Gulf of Cadiz pelagic eco-system: a review. Prog. Oceanogr., 74, 228–251.
Garcıa-Lafuente, J., Delgado, J., Criado-Aldeanueva, F. et al. (2006)Water masses circulation in the continental shelf of the Gulf ofCadiz. Deep-Sea Res. Part II, 53, 1282–1303.
Gascard, J. C. and Richez, C. (1985) Water masses and circulation inthe western Alboran Sea and Strait of Gibraltar. Prog. Oceanogr., 15,157–216.
Goericke, R., Olson, R. J. and Shalapyonok, A. (2000) A novel nichefor Prochlorococcus sp. in low-light suboxic environments in theArabian Sea and the eastern tropical North Atlantic. Deep-Sea Res.
Part I, 47, 1183–1205.
Gomez, F., Echevarrıa, F., Garcıa, C. M. et al. (2000) Microplanktondistribution in the strait of Gibraltar: coupling between organismsand hydrodynamic structures. J. Plankton Res., 22, 603–617.
Gomez, F., Gorski, G., Garcıa-Gorriz, E. et al. (2004) Control of thephytoplankton distribution in the Strait of Gibraltar by wind andfortnightly tides. Est. Coast. Shelf Sci., 59, 485–497.
Hamm, C. E., Merkel, R., Springer, O. et al. (2003) Architecture andmaterial properties of diatom shells provide effective mechanicalprotection. Nature, 421, 841–843.
Hirata, T. and Brewin, R. (2009) Phytoplankton community structurefrom space. GLOBEC International Newsletter, 15, 5–6.
Holm-Hansen, O., Lorenzen, C. J., Homes, R. W. et al. (1965)Fluorometric determination of chlorophyll. J. Cons. Perm. Int. Explor.
Mer., 187, 9–18.
Huertas, I. E., Navarro, G., Rodrıguez-Galvez, S. et al. (2005) Theinfluence of phytoplankton biomass on the spatial distribution ofcarbon dioxide in surface sea water of a coastal area of the Gulf ofCadiz (southwestern Spain). Can. J. Bot., 83, 929–940.
Irigoien, X., Huisman, J. and Harris, R. P. (2004) Global biodiversitypatterns of marine phytoplankton and zooplankton. Nature, 429,863–867.
Jacquet, S., Prieur, L., Avois-Jacquet, C. et al. (2002) Short-timescalevariability of picophytoplankton abundance and cellular parametersin surface waters of the Alboran Sea (western Mediterranean).J. Plankton Res., 24, 635–651.
Lebaron, P., Servais, P., Baudoux, A. C. et al. (2002) Variations ofbacterial-specific activity with cell size and nucleic acid contentassessed by flow cytometry. Aquat. Microb. Ecol., 28, 131–140.
Legendre, L. and Lefebvre, J. (1995) Microbial food webs and the exportof biogenic carbon in the oceans. Aquat. Microb. Ecol., 9, 69–77.
Legendre, L. and Rassoulzadegan, F. (1996) Food web mediatedexport of biogenic carbon in oceans: hydrodynamic control. Mar.
Ecol.-Prog. Ser., 145, 179–193.
Legrand et al. (2003) Allelophathy in phytoplankton: biochemical, eco-logical and evolutionary aspects. Phycologia, 42, 406–419.
Li, W. K. W. (2002) Macroecological patterns of phytoplankton in thenorthwestern North Atlantic Ocean. Nature, 419, 154–157.
Macıas, D., Garcıa, C. M., Echevarrıa, F. et al. (2006) Tidal inducedvariability of mixing processes on Camarinal Sill (Strait ofGibraltar). A pulsating event. J. Mar. Sys., 60, 177–192.
Macıas, D., Martin, A. P., Garcıa Lafuente, J. et al. (2007a) Mixingand biogeochemical effects induced by tides on the Atlantic–Mediterranean flow in the Strait of Gibraltar. An analysis through aphysical–biological coupled model. Prog. Oceanogr., 74, 252–272.
Macıas, D., Navarro, G., Echevarrıa, F. et al. (2007b) Phytoplanktonpigment distribution in the north-western Alboran Sea and meteor-ological forcing: a remote sensing study. J. Mar. Res., 65, 523–543.
Macıas, D., Bruno, M., Echevarrıa, F. et al. (2008a) Metereologically-induced mesoscale variability of the North-western Alboran Sea(southern Spain) and related biological patterns. Est. Coast. Shelf Sci.,78, 250–266.
Macıas, D., Lubian, L. M., Echevarrıa, F. et al. (2008b) Chlorophyllmaxima and water mass interfaces: tidally induced dynamics in theStrait of Gibraltar. Deep-Sea Res. Part I, 55, 832–846.
Macıas, D., Navarro, G., Bartual, A. et al. (2009) Primary productionin the Strait of Gibraltar: carbon fixation rates in relation to hydro-dynamic and phytoplankton dynamics. Est. Coast. Shelf Sci., 83,197–210. doi:10.1016/j.ecss.2009.03.032.
Malone, T. C. (1980) Algal size. In Morris, I. (ed.), The Physiological
Ecology of Phytoplankton. Blackwell Scientific Publications, Oxford, pp.133–463.
JOURNAL OF PLANKTON RESEARCH j VOLUME 31 j NUMBER 11 j PAGES 1339–1351 j 2009
1350

Navarro, G. and Ruiz, J. (2006) Spatial and temporal variability ofphytoplankton in the Gulf of Cadiz through remote sensing images.Deep-Sea Res. Part II, 53, 1241–1260. doi:10.1016/j.dsr2.2006.04.014.
Navarro, G., Ruiz, J., Garcıa, C. M. et al. (2006) Basin scale structuresgoverning the position of the deep fluorescence maximum in theGulf of Cadiz. Deep-Sea Res. Part II, 53, 1261–1281. doi:10.1016/j.dsr2.2006.04.013.
Olson, R. J., Chisholm, S. W., Zettler, E. R. et al. (1990) Spatial andtemporal distributions of prochlorophyte picoplankton in the NorthAtlantic Ocean. Deep-Sea Res. Part I, 37, 1033–1051.
Pan, L. A., Zhang, L. H., Zhang, J. et al. (2004) On board flow cyto-metric observation of picoplankton community structure in the EastChina Sea during the fall of different years. FEMS Microbiol. Ecol.,52, 243–253.
Partensky, F., Blanchot, J., Lantoine, F. et al. (1996) Vertical structureof picophytoplankton at different trophic sites of the tropicalNortheastern Atlantic Ocean. Deep-Sea Res. Part I, 43, 1191–1213.
Partensky, F., Blanchot, J. and Vaulot, D. (1999) Differential distri-bution and ecology of Prochlorococcus and Synechococcus in oceanicwaters: a review. In Charpy, L. and Larkun, A. W. D. (eds), Marine
Cyanobacteria, Vol. 19. Bulletin de l’institut oceanographique deMonaco, N8 special, pp. 457–475.
Perkins, H., Kinder, T. and La Violette, P. (1990) The Atlantic inflowin the western Alboran Sea. J. Phys. Oceanogr., 20, 242–263.
Phinney, D. A. and Cucci, T. L. (1989) Flow cytometry and phyto-plankton. Cytometry, 10, 511–521.
Prieto, L., Garcıa, C. M., Corzo, A. et al. (1999) Phyoplankton,bacterioplankton and nitrate reductase activity distribution inrelation to physical structure in the Northern Alboran Sea and Gulfof Cadiz (southern Iberian Peninsula). Bol. Inst. Esp. Oceanogr., 15,401–411.
Prieto, L., Navarro, G., Rodrıguez-Galvez, S. et al. (2009)Oceanographic and meteorological forcing of the pelagic ecosystemof the Gulf of Cadiz shelf (SW Iberian Peninsula). Cont. Shelf Res.
In press.
Reul, A., Rodrıguez, V., Jimenez-Gomez, F. et al. (2005) Variability inthe spatio-temporal distribution and size structure of phytoplanktonacross an upwelling area in the NW Alboran Sea(W-Mediterranean). Cont. Shelf Res., 25, 589–608.
Reul, A., Munoz, M., Criado-Adeanueva, F. et al. (2006) Spatialdistribution of phytoplankton ,13 mm in the Gulf of Cadizin relation to water masses and circulation pattern underwesterly and easterly wind regimes. Deep-Sea Res. Part II, 53,1378–1389.
Rodrıguez, J., Blanco, J. M., Jimenez-Gomez, F. et al. (1998) Patternsin the size structure of the phytoplankton community in the deepfluorescence maximum of the Alboran Sea (southwesternMediterranean). Deep-Sea Res. Part I, 45, 1577–1593.
Rodrıguez, J., Tintore, J., Allen, J. T. et al. (2001) Mesoscale verticalmotion and the size structure of phytoplankton in the ocean. Nature,410, 360–363.
Rubın, J. P., Cano, N., Prieto, L. et al. (1999) La estructura del ecosis-tema pelagico en relacion a las condiciones oceanograficas y topo-graficas en el Golfo de Cadiz, Estrecho de Gibraltar y Mar deAlboran (Sector NorOeste) en Julio de 1995. Inf. Tec. Inst. Esp.
Oceanogr., 175. 73 pp.
Ruız, J., Garcıa, C. M. and Rodrıguez, J. (1996) Vertical patterns ofphytoplankton size distribution in the Cantabric and Balearic Seas.J. Mar. Sys., 9, 269–282.
Ruiz, J., Garcıa-Isarch, E., Huertas, I. E. et al. (2006) Meterologicalforcing and ocean dynamics controlling Engraulis encrasicolus earlylife stages and catches in the Gulf of Cadiz. Deep-Sea Res. Part II, 53,1363–1376.
Rykaczewski, R. R. and Checkley, D. M. (2008) Influence of oceanwinds on the pelagic ecosystem in upwelling regions. PNAS, 105,1065–1970.
Sarhan, T., Garcıa-Lafuente, J., Vargas, M. et al. (2000) Upwelling mech-anisms in the northwestern Alboran Sea. J. Mar. Sys., 23, 317–331.
Sherr, E. B., Sherr, B. F. and Wheeler, P. A. (2005) Distribution ofcoccoid cyanobacteria and small eukaryotic phytoplankton in theupwelling ecosystem off the Oregon coast during 2001 and 2002.Deep-Sea Res. Part II, 52, 317–330.
Stevenson, R. E. (1977) Huelva front and Malaga, Spain, Eddy chainas defined by satellite and Oceanographic Data. Dtsch. Hydrogr. Z.,30, 51–53.
Strom, S. et al. (2003) Chemical defense in the microplankton. I. Feedingand growth rates of the heterotrophic protists on the DMS-producingphytoplankter E. huxleyi. Limnol. Oceanogr., 48, 217–229.
Treguer, P. and Le Corre, P. (1975) Manuel d’analyse des sels nutritifsdans l’eau de mer (utilisation de l’autoanalyzer « Technicon AAII»). Universite de Bretagne Occidental.
Vargas, J. M., Garcıa-Lafuente, J., Delgado, J. et al. (2003) Seasonaland wind-induced variability of sea surface temperature patterns inthe Gulf of Cadiz. J. Mar. Sys., 38, 205–219.
Vargas-Yanez, M., Sarhan, T., Plaza, F., Rubın, J. P. and Garcıa-Martınez, M. C. (2002) The influence of tide-topography inter-action on low-frequency heat and nutrient fluxes. Application toCape Trafalgar. Cont. Shelf Res., 22, 115–139.
Vaulot, D., Courties, C. and Partensky, F. (1989) A simple method topreserve oceanic phytoplankton for flow cytometric analyses.Cytometry, 10, 629–635.
Verity, P., Robertson, C. Y., Tronzo, C. R. et al. (1992) Relationshipbetween cell volume and carbon and nitrogen content ofmarine photosynthetic nanoplankton. Limnol. Oceanogr., 37,1434–1446.
Viudez, A. and Haney, R. L. (1997) On the relative vorticity of theAtlantic Jet in the Alboran Sea. J. Phys. Oceanogr., 27, 175–185.
Viudez, A., Haney, R. L. and Tintore, J. (1996) Circulation in theAlboran Sea as determined by quasi-synoptic hydrographicobservations. Part II: mesoscale ageostrophic motion diagnosedthrough density dynamical assimilation. J. Phys. Oceanogr., 26,706–724.
Watson, S. and McCauley, E. (1988) Contrasting patterns of net- andnanoplankton production and biomass among lakes. Can. J. Fish.
Aquat. Sci., 45, 915–920.
Wetz, M. S. and Wheeler, P. A. (2003) Production and partitioning oforganic matter during simulated phytoplankton blooms. Limnol.
Oceanogr., 48, 1808–1817.
Zubkov, M. V., Sleigh, M. A., Burkill, P. H. et al. (2000) Picoplanktoncommunity structure on the Atlantic Meridional Transect: a com-parison between seasons. Prog. Oceanogr., 45, 369–386.
F. ECHEVARRIA ET AL. j PICOPLANKTON SPATIAL DISTRIBUTION AT SOUTH IBERIA
1351