New evidence of delamination in the Western Alboran Sea Geodynamic evolution of the Alboran domain...
12
This article appeared in a journal published by Elsevier. The attached copy is furnished to the author for internal non-commercial research and education use, including for instruction at the authors institution and sharing with colleagues. Other uses, including reproduction and distribution, or selling or licensing copies, or posting to personal, institutional or third party websites are prohibited. In most cases authors are permitted to post their version of the article (e.g. in Word or Tex form) to their personal website or institutional repository. Authors requiring further information regarding Elsevier’s archiving and manuscript policies are encouraged to visit: http://www.elsevier.com/authorsrights
Transcript of New evidence of delamination in the Western Alboran Sea Geodynamic evolution of the Alboran domain...
This article appeared in a journal published by Elsevier. The attachedcopy is furnished to the author for internal non-commercial researchand education use, including for instruction at the authors institution
and sharing with colleagues.
Other uses, including reproduction and distribution, or selling orlicensing copies, or posting to personal, institutional or third party
websites are prohibited.
In most cases authors are permitted to post their version of thearticle (e.g. in Word or Tex form) to their personal website orinstitutional repository. Authors requiring further information
regarding Elsevier’s archiving and manuscript policies areencouraged to visit:
http://www.elsevier.com/authorsrights
Author's personal copy
Journal of Geodynamics 77 (2014) 206–216
Contents lists available at ScienceDirect
Journal of Geodynamics
jou rn al hom epage: ht tp : / /www.e lsev ier .com/ locate / jog
New evidence of delamination in the Western Alboran SeaGeodynamic evolution of the Alboran domain and its margins
Youssef Timoulali a,∗, Hamou Djellitb, Youssef Hahoua,Nacer Jaboura, Redouane Merroucha
a Centre National pour la Recherche Scientifique et Technique (CNRST), Rabat, Moroccob Centre de Recherche en Astronomie, Astrophysique et Géophysique (CRAAG), Alger, Algeria
a r t i c l e i n f o
Article history:Received 28 January 2013Received in revised form 22 October 2013Accepted 24 October 2013Available online 1 November 2013
Keywords:Alboran SeaSeismic tomographyCrustal velocityTectonics blocks
a b s t r a c t
The presence of continuous upper crustal blocks between the Iberian Betics and Moroccan Rif in the west-ern and middle Alboran Sea, detected with tomography, can add new information about the lithospherestructure and geodynamic evolution in this region. A large volume of seismic data (P and S wave arrivaltimes) has been collected for the period between 1 December 1988 and 31 December 2008 by 57 stationslocated in northern Morocco (National Institute of Geophysics, CNRST, Rabat), southern Portugal (Insti-tuto de Meteorologia, Lisbon) and Spain (Instituto Geografico National, Madrid) and used to investigatethe lithosphere in the western Alboran Sea region. We use a linearized inversion procedure compris-ing two steps: (1) finding the minimal 1-D model and simultaneous relocation of hypocenters and (2)determination of local velocity structure using linearized inversion. The model parameterization in thismethod assumes a continuous velocity field. The resolution tests indicate that the calculated images givenear true structure imaged at 5 km depth for the Tanger peninsula, the Alhoceima region and southernSpain. At 15, 30 and 45 km depth we observe a near true structure imaged in northern Morocco, andsouthern Spain. At 60 and 100 km, southern Spain and the SW region of the Alboran Sea give a near truestructure. The resulting tomographic image shows the presence of two upper crustal bodies (velocity6.5 km/s) at 5–10 km depth between the Betics, Rif, western and central Alboran Sea. Low velocities atthe base of these two bodies favor the presence of melt. This new evidence proves that the Tethysianocean upper crust was not totally collapsed or broken down during the late Oligocene–early Miocene.These two blocks of upper crust were initially one block. The geodynamic process in the eastern of theMediterranean is driven by slab rollback. The delamination process of the lithospheric mantle terminateswith the proposed slab rollback in the western part of the Mediterranean. This can be explained by theremoval of the major part of the lithosphere beneath the area, except in the SW part of the Alboran Seawhere a small part of the lithospheric mantle is still attached and is extends and dips to SE beneaththe Rif, slowly peeled back to the west. A second detached lithospheric mantle is located and extendsto eastern part of the Rif and dips to the SE. The removal of lithosphere mantle from the base of thecrust was replaced and heated by extrusion of asthenospheric material coming from depth to replace thepart of crust detached. A combination of isostatic surface/topographic uplift and erosion induced a rapidexhumation and cooling of deep crustal rocks.
© 2013 Elsevier Ltd. All rights reserved.
1. Introduction
The Western Mediterranean evolution has been explained bya variety of geodynamic process ranging from west- directed slabrollback (Royden, 1993; Lonergan and White, 1997; Gutscher et al.,2002; Faccenna et al., 2004; Jolivet et al., 2006; Bezada et al., 2013),break-off of subducting ocean plate (Blanco and Spakman, 1993;
∗ Corresponding author. Tel.: +212 663299660; fax: +212 537778678.E-mail addresses: [email protected], [email protected] (Y. Timoulali),
[email protected] (H. Djellit).
Zeck, 1996, 1999) to convective removal or delamination model(Platt and Vissers, 1989; Vissers et al., 1995; Seber et al., 1996;Mezcua and Rueda, 1997). Calvert et al. (2000) proposed that exten-sion was initiated by detachment of over-thickened continentallithosphere during late Oligocene-Early Miocene.
With the expansion of seismic networks during the last twodecades in Morocco, Spain and Portugal, a large volume of seis-mic data have been collected in this region and used to investigatethe lithospheric structure in the Alboran region. In this paper, wefirst present the tectonic context, seismic data selection and meth-ods necessary for the 3-D structure velocity. Since no 1-D velocitymodel of the All Alboran region exists, we used the European PM2
0264-3707/$ – see front matter © 2013 Elsevier Ltd. All rights reserved.http://dx.doi.org/10.1016/j.jog.2013.10.005
Author's personal copy
Y. Timoulali et al. / Journal of Geodynamics 77 (2014) 206–216 207
model (Spakman et al., 1993a,b) to perform relocation. We then usetomography to accurately obtain the velocity map and crustal struc-ture of the Alboran region. The P wave arrival times are inverted todefine the main features of the deep structure in the Alboran Seaand to image the crust and upper mantle velocity. The results arecompared with studies that have been carried out in this complexregion and we discuss the implication of new results from this studyfor the evolution of Alboran lithospheric structure.
2. Tectonic setting
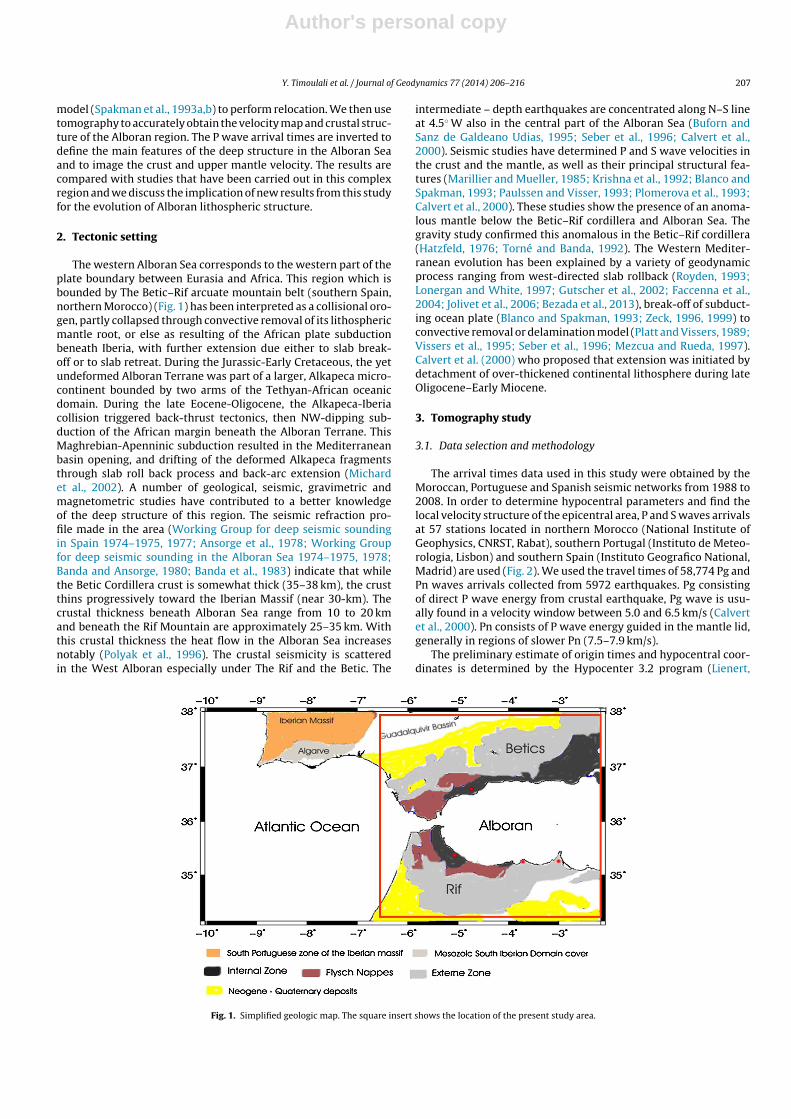
The western Alboran Sea corresponds to the western part of theplate boundary between Eurasia and Africa. This region which isbounded by The Betic–Rif arcuate mountain belt (southern Spain,northern Morocco) (Fig. 1) has been interpreted as a collisional oro-gen, partly collapsed through convective removal of its lithosphericmantle root, or else as resulting of the African plate subductionbeneath Iberia, with further extension due either to slab break-off or to slab retreat. During the Jurassic-Early Cretaceous, the yetundeformed Alboran Terrane was part of a larger, Alkapeca micro-continent bounded by two arms of the Tethyan-African oceanicdomain. During the late Eocene-Oligocene, the Alkapeca-Iberiacollision triggered back-thrust tectonics, then NW-dipping sub-duction of the African margin beneath the Alboran Terrane. ThisMaghrebian-Apenninic subduction resulted in the Mediterraneanbasin opening, and drifting of the deformed Alkapeca fragmentsthrough slab roll back process and back-arc extension (Michardet al., 2002). A number of geological, seismic, gravimetric andmagnetometric studies have contributed to a better knowledgeof the deep structure of this region. The seismic refraction pro-file made in the area (Working Group for deep seismic soundingin Spain 1974–1975, 1977; Ansorge et al., 1978; Working Groupfor deep seismic sounding in the Alboran Sea 1974–1975, 1978;Banda and Ansorge, 1980; Banda et al., 1983) indicate that whilethe Betic Cordillera crust is somewhat thick (35–38 km), the crustthins progressively toward the Iberian Massif (near 30-km). Thecrustal thickness beneath Alboran Sea range from 10 to 20 kmand beneath the Rif Mountain are approximately 25–35 km. Withthis crustal thickness the heat flow in the Alboran Sea increasesnotably (Polyak et al., 1996). The crustal seismicity is scatteredin the West Alboran especially under The Rif and the Betic. The
intermediate – depth earthquakes are concentrated along N–S lineat 4.5◦ W also in the central part of the Alboran Sea (Buforn andSanz de Galdeano Udias, 1995; Seber et al., 1996; Calvert et al.,2000). Seismic studies have determined P and S wave velocities inthe crust and the mantle, as well as their principal structural fea-tures (Marillier and Mueller, 1985; Krishna et al., 1992; Blanco andSpakman, 1993; Paulssen and Visser, 1993; Plomerova et al., 1993;Calvert et al., 2000). These studies show the presence of an anoma-lous mantle below the Betic–Rif cordillera and Alboran Sea. Thegravity study confirmed this anomalous in the Betic–Rif cordillera(Hatzfeld, 1976; Torné and Banda, 1992). The Western Mediter-ranean evolution has been explained by a variety of geodynamicprocess ranging from west-directed slab rollback (Royden, 1993;Lonergan and White, 1997; Gutscher et al., 2002; Faccenna et al.,2004; Jolivet et al., 2006; Bezada et al., 2013), break-off of subduct-ing ocean plate (Blanco and Spakman, 1993; Zeck, 1996, 1999) toconvective removal or delamination model (Platt and Vissers, 1989;Vissers et al., 1995; Seber et al., 1996; Mezcua and Rueda, 1997).Calvert et al. (2000) who proposed that extension was initiated bydetachment of over-thickened continental lithosphere during lateOligocene–Early Miocene.
3. Tomography study
3.1. Data selection and methodology
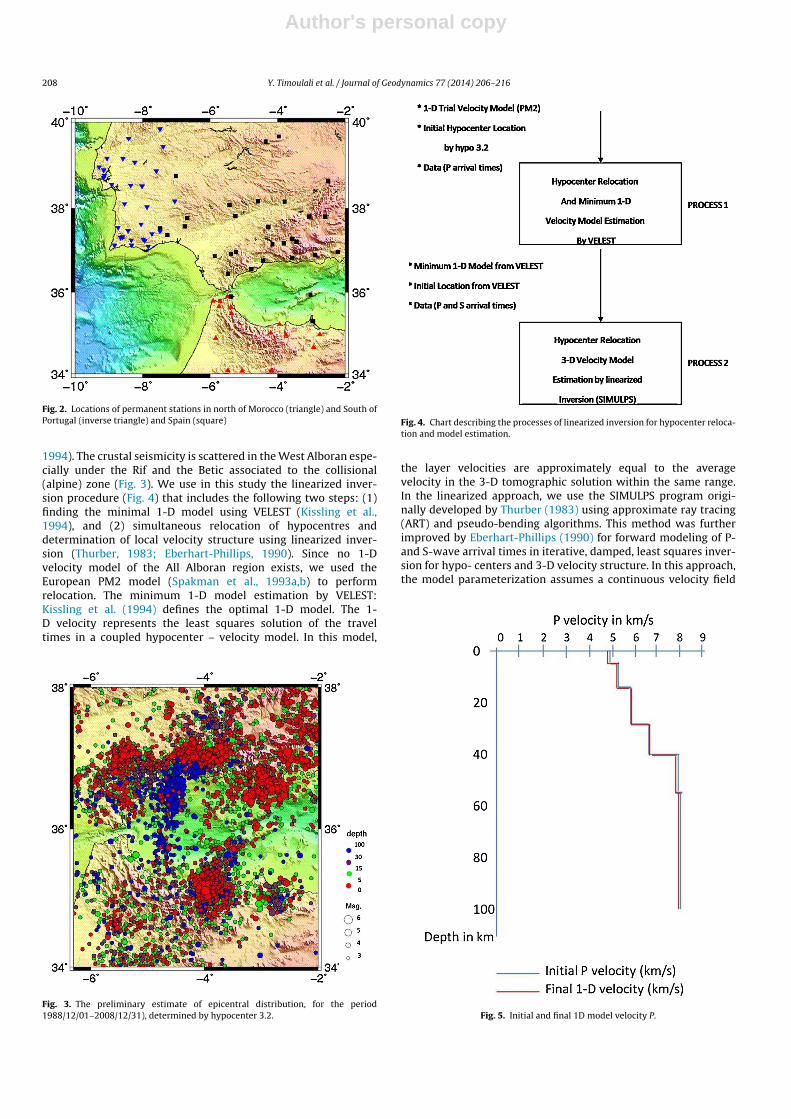
The arrival times data used in this study were obtained by theMoroccan, Portuguese and Spanish seismic networks from 1988 to2008. In order to determine hypocentral parameters and find thelocal velocity structure of the epicentral area, P and S waves arrivalsat 57 stations located in northern Morocco (National Institute ofGeophysics, CNRST, Rabat), southern Portugal (Instituto de Meteo-rologia, Lisbon) and southern Spain (Instituto Geografico National,Madrid) are used (Fig. 2). We used the travel times of 58,774 Pg andPn waves arrivals collected from 5972 earthquakes. Pg consistingof direct P wave energy from crustal earthquake, Pg wave is usu-ally found in a velocity window between 5.0 and 6.5 km/s (Calvertet al., 2000). Pn consists of P wave energy guided in the mantle lid,generally in regions of slower Pn (7.5–7.9 km/s).
The preliminary estimate of origin times and hypocentral coor-dinates is determined by the Hypocenter 3.2 program (Lienert,
Fig. 1. Simplified geologic map. The square insert shows the location of the present study area.
Author's personal copy
208 Y. Timoulali et al. / Journal of Geodynamics 77 (2014) 206–216
Fig. 2. Locations of permanent stations in north of Morocco (triangle) and South ofPortugal (inverse triangle) and Spain (square)
1994). The crustal seismicity is scattered in the West Alboran espe-cially under the Rif and the Betic associated to the collisional(alpine) zone (Fig. 3). We use in this study the linearized inver-sion procedure (Fig. 4) that includes the following two steps: (1)finding the minimal 1-D model using VELEST (Kissling et al.,1994), and (2) simultaneous relocation of hypocentres anddetermination of local velocity structure using linearized inver-sion (Thurber, 1983; Eberhart-Phillips, 1990). Since no 1-Dvelocity model of the All Alboran region exists, we used theEuropean PM2 model (Spakman et al., 1993a,b) to performrelocation. The minimum 1-D model estimation by VELEST:Kissling et al. (1994) defines the optimal 1-D model. The 1-D velocity represents the least squares solution of the traveltimes in a coupled hypocenter – velocity model. In this model,
Fig. 3. The preliminary estimate of epicentral distribution, for the period1988/12/01–2008/12/31), determined by hypocenter 3.2.
Fig. 4. Chart describing the processes of linearized inversion for hypocenter reloca-tion and model estimation.
the layer velocities are approximately equal to the averagevelocity in the 3-D tomographic solution within the same range.In the linearized approach, we use the SIMULPS program origi-nally developed by Thurber (1983) using approximate ray tracing(ART) and pseudo-bending algorithms. This method was furtherimproved by Eberhart-Phillips (1990) for forward modeling of P-and S-wave arrival times in iterative, damped, least squares inver-sion for hypo- centers and 3-D velocity structure. In this approach,the model parameterization assumes a continuous velocity field
Fig. 5. Initial and final 1D model velocity P.
Author's personal copy
Y. Timoulali et al. / Journal of Geodynamics 77 (2014) 206–216 209
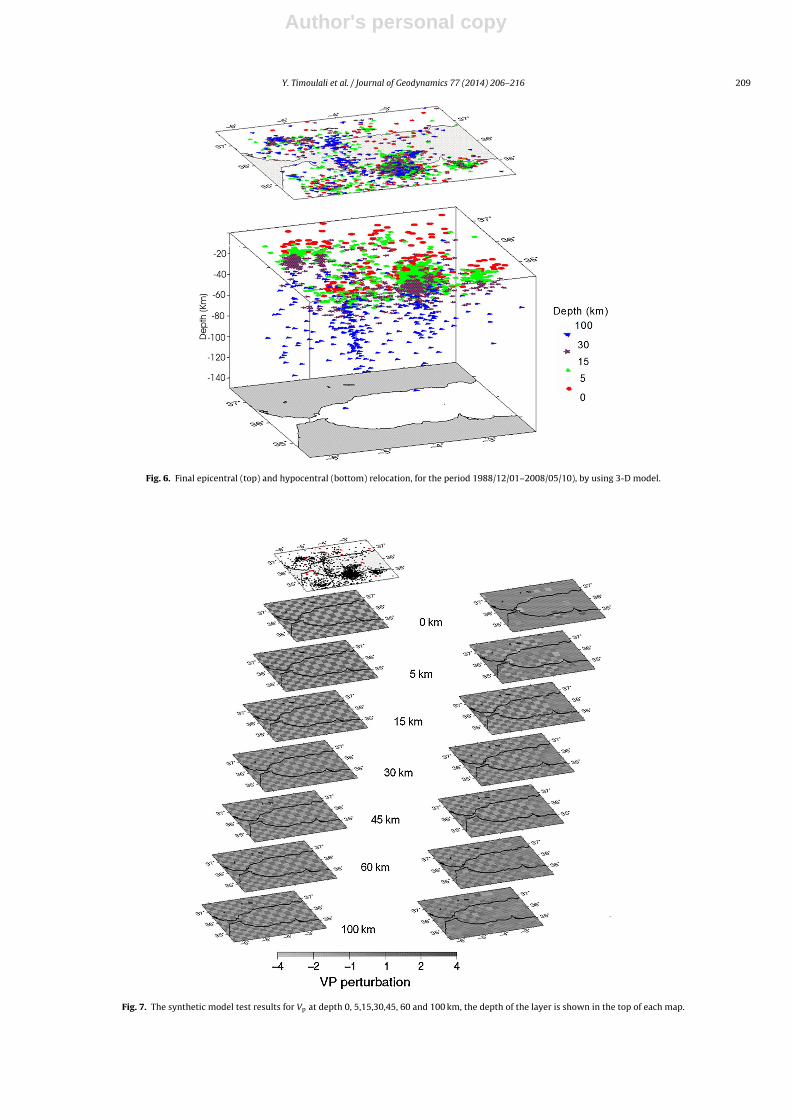
Fig. 6. Final epicentral (top) and hypocentral (bottom) relocation, for the period 1988/12/01–2008/05/10), by using 3-D model.
Fig. 7. The synthetic model test results for Vp at depth 0, 5,15,30,45, 60 and 100 km, the depth of the layer is shown in the top of each map.
Author's personal copy
210 Y. Timoulali et al. / Journal of Geodynamics 77 (2014) 206–216
by linearly interpolating between velocities values defined at thenodes of a 3-D grid (Foulger and Toomey, 1989). Nodal locationsare fixed prior to an inversion. The velocity at any interveningpoint is determined by linear interpolation among the surroundingeight grid points. Values at the velocity nodes are systematicallyperturbed during the inversion. Except for the outermost nodes,which are always fixed, every node location can either be kept fixedor included in the inversion. The ART algorithm selects the pathwith the least travel time from a suite of circular arcs connectingthe source and the receiver. The iterative pseudo-bending methodfine-tunes the ray path obtained by ART to better approximate thetrue path dictated by the local velocity gradients (Um and Thurber,1987).
For the relocation of local events, an initial 1-D velocity modelwas constructed from a reference model (PM2) determined forEurope (Spakman et al., 1993a,b). Each event was relocated usingthe same starting epicentral location and origin time, but usingmultiple starting hypocentral depths of 0, 5, 15, 30, 45, 60 and100 km. Some criteria are used to remove poorly constrainedevents: the location with the high weighted RMS residual (>1.0 s)and any event that has a horizontal or vertical shift more than 10 kmis discarded.
The final 1-D model velocity is shown in Fig. 5 and the final loca-tion when the two processes are performed (3-D model) is shownin Fig. 6. The crustal seismicity is scattered in the west Alboranbeneath the Rif and the Betic and the seismic activity is abundantand present at both shallow and intermediate depths. In the Rif theseismic activity is relatively limited to shallow depths. The inter-mediate seismic activity is present from depths of 60–150 km andconcentrated along a N–S line at 4.5◦ W also beneath the center ofAlboran Sea.
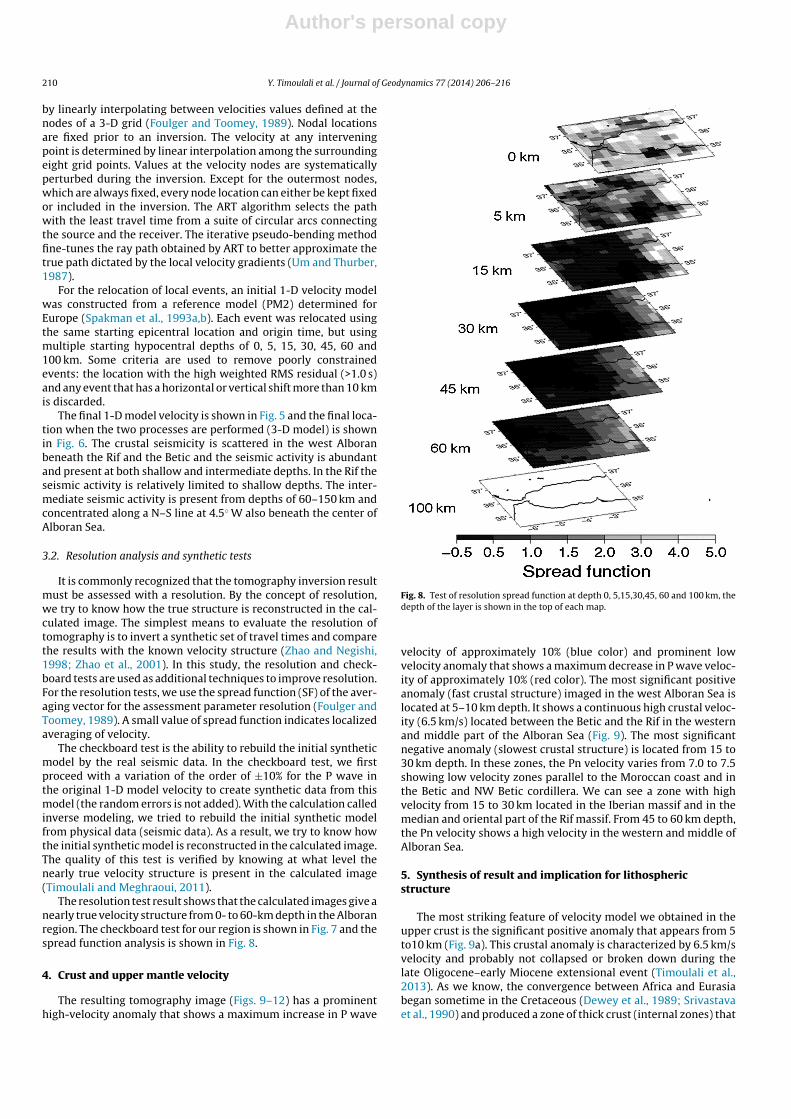
3.2. Resolution analysis and synthetic tests
It is commonly recognized that the tomography inversion resultmust be assessed with a resolution. By the concept of resolution,we try to know how the true structure is reconstructed in the cal-culated image. The simplest means to evaluate the resolution oftomography is to invert a synthetic set of travel times and comparethe results with the known velocity structure (Zhao and Negishi,1998; Zhao et al., 2001). In this study, the resolution and check-board tests are used as additional techniques to improve resolution.For the resolution tests, we use the spread function (SF) of the aver-aging vector for the assessment parameter resolution (Foulger andToomey, 1989). A small value of spread function indicates localizedaveraging of velocity.
The checkboard test is the ability to rebuild the initial syntheticmodel by the real seismic data. In the checkboard test, we firstproceed with a variation of the order of ±10% for the P wave inthe original 1-D model velocity to create synthetic data from thismodel (the random errors is not added). With the calculation calledinverse modeling, we tried to rebuild the initial synthetic modelfrom physical data (seismic data). As a result, we try to know howthe initial synthetic model is reconstructed in the calculated image.The quality of this test is verified by knowing at what level thenearly true velocity structure is present in the calculated image(Timoulali and Meghraoui, 2011).
The resolution test result shows that the calculated images give anearly true velocity structure from 0- to 60-km depth in the Alboranregion. The checkboard test for our region is shown in Fig. 7 and thespread function analysis is shown in Fig. 8.
4. Crust and upper mantle velocity
The resulting tomography image (Figs. 9–12) has a prominenthigh-velocity anomaly that shows a maximum increase in P wave
Fig. 8. Test of resolution spread function at depth 0, 5,15,30,45, 60 and 100 km, thedepth of the layer is shown in the top of each map.
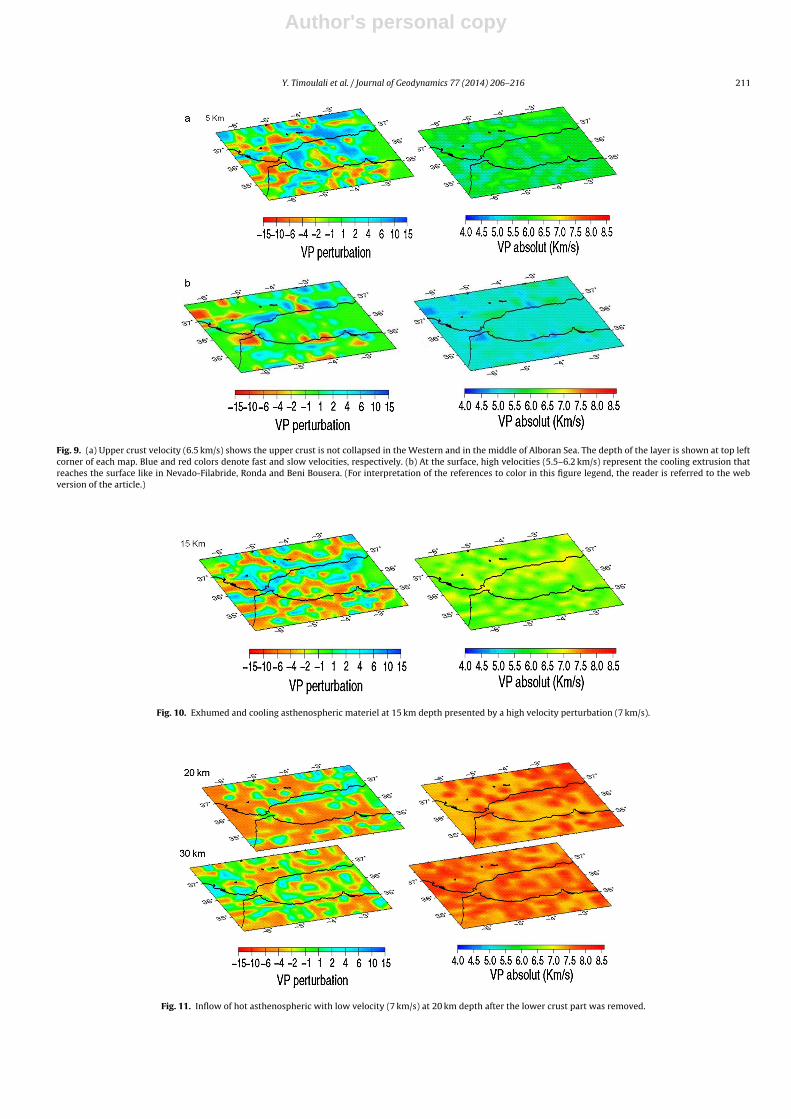
velocity of approximately 10% (blue color) and prominent lowvelocity anomaly that shows a maximum decrease in P wave veloc-ity of approximately 10% (red color). The most significant positiveanomaly (fast crustal structure) imaged in the west Alboran Sea islocated at 5–10 km depth. It shows a continuous high crustal veloc-ity (6.5 km/s) located between the Betic and the Rif in the westernand middle part of the Alboran Sea (Fig. 9). The most significantnegative anomaly (slowest crustal structure) is located from 15 to30 km depth. In these zones, the Pn velocity varies from 7.0 to 7.5showing low velocity zones parallel to the Moroccan coast and inthe Betic and NW Betic cordillera. We can see a zone with highvelocity from 15 to 30 km located in the Iberian massif and in themedian and oriental part of the Rif massif. From 45 to 60 km depth,the Pn velocity shows a high velocity in the western and middle ofAlboran Sea.
5. Synthesis of result and implication for lithosphericstructure
The most striking feature of velocity model we obtained in theupper crust is the significant positive anomaly that appears from 5to10 km (Fig. 9a). This crustal anomaly is characterized by 6.5 km/svelocity and probably not collapsed or broken down during thelate Oligocene–early Miocene extensional event (Timoulali et al.,2013). As we know, the convergence between Africa and Eurasiabegan sometime in the Cretaceous (Dewey et al., 1989; Srivastavaet al., 1990) and produced a zone of thick crust (internal zones) that
Author's personal copy
Y. Timoulali et al. / Journal of Geodynamics 77 (2014) 206–216 211
Fig. 9. (a) Upper crust velocity (6.5 km/s) shows the upper crust is not collapsed in the Western and in the middle of Alboran Sea. The depth of the layer is shown at top leftcorner of each map. Blue and red colors denote fast and slow velocities, respectively. (b) At the surface, high velocities (5.5–6.2 km/s) represent the cooling extrusion thatreaches the surface like in Nevado-Filabride, Ronda and Beni Bousera. (For interpretation of the references to color in this figure legend, the reader is referred to the webversion of the article.)
Fig. 10. Exhumed and cooling asthenospheric materiel at 15 km depth presented by a high velocity perturbation (7 km/s).
Fig. 11. Inflow of hot asthenospheric with low velocity (7 km/s) at 20 km depth after the lower crust part was removed.
Author's personal copy
212 Y. Timoulali et al. / Journal of Geodynamics 77 (2014) 206–216
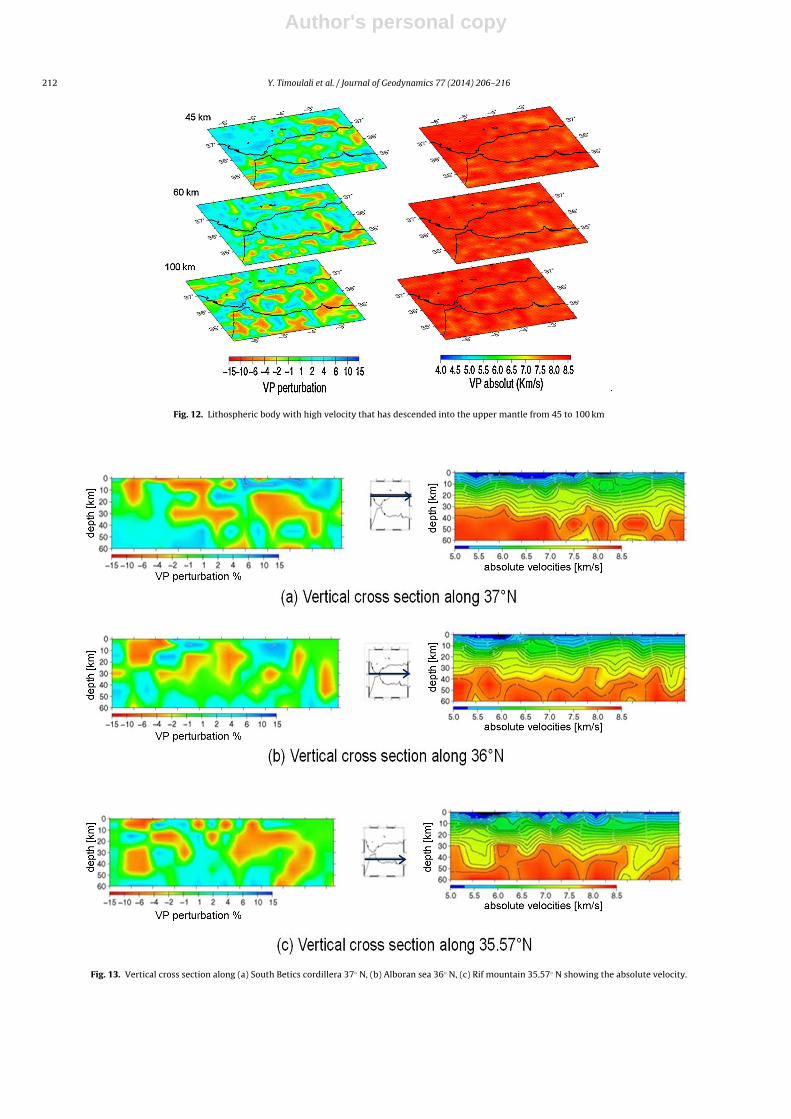
Fig. 12. Lithospheric body with high velocity that has descended into the upper mantle from 45 to 100 km
Fig. 13. Vertical cross section along (a) South Betics cordillera 37◦ N, (b) Alboran sea 36◦ N, (c) Rif mountain 35.57◦ N showing the absolute velocity.
Author's personal copy
Y. Timoulali et al. / Journal of Geodynamics 77 (2014) 206–216 213
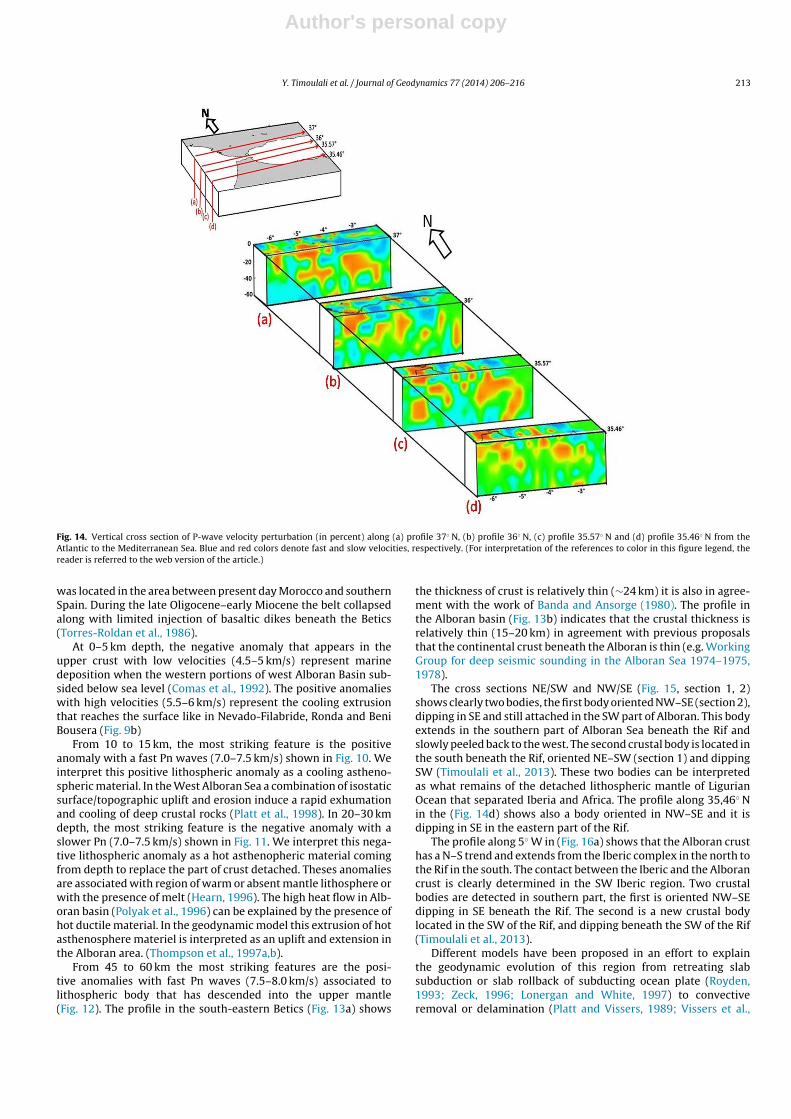
Fig. 14. Vertical cross section of P-wave velocity perturbation (in percent) along (a) profile 37◦ N, (b) profile 36◦ N, (c) profile 35.57◦ N and (d) profile 35.46◦ N from theAtlantic to the Mediterranean Sea. Blue and red colors denote fast and slow velocities, respectively. (For interpretation of the references to color in this figure legend, thereader is referred to the web version of the article.)
was located in the area between present day Morocco and southernSpain. During the late Oligocene–early Miocene the belt collapsedalong with limited injection of basaltic dikes beneath the Betics(Torres-Roldan et al., 1986).
At 0–5 km depth, the negative anomaly that appears in theupper crust with low velocities (4.5–5 km/s) represent marinedeposition when the western portions of west Alboran Basin sub-sided below sea level (Comas et al., 1992). The positive anomalieswith high velocities (5.5–6 km/s) represent the cooling extrusionthat reaches the surface like in Nevado-Filabride, Ronda and BeniBousera (Fig. 9b)
From 10 to 15 km, the most striking feature is the positiveanomaly with a fast Pn waves (7.0–7.5 km/s) shown in Fig. 10. Weinterpret this positive lithospheric anomaly as a cooling astheno-spheric material. In the West Alboran Sea a combination of isostaticsurface/topographic uplift and erosion induce a rapid exhumationand cooling of deep crustal rocks (Platt et al., 1998). In 20–30 kmdepth, the most striking feature is the negative anomaly with aslower Pn (7.0–7.5 km/s) shown in Fig. 11. We interpret this nega-tive lithospheric anomaly as a hot asthenopheric material comingfrom depth to replace the part of crust detached. Theses anomaliesare associated with region of warm or absent mantle lithosphere orwith the presence of melt (Hearn, 1996). The high heat flow in Alb-oran basin (Polyak et al., 1996) can be explained by the presence ofhot ductile material. In the geodynamic model this extrusion of hotasthenosphere materiel is interpreted as an uplift and extension inthe Alboran area. (Thompson et al., 1997a,b).
From 45 to 60 km the most striking features are the posi-tive anomalies with fast Pn waves (7.5–8.0 km/s) associated tolithospheric body that has descended into the upper mantle(Fig. 12). The profile in the south-eastern Betics (Fig. 13a) shows
the thickness of crust is relatively thin (∼24 km) it is also in agree-ment with the work of Banda and Ansorge (1980). The profile inthe Alboran basin (Fig. 13b) indicates that the crustal thickness isrelatively thin (15–20 km) in agreement with previous proposalsthat the continental crust beneath the Alboran is thin (e.g. WorkingGroup for deep seismic sounding in the Alboran Sea 1974–1975,1978).
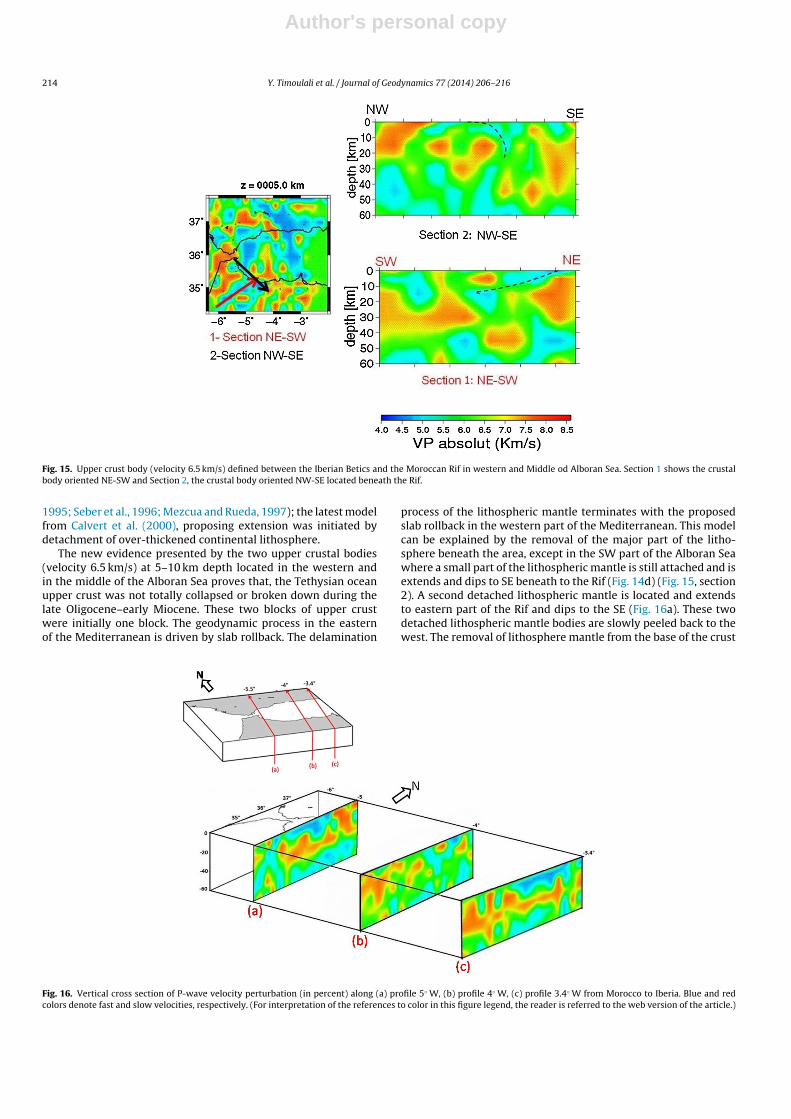
The cross sections NE/SW and NW/SE (Fig. 15, section 1, 2)shows clearly two bodies, the first body oriented NW–SE (section 2),dipping in SE and still attached in the SW part of Alboran. This bodyextends in the southern part of Alboran Sea beneath the Rif andslowly peeled back to the west. The second crustal body is located inthe south beneath the Rif, oriented NE–SW (section 1) and dippingSW (Timoulali et al., 2013). These two bodies can be interpretedas what remains of the detached lithospheric mantle of LigurianOcean that separated Iberia and Africa. The profile along 35,46◦ Nin the (Fig. 14d) shows also a body oriented in NW–SE and it isdipping in SE in the eastern part of the Rif.
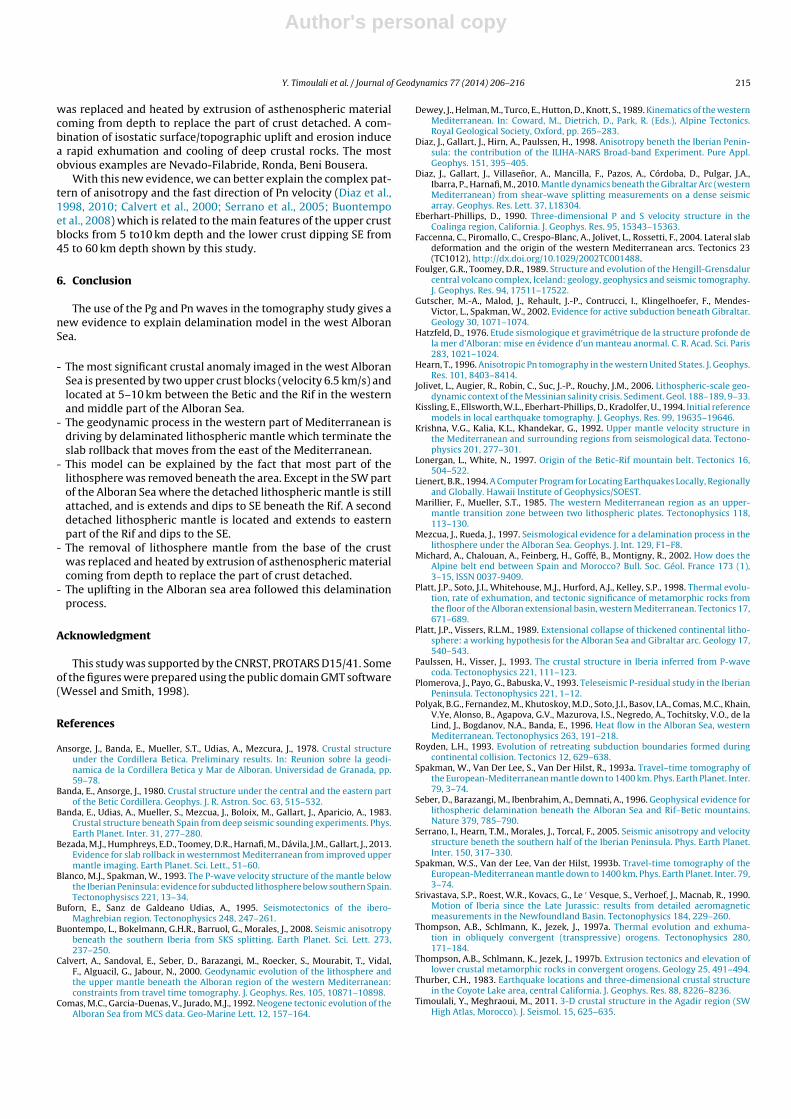
The profile along 5◦ W in (Fig. 16a) shows that the Alboran crusthas a N–S trend and extends from the Iberic complex in the north tothe Rif in the south. The contact between the Iberic and the Alborancrust is clearly determined in the SW Iberic region. Two crustalbodies are detected in southern part, the first is oriented NW–SEdipping in SE beneath the Rif. The second is a new crustal bodylocated in the SW of the Rif, and dipping beneath the SW of the Rif(Timoulali et al., 2013).
Different models have been proposed in an effort to explainthe geodynamic evolution of this region from retreating slabsubduction or slab rollback of subducting ocean plate (Royden,1993; Zeck, 1996; Lonergan and White, 1997) to convectiveremoval or delamination (Platt and Vissers, 1989; Vissers et al.,
Author's personal copy
214 Y. Timoulali et al. / Journal of Geodynamics 77 (2014) 206–216
Fig. 15. Upper crust body (velocity 6.5 km/s) defined between the Iberian Betics and the Moroccan Rif in western and Middle od Alboran Sea. Section 1 shows the crustalbody oriented NE-SW and Section 2, the crustal body oriented NW-SE located beneath the Rif.
1995; Seber et al., 1996; Mezcua and Rueda, 1997); the latest modelfrom Calvert et al. (2000), proposing extension was initiated bydetachment of over-thickened continental lithosphere.
The new evidence presented by the two upper crustal bodies(velocity 6.5 km/s) at 5–10 km depth located in the western andin the middle of the Alboran Sea proves that, the Tethysian oceanupper crust was not totally collapsed or broken down during thelate Oligocene–early Miocene. These two blocks of upper crustwere initially one block. The geodynamic process in the easternof the Mediterranean is driven by slab rollback. The delamination
process of the lithospheric mantle terminates with the proposedslab rollback in the western part of the Mediterranean. This modelcan be explained by the removal of the major part of the litho-sphere beneath the area, except in the SW part of the Alboran Seawhere a small part of the lithospheric mantle is still attached and isextends and dips to SE beneath to the Rif (Fig. 14d) (Fig. 15, section2). A second detached lithospheric mantle is located and extendsto eastern part of the Rif and dips to the SE (Fig. 16a). These twodetached lithospheric mantle bodies are slowly peeled back to thewest. The removal of lithosphere mantle from the base of the crust
Fig. 16. Vertical cross section of P-wave velocity perturbation (in percent) along (a) profile 5◦ W, (b) profile 4◦ W, (c) profile 3.4◦ W from Morocco to Iberia. Blue and redcolors denote fast and slow velocities, respectively. (For interpretation of the references to color in this figure legend, the reader is referred to the web version of the article.)
Author's personal copy
Y. Timoulali et al. / Journal of Geodynamics 77 (2014) 206–216 215
was replaced and heated by extrusion of asthenospheric materialcoming from depth to replace the part of crust detached. A com-bination of isostatic surface/topographic uplift and erosion inducea rapid exhumation and cooling of deep crustal rocks. The mostobvious examples are Nevado-Filabride, Ronda, Beni Bousera.
With this new evidence, we can better explain the complex pat-tern of anisotropy and the fast direction of Pn velocity (Diaz et al.,1998, 2010; Calvert et al., 2000; Serrano et al., 2005; Buontempoet al., 2008) which is related to the main features of the upper crustblocks from 5 to10 km depth and the lower crust dipping SE from45 to 60 km depth shown by this study.
6. Conclusion
The use of the Pg and Pn waves in the tomography study gives anew evidence to explain delamination model in the west AlboranSea.
- The most significant crustal anomaly imaged in the west AlboranSea is presented by two upper crust blocks (velocity 6.5 km/s) andlocated at 5–10 km between the Betic and the Rif in the westernand middle part of the Alboran Sea.
- The geodynamic process in the western part of Mediterranean isdriving by delaminated lithospheric mantle which terminate theslab rollback that moves from the east of the Mediterranean.
- This model can be explained by the fact that most part of thelithosphere was removed beneath the area. Except in the SW partof the Alboran Sea where the detached lithospheric mantle is stillattached, and is extends and dips to SE beneath the Rif. A seconddetached lithospheric mantle is located and extends to easternpart of the Rif and dips to the SE.
- The removal of lithosphere mantle from the base of the crustwas replaced and heated by extrusion of asthenospheric materialcoming from depth to replace the part of crust detached.
- The uplifting in the Alboran sea area followed this delaminationprocess.
Acknowledgment
This study was supported by the CNRST, PROTARS D15/41. Someof the figures were prepared using the public domain GMT software(Wessel and Smith, 1998).
References
Ansorge, J., Banda, E., Mueller, S.T., Udias, A., Mezcura, J., 1978. Crustal structureunder the Cordillera Betica. Preliminary results. In: Reunion sobre la geodi-namica de la Cordillera Betica y Mar de Alboran. Universidad de Granada, pp.59–78.
Banda, E., Ansorge, J., 1980. Crustal structure under the central and the eastern partof the Betic Cordillera. Geophys. J. R. Astron. Soc. 63, 515–532.
Banda, E., Udias, A., Mueller, S., Mezcua, J., Boloix, M., Gallart, J., Aparicio, A., 1983.Crustal structure beneath Spain from deep seismic sounding experiments. Phys.Earth Planet. Inter. 31, 277–280.
Bezada, M.J., Humphreys, E.D., Toomey, D.R., Harnafi, M., Dávila, J.M., Gallart, J., 2013.Evidence for slab rollback in westernmost Mediterranean from improved uppermantle imaging. Earth Planet. Sci. Lett., 51–60.
Blanco, M.J., Spakman, W., 1993. The P-wave velocity structure of the mantle belowthe Iberian Peninsula: evidence for subducted lithosphere below southern Spain.Tectonophysiscs 221, 13–34.
Buforn, E., Sanz de Galdeano Udias, A., 1995. Seismotectonics of the ibero-Maghrebian region. Tectonophysics 248, 247–261.
Buontempo, L., Bokelmann, G.H.R., Barruol, G., Morales, J., 2008. Seismic anisotropybeneath the southern Iberia from SKS splitting. Earth Planet. Sci. Lett. 273,237–250.
Calvert, A., Sandoval, E., Seber, D., Barazangi, M., Roecker, S., Mourabit, T., Vidal,F., Alguacil, G., Jabour, N., 2000. Geodynamic evolution of the lithosphere andthe upper mantle beneath the Alboran region of the western Mediterranean:constraints from travel time tomography. J. Geophys. Res. 105, 10871–10898.
Comas, M.C., Garcia-Duenas, V., Jurado, M.J., 1992. Neogene tectonic evolution of theAlboran Sea from MCS data. Geo-Marine Lett. 12, 157–164.
Dewey, J., Helman, M., Turco, E., Hutton, D., Knott, S., 1989. Kinematics of the westernMediterranean. In: Coward, M., Dietrich, D., Park, R. (Eds.), Alpine Tectonics.Royal Geological Society, Oxford, pp. 265–283.
Diaz, J., Gallart, J., Hirn, A., Paulssen, H., 1998. Anisotropy beneth the Iberian Penin-sula: the contribution of the ILIHA-NARS Broad-band Experiment. Pure Appl.Geophys. 151, 395–405.
Diaz, J., Gallart, J., Villasenor, A., Mancilla, F., Pazos, A., Córdoba, D., Pulgar, J.A.,Ibarra, P., Harnafi, M., 2010. Mantle dynamics beneath the Gibraltar Arc (westernMediterranean) from shear-wave splitting measurements on a dense seismicarray. Geophys. Res. Lett. 37, L18304.
Eberhart-Phillips, D., 1990. Three-dimensional P and S velocity structure in theCoalinga region, California. J. Geophys. Res. 95, 15343–15363.
Faccenna, C., Piromallo, C., Crespo-Blanc, A., Jolivet, L., Rossetti, F., 2004. Lateral slabdeformation and the origin of the western Mediterranean arcs. Tectonics 23(TC1012), http://dx.doi.org/10.1029/2002TC001488.
Foulger, G.R., Toomey, D.R., 1989. Structure and evolution of the Hengill-Grensdalurcentral volcano complex, Iceland: geology, geophysics and seismic tomography.J. Geophys. Res. 94, 17511–17522.
Gutscher, M.-A., Malod, J., Rehault, J.-P., Contrucci, I., Klingelhoefer, F., Mendes-Victor, L., Spakman, W., 2002. Evidence for active subduction beneath Gibraltar.Geology 30, 1071–1074.
Hatzfeld, D., 1976. Etude sismologique et gravimétrique de la structure profonde dela mer d’Alboran: mise en évidence d’un manteau anormal. C. R. Acad. Sci. Paris283, 1021–1024.
Hearn, T., 1996. Anisotropic Pn tomography in the western United States. J. Geophys.Res. 101, 8403–8414.
Jolivet, L., Augier, R., Robin, C., Suc, J.-P., Rouchy, J.M., 2006. Lithospheric-scale geo-dynamic context of the Messinian salinity crisis. Sediment. Geol. 188–189, 9–33.
Kissling, E., Ellsworth, W.L., Eberhart-Phillips, D., Kradolfer, U., 1994. Initial referencemodels in local earthquake tomography. J. Geophys. Res. 99, 19635–19646.
Krishna, V.G., Kalia, K.L., Khandekar, G., 1992. Upper mantle velocity structure inthe Mediterranean and surrounding regions from seismological data. Tectono-physics 201, 277–301.
Lonergan, L., White, N., 1997. Origin of the Betic-Rif mountain belt. Tectonics 16,504–522.
Lienert, B.R., 1994. A Computer Program for Locating Earthquakes Locally, Regionallyand Globally. Hawaii Institute of Geophysics/SOEST.
Marillier, F., Mueller, S.T., 1985. The western Mediterranean region as an upper-mantle transition zone between two lithospheric plates. Tectonophysics 118,113–130.
Mezcua, J., Rueda, J., 1997. Seismological evidence for a delamination process in thelithosphere under the Alboran Sea. Geophys. J. Int. 129, F1–F8.
Michard, A., Chalouan, A., Feinberg, H., Goffé, B., Montigny, R., 2002. How does theAlpine belt end between Spain and Morocco? Bull. Soc. Géol. France 173 (1),3–15, ISSN 0037-9409.
Platt, J.P., Soto, J.I., Whitehouse, M.J., Hurford, A.J., Kelley, S.P., 1998. Thermal evolu-tion, rate of exhumation, and tectonic significance of metamorphic rocks fromthe floor of the Alboran extensional basin, western Mediterranean. Tectonics 17,671–689.
Platt, J.P., Vissers, R.L.M., 1989. Extensional collapse of thickened continental litho-sphere: a working hypothesis for the Alboran Sea and Gibraltar arc. Geology 17,540–543.
Paulssen, H., Visser, J., 1993. The crustal structure in Iberia inferred from P-wavecoda. Tectonophysics 221, 111–123.
Plomerova, J., Payo, G., Babuska, V., 1993. Teleseismic P-residual study in the IberianPeninsula. Tectonophysics 221, 1–12.
Polyak, B.G., Fernandez, M., Khutoskoy, M.D., Soto, J.I., Basov, I.A., Comas, M.C., Khain,V.Ye, Alonso, B., Agapova, G.V., Mazurova, I.S., Negredo, A., Tochitsky, V.O., de laLind, J., Bogdanov, N.A., Banda, E., 1996. Heat flow in the Alboran Sea, westernMediterranean. Tectonophysics 263, 191–218.
Royden, L.H., 1993. Evolution of retreating subduction boundaries formed duringcontinental collision. Tectonics 12, 629–638.
Spakman, W., Van Der Lee, S., Van Der Hilst, R., 1993a. Travel–time tomography ofthe European-Mediterranean mantle down to 1400 km. Phys. Earth Planet. Inter.79, 3–74.
Seber, D., Barazangi, M., Ibenbrahim, A., Demnati, A., 1996. Geophysical evidence forlithospheric delamination beneath the Alboran Sea and Rif–Betic mountains.Nature 379, 785–790.
Serrano, I., Hearn, T.M., Morales, J., Torcal, F., 2005. Seismic anisotropy and velocitystructure beneth the southern half of the Iberian Peninsula. Phys. Earth Planet.Inter. 150, 317–330.
Spakman, W.S., Van der Lee, Van der Hilst, 1993b. Travel-time tomography of theEuropean-Mediterranean mantle down to 1400 km. Phys. Earth Planet. Inter. 79,3–74.
Srivastava, S.P., Roest, W.R., Kovacs, G., Le ′ Vesque, S., Verhoef, J., Macnab, R., 1990.Motion of Iberia since the Late Jurassic: results from detailed aeromagneticmeasurements in the Newfoundland Basin. Tectonophysics 184, 229–260.
Thompson, A.B., Schlmann, K., Jezek, J., 1997a. Thermal evolution and exhuma-tion in obliquely convergent (transpressive) orogens. Tectonophysics 280,171–184.
Thompson, A.B., Schlmann, K., Jezek, J., 1997b. Extrusion tectonics and elevation oflower crustal metamorphic rocks in convergent orogens. Geology 25, 491–494.
Thurber, C.H., 1983. Earthquake locations and three-dimensional crustal structurein the Coyote Lake area, central California. J. Geophys. Res. 88, 8226–8236.
Timoulali, Y., Meghraoui, M., 2011. 3-D crustal structure in the Agadir region (SWHigh Atlas, Morocco). J. Seismol. 15, 625–635.

Author's personal copy
216 Y. Timoulali et al. / Journal of Geodynamics 77 (2014) 206–216
Timoulali, Y., Hahou, Y., Jabour, N., Merrouch, R., El Kharrim, A., 2013. Main featuresof the deep structure by local earthquake tomography and active tecton-ics: case of Rif mountain (Morocco) and Betic Cordillera (Spain). J. Seismol.,http://dx.doi.org/10.1007/s10950-013-9385-0, Print ISSN 1383-4649.
Torné, M., Banda, E., 1992. Crustal thinning from the Betic Cordillera to Alboran Sea.Geo-Marine Lett. 12, 76–81.
Torres-Roldan, R.L., Poli, G., Pecerillo, A., 1986. An early Miocene arc-tholeiitic mag-matic dyke event from the Alboran Sea. Evidence for precollisional subductionand back-arc crustal extension in the westernmost Mediterranean. Geol. Rund-schau 75 (1), 219–234.
Um, J., Thurber, C., 1987. A fast algorithm for two-point seismic ray tracing. Bull.Seism. Soc. Am. 77, 972–986.
Vissers, R.L.M., Platt, J.P., van der Wal, D., 1995. Late orogenic extension of the BeticCordillera and the Alboran Domain: a lithospheric view. Tectonics 14, 786L 803.
Working Group for deep seismic sounding in Spain 1974–1975, 1977. Deep seismicsounding in the southern Spain. Pure Appl. Geophys. 115, 721–735.
Working Group for deep seismic sounding in the Alboran Sea 1974–1975, 1978.Crustal seismic profiles in the Alboran Sea—preliminary results. Pure Appl. Geo-phys. 116, 167–180.
Zhao, D., Negishi, H., 1998. The 1995 Kobe Earthquake: Seismic of the source zoneand its implication for the rupture nucleation. J. Geophys. Res. 103, 9967–9985.
Zhao, D., Wang, K., Rogers, G.C., Peacock, S.M., 2001. Tomographic image of lowP velocity anomalies above slab in northern Cascadia subduction zone. EarthPlanets Space 53, 285–293.
Zeck, H.P., 1996. Betic-Rif orogeny: subduction of mesozoic tethys under E-warddrifting Iberia, slab detachment shortly before 22 Ma and subsequent uplift andextensional tectonics. Tectonophysics 254, 1–16.
Zeck, H.P., 1999. Alpine plate kinematics in the western Mediterranean: a westwarddirected subduction regime followed by slab rollback and slab detachment. In:Durand, B., Jolivet, L., Horvath, F., Serrane, M. (Eds.), The Mediterranean Basins:Tertiary Extension Within the Alpine Orogen. Special Publication 156. The Geo-logical Society, London, pp. 109–120.