Sistemas de Navegación con menús desplegables: componentes y edición en línea
Upload
independentCategory
view
3download
0
JOURNAL OF GEOPHYSICAL RESEARCH, VOL. 104, NO. C2, PAGES 3109-3119, FEBRUARY 15, 1999
Tidal motions and tidally induced fluxes through La Linea submarine canyon, western Alboran Sea
Jesfis Garcia Lafuente, Tarek Sarhan, Manuel Vargas, Juan M. Vargas, and Francisco Plaza
Departamento de Fisica Aplicada II, Universidad de M•daga, M•laga, Spain
Abstract. Detailed observations from two mooring lines deployed in La Linea submarine canyon, western Alboran Sea, are presented. This is a narrow canyon in the sense that its width is always less than the internal radius of deformation. Tidal currents within the canyon are polarized in the along-canyon direction according to its narrow nature. They have considerable amplitude (values of around 0.5 ngs are often observed) and are forced by the internal pressure gradients associated with the baroclinic tide that is generated in the surroundings. Subsequent amplification of onshore baroclinic currents within the canyon accounts for the large amplitude observed. Cross-shelf exchange through the canyon due to tidal motions is different from zero despite the close to zero mean of tidal currents. The explanation is based on the asymmetry of water properties flowing up- canyon and down-canyon (some sort of tidal rectification). Regarding the energy flux, the canyon seems to be an adequate conduit to carry energy to the shore. Estimations made from our observations indicate that energy input onto the shelf per unit length parallel to the shore at the canyon head is enough to maintain mixing on the shelf at intermediate depths.
1. Introduction
Submarine canyons incised into many continental slopes represent topographic features of interest for studies of coastal circulation. They have the potential ability to modify flow and other oceanographic properties in their surroundings through topographic interaction [e.g., Freeland and Denman, 1982; Alvarez et al., 1996]. They also represent suitable conduits for continental shelf-slope exchange of a wide sort of properties, from energy to dissolved substances to sediments [Hotchkiss and Wunsch, 1982; Freeland and Denman, 1982; Hickey et al,. 1986; Gardner, 1989]. Such exchange has particular importance for sediment transport and that is why geologists were pioneers in studies on this subject. As experimental evidence on the modifications of coastal flow by submarine canyons was being gathered, the subject became of interest for theoretical studies and numerical modeling [Klinck, 1988, 1989, 1996; Chen and Allen, 1996].
The first and one of the best documented indications of this kind
of interaction was presented in the mentioned work by Freeland and Denman (1982). They observed a persistent pool of dense water in the shelf near Vancouver Island and showed that water in
the pool was dragged up from depths of more than 400 m from offshore, the canyon being the conduit for water motion. Their observations suggested that a geostrophically balanced left- bounded flow (flow with the coast on the left) was present. The pressure gradient was unbalanced inside the canyon and forced the flow up to the shelf. A key parameter for the resulting interaction between canyon topography and coastal flow is the ratio of canyon width (W) to the internal radius of deformation (Ri). Klinck [ 1988, 1989] showed that a canyon can be considered narrow when its
Copyfight 1999 by the American Geophysical Union.
Paper number 1998JC900039. 0148-0227/99/1998JC900039509.00
width is narrower than about half of the smaller Ri or the spatial scale of the flow. Cross-canyon geostrophic flow is then inhibited, while along-canyon ageostrophic motion caused by the unbalanced pressure gradients would create substantial cross-shelf exchange. On the contrary, wide canyons (compared to Ri or the scale of the flow) merely steer the flow around the bathymetry. In a subsequent paper, Klinck [1996] showed that the canyon effect is largely controlled by the direction of the along-shore flow, right-bounded flows leading to weak exchange and left-bounded ones creating upwelling and strong exchange in the Northern Hemisphere.
All of these studies deal with low-frequency (subinertial) motion. But, in narrow canyons, water motion along its axis is dominated by tidal currents [Shepard et al., 1979] which are not expected to contribute significantly to cross-shelf exchange due to their close to zero mean. They are, however, important for sediment transport because its intensity is enough to produce resuspension of sediments in the bottom layer that can be advected seaward [Hickey et al,. 1986; Gardner, 1989]. They are also significant for energy flux of internal tides that can be enhanced inside them. Hotchkiss and Wunsch, [1982] pointed out that this energy could be dissipated by mixing at the head of the canyon.
Baines [1983] presented results from a laboratory experiment reproducing tidal currents in narrow submarine canyons and showed that large-amplitude currents took place inside them. They were forced by horizontal pressure gradients existing on the shelf near the canyon head. The gradient was generated by the onshore propagating barotropic tide. His experiment did not allow for rotation so that geostrophic balance is meaningless. He concluded that the character of the flow was strongly dependent on the ratio of bottom slope (t0 to ray slope (2). When tr./2 •1 the motion inside the canyon was baroclinic and had the same pattern at all depths.
La Linea submarine canyon emerges at the shelf near the shoreline (see Figure 1). A more complete description follows in section 2. One of the objectives of the present study is to describe the tidal dynamics in their surroundings and to investigate the mechanism that drives the relatively large amplitude tidal currents
3109

3110 GARCIA LAFUENTE ET AL.' TIDAL MOTIONS THROUGH LA LiNEA SUBMARINE CANYON
36ø20 '
36ø10 '
La Linea S.C.
3 Guadiaro S.C.
Strait of, Gibraltar
r I '5ø20 ' -5ø10' -5ø00 '
Figure 1. Bathymetric map (depth in meters) of the area of study.
observed inside it. Another question addressed is whether or not the canyon is a suitable conduit for energy and other fluxes up to the shelf at tidal frequencies. The paper is organized as follows. Section 2 describes the geographic and oceanographic features of the area. Section 3 presents the experiment and data set. In section 4 we provide a picture of the internal tide in the area and discuss its influence on the tidal currents through the canyon. Section 5 analyzes the canyon as a conduit for matter and energy transport at tidal frequencies. Concluding remarks are presented in section 6.
2. Background
La Linea submarine canyon is located near the Strait of Gibraltar in the Alboran Sea, western Mediterranean Sea. A second canyon is not far from it (Figure 1). Both incise a shelf of about 6 km wide. The slope has a mean inclination of about 0.07 and extends downward until 1000 m, the typical depth of the Western Alboran Basin. In transverse profile La Linea submarine canyon is V shaped except at its head where a trapezoid section is more adequate. Its width is typically O(1 km) so that it is a narrow canyon for all of stratification conditions found in this area. This implies that flow above it will be decoupled from its dynamics or, in other words, the canyon will be invisible for slope flow. Shoreline is oriented to the north, while the Strait of Gibraltar, some 6 km apart, has its axis pointing at the east. Tidal dynamics in the surroundings of the canyon should be strongly correlated to tides in the Strait where they behave like a standing wave to first order [Garcia Lafuente et al., 1990; Candela et al., 1990; ,,tlberola et al., 1995].
The Jet of Atlantic Water flowing into the Mediterranean is the southern boundary of our study area. As it enters the Alboran Sea, it leaves a region of positive relative vorticity to its left, what favors upwelling at the center of the small cyclonic gyre that usually forms over there [Cano, 1978]. This is perhaps the most relevant oceanographic feature that has an influence upon the
density of the water column. Shelf circulation is mainly wind driven and since it has to be coupled to the local cyclonic circulation, it follows that easterlies have a tendency to enhance this circulation while westerlies, upwelling producing wind, have the opposite effect [Cano and Garcia Lafuente, 1992]. Previous studies of this area have shown the existence of noticeable baroclinic tides whose strength depends on stratification conditions [Garcia Lafuente and Cano, 1994]. In this last work an attempt was made by the authors to link subinertial variability of stratification and hence of the intensity of the baroclinic tide, to north-south excursions of the Jet which, at the same time, were caused by variations in the conditions of the baroclinic exchange through the Strait of Gibraltar.
3. Data
La Linea submarine canyon was occupied by two mooring lines with three currentmeters each during 12 days starting April 28, 1995. A six thermistor, 50 m long T chain was installed in the line closer to the shore. Figure 2 and Table 1 supply information of interest regarding the sampling strategy and length of the records. Problems that occurred during the field study reduced the information planned to be acquired to the lengths specified in Table 1.
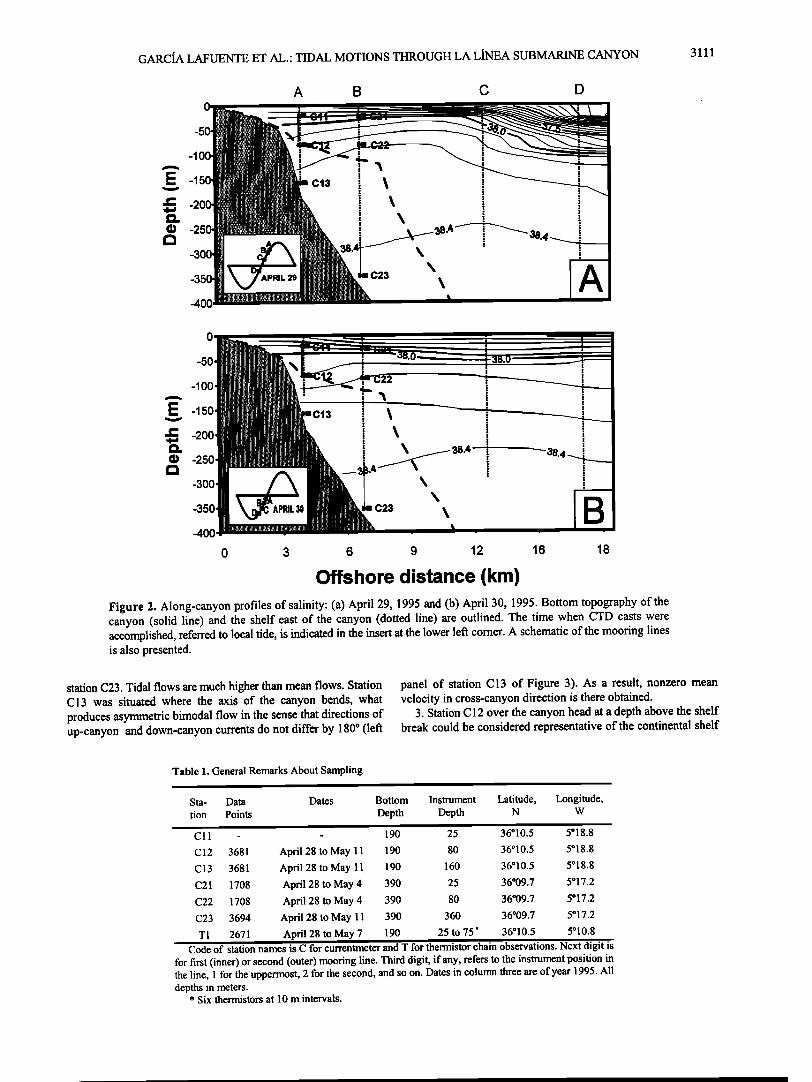
Figure 3 shows histograms of direction and scattering plots of current speed versus current direction for the five available records. They could be classified in three categories:
1. Stations C21 and C22 on the continental slope (see Figure 2) show rather unimodal histograms. On average, water flows toward the Strait of Gibraltar following the direction that isobaths would have if the submarine canyon was not formed. Tidal currents are strong enough to produce flow reversals during short periods of some tidal cycles, especially at station C21.
2. Stations C 13 and C23 within the trough of the canyon have bimodal regime with near-zero mean velocity, particularly in
GARDA LAFUENTE ET AL.' TIDAL MOTIONS THROUGH LA LiNEA SUBMARINE CANYON
-lOO,
-15o'1•ii
A B C D
3111
-50J J S,• -150 c13
"" ß \ 3s.4-i ss
-300
-400 .... • - ' • '
0 3 6 9 12 16 18
Offshore distance (km)
Figure 2. Along-canyon profiles of salinity: (a) April 29, 1995 and (b) April 30, 1995. Bottom topography of the canyon (solid line) and the shelf east of the canyon (dotted line) are outlined. The time when CTD casts were accomplished, referred to local tide, is indicated in the insert at the lower left corner. A schematic of the mooring lines is also presented.
station C23. Tidal flows are much higher than mean flows. Station C13 was situated where the axis of the canyon bends, what produces asymmetric bimodal flow in the sense that directions of up-canyon and down-canyon currents do not differ by 180 ø (left
panel of station C13 of Figure 3). As a result, nonzero mean velocity in cross-canyon direction is there obtained.
3. Station C12 over the canyon head at a depth above the shelf break could be considered representative of the continental shelf
Table 1. General Remarks About Sampling
Sta- Data Dates Bottom Instrument Latitude, Longitude, tion Points Depth Depth N W
Cll - - 190 25 36ø10.5 5ø18.8
C12 3681 April 28 to May 11 190 80 36ø10.5 5ø18.8 C13 3681 April 28 to May 11 190 160 36ø10.5 5ø18.8 C21 1708 April 28 to May 4 390 25 36ø09.7 5ø17.2 C22 1708 April 28 to May 4 390 80 36ø09.7 5ø17.2 C23 3694 April 28 to May 11 390 360 36ø09.7 5ø17.2 T1 2671 April 28 to May 7 190 25 to 75' 36ø10.5 5ø10.8
Code of station names is C for currentmeter and T for thermistor chain observations. Next digit is for first (inner) or second (outer) mooring line. Third digit, if any, refers to the instrument position in the line, 1 for the uppermost, 2 for the second, and so on. Dates in column three are of year 1995. All depths in meters.
* Six thermistors at 10 m intervals.
3112 GARCIA LAFUENTE ET AL.' TIDAL MOTIONS THROUGH LA LINEA SUBMARINE CANYON
C21
7
0 180 360
C22
ß ,
0 180 360
C13
Q=1.3 d=222
0 180 360
C23
d=254
0 180 360
Q=1.6 d=94
C12 0 180 360
8O
6O
40
20,
0
60
20,
0
60
40
20
0
60
20
0
60
40
20
0 0 180 360
Figure 3. Histograms of current direction (left panels) and scattering plots of current speed versus current direction (right panels) for the five currentmeters. Values on top of histograms are mean current. Speed is in cm s 'l, and direction, referred to the east and increasing clockwise, is in degrees.
regime in this area. We rather think that velocities there are influenced by local topography since it is over the rim of the canyon at its head. Neither a mean flow nor a tidal regime prevails and, in general, current speeds are appreciably lower than at any other station.
Two conductivity-temperature-depth (CTD) transects were made on April 29 and 30 to calibrate instruments and to get some insight on the hydrological conditions. Salinity profiles of both transects are presented in Figures 2a and 2b, along with the locations of CTD casts and the time of the tidal cycle when they were accomplished (lower insert). A comparison of both figures shows that important variations can take place farther off shore just
in one day. They cannot be explained by tidal advection as both transects were carried out under similar tidal conditions. Despite these offshore short time variations (obviously linked to the Strait of Gibraltar dynamics), isohalines at intermediate depths shape like domes both days near station B. This is consistent with the cyclonic circulation mentioned in the previous section. It can be argued that this shape can be modified during the tidal cycle but, on average, it has been a permanent feature during the experiment, as suggested by Figure 4 that presents the low-frequency velocity fields at C21 and C22, always directed toward the Strait (see also numeric values of C21 and C22 panels in Figure 3). Geostrophic balance would be responsible for such shape (isohalines and isopycnals look alike). We have remarked on this feature because it could be related to tidal mixing in the shelf and slope near the shelf break, as we discuss later.
4. Internal Tide Description
4.1. Horizontal Currents
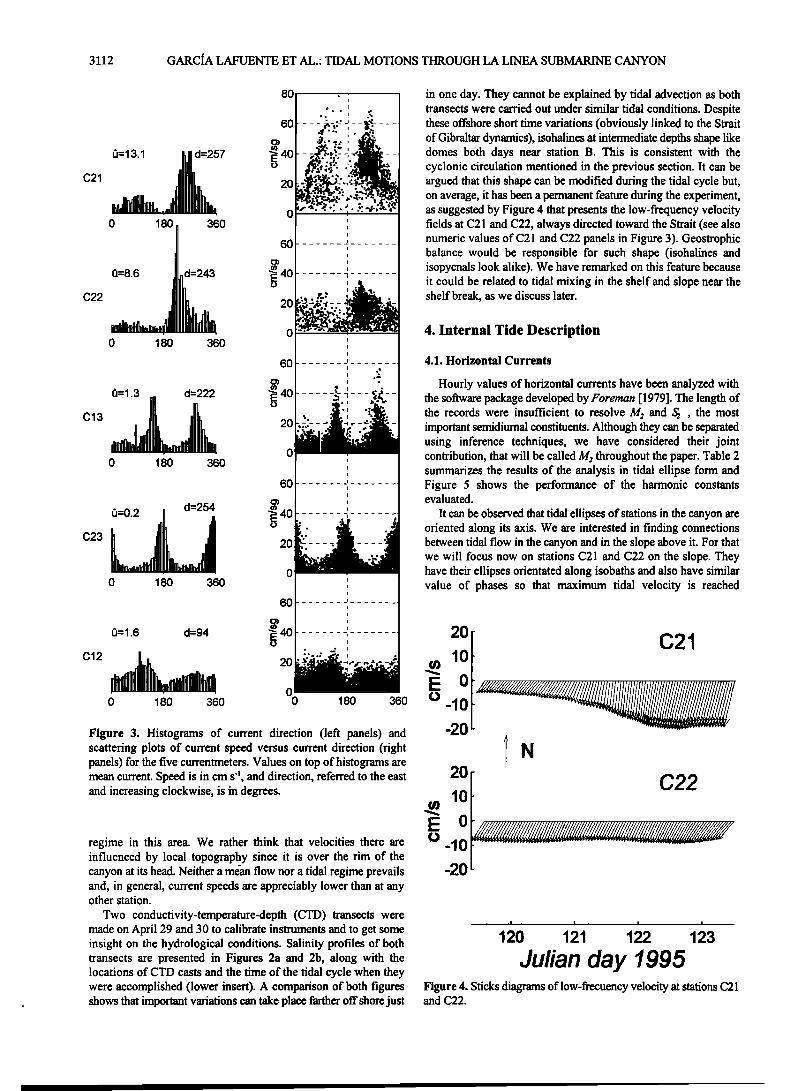
Hourly values of horizontal currents have been analyzed with the software package developed by Foreman [1979]. The length of the records were insufficient to resolve M2 and S2 , the most important semidiurnal constituents. Although they can be separated using inference techniques, we have considered their joint contribution, that will be called M2 throughout the paper. Table 2 summarizes the results of the analysis in tidal ellipse form and Figure 5 shows the performance of the harmonic constants evaluated.
It can be observed that tidal ellipses of stations in the canyon are oriented along its axis. We are interested in finding connections between tidal flow in the canyon and in the slope above it. For that we will focus now on stations C21 and C22 on the slope. They have their ellipses orientated along isobaths and also have similar value of phases so that maximum tidal velocity is reached
20
10
0
-10
-20
20
10
0
-10
-20
C21
C22
120 121 122 123
Julian day !995 Figure 4. Sticks diagrams of low-frecuency velocity at stations C21 and C22.
GARCIA LAFUENTE ET AL.' TIDAL MOTIONS THROUGH LA LJNEA SUBMARINE CANYON 3113
Table 2. Harmonic Constants for M2 Horizontal Tidal Currents
Station D.P. A a 0 ½ Rotation
C12 306 3.9 0.2 90 120 A
C13 306 5.1 1.5 137 188 C
C21 140 27.2 12.1 73 118 C
'C22 140 12.0 3.3 50 113 A
C23 305 10.4 0.1 174 194 C
C2-B 140 14.6 1.2 62 116 C
C21-b 140 12.3 8.9 122 74 C
C22-b 140 5.3 3.8 122 254 C
Second column is the number of hourly data included in the analysis. A and a are the major and minor semiaxis in cm s 'l, respectively, 19 is the ellipse orientation (0 to the east), and {0 is the phase, both in degrees. Last column is the rotation sense, C for clockwise; A, for anticlockwise. Last three rows give harmonic constants for barotropic (C2-B) and baroclinic part of the tide at site C2.
simultaneously at both levels. An obvious reference for tidal currents on the slope is the Strait of Gibraltar. Candela et al. [1990], gave harmonic constants for M2 in different locations within the Strait showing the strong barotropic behavior of tidal flow at the sill section, that of minimum cross area. They obtained phases of around 140 ø at all depths. Semidiurnal sea level oscillation has a standing wave pattern [Garcia Lafuente et al., 1990] with phase close to 50 ø. Thus current phases around 140 ø are associated to the barotropic tide. The conclusion would be that tidal currents behave rather barotropically at stations C21 and C22. However, the rotation sense of ellipses is opposite at both stations, which implies that maximum shoreward tidal flow at the first station coincides with maximum seaward flow at the other and vice
versa. Moreover, minor semiaxis have certain importance. Both facts point at the existence of a non negligible baroclinic tide.
To analyze it, the observed currents have been separated out in barotropic and baroclinic parts by means of depth averaging. Observations inside the canyon (stations C13 and C23) have not been included in the average because of the strong influence of the topography on them. For this reason, the analysis is restricted to stations C21 and C22 at site C2. Depth-averaged current has been identified with the barotropic part (same for both stations) and the remaining at each station with the baroclinic part. A weighted average with weights 0.3 and 0.7 for C21 and C22, respectively, has been done, what is equivalent to consider a two-layer sea of h•=35 m and h2=85 m for upper and lower layers. Thus we have considered a total thickness of 120 m, the depth of the canyon rim at site C2. The choice of 35 and 85 m is inspired in the salinity distribution of Figure 2b which shows how S=38 is a local level "surface" at C2 (CTD station B) and isohalines have different curvatures above and below it. This method to separate out both parts is fully equivalent to that of Leblond and Mysak [1978, pp. 134-137] for normal modes in a two-layer sea. Strictly speaking, a two-layer approximation is not correct in our area, but we argue that the internal tide is likely dominated by the first internal mode, thus allowing the application of the results from the model to our actual sea.
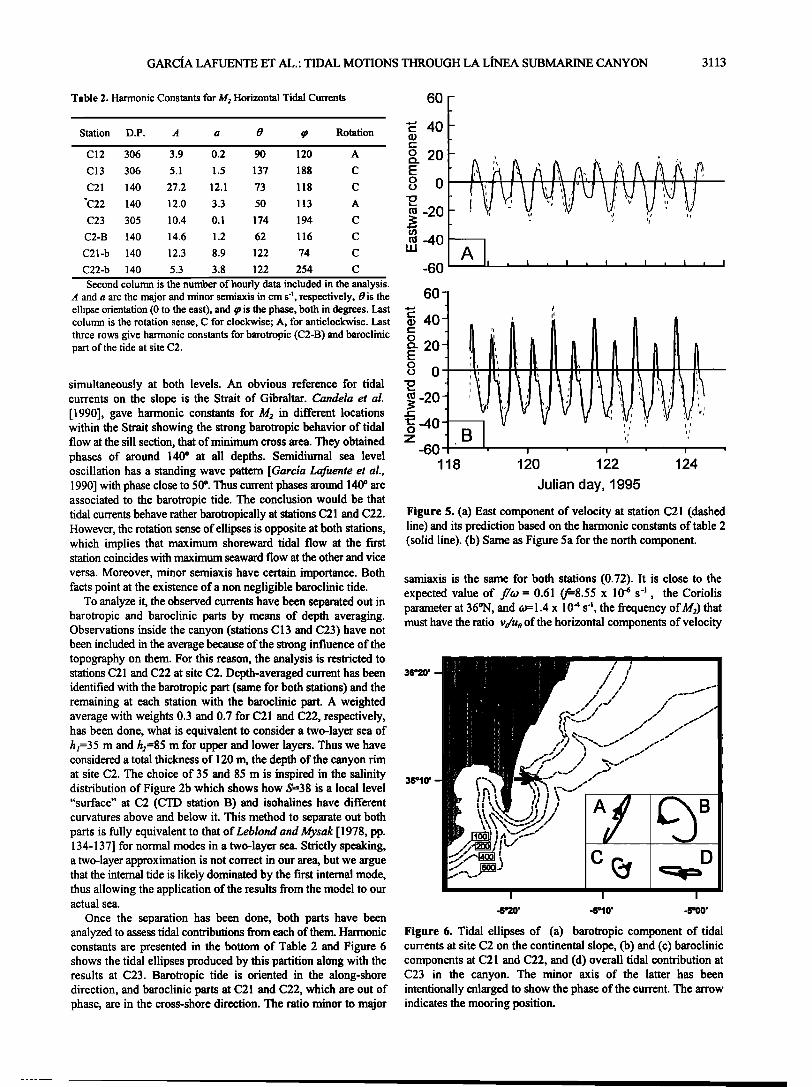
Once the separation has been done, both parts have been analyzed to assess tidal contributions from each of them. Harmonic constants are presented in the bottom of Table 2 and Figure 6 shows the tidal ellipses produced by this partition along with the results at C23. Barotropic tide is oriented in the along-shore direction, and baroclinic parts at C21 and C22, which are out of phase, are in the cross-shore direction. The ratio minor to major
-6O
60-
-60 ' . , . , . 118 120 122
Julian day, 1995
! -
124
Figure 5. (a) East component of velocity at station C21 (dashed line) and its prediction based on the harmonic constants of table 2 (solid line). (b) Same as Figure 5a for the north component.
samiaxis is the same for both stations (0.72). It is close to the expected value of f/w = 0.61 (f-=8.55 x 10 '• s 'l , the Coriolis parameter at 36øN, and o= 1.4 x 10⁴ s 'l, the frequency of M2) that must have the ratio Vo/Uo of the horizontal components of velocity
, ,
ii'½jJ'!JJ,JjiJii 36ø20' ijjj½l liSJ lJili$iJlJJll•jliljJJ•JJt]JJJl•!JJ!Jii'•lJ?/ /il!,j.,lj•jifl½iij,'ijj!tlll•Jj•i!•Jii!!ilJi•!•!l!ljjjl!!j!!lli•iJiill•jj} ' ./ / .- ..... .
...41 i,,.,,j: •,. ij.l• !i ilii,' •. ,. , ' , / .... •'•!'J ,i't•,, ,•.•j.,,iJ, -. , , . i:i.,l:jjJ,' '.145111 ilj,,...ji • '•iii,, i,lil,, , \k e. -." / ,½..',,,ll,.,,l;•'JiJ4'j"':" •I•' i:,'.,.•,•"/•'lJ,Jll ,,,,,,l,l,,,il"[ .-. . . lJ:::iljjJ, ':;•.l,:; .i:l.lii¾lJ."ljj:.!½• r' :jljJlj'! J j!.:ili"4i, •. ß ,' .-. , .-- jljJlJjJ e':" !ii -.i.j'"•jjjil' •"' / // ß illj i' ' '":i½ ! /" - ""
•1• I I I jh, lJl I I I
, ;'"i" "i:ij'•
IF
, , ", .8ø20 ' .6ø10 ' .5ø00 '
Figure 6. Tidal ellipses of (a) barotropic component of tidal currents at site C2 on the continental slope, (b) and (c) baroclinic components at C21 and C22, and (d) overall tidal contribution at C23 in the canyon. The minor axis of the latter has been intentionally enlarged to show the phase of the current. The arrow indicates the mooring position.

3114 GARCIA LAFUENTE ET AL.' TIDAL MOTIONS THROUGH LA LiNEA SUBMARINE CANYON
Table 3a. 34, Harmonic Constants for Some Internal Surfaces Table 3b. M2 Harmonic Constants for Vertical Velocity
Station D.P. A (p Station D.P. Wo •o Wo/tO
T13.5 (94) 223 12.1 283 W65 223 0.21 203 14.9
T13.7 (82) 223 9.7 277 W55 223 0.16 199 11.4
T14.0 (69) 223 7.6 239 W45 223 0.12 203 8.5
T14.5 (55) 223 7.0 257 The name of the station includes the depth (meters) of the estimation. Amplitudes (third column) are in cm s '•, and phases (fourth column) are in degrees. Last column is the theoretical amplitude of internal oscillations (meters) for the vertical velocity amplitude shown in column three.
Mean depths (meters) are inside parentheses. Second column gives the number of data points included in the analysis. Third column is amplitude (meters), and fourth column is phase (degrees).
for a wave that propagates in the direction given by the major semiaxis [Leblond and Mysak, 1978, pp. 143-146]. This result provides theoretical support to our separation. It is worthy to note that tidal current in C23 within the canyon is phase locked with the baroclinic tide at C22 (see Figure 6), suggesting that this part of the tide drives the tidal current along the canyon.
4.2. Internal Oscillations and Vertical Velocities
Temperature measurements have been used to estimate internal oscillations of isothermal surfaces. Figure 7 shows the vertical motion of some selected isotherms. Most of the experiment was made under moderate to strong easterlies that induced downwelling by Ekman shoreward transport and warmed up the water, as reflected in Figure 7. Isotherms can be identified with material surfaces if diffusion and horizontal advection of temperature are ignored. For semidiurnal tidal frequencies this is justified on the basis that tidal oscillations have a time scale shorter than that of
eddy diffusion. The last assumption is supported by the fact that tidal velocities are important in the along-shore direction and temperature gradients set up cross shore due to geostrophy. In the presence of onshore baroclinic tide, however, this assumption is not so well supported as the former. As a first approach and for semidiurnal frequencies, we have considered isotherms as material surfaces allowing the estimates of intemal vertical oscillations from temperature oscillations. This approach is not adequate for low- frequency variability, which is mainly due to vertical mixing and horizontal advection.
Hourly values of isothermal depths were then analyzed to obtain harmonic constants. Table 3a shows them for four isotherms whose
mean depths are inside brackets. Due to its progressive deepening, the concept "mean depth" is ambiguous as it changes with time. Internal semidiurnal oscillations would apparently remain unaffected by this low-frequency trend. They are, however, sensitive to water warming since stratification has an influence on
ø I ..--.. -40 E• -80
• -120
ß -160
•-200 , i.., I , i • i 118 120 122 124 126 128 130
Julian day, 1995
Figure 7. Oscillation of internal surfaces deduced from temperature measurements of the thermistor chain and instruments C12 and
C13. Internal surfaces have been identified with isotherms.
the amplitude of internal oscillations. Phase values must be much less sensitive to the change.
Vertical velocities have been evaluated assuming balance between local changes and vertical advection as discussed above,
that is, OT/Ot w=- (1)
where T and T•f are instantaneous and low-frequency temperatures. We use T•œ instead of T in the vertical gradient term following Brickman and Loder [1993]. This is advisable to avoid unrealistic large values of w that could arise when stratification is weak, a not unusual situation during parts of tidal cycles. Numerical computations were made using a centered finite difference scheme for both time and depth. Hourly values were then analyzed to obtain the harmonic constants presented in Table 3b. Since w=d•/dt, a phase lock of 90 ø between vertical velocity and internal oscillation is expected, the latter lagging the former. Their amplitudes must verify Ao=Wo/O, where o is the frequency of M2, and Ao and Wo are the amplitudes of internal oscillation and vertical velocity, respectively. Although there is a tendency to behave this way, neither of them are fully achieved (compare fourth row of Table 3a and second row of Table 3b, both showing values at 55 m depth). The lack of agreement can be due to the weakness of nonhorizontal advection assumption that could overestimate w by a factor of 2, as pointed out by Brickman and Loder [1993]. Taking this fact into account, we can consider the agreement as satisfactory and assume that at intermediate depths and at site C 1 the amplitude of internal oscillation is typically 10 m and that of vertical velocity is 0.15 cm s -•. These values are modulated by the spring-neap tidal cycle and stratification conditions.
4.3. Onshore Baroclinic Tide
We have shown the existence of a baroclinic tide. Now we want
to gather the results from these sections in order to depict the internal motions in the onshore direction, the important one for baroclinic tide and tidal motions along the canyon. Velocity vectors have been decomposed into along-shore (62 ø of east, the orientation of the barotropic tide at mooring C2) and onshore components. All series have been cut to match the length of C21 and C22. This is advisable to do because the intermittence of
internal tide signal can obscure relationships between different variables sampled during nonsimultaneous periods. Tidal analysis was then performed, and the results are presented in Table 4 for some variables of interest. Phases have been referred to local high tide (50 ø from moon transit by Greenwich meridian).
An interpretation of these results is made in Figure 8. Figure 8a sketches a two-layer sea with the interface somewhere between stations C21 and C22. For a shoreward progressive internal wave of frequency to, all variables change as real(e -•(•-•ø)) where (p is the phase of a given variable referred to some common origin.

GARCIA LAFUENTE ET AL.' TIDAL MOTIONS THROUGH LA L•qEA SUBMARINE CANYON 3115
Table 4. Harmonic Constants for Different Variables Obtained ThroughTime Series Which Were Cut to Match the Length of C21 and C22 (142 Hourly Data)
U21 U22 V21 V22 V23 V12 V13 T21 T11 W65 Z65
A 26.7 11.5 12.2 4.3 16.1 3.3 7.2 0.232 0.283 0.31 12.6
•o 111 107 34 239 204 149 195 65 96 177 248 U and V stand for alongshore (62 ø of east) and onshore components of velocity, respectively, T stands for temperature.
Numeric code is the same as in Table 1. W65 and Z65 are vertical velocity and internal oscillation, respectively, at 65 m depth in site C 1. Amplitude for velocities are all given in cm s '•. Amplitude for temperature is in degrees Celsius. Amplitude for internal oscillation is in meters. Phase values are referred to local high tide.
Theoretically, onshore velocities at C21 and C22 would be out of phase, vertical displacement will be phase locked with onshore velocity at C22 and vertical velocity will lag them by 270 ø (or lead them by 90ø). This is represented in the phasor diagram of Figure 8b where phasors rotate counterclockwise with time (real parts are the projections on the horizontal axis). Phases have been referred to maximum shoreward velocity at station C22. Figure 8c shows, in full line, the phasor diagram made up from values of Table 4 (239 ø have been subtracted to all variables to assign 0 ø to V22). Phases of "interface" displacement and vertical velocity correspond to site C1, while Figure 8c ought to show them at C2, 3 km further on. A phase correction has to be made to compensate for shoreward propagation. The amount to be subtracted depends on the internal wave speed. For long gravity waves in a two-layer sea the dispersion relation for the internal mode is given by [Leblond and Mysak, 1978, p. 147]
c1 c2
T21
2
C13
C22
% %
%
% C23
V21
W
V22
W65' W65
Z65' ,-- V22
Z65 V21
Figure 8. (a) Schematic of a two-layer sea in which an internal wave propagates to the shore. Positions of currentmeter stations are shown. Solid and dotted lines represent across-shore bottom topography inside and east of the canyon respectively. (b) Theoretical diagram of phasors for some variables of interest. (c) Values deduced from our data: W65 and Z65 correspond to phasors at site C 1 at 65 m depth. W65' and Z65' are obtained from W65 and Z65 after correction for onshore propagation (see text for details and table 4 for variables identification).
• 2=g kh 2 +fz (2) h,
where hi, i=1,2 is the depth of the ith layer, g' is the reduced gravity (g'=g(/Ip)/p, lip is the density contrast between layers, and /9 is the mean density) and kh is the horizontal wavenumber. For c_o2> >f 2 and h2>>h/, (2) gives the well known formula for phase speed
c=••-•h•g (3) From at profile in Figure 9a we take Ap=l.3 kg m'3• h =35 m, ,o=1028 kg m '3. The result is c=0.66 m s -• . Sites C1 and C2 are 2800 m apart, so that a phase difference of 34 ø (Aq•=cosaAy/c) would exist for a given variable measured at both locations, the phase at C2 being smaller than at C1 if the wave propagates shoreward. This value is similar to the 31 ø phase difference between temperature signals at T11 (mooring 1) and T21 (mooring 2, same level) shown in Table 4. Tidal fluctuations of temperature are related to oscillations of internal surfaces if horizontal
advection and diffusion are neglected. In this case the phase difference is just due to the propagation of the internal tide. Its numerical value gives support to our estimation of c which has been used to correct phases of W65 and Z65. Once this correction is made, the dotted phasors W65' and Z65' in Figure 8c are
-5O
-lOO
..c::: -15o
"0 -200
-250
r'• , , ,, ''''1'''' 0 '. .I ' I ' ! '
' )0
5O i
)o
5o
-3oo '•, ' .... ' ....... )o 27,5 28,0 28,5 29,0 29,5 0,00 0,02 0,04 0,06 0,08
Sigma-t )k Figure 9. (a) Sigma-t profile at hydrographic station "C" on April 30. (b) Ray slope, 2, evaluated through (4). Density profile of Figure 9a has been used to evaluate the buoyancy frequency N. Dotted lines are mean inclination of the shelf (a=0.017) and slope (a'=0.066). Note that a=2 at around 210 m.

3116 GARCIA LAFUENTE ET AL.: TIDAL MOTIONS THROUGH LA LtNEA SUBMARINE CANYON
obtained. The new pattem compares satisfactorily to the theoretical one in Figure 8b.
The model depicted above relays on the hypothesis that the internal wave progresses toward the shore from site C2. This implicitly assumes that it is generated seaward of C2. One familiar approach to internal tide propagation comes out from ray theory [e.g., Pingree and New, 1989; New and Pingree, 1990; Holloway, 1996]. In this theory the most suitable place for internal tide generation is where bathymetry is at critical slope. That is, when bottom slope a matches the slope of the characteristics, the path along which intemal energy propagates [Baines, 1982], which are given by
•.2 co 2-f• - (4) N 2 -Co 2
where N is the buoyancy frequency. An estimation of ,/can be made using profiles of a t. Figure 9b shows the value of/Z for the stratification shown in Figure 9a. Around 2=210 m, the condition tr =/Z is fulfilled. The 210 m isobath would be seaward of C2 if the
canyon was not there. A narrow canyon like this is invisible for the slope dynamics, and its presence cannot shift significantly the generation place that will still be seaward of both mooring lines. From there, two disturbances will propagate in opposite directions. The one progressing shoreward will eventually be detected by our instruments.
In this simple two-layer model, stations within the canyon are in the "lower layer", and phases of their onshore components of velocity are similar to that of station C22, as must be. These in- phase currents will be driven by the baroclinic pressure gradients of the internal tide and enhanced within the canyon due to topographic constrictions. The mechanism would be similar to that one discussed by Baines [1983]. But he considered the barotropic tide propagating to the shore as the forcing mechanism. His model reproduces tidal dynamics in places where isobaths are perpendicular to the direction of tidal wave propagation, like Armorican shelf in Biscay Bay, where important internal tides have been reported [Pingtee and New, 1989]. In our case the largest tidal velocities are not cross shore, as corresponds to a barotropic tide progressing shoreward, but along shore. The small cross-shore barotropic component of the velocity does not seem large enough to produce the observed baroclinic tide. Not at least in the frame of lineal models. A feed-back mechanism triggered by the submarine canyon must not be discarded. Once the baroclinic pressure gradients are produced, tidal amplification within the canyon could be explained by the model of Baines [ 1983] for the case
5. Transport Along the Canyon
5.1. Salinity Transport An important question is whether the canyon is a suitable
conduit for salt transport onto the shelf driven by tidal motions. We evaluate the tidally averaged along-canyon salt transport due to tidal motion according to
F-s=•fPo(SUl)dt o
(5)
where r is the tidal period, Po is a mean density included to obtain the salt flux in terms of mass of salt per unit surface and time, u• is the along-canyon component of tidal velocity, and s is the salinity perturbation associated to tidal motion. In this equation, u• and s are the demodulated signals of U• and S (the observations) at/14 frequency. Positive F s values mean salt flux to the shore (onto the
ß 7 1
-2
-3
-3
1•0 1•'2 ' 1;•4 1•6 1•8 130 Julian day, 1995
Figure 10. Salinity flux due to tidal motion at C13 (solid line) and C23 (dotted line) evaluated with (5). There is a remarkable tendency to be positive, that is, to the shore.
shelf). Figure 10 shows the results for C13 and C23. A clear tendency for persistent, although low, positive flux is observed, in particular at C 13. In this station, the flux of salt can be explained by the fact that water flowing up canyon is saltier than that flowing down (respective means are 38.16 and 38.12). Salinity flux in C23 would be necessarily related to the asymmetry of along-canyon tidal currents, since water passing by this station have the same salinity regardless of the direction it moves.
5.2. Energy Flux and Mixing
The previous section suggests that mixing takes place on the shelf, shoreward, or in the surroundings of site C1. An interesting subject to investigate is whether or not the energy flux associated with the tide passes by this site toward the shelf and, if so, how much it contributes to the mixing. Tidally averaged along-canyon energy flux is evaluated similarly to (5)
F-•:•k /Uldt o
(6)
where p' is the internal (baroclinic) tidal contribution to the total pressure field, and the remainder symbols are as given before. For sinusoidal dependence in time (e'7'•), the linearized equations of motion relate pressure and vertical velocity by
0
: po(CO+--)dz -Jf0½) (7a)
where Wo is the vertical velocity. Since co<<N, this equation can be approximated by its hydrostatic version
0
(7b)
where ,,9' is the perturbation density associated with the baroclinic tide. Any of them could be used to estimate p' if p(z) was known, since p'(z) is defined as p'(z)=p(z)-p•z),p•z) being the slowly varying part (tide free) of the density field.
Temperature observations from instruments C12, C13, and the thermistor chain give an acceptable representation of T(z) at site C1 and were used to estimate p(z). To do it, a linear dependence of the form
p:Cr+• (8)
GARCIA LAFUENTE ET AL.: TIDAL MOTIONS THROUGH LA LiNEA SUBMARINE CANYON , 3117
E
1029,0 -
1028.5 -
1028.0
1027.5
1027.0 -
1026.5 -
1029.0
1028.5
1028.0
1027.5
ß
," 1027.0
ß
ß
ß% I I
ii
ß ß
ß
= -0.32
'•'?-: .."- •..C. = -0.85
Temperature.
ß
ß
ww •
C= -0.71
13.0 13.5 14.0 14.5 15.0 15.5 16.0 16.5 17.0
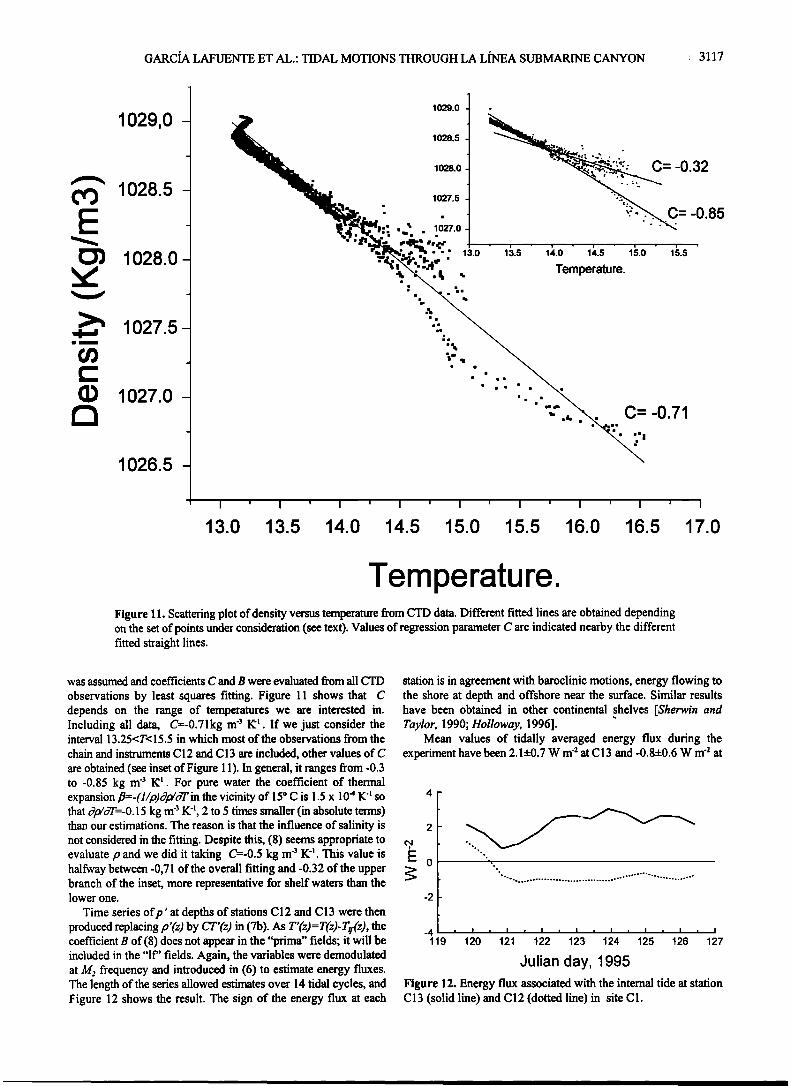
Temperature. Figure 11. Scattering plot of density versus temperature from CTD data. Different fitted lines are obtained depending on the set of points under consideration (see text). Values of regression parameter C are indicated nearby the different fitted straight lines.
was assumed and coefficients C and B were evaluated from all CTD
observations by least squares fitting. Figure 11 shows that C depends on the range of temperatures we are interested in. Including all data, C=-0.71kg rn '3 I• • . If we just consider the interval 13.25<T<15.5 in which most of the observations from the
chain and instruments C12 and C13 are included, other values of C are obtained (see inset of Figure 11). In general, it ranges from -0.3 to -0.85 kg m '3 I• • . For pure water the coefficient of thermal expansion fl=-(1/p)O,o/o•in the vicinity of 15 ø C is 1.5 x 10 .4 K '• so that c•,o/c7/'=-0.15 kg rn '• K '•, 2 to 5 times smaller (in absolute terms) than our estimations. The reason is that the influence of salinity is not considered in the fitting. Despite this, (8) seems appropriate to evaluate p and we did it taking C=-0.5 kg m '• K '•. This value is halfway between -0,71 of the overall fitting and -0.32 of the upper branch of the inset, more representative for shelf waters than the lower one.
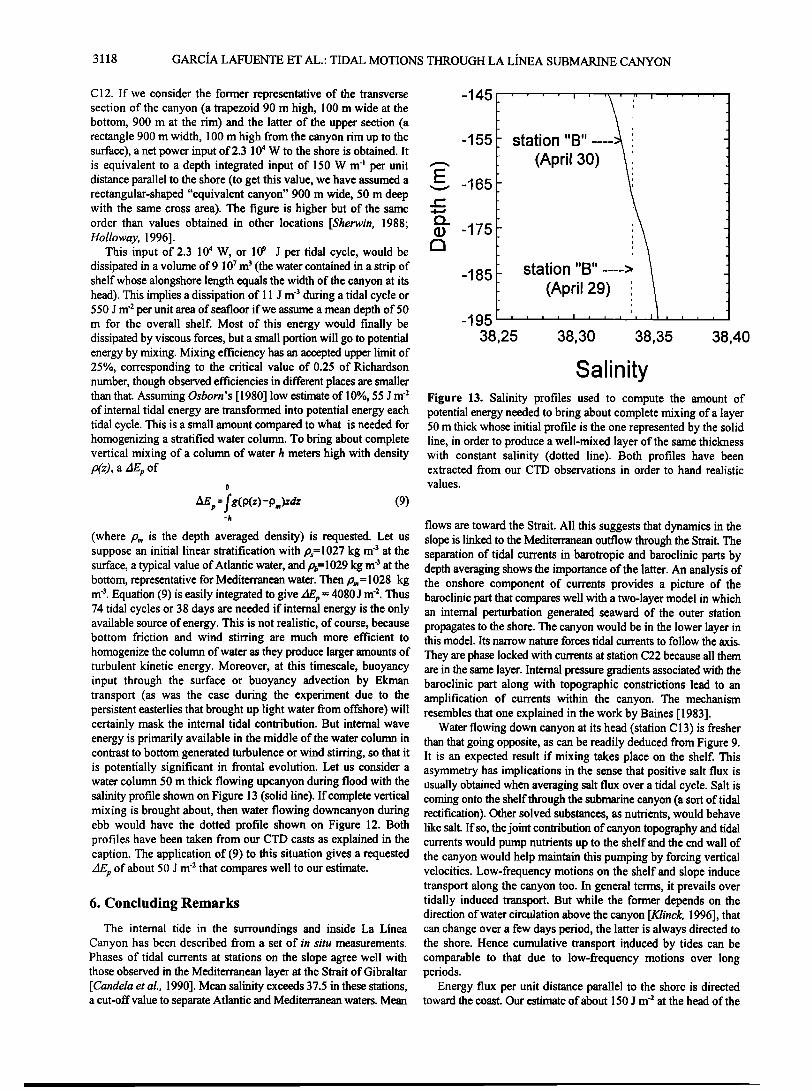
Time series ofp' at depths of stations C12 and C13 were then produced replacing p'(z) by CT'(z) in (7b). As T'(z)=T(z)-T½(z), the coefficient B of (8) does not appear in the "prima" fields; it will be included in the "If" fields. Again, the variables were demodulated at M: frequency and introduced in (6) to estimate energy fluxes. The length of the series allowed estimates over 14 tidal cycles, and Figure 12 shows the result. The sign of the energy flux at each
station is in agreement with baroclinic motions, energy flowing to the shore at depth and offshore near the surface. Similar results have been obtained in other continental shelves [Sherwin and Taylor, 1990; Holloway, 1996].
Mean values of tidally averaged energy flux during the experiment have been 2.1+0.7 W m '2 at C13 and -0.8+0.6 W m '2 at
4 -
2
0 -
-2
-4 -, ' ! 119 120
. I . I ß I . I ß I . I . I
121 122 123 124 125 126 127
Julian day, 1995 Figure 12, Energy flux associated with the internal tide at station C13 (solid line) and C12 (dotted line) in site C1.
3118 GARDA LAFUENTE ET AL.' TIDAL MOTIONS THROUGH LA LiNEA SUBMARINE CANYON
C12. If we consider the former representative of the transverse section of the canyon (a trapezoid 90 m high, 100 m wide at the bottom, 900 m at the rim) and the latter of the upper section (a rectangle 900 m width, 100 m high from the canyon rim up to the surface), a net power input of 2.3 104 W to the shore is obtained. It is equivalent to a depth integrated input of 150 W m 4 per unit distance parallel to the shore (to get this value, we have assumed a rectangular-shaped "equivalent canyon" 900 m wide, 50 m deep with the same cross area). The figure is higher but of the same order than values obtained in other locations [Sherwin, 1988; Holloway, 1996].
This input of 2.3 104 W, or 109 J per tidal cycle, would be dissipated in a volume of 9 107 m 3 (the water contained in a strip of shelf whose alongshore length equals the width of the canyon at its head). This implies a dissipation of 11 J m -3 during a tidal cycle or 550 J m -2 per unit area of seafloor if we assume a mean depth of 50 m for the overall shelf. Most of this energy would finally be dissipated by viscous forces, but a small portion will go to potential energy by mixing. Mixing efficiency has an accepted upper limit of 25%, corresponding to the critical value of 0.25 of Richardson number, though observed efficiencies in different places are smaller than that. Assuming Osborn's [ 1980] low estimate of 10%, 55 J m '2 of internal tidal energy are transformed into potential energy each tidal cycle. This is a small amount compared to what is needed for homogenizing a stratified water column. To bring about complete vertical mixing of a column of water h meters high with density p(z), a ZlEp of
o
-h
(9)
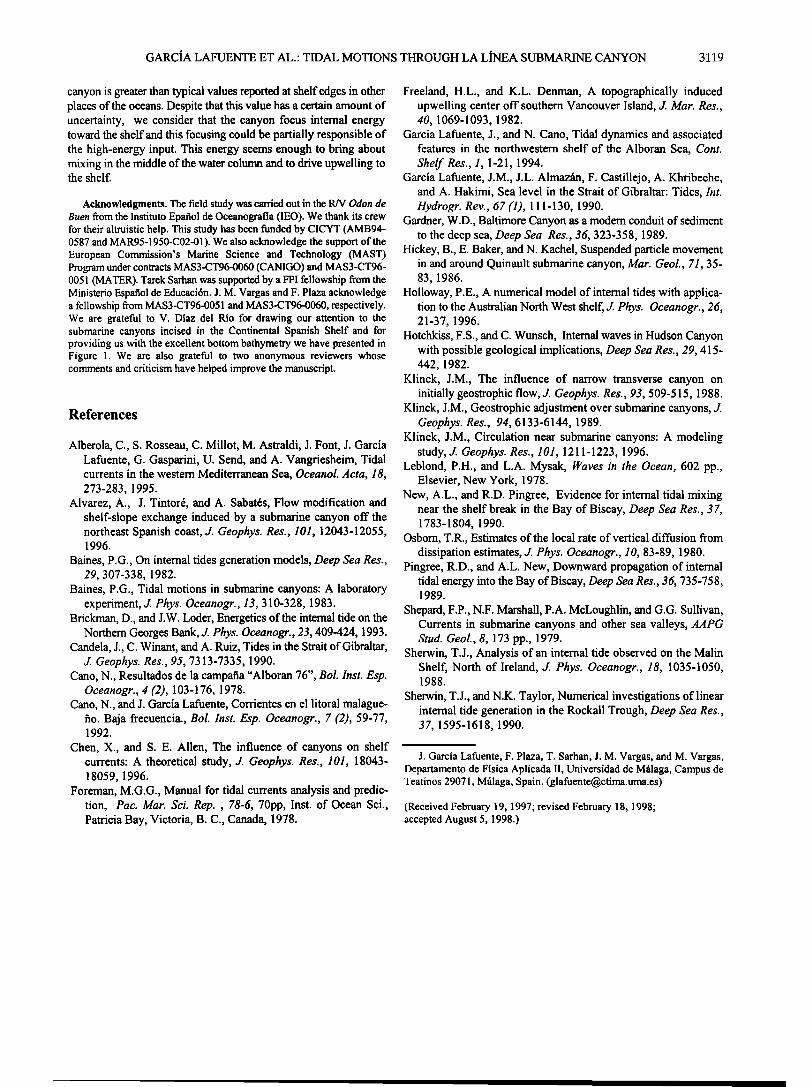
(where p,• is the depth averaged density) is requested. Let us suppose an initial linear stratification with ps--1027 kg m '3 at the surface, a typical value of Atlantic water, and pt, =1029 kg m '3 at the bottom, representative for Mediterranean water. Then p,•= 1028 kg m '3. Equation (9) is easily integrated to give ZlE•, -- 4080 J m '2. Thus 74 tidal cycles or 38 days are needed if internal energy is the only available source of energy. This is not realistic, of course, because bottom friction and wind stirring are much more efficient to homogenize the column of water as they produce larger amounts of turbulent kinetic energy. Moreover, at this timescale, buoyancy input through the surface or buoyancy advection by Ekman transport (as was the case during the experiment due to the persistent easterlies that brought up light water from offshore) will certainly mask the internal tidal contribution. But internal wave energy is primarily available in the middle of the water column in contrast to bottom generated turbulence or wind stirring, so that it is potentially significant in frontal evolution. Let us consider a water column 50 m thick flowing upcanyon during flood with the salinity profile shown on Figure 13 (solid line). If complete vertical mixing is brought about, then water flowing downcanyon during ebb would have the dotted profile shown on Figure 12. Both profiles have been taken from our CTD casts as explained in the caption. The application of (9) to this situation gives a requested zlE•, of about 50 J m '2 that compares well to our estimate.
6. Concluding Remarks
The internal tide in the surroundings and inside La Linea Canyon has been described from a set of in situ measurements. Phases of tidal currents at stations on the slope agree well with those observed in the Mediterranean layer at the Strait of Gibraltar [Candela et al., 1990]. Mean salinity exceeds 37.5 in these stations, a cut-off value to separate Atlantic and Mediterranean waters. Mean
-145
-155
-165
-175
-185
-195
38,25 38,30 38,35 38,40
Salinity Figure 13. Salinity profiles used to compute the amount of potential energy needed to bring about complete mixing of a layer 50 m thick whose initial profile is the one represented by the solid line, in order to produce a well-mixed layer of the same thickness with constant salinity (dotted line). Both profiles have been extracted from our CTD observations in order to hand realistic values.
flows are toward the Strait. All this suggests that dynamics in the slope is linked to the Mediterranean outflow through the Strait. The separation of tidal currents in barotropic and baroclinic parts by depth averaging shows the importance of the latter. An analysis of the onshore component of currents provides a picture of the baroclinic part that compares well with a two-layer model in which an internal perturbation generated seaward of the outer station propagates to the shore. The canyon would be in the lower layer in this model. Its narrow nature forces tidal currents to follow the axis.
They are phase locked with currents at station C22 because all them are in the same layer. Internal pressure gradients associated with the baroclinic part along with topographic constrictions lead to an amplification of currents within the canyon. The mechanism resembles that one explained in the work by Baines [1983].
Water flowing down canyon at its head (station C13) is fresher than that going opposite, as can be readily deduced from Figure 9. It is an expected result if mixing takes place on the shelf. This asymmetry has implications in the sense that positive salt flux is usually obtained when averaging salt flux over a tidal cycle. Salt is coming onto the shelf through the submarine canyon (a sort of tidal rectification). Other solved substances, as nutrients, would behave like salt. If so, the joint contribution of canyon topography and tidal currents would pump nutrients up to the shelf and the end wall of the canyon would help maintain this pumping by forcing vertical velocities. Low-frequency motions on the shelf and slope induce transport along the canyon too. In general terms, it prevails over tidally induced transport. But while the former depends on the direction of water circulation above the canyon [Klinck, 1996], that can change over a few days period, the latter is always directed to the shore. Hence cumulative transport induced by tides can be comparable to that due to low-frequency motions over long periods.
Energy flux per unit distance parallel to the shore is directed toward the coast. Our estimate of about 150 J m -2 at the head of the
GARCIA LAFUENTE ET AL.' TIDAL MOTIONS THROUGH LA LtNEA SUBMARINE CANYON 3119
canyon is greater than typical values reported at shelf edges in other places of the oceans. Despite that this value has a certain amount of uncertainty, we consider that the canyon focus internal energy toward the shelf and this focusing could be partially responsible of the high-energy input. This energy seems enough to bring about mixing in the middle of the water column and to drive upwelling to the shelf.
Acknowledgments. The field study was carried out in the R/V Odon de Buen from the Instituto Epafiol de Oceanografia (lEO). We thank its crew for their altruistic help. This study has been funded by CICYT (AMB94- 0587 and MAR95-1950-C02-01). We also acknowledge the support of the European Commission's Marine Science and Technology (MAST) Program under contracts MAS3-CT96-0060 (CANIGO) and MAS3-CT96- 0051 (MATER). Tarek Satban was supported by a FPI fellowship from the Ministerio Espafiol de Educaci6n. J. M. Vargas and F. Plaza acknowledge a fellowship from MAS3-CT96-0051 and MAS3-CT96-0060, respectively. We are grateful to V. Diaz del Rio for drawing our attention to the submarine canyons incised in the Continental Spanish Shelf and for providing us with the excellent bottom bathymetry we have presented in Figure 1. We are also grateful to two anonymous reviewers whose comments and criticism have helped improve the manuscript.
References
Alberola, C., S. Rosseau, C. Millot, M. Astraldi, J. Font, J. Garcia Lafuente, G. Gasparini, U. Send, and A. Vangriesheim, Tidal currents in the western Mediterranean Sea, Oceanol. Acta, 18, 273-283, 1995.
Alvarez, A., J. Tintor6, and A. Sabat6s, Flow modification and shelf-slope exchange induced by a submarine canyon off the northeast Spanish coast, d. Geophys. Res., 101, 12043-12055, 1996.
Baines, P.G., On internal tides generation models, Deep Sea Res., 29, 307-338, 1982.
Baines, P.G., Tidal motions in submarine canyons: A laboratory experiment, d. Phys. Oceanogr., 13, 310-328, 1983.
Brickman, D., and J.W. Loder, Energetics of the intemal tide on the Northern Georges Bank, d. Phys. Oceanogr., 23, 409-424, 1993.
Candela, J., C. Winant, and A. Ruiz, Tides in the Strait of Gibraltar, d. Geophys. Res., 95, 7313-7335, 1990.
Cano, N., Resultados de la camparia "Alboran 76", Bol. Inst. Esp. Oceanogr., 4 (2), 103-176, 1978.
Cano, N., and J. Garcia Lafuente, Corrientes en el litoral malague- rio. Baja frecuencia., Bol. Inst. Esp. Oceanogr., 7 (2), 59-77, 1992.
Chen, X., and S. E. Allen, The influence of canyons on shelf currents: A theoretical study, d. Geophys. Res., 101, 18043- 18059, 1996.
Foreman, M.G.G., Manual for tidal currents analysis and predic- tion, Pac. Mar. $ci. Rep. , 78-6, 70pp, Inst. of Ocean Sci., Patricia Bay, Victoria, B.C., Canada, 1978.
Freeland, H.L., and K.L. Denman, A topographically induced upwelling center off southern Vancouver Island, d. Mar. Res., 40, 1069-1093, 1982.
Garcia Lafuente, J., and N. Cano, Tidal dynamics and associated features in the northwestern shelf of the Alboran Sea, Cont. Shelf Res., 1, 1-21, 1994.
Garcia Lafuente, J.M., J.L. Almazfin, F. Castillejo, A. Khribeche, and A. Hakimi, Sea level in the Strait of Gibraltar: Tides, Inr Hydrogr. Rev., 67 (1), 111-130, 1990.
Gardner, W.D., Baltimore Canyon as a modem conduit of sediment to the deep sea, Deep Sea Res., 36, 323-358, 1989.
Hickey, B., E. Baker, and N. Kachel, Suspended particle movement in and around Quinault submarine canyon, Mar. Geol., 71, 35- 83, 1986.
Holloway, P.E., A numerical model of internal tides with applica- tion to the Australian North West shelf, o r. Phys. Oceanogr., 26, 21-37, 1996.
Hotchkiss, F.S., and C. Wunsch, Internal waves in Hudson Canyon with possible geological implications, Deep Sea Res., 29, 415- 442, 1982.
Klinck, J.M., The influence of narrow transverse canyon on initially geostrophic flow, o r. Geophys. Res., 93, 509-515, 1988.
Klinck, J.M., Geostrophic adjustment over submarine canyons, d. Geophys. Res., 94, 6133-6144, 1989.
Klinck, J.M., Circulation near submarine canyons: A modeling study, o r. Geophys. Res., 101, 1211-1223, 1996.
Leblond, P.H., and L.A. Mysak, Waves in the Ocean, 602 pp., Elsevier, New York, 1978.
New, A.L., and R.D. Pingree, Evidence for internal tidal mixing near the shelf break in the Bay of Biscay, Deep Sea Res., 37, 1783-1804, 1990.
Osborn, T.R., Estimates of the local rate of vertical diffusion from dissipation estimates, d. Phys. Oceanogr., 1 O, 83-89, 1980.
Pingree, R.D., and A.L. New, Downward propagation of internal tidal energy into the Bay of Biscay, Deep Sea Res., 36, 735-758, 1989.
Shepard, F.P., N.F. Marshall, P.A. McLoughlin, and G.G. Sullivan, Currents in submarine canyons and other sea valleys, AAPG Stud. Geol., 8, 173 pp., 1979.
Sherwin, T.J., Analysis of an intemal tide observed on the Malin Shelf, North of Ireland, o r. Phys. Oceanogr., 18, 1035-1050, 1988.
Sherwin, T.J., and N.K. Taylor, Numerical investigations of linear internal tide generation in the Rockall Trough, Deep Sea Res., 37, 1595-1618, 1990.
J. Garcia Lafuente, F. Plaza, T. Sarhan, J. M. Vargas, and M. Vargas, Departamento de Fisica Aplicada II, Universidad de Mfilaga, Campus de Teatinos 29071, Mfilaga, Spain. (glafuente•ctima.uma.es)
(Received February 19, 1997; revised February 18, 1998; accepted August 5, 1998.)
Copyright © 2022 FDOKUMEN


!["El sermón como instrumento de intermediación cultural. Sermones del federalismo cordobés, 1815-1852" in: Nuevo Mundo Mundos Nuevos, Debates, 2009, [En línea], Puesto en línea](https://static.fdokumen.com/doc/165x107/6320e14718429976e4066859/el-sermon-como-instrumento-de-intermediacion-cultural-sermones-del-federalismo.jpg)