Age of the source of the Jarrafa gravity and magnetic anomalies offshore Libya and its geodynamic...
17
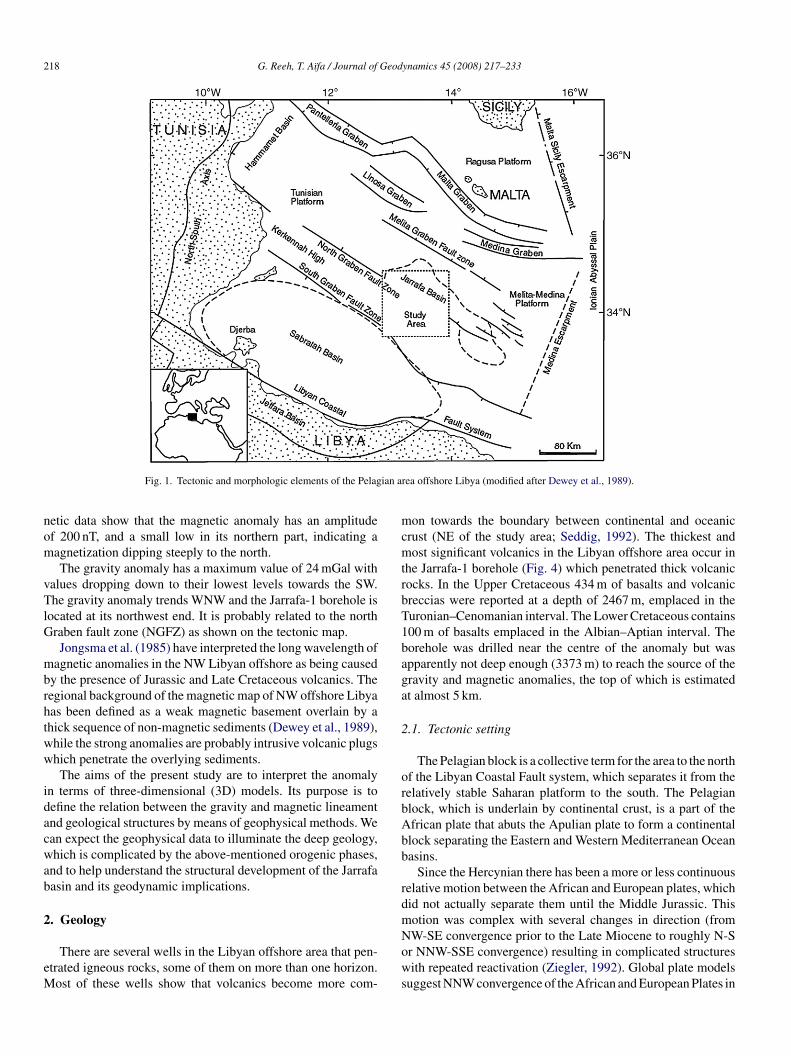
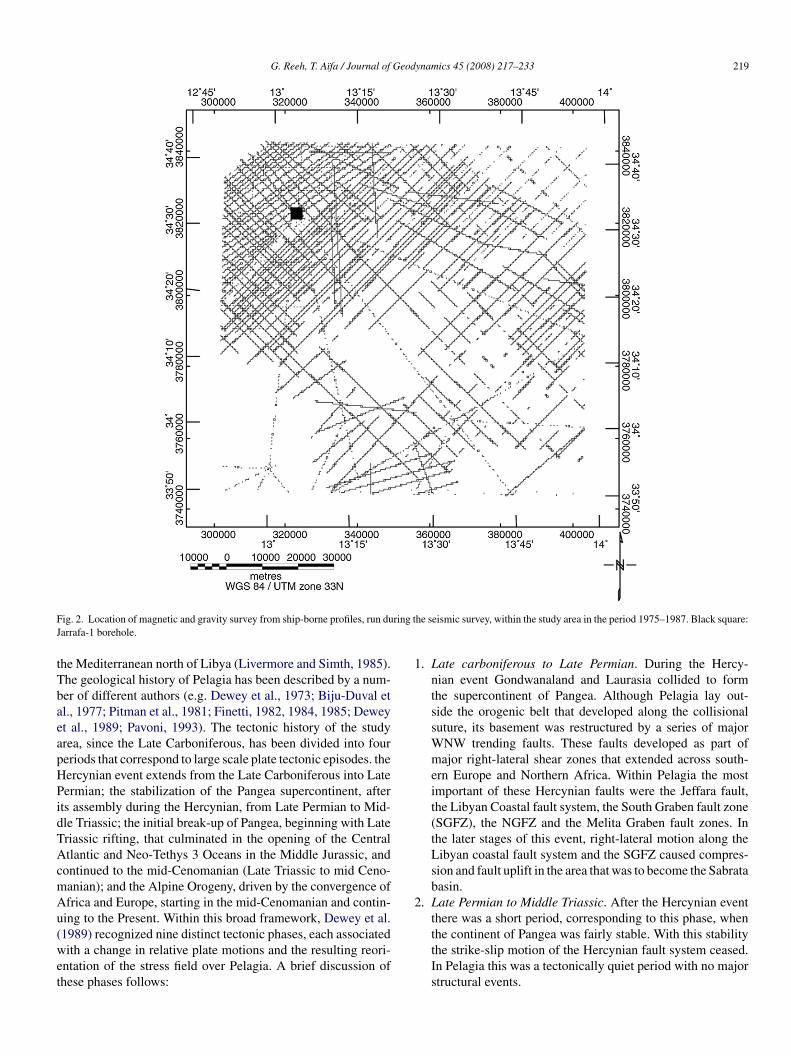
Available online at www.sciencedirect.com Journal of Geodynamics 45 (2008) 217–233 Age of the source of the Jarrafa gravity and magnetic anomalies offshore Libya and its geodynamic implications Giuma Reeh a , Tahar A¨ ıfa b,∗ a Libyan Petroleum Institute, P.O. Box 6431, Tripoli, Libya b G´ eosciences-Rennes, CNRS UMR6118, Universit´ e de Rennes 1, Campus de Beaulieu, 35042 Rennes cedex, France Received 18 June 2007; received in revised form 31 December 2007; accepted 1 January 2008 Abstract The interpretation of the Jarrafa magnetic and gravity highs, NW Libyan offshore, suggests that it may be caused by a body of high-density and high magnetization. Analysis of their power spectra indicates two groups of sources at: (1) 2.7 km depth, probably related to the igneous rocks, some of which were penetrated in the JA-1 borehole, (2) 5 km depth, corresponding to the top of the causative body and (3) 10 km depth, probably referring to the local basement depth. The boundary analysis derived from applied horizontal gradient to both gravity and magnetic data reveals lineaments many of which can be related to geological structures (grabens, horsts and faults). The poor correlation between pseudogravity fields for induced magnetization and observed gravity fields strongly suggests that the causative structure has a remanent magnetization (D = −16 ◦ , I = 23 ◦ ) of Early Cretaceous age, fitting with the opening of the Neo Tethys 3 Ocean. Three-dimensional interpretation techniques indicate that the magnetic source of the Jarrafa magnetic anomaly has a magnetization intensity of 0.46A/m, which is required to simulate the amplitude of the observed magnetic anomaly. The magnetic model shows that it has a base level at 15 km. The history of the area combined with the analysis and interpretation of the gravity and magnetic data suggests that: (1) the source of the Jarrafa anomaly is a mafic igneous rock and it may have formed during an Early Cretaceous extensional phase and (2) the Jarrafa basin was left-laterally sheared along the WNW Hercynian North Graben Fault Zone, during its reactivation in the Early Cretaceous. © 2008 Elsevier Ltd. All rights reserved. Keywords: Jarrafa; Gravity; Magnetics; Early Cretaceous extension; Igneous rocks 1. Introduction The study area is located between [12 ◦ 51 E–13 ◦ 57 E] and [33 ◦ 50 N–34 ◦ 43 N] (Fig. 1). The Jarrafa magnetic and gravity anomalies lie in a region known as Pelagia, which is a salient of the African plate and represents an unstable continental mar- gin formed during the Carboniferous collision of the African and the Apulian plates (Bishop, 1975). This region has expe- rienced a number of major tectonic events, namely Hercynian compression, Jurassic extension and Alpine Orogenic compres- sion (Dewey et al., 1989). During the Hercynian event the area was extensively restructured, forming the strong WNW fault system that has subsequently dominated its structural evolution. ∗ Corresponding author. Tel.: +33 2 23236785; fax: +33 2 23236097. E-mail address: [email protected] (T. A¨ ıfa). The magnetic and gravity data used in this study were obtained from ship-borne measurements by various contractors in the period 1975–1987; they have been collated by the National Oil Corporation of Libya. The anomalies considered in this study were identified from magnetic and gravity data prepared by the Simon–Robertson Company for Sirt Oil Company. The distribution of the gravity and magnetic measurement points along profiles within the study area are shown in Fig. 2. There are 16,6571 magnetic and 18,0955 gravity points. The latter were fully corrected for topographic effects using a reduc- tion density of 2.2 cgs. Densities and magnetic susceptibilities of sedimentary basin and crystalline basement rocks are desirable for any magnetic and gravity data interpretation. Unfortunately, neither density nor magnetic susceptibility measurements are available for the rocks of the study area. The Jarrafa magnetic and gravity anomaly maps (Fig. 3a and b) were gridded with a 2 km grid cell size and mapped at 1 mGal contour intervals for gravity and 20 nT for magnetics. The mag- 0264-3707/$ – see front matter © 2008 Elsevier Ltd. All rights reserved. doi:10.1016/j.jog.2008.01.001
Transcript of Age of the source of the Jarrafa gravity and magnetic anomalies offshore Libya and its geodynamic...
A
hsrl
s
01
as©
K
1
[aogarcsws
0d
Available online at www.sciencedirect.com
Journal of Geodynamics 45 (2008) 217–233
Age of the source of the Jarrafa gravity and magnetic anomaliesoffshore Libya and its geodynamic implications
Giuma Reeh a, Tahar Aıfa b,∗a Libyan Petroleum Institute, P.O. Box 6431, Tripoli, Libya
b Geosciences-Rennes, CNRS UMR6118, Universite de Rennes 1, Campus de Beaulieu, 35042 Rennes cedex, France
Received 18 June 2007; received in revised form 31 December 2007; accepted 1 January 2008
bstract
The interpretation of the Jarrafa magnetic and gravity highs, NW Libyan offshore, suggests that it may be caused by a body of high-density andigh magnetization. Analysis of their power spectra indicates two groups of sources at: (1) 2.7 km depth, probably related to the igneous rocks,ome of which were penetrated in the JA-1 borehole, (2) 5 km depth, corresponding to the top of the causative body and (3) 10 km depth, probablyeferring to the local basement depth. The boundary analysis derived from applied horizontal gradient to both gravity and magnetic data revealsineaments many of which can be related to geological structures (grabens, horsts and faults).
The poor correlation between pseudogravity fields for induced magnetization and observed gravity fields strongly suggests that the causativetructure has a remanent magnetization (D = −16◦, I = 23◦) of Early Cretaceous age, fitting with the opening of the Neo Tethys 3 Ocean.
Three-dimensional interpretation techniques indicate that the magnetic source of the Jarrafa magnetic anomaly has a magnetization intensity of.46 A/m, which is required to simulate the amplitude of the observed magnetic anomaly. The magnetic model shows that it has a base level at
5 km.The history of the area combined with the analysis and interpretation of the gravity and magnetic data suggests that: (1) the source of the Jarrafanomaly is a mafic igneous rock and it may have formed during an Early Cretaceous extensional phase and (2) the Jarrafa basin was left-laterallyheared along the WNW Hercynian North Graben Fault Zone, during its reactivation in the Early Cretaceous.
2008 Elsevier Ltd. All rights reserved.
cks
oiOwS
pTlt
eywords: Jarrafa; Gravity; Magnetics; Early Cretaceous extension; Igneous ro
. Introduction
The study area is located between [12◦ 51′E–13◦ 57′E] and33◦ 50′N–34◦ 43′N] (Fig. 1). The Jarrafa magnetic and gravitynomalies lie in a region known as Pelagia, which is a salientf the African plate and represents an unstable continental mar-in formed during the Carboniferous collision of the Africannd the Apulian plates (Bishop, 1975). This region has expe-ienced a number of major tectonic events, namely Hercynianompression, Jurassic extension and Alpine Orogenic compres-ion (Dewey et al., 1989). During the Hercynian event the area
as extensively restructured, forming the strong WNW faultystem that has subsequently dominated its structural evolution.
∗ Corresponding author. Tel.: +33 2 23236785; fax: +33 2 23236097.E-mail address: [email protected] (T. Aıfa).
sfna
bc
264-3707/$ – see front matter © 2008 Elsevier Ltd. All rights reserved.oi:10.1016/j.jog.2008.01.001
The magnetic and gravity data used in this study werebtained from ship-borne measurements by various contractorsn the period 1975–1987; they have been collated by the Nationalil Corporation of Libya. The anomalies considered in this studyere identified from magnetic and gravity data prepared by theimon–Robertson Company for Sirt Oil Company.
The distribution of the gravity and magnetic measurementoints along profiles within the study area are shown in Fig. 2.here are 16,6571 magnetic and 18,0955 gravity points. The
atter were fully corrected for topographic effects using a reduc-ion density of 2.2 cgs. Densities and magnetic susceptibilities ofedimentary basin and crystalline basement rocks are desirableor any magnetic and gravity data interpretation. Unfortunately,either density nor magnetic susceptibility measurements are
vailable for the rocks of the study area.The Jarrafa magnetic and gravity anomaly maps (Fig. 3a and) were gridded with a 2 km grid cell size and mapped at 1 mGalontour intervals for gravity and 20 nT for magnetics. The mag-
218 G. Reeh, T. Aıfa / Journal of Geodynamics 45 (2008) 217–233
ian a
nom
vTlG
mbrhtww
idacwab
2
eM
mcmtrbT1baga
2
orbAbb
rdm
Fig. 1. Tectonic and morphologic elements of the Pelag
etic data show that the magnetic anomaly has an amplitudef 200 nT, and a small low in its northern part, indicating aagnetization dipping steeply to the north.The gravity anomaly has a maximum value of 24 mGal with
alues dropping down to their lowest levels towards the SW.he gravity anomaly trends WNW and the Jarrafa-1 borehole is
ocated at its northwest end. It is probably related to the northraben fault zone (NGFZ) as shown on the tectonic map.Jongsma et al. (1985) have interpreted the long wavelength of
agnetic anomalies in the NW Libyan offshore as being causedy the presence of Jurassic and Late Cretaceous volcanics. Theegional background of the magnetic map of NW offshore Libyaas been defined as a weak magnetic basement overlain by ahick sequence of non-magnetic sediments (Dewey et al., 1989),hile the strong anomalies are probably intrusive volcanic plugshich penetrate the overlying sediments.The aims of the present study are to interpret the anomaly
n terms of three-dimensional (3D) models. Its purpose is toefine the relation between the gravity and magnetic lineamentnd geological structures by means of geophysical methods. Wean expect the geophysical data to illuminate the deep geology,hich is complicated by the above-mentioned orogenic phases,
nd to help understand the structural development of the Jarrafaasin and its geodynamic implications.
. Geology
There are several wells in the Libyan offshore area that pen-trated igneous rocks, some of them on more than one horizon.ost of these wells show that volcanics become more com-
Nows
rea offshore Libya (modified after Dewey et al., 1989).
on towards the boundary between continental and oceanicrust (NE of the study area; Seddig, 1992). The thickest andost significant volcanics in the Libyan offshore area occur in
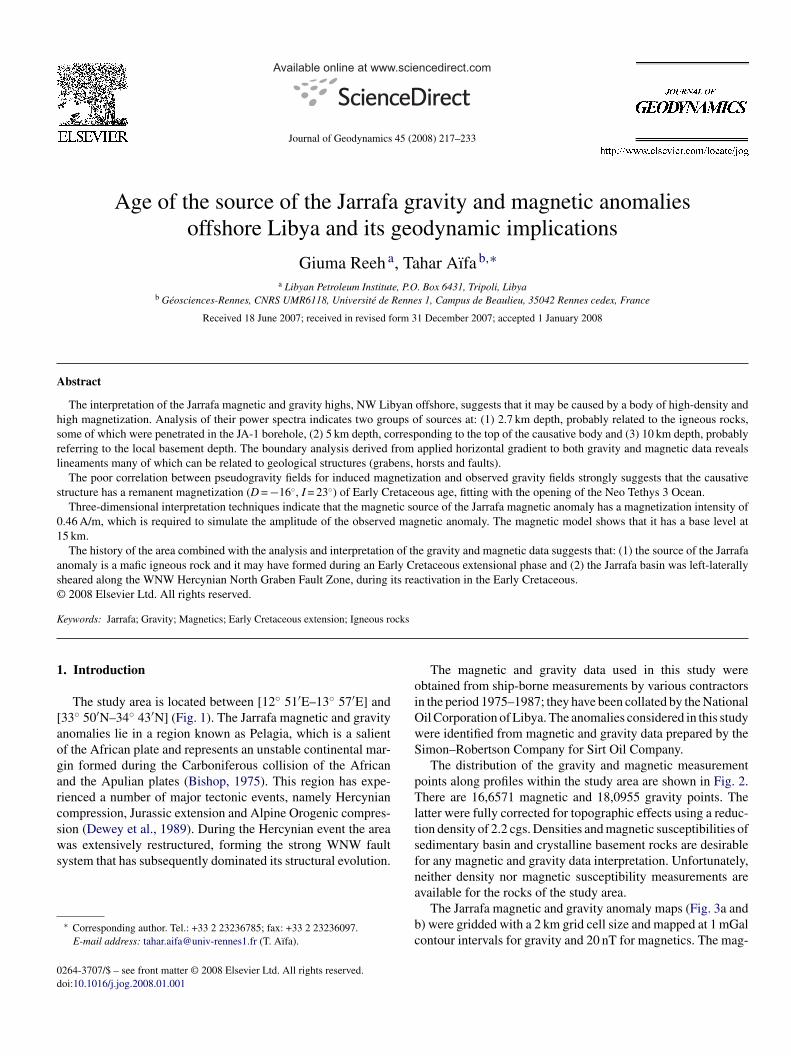
he Jarrafa-1 borehole (Fig. 4) which penetrated thick volcanicocks. In the Upper Cretaceous 434 m of basalts and volcanicreccias were reported at a depth of 2467 m, emplaced in theuronian–Cenomanian interval. The Lower Cretaceous contains00 m of basalts emplaced in the Albian–Aptian interval. Theorehole was drilled near the centre of the anomaly but waspparently not deep enough (3373 m) to reach the source of theravity and magnetic anomalies, the top of which is estimatedt almost 5 km.
.1. Tectonic setting
The Pelagian block is a collective term for the area to the northf the Libyan Coastal Fault system, which separates it from theelatively stable Saharan platform to the south. The Pelagianlock, which is underlain by continental crust, is a part of thefrican plate that abuts the Apulian plate to form a continentallock separating the Eastern and Western Mediterranean Oceanasins.
Since the Hercynian there has been a more or less continuouselative motion between the African and European plates, whichid not actually separate them until the Middle Jurassic. Thisotion was complex with several changes in direction (from
W-SE convergence prior to the Late Miocene to roughly N-Sr NNW-SSE convergence) resulting in complicated structuresith repeated reactivation (Ziegler, 1992). Global plate modelsuggest NNW convergence of the African and European Plates in
G. Reeh, T. Aıfa / Journal of Geodynamics 45 (2008) 217–233 219
F ring tJ
tTbaeapHPidTAcmAu(wet
1
2
ig. 2. Location of magnetic and gravity survey from ship-borne profiles, run duarrafa-1 borehole.
he Mediterranean north of Libya (Livermore and Simth, 1985).he geological history of Pelagia has been described by a num-er of different authors (e.g. Dewey et al., 1973; Biju-Duval etl., 1977; Pitman et al., 1981; Finetti, 1982, 1984, 1985; Deweyt al., 1989; Pavoni, 1993). The tectonic history of the studyrea, since the Late Carboniferous, has been divided into foureriods that correspond to large scale plate tectonic episodes. theercynian event extends from the Late Carboniferous into Lateermian; the stabilization of the Pangea supercontinent, after
ts assembly during the Hercynian, from Late Permian to Mid-le Triassic; the initial break-up of Pangea, beginning with Lateriassic rifting, that culminated in the opening of the Centraltlantic and Neo-Tethys 3 Oceans in the Middle Jurassic, and
ontinued to the mid-Cenomanian (Late Triassic to mid Ceno-anian); and the Alpine Orogeny, driven by the convergence offrica and Europe, starting in the mid-Cenomanian and contin-ing to the Present. Within this broad framework, Dewey et al.
1989) recognized nine distinct tectonic phases, each associatedith a change in relative plate motions and the resulting reori-ntation of the stress field over Pelagia. A brief discussion ofhese phases follows:
he seismic survey, within the study area in the period 1975–1987. Black square:
. Late carboniferous to Late Permian. During the Hercy-nian event Gondwanaland and Laurasia collided to formthe supercontinent of Pangea. Although Pelagia lay out-side the orogenic belt that developed along the collisionalsuture, its basement was restructured by a series of majorWNW trending faults. These faults developed as part ofmajor right-lateral shear zones that extended across south-ern Europe and Northern Africa. Within Pelagia the mostimportant of these Hercynian faults were the Jeffara fault,the Libyan Coastal fault system, the South Graben fault zone(SGFZ), the NGFZ and the Melita Graben fault zones. Inthe later stages of this event, right-lateral motion along theLibyan coastal fault system and the SGFZ caused compres-sion and fault uplift in the area that was to become the Sabratabasin.
. Late Permian to Middle Triassic. After the Hercynian eventthere was a short period, corresponding to this phase, when
the continent of Pangea was fairly stable. With this stabilitythe strike-slip motion of the Hercynian fault system ceased.In Pelagia this was a tectonically quiet period with no majorstructural events.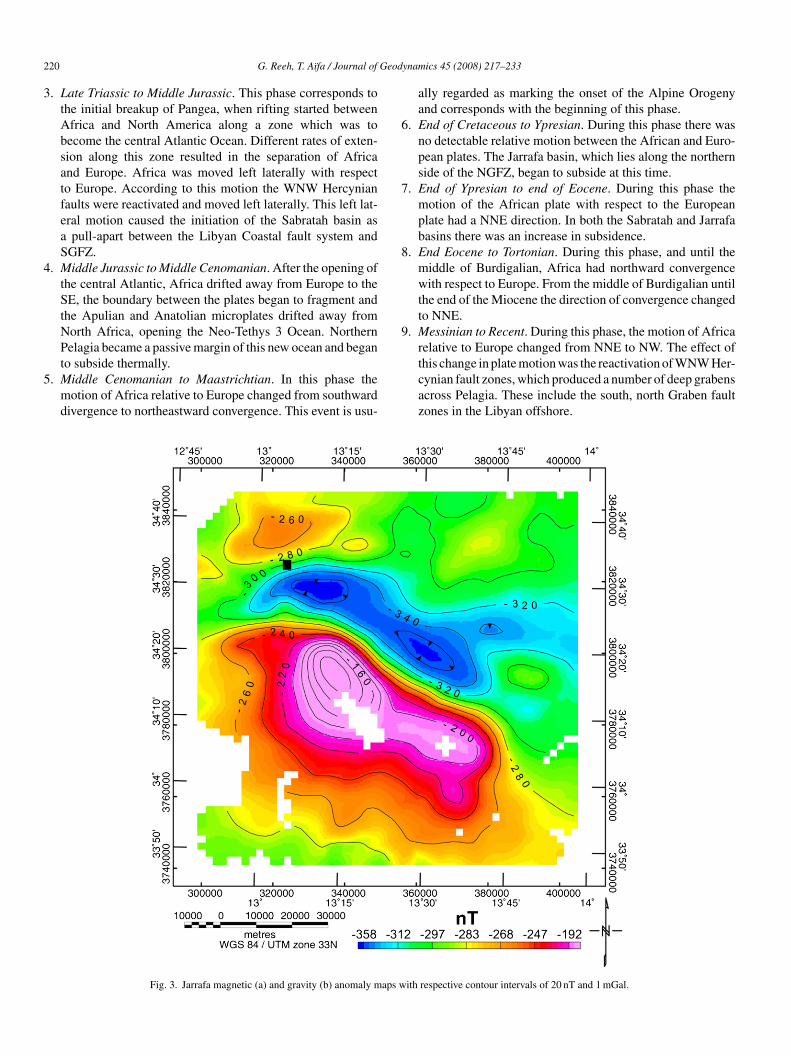
2 Geod
3
4
5
6
7
8
9
20 G. Reeh, T. Aıfa / Journal of
. Late Triassic to Middle Jurassic. This phase corresponds tothe initial breakup of Pangea, when rifting started betweenAfrica and North America along a zone which was tobecome the central Atlantic Ocean. Different rates of exten-sion along this zone resulted in the separation of Africaand Europe. Africa was moved left laterally with respectto Europe. According to this motion the WNW Hercynianfaults were reactivated and moved left laterally. This left lat-eral motion caused the initiation of the Sabratah basin asa pull-apart between the Libyan Coastal fault system andSGFZ.
. Middle Jurassic to Middle Cenomanian. After the opening ofthe central Atlantic, Africa drifted away from Europe to theSE, the boundary between the plates began to fragment andthe Apulian and Anatolian microplates drifted away fromNorth Africa, opening the Neo-Tethys 3 Ocean. NorthernPelagia became a passive margin of this new ocean and began
to subside thermally.. Middle Cenomanian to Maastrichtian. In this phase themotion of Africa relative to Europe changed from southwarddivergence to northeastward convergence. This event is usu-
Fig. 3. Jarrafa magnetic (a) and gravity (b) anomaly maps w
ynamics 45 (2008) 217–233
ally regarded as marking the onset of the Alpine Orogenyand corresponds with the beginning of this phase.
. End of Cretaceous to Ypresian. During this phase there wasno detectable relative motion between the African and Euro-pean plates. The Jarrafa basin, which lies along the northernside of the NGFZ, began to subside at this time.
. End of Ypresian to end of Eocene. During this phase themotion of the African plate with respect to the Europeanplate had a NNE direction. In both the Sabratah and Jarrafabasins there was an increase in subsidence.
. End Eocene to Tortonian. During this phase, and until themiddle of Burdigalian, Africa had northward convergencewith respect to Europe. From the middle of Burdigalian untilthe end of the Miocene the direction of convergence changedto NNE.
. Messinian to Recent. During this phase, the motion of Africarelative to Europe changed from NNE to NW. The effect of
this change in plate motion was the reactivation of WNW Her-cynian fault zones, which produced a number of deep grabensacross Pelagia. These include the south, north Graben faultzones in the Libyan offshore.ith respective contour intervals of 20 nT and 1 mGal.
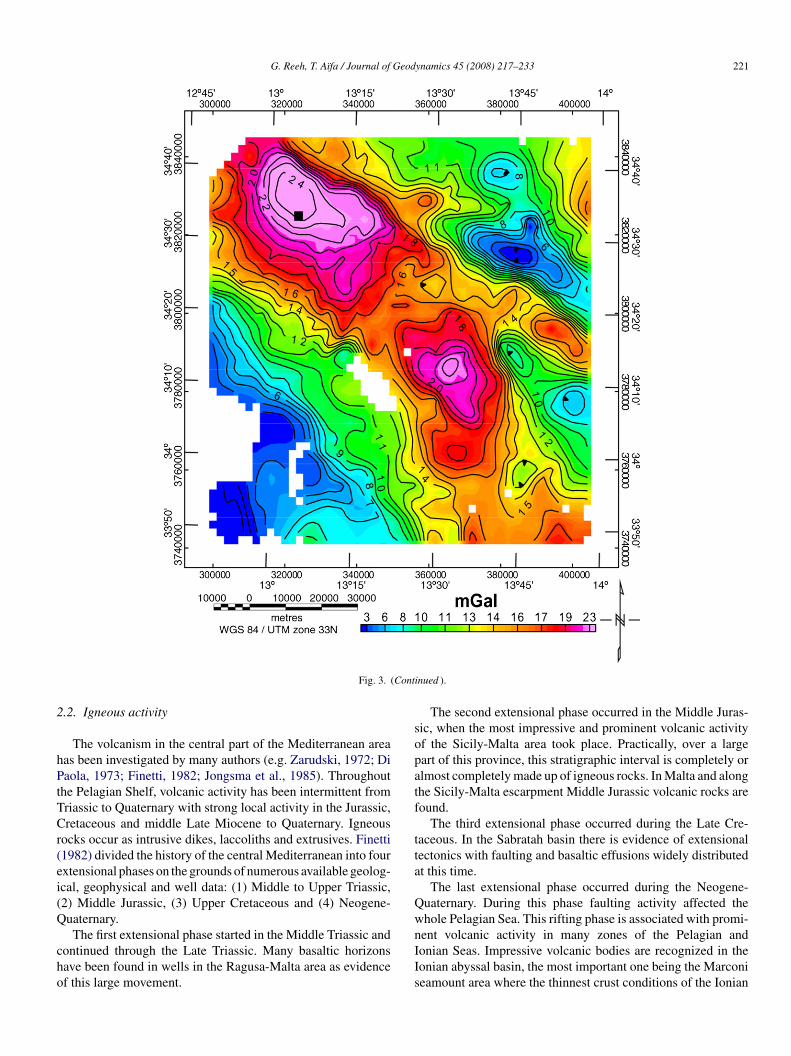
G. Reeh, T. Aıfa / Journal of Geodynamics 45 (2008) 217–233 221
Conti
2
hPtTCr(ei(Q
cho
sopatf
tta
Qw
Fig. 3. (
.2. Igneous activity
The volcanism in the central part of the Mediterranean areaas been investigated by many authors (e.g. Zarudski, 1972; Diaola, 1973; Finetti, 1982; Jongsma et al., 1985). Throughout
he Pelagian Shelf, volcanic activity has been intermittent fromriassic to Quaternary with strong local activity in the Jurassic,retaceous and middle Late Miocene to Quaternary. Igneous
ocks occur as intrusive dikes, laccoliths and extrusives. Finetti1982) divided the history of the central Mediterranean into fourxtensional phases on the grounds of numerous available geolog-cal, geophysical and well data: (1) Middle to Upper Triassic,2) Middle Jurassic, (3) Upper Cretaceous and (4) Neogene-uaternary.
The first extensional phase started in the Middle Triassic andontinued through the Late Triassic. Many basaltic horizonsave been found in wells in the Ragusa-Malta area as evidencef this large movement.
nIIs
nued ).
The second extensional phase occurred in the Middle Juras-ic, when the most impressive and prominent volcanic activityf the Sicily-Malta area took place. Practically, over a largeart of this province, this stratigraphic interval is completely orlmost completely made up of igneous rocks. In Malta and alonghe Sicily-Malta escarpment Middle Jurassic volcanic rocks areound.
The third extensional phase occurred during the Late Cre-aceous. In the Sabratah basin there is evidence of extensionalectonics with faulting and basaltic effusions widely distributedt this time.
The last extensional phase occurred during the Neogene-uaternary. During this phase faulting activity affected thehole Pelagian Sea. This rifting phase is associated with promi-
ent volcanic activity in many zones of the Pelagian andonian Seas. Impressive volcanic bodies are recognized in theonian abyssal basin, the most important one being the Marconieamount area where the thinnest crust conditions of the Ionian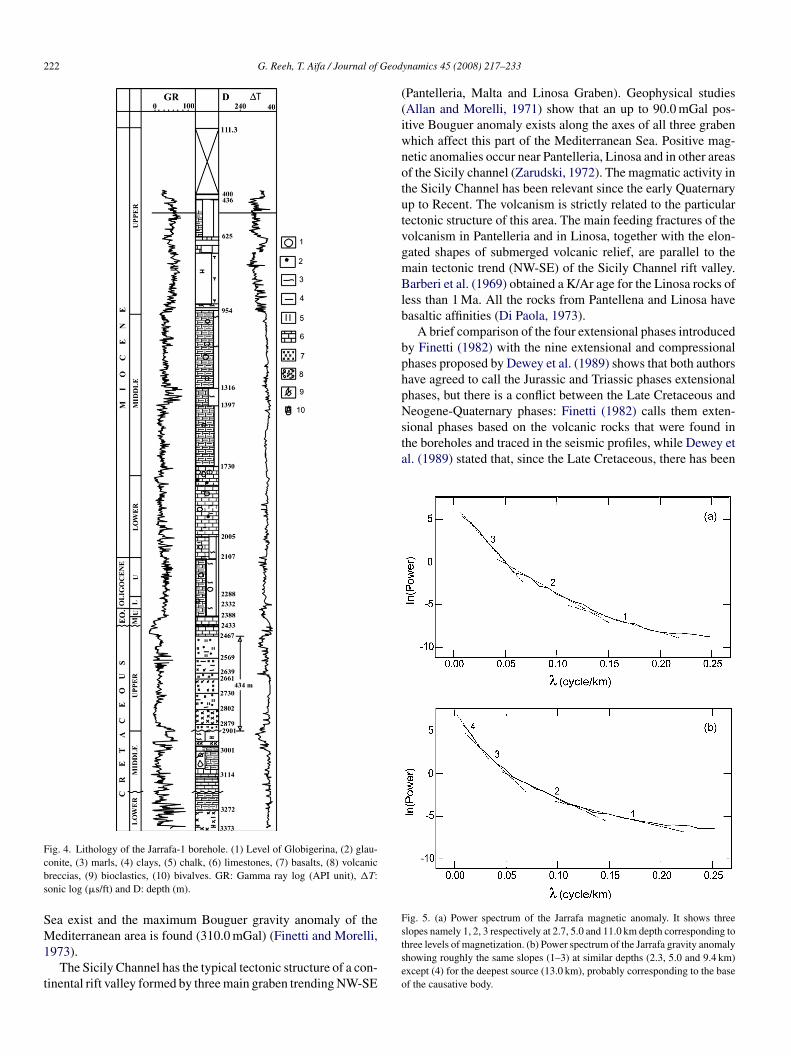
222 G. Reeh, T. Aıfa / Journal of Geod
Fig. 4. Lithology of the Jarrafa-1 borehole. (1) Level of Globigerina, (2) glau-cbs
SM1
t
((iwnotutvgmBlb
bphpNeogene-Quaternary phases: Finetti (1982) calls them exten-sional phases based on the volcanic rocks that were found inthe boreholes and traced in the seismic profiles, while Dewey etal. (1989) stated that, since the Late Cretaceous, there has been
Fig. 5. (a) Power spectrum of the Jarrafa magnetic anomaly. It shows three
onite, (3) marls, (4) clays, (5) chalk, (6) limestones, (7) basalts, (8) volcanicreccias, (9) bioclastics, (10) bivalves. GR: Gamma ray log (API unit), �T:onic log (�s/ft) and D: depth (m).
ea exist and the maximum Bouguer gravity anomaly of the
editerranean area is found (310.0 mGal) (Finetti and Morelli,973).The Sicily Channel has the typical tectonic structure of a con-
inental rift valley formed by three main graben trending NW-SE
stseo
ynamics 45 (2008) 217–233
Pantelleria, Malta and Linosa Graben). Geophysical studiesAllan and Morelli, 1971) show that an up to 90.0 mGal pos-tive Bouguer anomaly exists along the axes of all three grabenhich affect this part of the Mediterranean Sea. Positive mag-etic anomalies occur near Pantelleria, Linosa and in other areasf the Sicily channel (Zarudski, 1972). The magmatic activity inhe Sicily Channel has been relevant since the early Quaternaryp to Recent. The volcanism is strictly related to the particularectonic structure of this area. The main feeding fractures of theolcanism in Pantelleria and in Linosa, together with the elon-ated shapes of submerged volcanic relief, are parallel to theain tectonic trend (NW-SE) of the Sicily Channel rift valley.arberi et al. (1969) obtained a K/Ar age for the Linosa rocks of
ess than 1 Ma. All the rocks from Pantellena and Linosa haveasaltic affinities (Di Paola, 1973).
A brief comparison of the four extensional phases introducedy Finetti (1982) with the nine extensional and compressionalhases proposed by Dewey et al. (1989) shows that both authorsave agreed to call the Jurassic and Triassic phases extensionalhases, but there is a conflict between the Late Cretaceous and
lopes namely 1, 2, 3 respectively at 2.7, 5.0 and 11.0 km depth corresponding tohree levels of magnetization. (b) Power spectrum of the Jarrafa gravity anomalyhowing roughly the same slopes (1–3) at similar depths (2.3, 5.0 and 9.4 km)xcept (4) for the deepest source (13.0 km), probably corresponding to the basef the causative body.
Geod
ctpp
siANLgvTNHdm
easeP3e
3
3
Fic
G. Reeh, T. Aıfa / Journal of
ompression between Africa and Europe based on the study ofheir relative motion. It seems the classification of nine phasesroduced by Dewey et al. (1989) is more accurate than thatroduced by Finetti (1982).
However, Ziegler (1992) stated that the Italo-Dinarid blockplit from Africa during the Late Jurassic. Dewey et al. (1989)ndicated that, during the Middle Jurassic, the Apulian andnatolian plates pulled away from North Africa, opening theeo-Tethys 3 Ocean between Africa and Europe. Thus theibyan continental edge was converted into a passive rift mar-in (Dewey et al., 1989). At other passive margins continentalolcanism is often widespread during rupture (White, 1987).hus, the igneous rocks encountered in the boreholes in the
W Libyan offshore are probably related to the reactivation ofercynian basement faults due to the change of the stress fieldirection between the African and European plates, allowingagma to erupt as lava flows. During the same period plutons,amsd
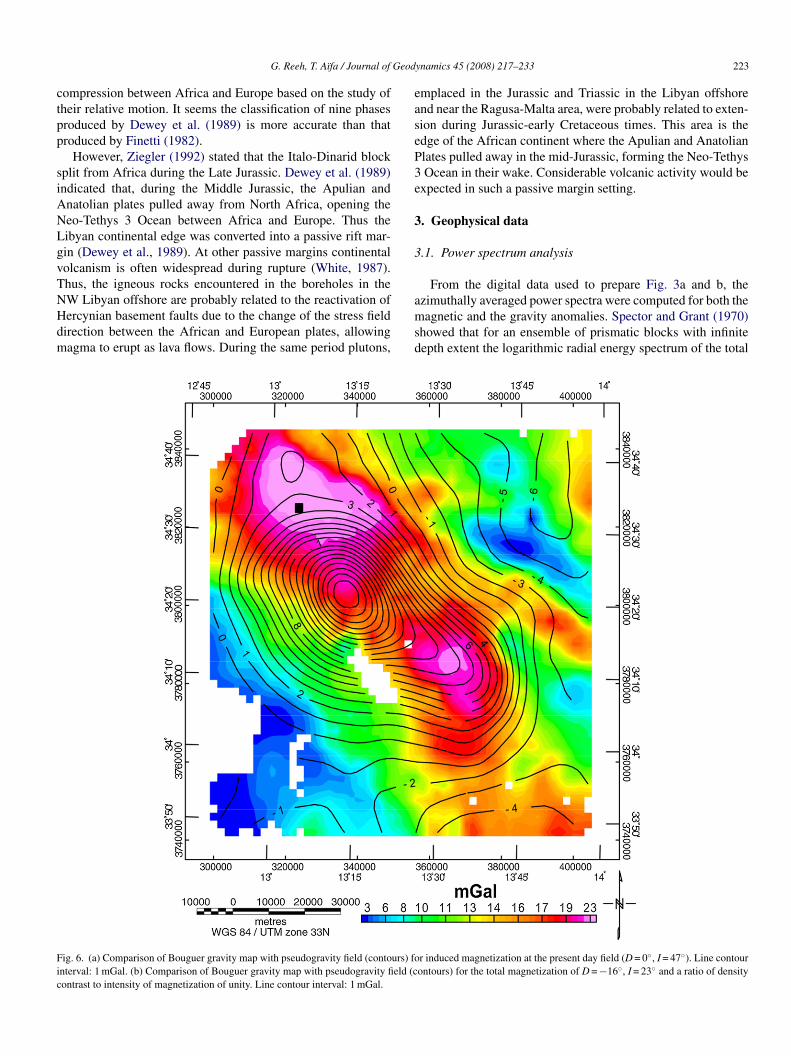
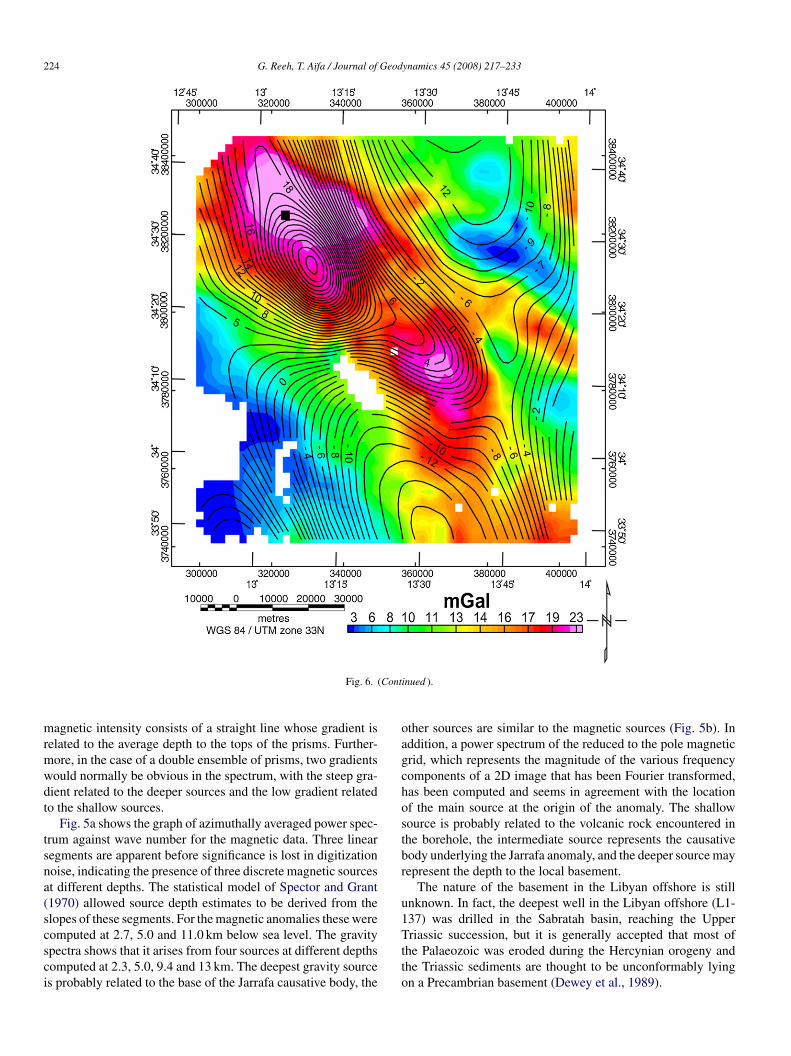
ig. 6. (a) Comparison of Bouguer gravity map with pseudogravity field (contours) fonterval: 1 mGal. (b) Comparison of Bouguer gravity map with pseudogravity field (contrast to intensity of magnetization of unity. Line contour interval: 1 mGal.
ynamics 45 (2008) 217–233 223
mplaced in the Jurassic and Triassic in the Libyan offshorend near the Ragusa-Malta area, were probably related to exten-ion during Jurassic-early Cretaceous times. This area is thedge of the African continent where the Apulian and Anatolianlates pulled away in the mid-Jurassic, forming the Neo-TethysOcean in their wake. Considerable volcanic activity would be
xpected in such a passive margin setting.
. Geophysical data
.1. Power spectrum analysis
From the digital data used to prepare Fig. 3a and b, the
zimuthally averaged power spectra were computed for both theagnetic and the gravity anomalies. Spector and Grant (1970)howed that for an ensemble of prismatic blocks with infiniteepth extent the logarithmic radial energy spectrum of the total
r induced magnetization at the present day field (D = 0◦, I = 47◦). Line contourontours) for the total magnetization of D = −16◦, I = 23◦ and a ratio of density
224 G. Reeh, T. Aıfa / Journal of Geodynamics 45 (2008) 217–233
Cont
mrmwdt
tsna(scsci
oagchostbr
u1
Fig. 6. (
agnetic intensity consists of a straight line whose gradient iselated to the average depth to the tops of the prisms. Further-ore, in the case of a double ensemble of prisms, two gradientsould normally be obvious in the spectrum, with the steep gra-ient related to the deeper sources and the low gradient relatedo the shallow sources.
Fig. 5a shows the graph of azimuthally averaged power spec-rum against wave number for the magnetic data. Three linearegments are apparent before significance is lost in digitizationoise, indicating the presence of three discrete magnetic sourcest different depths. The statistical model of Spector and Grant1970) allowed source depth estimates to be derived from thelopes of these segments. For the magnetic anomalies these were
omputed at 2.7, 5.0 and 11.0 km below sea level. The gravitypectra shows that it arises from four sources at different depthsomputed at 2.3, 5.0, 9.4 and 13 km. The deepest gravity sources probably related to the base of the Jarrafa causative body, theTtto
inued ).
ther sources are similar to the magnetic sources (Fig. 5b). Inddition, a power spectrum of the reduced to the pole magneticrid, which represents the magnitude of the various frequencyomponents of a 2D image that has been Fourier transformed,as been computed and seems in agreement with the locationf the main source at the origin of the anomaly. The shallowource is probably related to the volcanic rock encountered inhe borehole, the intermediate source represents the causativeody underlying the Jarrafa anomaly, and the deeper source mayepresent the depth to the local basement.
The nature of the basement in the Libyan offshore is stillnknown. In fact, the deepest well in the Libyan offshore (L1-37) was drilled in the Sabratah basin, reaching the Upper
riassic succession, but it is generally accepted that most ofhe Palaeozoic was eroded during the Hercynian orogeny andhe Triassic sediments are thought to be unconformably lyingn a Precambrian basement (Dewey et al., 1989).
Geod
3
taimf
iaiTmpf
tbt
mtaTisstwttgtmpr
FC
G. Reeh, T. Aıfa / Journal of
.2. Magnetic and Gravity interpretation
The magnetic anomaly map is more difficult to interpret thanhe gravity map. This is because of the shifting of the magneticnomaly away from the apex of the underlying source by thenclination of the present day field. Additionally, the remanent
agnetization associated with any magnetic body may causeurther complications.
In order to compensate for this shift, the pseudograv-ty anomaly (Baranov, 1957) is produced from the magneticnomaly using the induced magnetization direction and keep-ng the ratio of intensity of magnetization to density at unity.he pseudogravity is used for magnetic interpretation to deter-ine the edges of source body. Furthermore, the comparison of
seudogravity with observed gravity is made to see if the sameeature is generating both gravity and magnetic anomalies.
We used in our calculations the transform of the Poisson equa-ion relating the gravity and magnetic field potentials expressedy U = −(J/Gρ) (∂V/∂I), where U, V, I, J, ρ and G are, respec-ively, magnetic potential, gravitational potential, direction of
tToS
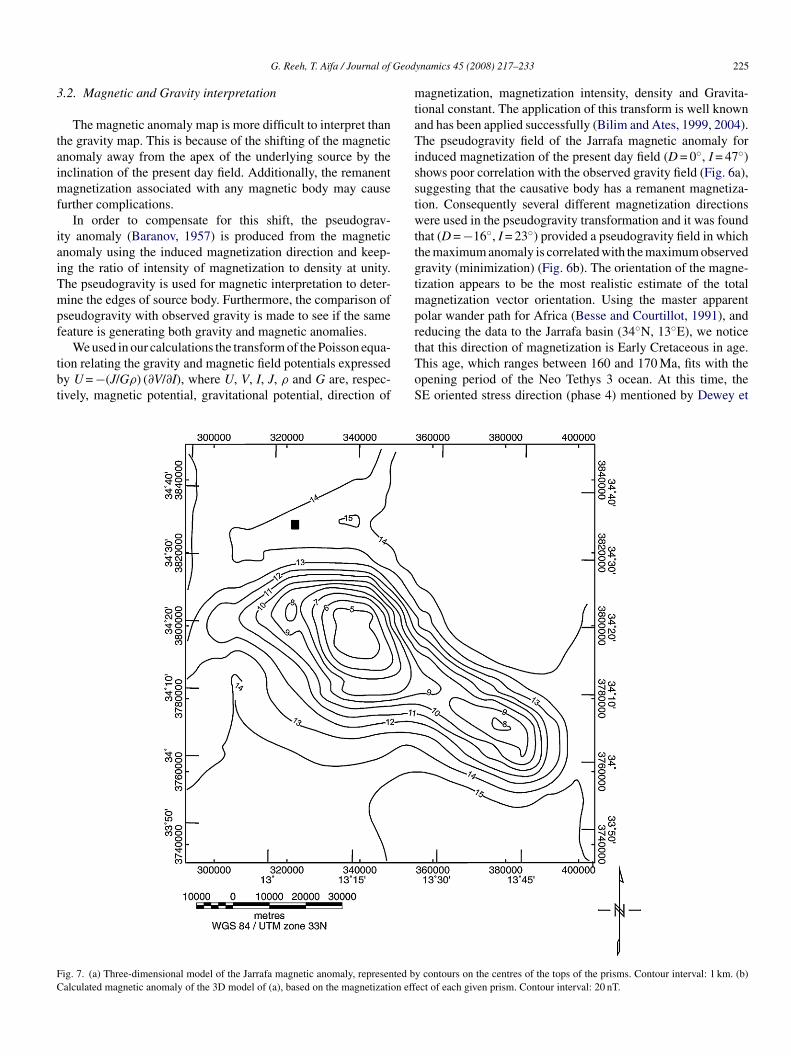
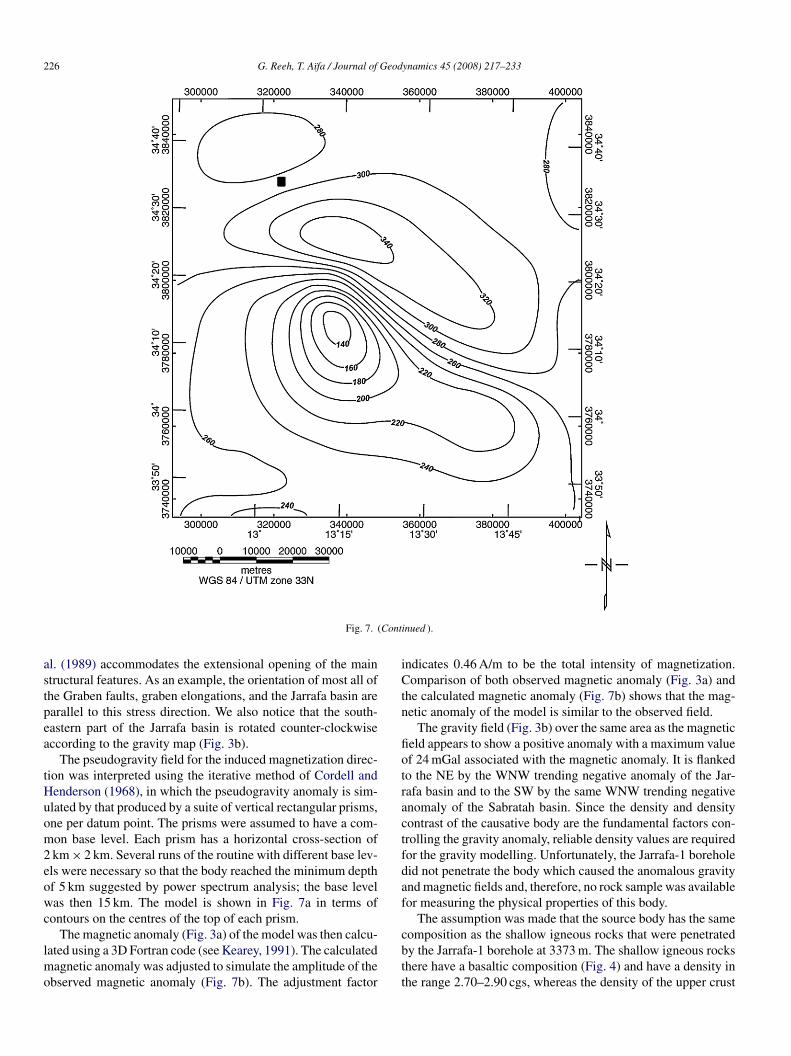
ig. 7. (a) Three-dimensional model of the Jarrafa magnetic anomaly, represented balculated magnetic anomaly of the 3D model of (a), based on the magnetization eff
ynamics 45 (2008) 217–233 225
agnetization, magnetization intensity, density and Gravita-ional constant. The application of this transform is well knownnd has been applied successfully (Bilim and Ates, 1999, 2004).he pseudogravity field of the Jarrafa magnetic anomaly for
nduced magnetization of the present day field (D = 0◦, I = 47◦)hows poor correlation with the observed gravity field (Fig. 6a),uggesting that the causative body has a remanent magnetiza-ion. Consequently several different magnetization directionsere used in the pseudogravity transformation and it was found
hat (D = −16◦, I = 23◦) provided a pseudogravity field in whichhe maximum anomaly is correlated with the maximum observedravity (minimization) (Fig. 6b). The orientation of the magne-ization appears to be the most realistic estimate of the total
agnetization vector orientation. Using the master apparentolar wander path for Africa (Besse and Courtillot, 1991), andeducing the data to the Jarrafa basin (34◦N, 13◦E), we notice
hat this direction of magnetization is Early Cretaceous in age.his age, which ranges between 160 and 170 Ma, fits with thepening period of the Neo Tethys 3 ocean. At this time, theE oriented stress direction (phase 4) mentioned by Dewey ety contours on the centres of the tops of the prisms. Contour interval: 1 km. (b)ect of each given prism. Contour interval: 20 nT.
226 G. Reeh, T. Aıfa / Journal of Geodynamics 45 (2008) 217–233
Cont
astpea
tHuom2eowc
lmo
iCtn
fiotractfdaf
Fig. 7. (
l. (1989) accommodates the extensional opening of the maintructural features. As an example, the orientation of most all ofhe Graben faults, graben elongations, and the Jarrafa basin arearallel to this stress direction. We also notice that the south-astern part of the Jarrafa basin is rotated counter-clockwiseccording to the gravity map (Fig. 3b).
The pseudogravity field for the induced magnetization direc-ion was interpreted using the iterative method of Cordell andenderson (1968), in which the pseudogravity anomaly is sim-lated by that produced by a suite of vertical rectangular prisms,ne per datum point. The prisms were assumed to have a com-on base level. Each prism has a horizontal cross-section ofkm × 2 km. Several runs of the routine with different base lev-ls were necessary so that the body reached the minimum depthf 5 km suggested by power spectrum analysis; the base levelas then 15 km. The model is shown in Fig. 7a in terms of
ontours on the centres of the top of each prism.
The magnetic anomaly (Fig. 3a) of the model was then calcu-ated using a 3D Fortran code (see Kearey, 1991). The calculatedagnetic anomaly was adjusted to simulate the amplitude of the
bserved magnetic anomaly (Fig. 7b). The adjustment factor
cbtt
inued ).
ndicates 0.46 A/m to be the total intensity of magnetization.omparison of both observed magnetic anomaly (Fig. 3a) and
he calculated magnetic anomaly (Fig. 7b) shows that the mag-etic anomaly of the model is similar to the observed field.
The gravity field (Fig. 3b) over the same area as the magneticeld appears to show a positive anomaly with a maximum valuef 24 mGal associated with the magnetic anomaly. It is flankedo the NE by the WNW trending negative anomaly of the Jar-afa basin and to the SW by the same WNW trending negativenomaly of the Sabratah basin. Since the density and densityontrast of the causative body are the fundamental factors con-rolling the gravity anomaly, reliable density values are requiredor the gravity modelling. Unfortunately, the Jarrafa-1 boreholeid not penetrate the body which caused the anomalous gravitynd magnetic fields and, therefore, no rock sample was availableor measuring the physical properties of this body.
The assumption was made that the source body has the same
omposition as the shallow igneous rocks that were penetratedy the Jarrafa-1 borehole at 3373 m. The shallow igneous rockshere have a basaltic composition (Fig. 4) and have a density inhe range 2.70–2.90 cgs, whereas the density of the upper crust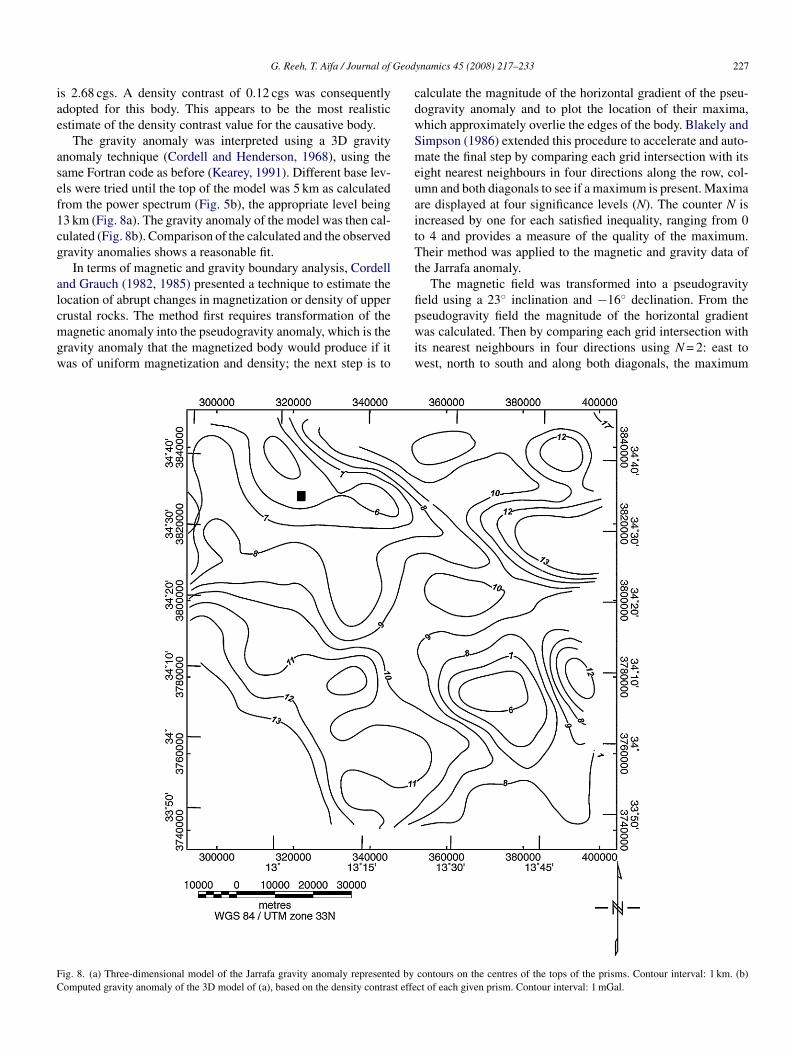
Geod
iae
asef1cg
alcmgw
cdwSmeuaitTt
fi
FC
G. Reeh, T. Aıfa / Journal of
s 2.68 cgs. A density contrast of 0.12 cgs was consequentlydopted for this body. This appears to be the most realisticstimate of the density contrast value for the causative body.
The gravity anomaly was interpreted using a 3D gravitynomaly technique (Cordell and Henderson, 1968), using theame Fortran code as before (Kearey, 1991). Different base lev-ls were tried until the top of the model was 5 km as calculatedrom the power spectrum (Fig. 5b), the appropriate level being3 km (Fig. 8a). The gravity anomaly of the model was then cal-ulated (Fig. 8b). Comparison of the calculated and the observedravity anomalies shows a reasonable fit.
In terms of magnetic and gravity boundary analysis, Cordellnd Grauch (1982, 1985) presented a technique to estimate theocation of abrupt changes in magnetization or density of upper
rustal rocks. The method first requires transformation of theagnetic anomaly into the pseudogravity anomaly, which is theravity anomaly that the magnetized body would produce if itas of uniform magnetization and density; the next step is to
pwiw
ig. 8. (a) Three-dimensional model of the Jarrafa gravity anomaly represented byomputed gravity anomaly of the 3D model of (a), based on the density contrast effe
ynamics 45 (2008) 217–233 227
alculate the magnitude of the horizontal gradient of the pseu-ogravity anomaly and to plot the location of their maxima,hich approximately overlie the edges of the body. Blakely andimpson (1986) extended this procedure to accelerate and auto-ate the final step by comparing each grid intersection with its
ight nearest neighbours in four directions along the row, col-mn and both diagonals to see if a maximum is present. Maximare displayed at four significance levels (N). The counter N isncreased by one for each satisfied inequality, ranging from 0o 4 and provides a measure of the quality of the maximum.heir method was applied to the magnetic and gravity data of
he Jarrafa anomaly.The magnetic field was transformed into a pseudogravity
eld using a 23◦ inclination and −16◦ declination. From the
seudogravity field the magnitude of the horizontal gradientas calculated. Then by comparing each grid intersection withts nearest neighbours in four directions using N = 2: east toest, north to south and along both diagonals, the maximum
contours on the centres of the tops of the prisms. Contour interval: 1 km. (b)ct of each given prism. Contour interval: 1 mGal.
228 G. Reeh, T. Aıfa / Journal of Geodynamics 45 (2008) 217–233
Cont
wp
mpmficmnt
u(
(
wt
fiwptfis
mtidos((
Fig. 8. (
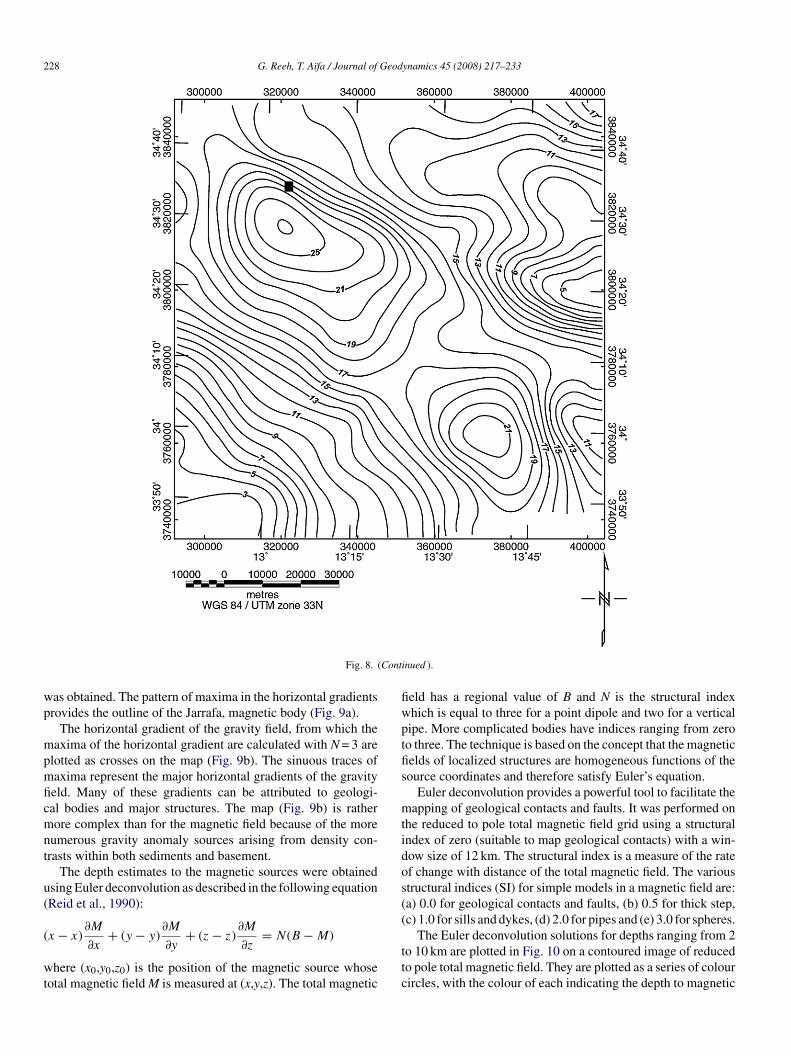
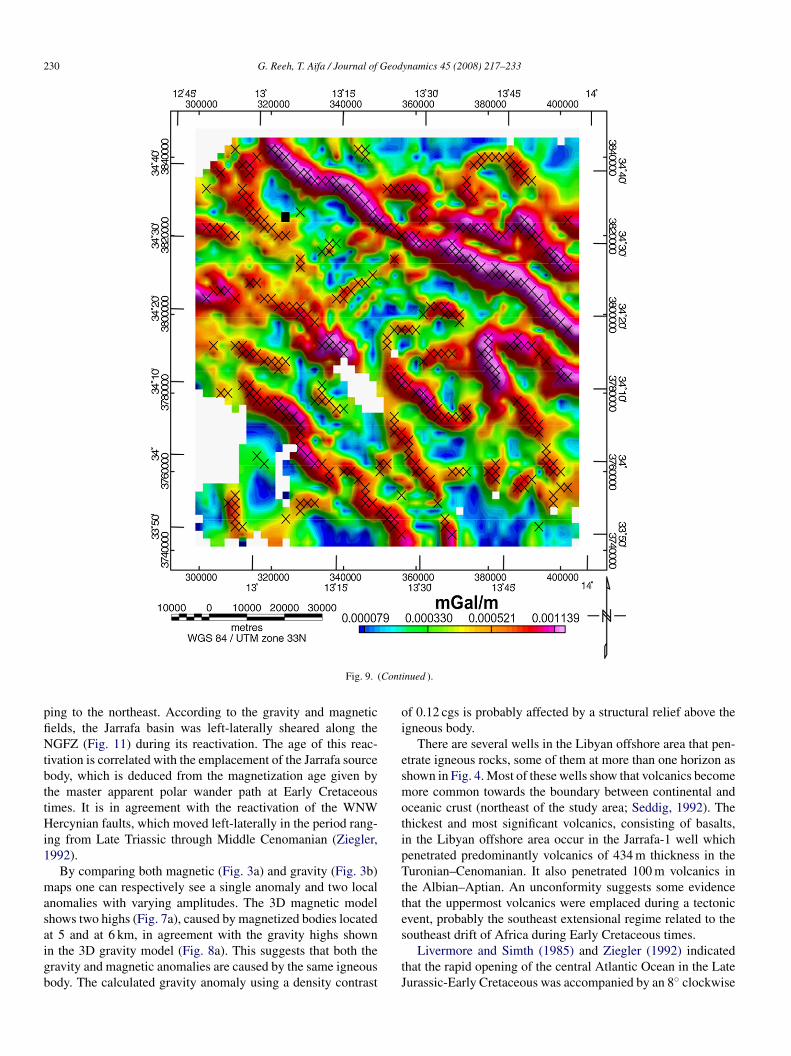
as obtained. The pattern of maxima in the horizontal gradientsrovides the outline of the Jarrafa, magnetic body (Fig. 9a).
The horizontal gradient of the gravity field, from which theaxima of the horizontal gradient are calculated with N = 3 are
lotted as crosses on the map (Fig. 9b). The sinuous traces ofaxima represent the major horizontal gradients of the gravityeld. Many of these gradients can be attributed to geologi-al bodies and major structures. The map (Fig. 9b) is ratherore complex than for the magnetic field because of the more
umerous gravity anomaly sources arising from density con-rasts within both sediments and basement.
The depth estimates to the magnetic sources were obtainedsing Euler deconvolution as described in the following equationReid et al., 1990):
x − x)∂M
∂x+ (y − y)
∂M
∂y+ (z − z)
∂M
∂z= N(B − M)
here (x0,y0,z0) is the position of the magnetic source whoseotal magnetic field M is measured at (x,y,z). The total magnetic
ttc
inued ).
eld has a regional value of B and N is the structural indexhich is equal to three for a point dipole and two for a verticalipe. More complicated bodies have indices ranging from zeroo three. The technique is based on the concept that the magneticelds of localized structures are homogeneous functions of theource coordinates and therefore satisfy Euler’s equation.
Euler deconvolution provides a powerful tool to facilitate theapping of geological contacts and faults. It was performed on
he reduced to pole total magnetic field grid using a structuralndex of zero (suitable to map geological contacts) with a win-ow size of 12 km. The structural index is a measure of the ratef change with distance of the total magnetic field. The varioustructural indices (SI) for simple models in a magnetic field are:a) 0.0 for geological contacts and faults, (b) 0.5 for thick step,c) 1.0 for sills and dykes, (d) 2.0 for pipes and (e) 3.0 for spheres.
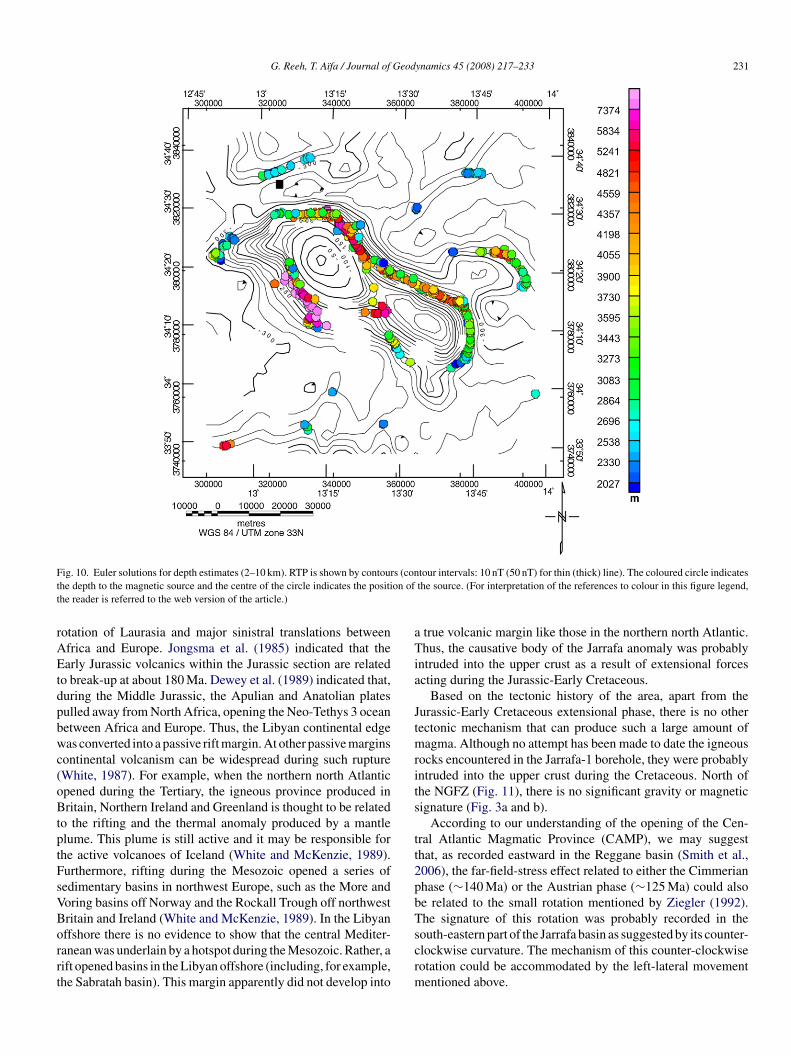
The Euler deconvolution solutions for depths ranging from 2o 10 km are plotted in Fig. 10 on a contoured image of reducedo pole total magnetic field. They are plotted as a series of colourircles, with the colour of each indicating the depth to magnetic
Geod
swwavn
tTfmtrS
4
og
tl
litAbaat(sbtm
Fl
G. Reeh, T. Aıfa / Journal of
ource and the centres indicating the position of the source. Sincee used a structural index of 0.0 to calculate the Euler solutions,e expect that the map shows the position and depth of faults
nd geological contacts formed as a result of juxtaposed rocks ofarious magnetic compositions. However, the NGFZ is probablyot a magnetized fault.
A composite map constructed from combining the results ofhe gravity and magnetic interpretations is displayed in Fig. 11.he map is self-explanatory and shows that the main tectonic
eatures in the area are oriented in a NW-SE direction in agree-ent with the mapped tectonic elements. This map shows major
rends (Fig. 11): the boundary of the causative body of the Jar-afa anomaly, Jarrafa basin, and the Sabratah basin North andouth Grabens fault zone is defined.
. Discussion and conclusions
The causative body of the Jarrafa anomaly is deeper than thatf the igneous rocks penetrated in the Jarrafa-1 borehole, sug-esting that these igneous rocks do not contribute significantly
do(c
ig. 9. (a) Location of the maxima (x) of total horizontal gradient of the pseudograocation of the maxima (x).
ynamics 45 (2008) 217–233 229
o the gravity and magnetic anomalies because of either theirow density and magnetization or their alteration.
The high amplitudes of the gravity and magnetic anoma-ies indicate that they are caused by a high-density, magnetizedgneous body that probably comprises mafic igneous rocks, ashese are the most common lithologies with these properties.ccording to the lithologies of rocks found in the Jarrafa-1orehole, the volcanics, which are composed mainly of brecciasnd basalts, occur at two different depths, shallow at 2467 mnd intermediate at 3272 m. It seems that there is a correla-ion between the power spectra depths for the shallow source2.3 km for gravity and 2.7 km for magnetics, Fig. 5) and thehallow depth from the borehole (∼2.5 km). The Jarrafa sourceody, which is located in the horst area between the SGFZ andhe NGFZ, is elongated in a NW-SE direction. It shows two
axima with two different depths (5 and 6 km) suggesting a
ipping direction to the southeast. During the Late Carbonifer-us, the NGFZ developed as a partly lateral mega-shear zoneDewey et al., 1989). The north-eastern part of the body isontrolled tectonically by the NGFZ, which is steeply dip-vity field (mGal/m). (b) Total horizontal gradient of the gravity data with the
230 G. Reeh, T. Aıfa / Journal of Geodynamics 45 (2008) 217–233
Cont
pfiNtbttHi1
masaigb
oi
esmotipTtte
Fig. 9. (
ing to the northeast. According to the gravity and magneticelds, the Jarrafa basin was left-laterally sheared along theGFZ (Fig. 11) during its reactivation. The age of this reac-
ivation is correlated with the emplacement of the Jarrafa sourceody, which is deduced from the magnetization age given byhe master apparent polar wander path at Early Cretaceousimes. It is in agreement with the reactivation of the WNWercynian faults, which moved left-laterally in the period rang-
ng from Late Triassic through Middle Cenomanian (Ziegler,992).
By comparing both magnetic (Fig. 3a) and gravity (Fig. 3b)aps one can respectively see a single anomaly and two local
nomalies with varying amplitudes. The 3D magnetic modelhows two highs (Fig. 7a), caused by magnetized bodies located
t 5 and at 6 km, in agreement with the gravity highs shownn the 3D gravity model (Fig. 8a). This suggests that both theravity and magnetic anomalies are caused by the same igneousody. The calculated gravity anomaly using a density contrasts
tJ
inued ).
f 0.12 cgs is probably affected by a structural relief above thegneous body.
There are several wells in the Libyan offshore area that pen-trate igneous rocks, some of them at more than one horizon ashown in Fig. 4. Most of these wells show that volcanics becomeore common towards the boundary between continental and
ceanic crust (northeast of the study area; Seddig, 1992). Thehickest and most significant volcanics, consisting of basalts,n the Libyan offshore area occur in the Jarrafa-1 well whichenetrated predominantly volcanics of 434 m thickness in theuronian–Cenomanian. It also penetrated 100 m volcanics in
he Albian–Aptian. An unconformity suggests some evidencehat the uppermost volcanics were emplaced during a tectonicvent, probably the southeast extensional regime related to the
outheast drift of Africa during Early Cretaceous times.Livermore and Simth (1985) and Ziegler (1992) indicatedhat the rapid opening of the central Atlantic Ocean in the Lateurassic-Early Cretaceous was accompanied by an 8◦ clockwise
G. Reeh, T. Aıfa / Journal of Geodynamics 45 (2008) 217–233 231
F s (cont on oft
rAEtdpbwc(oBtptFsVBorrt
aTia
Jtmrits
tt2pbT
ig. 10. Euler solutions for depth estimates (2–10 km). RTP is shown by contourhe depth to the magnetic source and the centre of the circle indicates the positihe reader is referred to the web version of the article.)
otation of Laurasia and major sinistral translations betweenfrica and Europe. Jongsma et al. (1985) indicated that thearly Jurassic volcanics within the Jurassic section are related
o break-up at about 180 Ma. Dewey et al. (1989) indicated that,uring the Middle Jurassic, the Apulian and Anatolian platesulled away from North Africa, opening the Neo-Tethys 3 oceanetween Africa and Europe. Thus, the Libyan continental edgeas converted into a passive rift margin. At other passive margins
ontinental volcanism can be widespread during such ruptureWhite, 1987). For example, when the northern north Atlanticpened during the Tertiary, the igneous province produced inritain, Northern Ireland and Greenland is thought to be related
o the rifting and the thermal anomaly produced by a mantlelume. This plume is still active and it may be responsible forhe active volcanoes of Iceland (White and McKenzie, 1989).urthermore, rifting during the Mesozoic opened a series ofedimentary basins in northwest Europe, such as the More andoring basins off Norway and the Rockall Trough off northwestritain and Ireland (White and McKenzie, 1989). In the Libyan
ffshore there is no evidence to show that the central Mediter-anean was underlain by a hotspot during the Mesozoic. Rather, aift opened basins in the Libyan offshore (including, for example,he Sabratah basin). This margin apparently did not develop intoscrm
tour intervals: 10 nT (50 nT) for thin (thick) line). The coloured circle indicatesthe source. (For interpretation of the references to colour in this figure legend,
true volcanic margin like those in the northern north Atlantic.hus, the causative body of the Jarrafa anomaly was probably
ntruded into the upper crust as a result of extensional forcescting during the Jurassic-Early Cretaceous.
Based on the tectonic history of the area, apart from theurassic-Early Cretaceous extensional phase, there is no otherectonic mechanism that can produce such a large amount of
agma. Although no attempt has been made to date the igneousocks encountered in the Jarrafa-1 borehole, they were probablyntruded into the upper crust during the Cretaceous. North ofhe NGFZ (Fig. 11), there is no significant gravity or magneticignature (Fig. 3a and b).
According to our understanding of the opening of the Cen-ral Atlantic Magmatic Province (CAMP), we may suggesthat, as recorded eastward in the Reggane basin (Smith et al.,006), the far-field-stress effect related to either the Cimmerianhase (∼140 Ma) or the Austrian phase (∼125 Ma) could alsoe related to the small rotation mentioned by Ziegler (1992).he signature of this rotation was probably recorded in the
outh-eastern part of the Jarrafa basin as suggested by its counter-lockwise curvature. The mechanism of this counter-clockwiseotation could be accommodated by the left-lateral movemententioned above.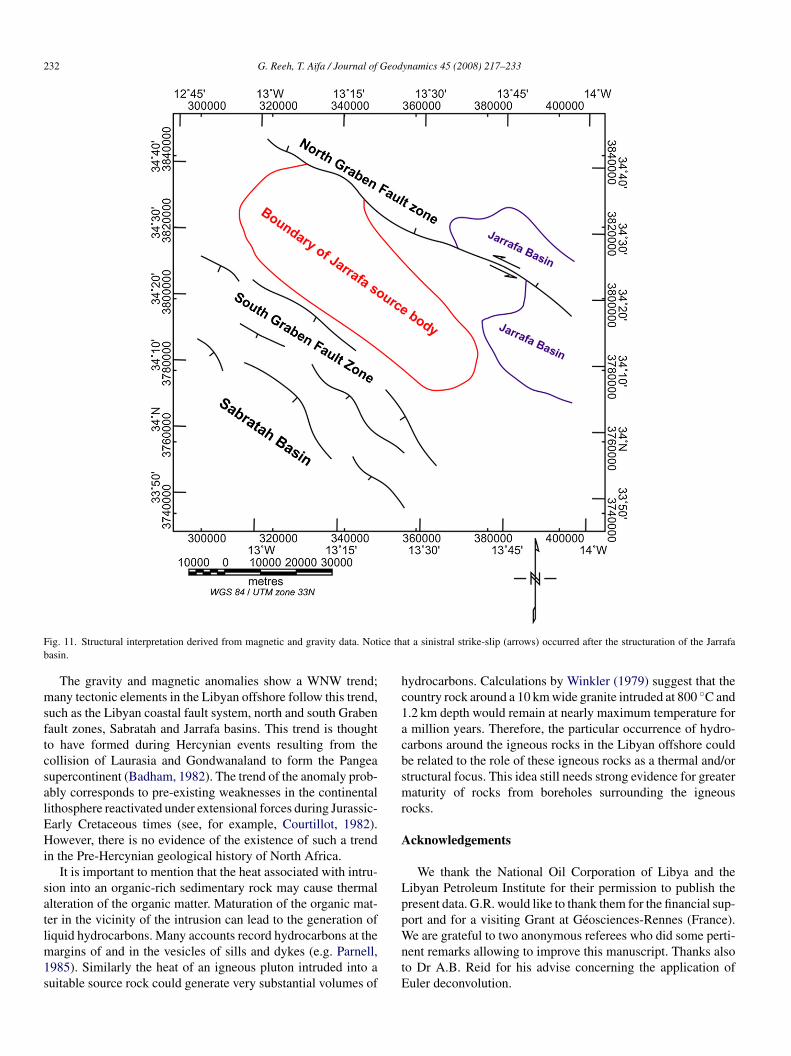
232 G. Reeh, T. Aıfa / Journal of Geodynamics 45 (2008) 217–233
F ice thb
msftcsalEHi
satlm1s
hc1acbsmr
A
Lpp
ig. 11. Structural interpretation derived from magnetic and gravity data. Notasin.
The gravity and magnetic anomalies show a WNW trend;any tectonic elements in the Libyan offshore follow this trend,
uch as the Libyan coastal fault system, north and south Grabenault zones, Sabratah and Jarrafa basins. This trend is thoughto have formed during Hercynian events resulting from theollision of Laurasia and Gondwanaland to form the Pangeaupercontinent (Badham, 1982). The trend of the anomaly prob-bly corresponds to pre-existing weaknesses in the continentalithosphere reactivated under extensional forces during Jurassic-arly Cretaceous times (see, for example, Courtillot, 1982).owever, there is no evidence of the existence of such a trend
n the Pre-Hercynian geological history of North Africa.It is important to mention that the heat associated with intru-
ion into an organic-rich sedimentary rock may cause thermallteration of the organic matter. Maturation of the organic mat-er in the vicinity of the intrusion can lead to the generation of
iquid hydrocarbons. Many accounts record hydrocarbons at theargins of and in the vesicles of sills and dykes (e.g. Parnell,985). Similarly the heat of an igneous pluton intruded into auitable source rock could generate very substantial volumes of
WntE
at a sinistral strike-slip (arrows) occurred after the structuration of the Jarrafa
ydrocarbons. Calculations by Winkler (1979) suggest that theountry rock around a 10 km wide granite intruded at 800 ◦C and.2 km depth would remain at nearly maximum temperature formillion years. Therefore, the particular occurrence of hydro-
arbons around the igneous rocks in the Libyan offshore coulde related to the role of these igneous rocks as a thermal and/ortructural focus. This idea still needs strong evidence for greateraturity of rocks from boreholes surrounding the igneous
ocks.
cknowledgements
We thank the National Oil Corporation of Libya and theibyan Petroleum Institute for their permission to publish theresent data. G.R. would like to thank them for the financial sup-ort and for a visiting Grant at Geosciences-Rennes (France).
e are grateful to two anonymous referees who did some perti-ent remarks allowing to improve this manuscript. Thanks alsoo Dr A.B. Reid for his advise concerning the application ofuler deconvolution.
Geod
R
A
B
B
B
B
B
B
B
B
B
C
C
C
C
D
D
D
F
F
F
F
J
K
L
P
P
P
R
S
S
S
W
W
W
G. Reeh, T. Aıfa / Journal of
eferences
llan, T.D., Morelli, C., 1971. Geophysical study of the Mediterranean Sea.Boll. Geofisica ed Applicata XIII (No. 50), 100–142.
adham, J.P.N., 1982. Strike-slip Orogens-an explanation for the Hercynides.J. Geol. Soc. Lond. 139, 493–504.
aranov, V., 1957. A new method for interpretation of aeromagnetic maps:pseudo-gravity anomalies. Geophysics 22, 359–383.
arberi, F., Borsi, S., Ferrara, G., Innocennti, F., 1969. Strontium isotopic com-position of some recent basic vulcanite of the southern Tyrrhenian Sea andSicily channel. Contr. Miner. Petrol. 23, 157–172.
esse, J., Courtillot, V., 1991. Revised and synthetic apparent polar wander pathsof the African, Eurasian, North American and Indian plates, and true polarwander since 200 Ma. J. Geophys. Res. 96 (B3), 4029–4050.
iju-Duval, B., Dercourt, J., Le Pichon, X., 1977. From the Tethys Ocean to theMediterranean seas: a plate tectonic model of the evolution of the westernAlpine system. In: Biju-Duval, B., Montadert, L. (Eds.), Structural historyof the Mediterranean Basins. Editions Technip, Paris, pp. 143–164.
ilim, F., Ates, A., 1999. A computer program to estimate the source body mag-netization direction from magnetic and gravity anomalies. Comput. Geosci.V (25), 231–240.
ilim, F., Ates, A., 2004. An enhanced method for estimation of body magne-tization direction from pseudogravity and gravity data. Comput. Geosci. V(30), 161–171.
ishop, W.F., 1975. Geology of Tunisia and adjacent parts of Algeria and Libya.Am. Assoc. Petrol. Geol. Bull. 59 (No 3), 413–450.
lakely, R.J., Simpson, R.W., 1986. Approximating edges of source bodies frommagnetic or gravity anomalies. Geophysics 51 (No 7), 1494–1498.
ordell, L., Grauch, V.J.S., 1982. Reconciliation of the discrete and integralFourier transforms. Geophysics 47 (No 2), 237–243.
ordell, L., Grauch, V.J.S., 1985. Mapping basement magnetization zones fromaeromagnetic data in the San Juan Basin, New Mexico. In: Hinze, W.J.(Ed.), The Utility of Regional Gravity and Magnetic Anomaly Maps. Soc.Exp. Geophys., Tulsa, Oklahoma, pp. 181–197.
ordell, L., Henderson, R.G., 1968. Iterative three-dimensional solution of grav-ity anomaly data using a digital computer. Geophysics 33, 596–601.
ourtillot, V., 1982. Propagating rifts and continental breakup. Tectonics 1,239–256.
ewey, F.J., Pitman, C.W., Ryan, F.B.W., Bonnin, J., 1973. Plate tectonics andthe evolution of the Alpine system. Bull. Geol. Soc. Am. 84, 3137–3180.
ewey, J.F., Booth, J.E., Faux, F.A., Johnson, W.R., Kenzie, J.K., McDowell,E.H., El Ghoul, A., 1989. Tectonic and Basin Evolution of the Libyan Off-shore Region in its Central Mediterranean Tectonic Setting. Internal report
prepared under contract for Sirte Oil Company, Brega, Libya, p. 254.i Paola, G.M., 1973. The Island of Linosa (Sicily channel). Bull. Volcan. 37,149–174.
inetti, I., Morelli, C., 1973. Geophysical exploration of the Mediterranean Sea.Boll. Geof. Teor. Appl. 15, 263–341.
Z
Z
ynamics 45 (2008) 217–233 233
inetti, I., 1982. Structure, stratigraphy and evolution of central Mediterranean.Boll. Geof. Teor. Appl. 24, 247–312.
inetti, I., 1984. Geophysical study of the Sicily Channel rift zone. Boll. Geof.Teor. Appl. 26, 1–28.
inetti, I., 1985. Structure and evolution of the central Mediterranean (Pelagianand Ionian Seas). In: Stanley, D.J., Wezel, F.C. (Eds.), Geological evolutionof the Mediterranean basin. Springer-Verlag, pp. 215–230.
ongsma, D., Van Hinte, J.E., Woodside, J.M., 1985. Geologic structure andneotectonics of the North Africa Continental Margin south of Sicily. Mar.Petrol. Geol. 2, 156–179.
earey, P., 1991. A possible source of the south-central England magneticanomaly: basaltic rocks beneath the London Platform. J. Geol. Soc. Lond.148, 775–780.
ivermore, R.A., Simth, A.G., 1985. Some boundary conditions for the evolutionof the Mediterranean Region. In: Stanley, D.J., Wezel, F.C. (Eds.), Geolog-ical Evolution of the Mediterranean Basin. Springer-Verlag, New York, pp.83–98.
arnell, J., 1985. Hydrocarbon source rocks, reservoir rocks and migration inthe Orcadian Basin. Scott. J. Geol. 21, 321–336.
avoni, N., 1993. Pattern of mantle convection and Pangaea break-up, as revealedby the evolution of the African plate. J. Geol. Soc. Lond. 150, 953–964.
itman, W.C., Cochran, J.R., Ryan, W.B.F., Ladd, J.W., 1981. Evolution of theLibyan margin, Annex II-6. A study of the Libyan Tunisian continental shelf,1–12.
eid, A.B., Allsop, J.M., Granser, H., Millet, A.J., Somerton, I.W., 1990.Magnetic interpretation in three dimensions using Euler deconvolution. Geo-physics 55 (1), 80–91.
eddig, H.M., 1992. Sedimentology and basin analysis: part of NW Libyanoffshore. PhD Thesis, University of Wales, 272 p.
mith, B., Derder, M.E.M., Henry, B., Bayou, B., Amenna, M., Djellit, H.,Yelles, A.K., Garces, M., Beamud, E., Callot, J.P., Eschard, R., Chambers,A., Aıfa, T., Aıt Ouali, R., Gandriche, H., 2006. Relative importance of theHercynian and post-Jurassic tectonic phases in the Saharan platform: a Pale-omagnetic study of Jurassic sills in the Reggane basin (Algeria). Geophys.J. Int. 167, 380–396, doi:10.1111/j.1365-246X.2006.03105.x.
pector, A., Grant, F.S., 1970. Statistical models for interpreting aeromagneticdata. Geophysics 35, 293–302.
hite, N., 1987. Nature of lithospheric extension in the North Sea. Geology 17,111–114.
hite, R., McKenzie, D., 1989. Magmatism at rift zones: the generation ofvolcanic continental margins and flood basalts. J. Geophys. Res. 94, 7685–7722.
inkler, H.G., 1979. Petrogenesis of Metamorphic Rocks. Springer-Verlag,
Berlin, p. 348.arudski, E.F.K., 1972. The Strait of Sicily-a geophysical study. Revue deGeographie physique et de Geologie dynamique 14, 11–28.
iegler, P.A., 1992. Plate tectonics, plate moving mechanisms and rifting.Tectonophysics 215, 9–34.