Lithosphere structures of northeast Tibetan Plateau and their geodynamic implications
11
Journal of Geodynamics 52 (2011) 432–442 Contents lists available at ScienceDirect Journal of Geodynamics jo u r n al hom epage : http://www.elsevier.com/locate/jog Lithosphere structures of northeast Tibetan Plateau and their geodynamic implications Mei Feng a,∗ , Meijian An a , Wenjin Zhao b , Guangqi Xue c , James Mechie d , Yue Zhao a a Institute of Geomechanics, Chinese Academy of Geological Sciences, Beijing 100081, China b Chinese Academy of Geological Sciences, Beijing 100037, China c Institute of Mineral Resources, Chinese Academy of Geological Sciences, Beijing 100037, China d Deutsches GeoForschungs Zentrum – GFZ, Section “Geophysical Deep Sounding”, Telegrafenberg, 14473 Potsdam, Germany a r t i c l e i n f o Article history: Received 26 October 2010 Received in revised form 27 June 2011 Accepted 3 July 2011 Available online 14 July 2011 Keywords: Lithospheric velocity structure Lithosphere stacking Bayan Har Terrane NE Tibetan Plateau a b s t r a c t In the past ten years, three major earthquakes with devastating impacts have taken place along the margins of the Bayan Har Terrane in NE Tibetan Plateau, China. To understand the geodynamic back- ground controlling the NE Tibetan Plateau, we processed a large amount of broad-band seismic data in and around the Tibetan Plateau, and constructed a three dimensional lithospheric S-wave velocity model using a regional surface-wave tomographic tool. The velocity model produces images of important struc- tures. First, a weak discontinuity at ∼110 km depth seems to exist, which separates the abnormally thick Tibetan upper-mantle lithosphere into two layers. Second, the upper-mantle lithospheric veloc- ity structures have certain correlations with seismicity and fault activity. Regions with a low-velocity upper-mantle lithosphere have a stronger seismicity than regions with a high-velocity upper-mantle lithosphere. The earthquake focal mechanisms or faults in the interior of the low-velocity regions typi- cally display normal faulting with a strike-slip component, while reverse faults, sometimes with a small strike-slip component, typically occur in the low-to-high velocity transition zone. The correlation of seis- micity and fault activity with upper-mantle lithospheric velocity anomalies suggests that the strength of the upper-mantle lithosphere can control the deformation mode of the overlying crust where most earthquakes occur. © 2011 Elsevier Ltd. All rights reserved. 1. Introduction In the past ten years (2000–2010), the Chinese mainland has been struck by three major earthquakes (indicated as beach balls in Fig. 1) with devastating impacts: the 2001 Mw 7.8 Kunlun earth- quake produced a surface rupture zone nearly 400 km in length (Lin et al., 2002), the 2008 Mw 7.9 Wenchuan earthquake killed more than 80,000 people, and the 2010 Mw 6.9 Yushu earthquake killed more than 2000. These earthquakes were all located on the edges of the Bayan Har Terrane (also called the Songpan-Ganze Ter- rane) in the NE Tibetan Plateau. Thus a study on the lithospheric structures of the Bayan Har Terrane and its surrounding regions is important to understand the geodynamic background controlling the NE Tibetan Plateau, including the seismogenic mechanisms of these earthquakes. The dark circles in Fig. 1 are earthquakes with a magnitude big- ger than 4.0 that have occurred in the study region over the past 40 years (data are from the USGS and Chinese CSN catalogues). As ∗ Corresponding author. Tel.: +86 10 13683690618; fax: +86 10 68422326. E-mail address: mei feng [email protected] (M. Feng). the active period of a seismogenic fault can be hundreds of years, earthquakes that have occurred over a short time such as 40 years cannot be taken as reliable indicators of the intensity of seismicity along different faults. For instance, there are more earthquakes con- centrated along the Longmen Shan Fault than on the other faults in Fig. 1, but that does not mean that the Longmen Shan Fault is more active than other faults in a longer term, especially since most of these earthquakes are aftershocks of the 2008 Wenchuan earth- quake. However, the seismicity within a tectonic block shows some correlation with the block’s fragmentation, density of secondary faults, and relative intensity of tectonic activity. As shown in Fig. 1, most earthquakes of the Bayan Har Terrane have occurred along its boundaries, while the interior of the terrane has experienced fewer earthquakes than the Qiangtang Terrane to the south of it, probably suggesting that the Bayan Har Terrane is, in itself, more stable than the Qiangtang Terrane, but its boundaries are very active. The Bayan Har Terrane in the NE Tibetan Plateau has a com- plex evolution history. In the Paleozoic and Mesozoic, its tectonic evolution was mainly controlled by the spreading and subduction of the Tethys Sea plate (Xiao and Li, 2000). It amalgamated with the Eurasian continent (Kunlun-Qaidam Terrane), which was to the north of it, during the late Permian, and then collided and amalga- 0264-3707/$ – see front matter © 2011 Elsevier Ltd. All rights reserved. doi:10.1016/j.jog.2011.07.002
-
Upload
independent -
Category
Documents
-
view
2 -
download
0
Transcript of Lithosphere structures of northeast Tibetan Plateau and their geodynamic implications
Li
Ma
b
c
d
a
ARRAA
KLLBN
1
biq(mkersitt
g4
0d
Journal of Geodynamics 52 (2011) 432– 442
Contents lists available at ScienceDirect
Journal of Geodynamics
jo u r n al hom epage : ht tp : / /www.e lsev ier .com/ locate / jog
ithosphere structures of northeast Tibetan Plateau and their geodynamicmplications
ei Fenga,∗, Meijian Ana, Wenjin Zhaob, Guangqi Xuec, James Mechied, Yue Zhaoa
Institute of Geomechanics, Chinese Academy of Geological Sciences, Beijing 100081, ChinaChinese Academy of Geological Sciences, Beijing 100037, ChinaInstitute of Mineral Resources, Chinese Academy of Geological Sciences, Beijing 100037, ChinaDeutsches GeoForschungs Zentrum – GFZ, Section “Geophysical Deep Sounding”, Telegrafenberg, 14473 Potsdam, Germany
r t i c l e i n f o
rticle history:eceived 26 October 2010eceived in revised form 27 June 2011ccepted 3 July 2011vailable online 14 July 2011
eywords:ithospheric velocity structureithosphere stackingayan Har Terrane
a b s t r a c t
In the past ten years, three major earthquakes with devastating impacts have taken place along themargins of the Bayan Har Terrane in NE Tibetan Plateau, China. To understand the geodynamic back-ground controlling the NE Tibetan Plateau, we processed a large amount of broad-band seismic data inand around the Tibetan Plateau, and constructed a three dimensional lithospheric S-wave velocity modelusing a regional surface-wave tomographic tool. The velocity model produces images of important struc-tures. First, a weak discontinuity at ∼110 km depth seems to exist, which separates the abnormallythick Tibetan upper-mantle lithosphere into two layers. Second, the upper-mantle lithospheric veloc-ity structures have certain correlations with seismicity and fault activity. Regions with a low-velocityupper-mantle lithosphere have a stronger seismicity than regions with a high-velocity upper-mantle
E Tibetan Plateau lithosphere. The earthquake focal mechanisms or faults in the interior of the low-velocity regions typi-cally display normal faulting with a strike-slip component, while reverse faults, sometimes with a smallstrike-slip component, typically occur in the low-to-high velocity transition zone. The correlation of seis-micity and fault activity with upper-mantle lithospheric velocity anomalies suggests that the strengthof the upper-mantle lithosphere can control the deformation mode of the overlying crust where mostearthquakes occur.
. Introduction
In the past ten years (2000–2010), the Chinese mainland haseen struck by three major earthquakes (indicated as beach balls
n Fig. 1) with devastating impacts: the 2001 Mw 7.8 Kunlun earth-uake produced a surface rupture zone nearly 400 km in lengthLin et al., 2002), the 2008 Mw 7.9 Wenchuan earthquake killed
ore than 80,000 people, and the 2010 Mw 6.9 Yushu earthquakeilled more than 2000. These earthquakes were all located on thedges of the Bayan Har Terrane (also called the Songpan-Ganze Ter-ane) in the NE Tibetan Plateau. Thus a study on the lithospherictructures of the Bayan Har Terrane and its surrounding regions ismportant to understand the geodynamic background controllinghe NE Tibetan Plateau, including the seismogenic mechanisms ofhese earthquakes.
The dark circles in Fig. 1 are earthquakes with a magnitude big-er than 4.0 that have occurred in the study region over the past0 years (data are from the USGS and Chinese CSN catalogues). As
∗ Corresponding author. Tel.: +86 10 13683690618; fax: +86 10 68422326.E-mail address: mei feng [email protected] (M. Feng).
264-3707/$ – see front matter © 2011 Elsevier Ltd. All rights reserved.oi:10.1016/j.jog.2011.07.002
© 2011 Elsevier Ltd. All rights reserved.
the active period of a seismogenic fault can be hundreds of years,earthquakes that have occurred over a short time such as 40 yearscannot be taken as reliable indicators of the intensity of seismicityalong different faults. For instance, there are more earthquakes con-centrated along the Longmen Shan Fault than on the other faultsin Fig. 1, but that does not mean that the Longmen Shan Fault ismore active than other faults in a longer term, especially since mostof these earthquakes are aftershocks of the 2008 Wenchuan earth-quake. However, the seismicity within a tectonic block shows somecorrelation with the block’s fragmentation, density of secondaryfaults, and relative intensity of tectonic activity. As shown in Fig. 1,most earthquakes of the Bayan Har Terrane have occurred along itsboundaries, while the interior of the terrane has experienced fewerearthquakes than the Qiangtang Terrane to the south of it, probablysuggesting that the Bayan Har Terrane is, in itself, more stable thanthe Qiangtang Terrane, but its boundaries are very active.
The Bayan Har Terrane in the NE Tibetan Plateau has a com-plex evolution history. In the Paleozoic and Mesozoic, its tectonic
evolution was mainly controlled by the spreading and subductionof the Tethys Sea plate (Xiao and Li, 2000). It amalgamated withthe Eurasian continent (Kunlun-Qaidam Terrane), which was to thenorth of it, during the late Permian, and then collided and amalga-
M. Feng et al. / Journal of Geodynamics 52 (2011) 432– 442 433
F with mm akes.
l n Fau
mdtPS1(os
rvssiarT
2
eoti3ppcHaro
ig. 1. Major geotectonic units in the NE Tibetan Plateau, and historic earthquakes
echanisms of the 2001 Kunlun, the 2008 Wenchuan, and the 2010 Yushu earthquocations of the S-wave velocity transects shown in Fig. 7. LMSF is the Longmen Sha
ated with the Qiangtang Terrane, which was to the south of it,uring the late Triassic and early Jurassic (Dewey et al., 1988). Inhe Cenozoic, the Bayan Har Terrane, and indeed the entire Tibetanlateau, was mainly influenced by the Indian–Eurasian collision.ince the Quaternary, the Longmen Shan Fault (Burchfiel et al.,995; Densmore et al., 2007), the Ganze-Yushu-Fenghuoshan FaultXu et al., 2008), and the East Kunlun Fault (Zhou et al., 2009), allf which lie along the boundaries of Bayan Har Terrane, becameeismically active.
To help us understand the present regional geodynamic envi-onment, we construct a three-dimensional lithospheric S-waveelocity model for the NE Tibetan Plateau, by applying a regionalurface-wave tomographic tool to a large amount of broad-bandeismic data. We then proceed to extract deep-seated tectonicnformation, as revealed by the S-wave velocity structure, and thennalyze the possible geodynamic settings that control the occur-ence of strong earthquakes along the boundaries of the Bayan Harerrane.
. Regional surface-wave tomography
Surface-wave tomography is one of the preferred methods forxploring lithospheric structure because of its better vertical res-lution in the lithosphere compared with teleseismic body-waveomography. In most previous surface-wave tomographic stud-es, inversions of surface-wave dispersion measurements for a-D S-wave velocity model have been partitioned into two steps:eriod-by-period 2-D tomographic inversion for regionalized dis-ersion curves, and cell-by-cell inversion of regionalized dispersionurves for 1-D S-wave velocity profiles (e.g., Ritzwoller et al., 2002;
uang et al., 2003). This partitioned approach is not very efficientnd cannot include 3-D a priori constraints to improve structureesolution, which may be one reason why previous regional studiesn the Tibetan Plateau, using traditional surface-wave tomogra-agnitudes bigger than 4.0 (black circles) since 1970. Beach balls indicate the focalPink arrows indicate the current direction of motion of the faults. Red lines are thelt.
phy (e.g., Su et al., 2002; Zhang et al., 2007), could not clearlydelineate different tectonic terranes. Feng and An (2010) devel-oped an efficient surface-wave tomographic method that combinesthe traditional partitioned two-step inversion equations into oneformulation to directly invert surface-wave dispersion measure-ments for a 3-D S-wave velocity model. The method enablesinclusion of 3-D a priori constraints, and of both regional (with bothevents and stations located within the study region) and teleseis-mic (with either epicenters or stations located outside the studyregion) measurements. The method has been successfully appliedto continental-scale lithospheric studies of the Chinese mainland(Feng and An, 2010), and regional-scale studies of the North ChinaCraton (An et al., 2009). We thus adopt the surface-wave tomo-graphic method developed by Feng and An (2010) in the presentstudy. A detailed description on the mathematic derivation of themethodology can be found in Feng and An (2010).
More and more temporary broad-band seismic arrays (e.g.,INDEPTH and Hi-CLIMB) have been deployed in the hinterland ofthe Tibetan Plateau over the past years (e.g., Zhao et al., 1993;Nelson et al., 1996; Nabelek et al., 2005), and the results haveprovided important evidence for deep structures and the tectonicevolution of the regions near the seismic arrays (e.g., Kind et al.,2002; Wittlinger et al., 2009). However, most of the arrays havebeen arranged in a line, and the research results cannot prop-erly cover the Tibetan Plateau in three-dimensions. Even so, asmore seismic arrays are deployed, there has been an improve-ment in the lateral distribution of seismic stations on the plateau,which is essential for a 3-D tomographic study. For our work here,Rayleigh-wave group velocities are processed using a multiple fil-tering technique for these publicly open and non-publicly openseismic data, including those recorded by ∼200 Hi-CLIMB (Nabelek
et al., 2005) and ∼50 INDEPTH-IV portable seismic stations (Zhaoet al., 2008), and tens of permanent seismic stations belonging tothe Yunnan and Sichuan Provincial Seismic Networks of China. Inaddition, we included the group-velocity data for China previously
434 M. Feng et al. / Journal of Geodynamics 52 (2011) 432– 442
F circlen picenw ent da
pfairpeb
daaatarswoepStvlswant
feAaaDl
ig. 2. Observational data showing (a) path density at period of 10 s, triangles andumber of group-velocity measurements at different periods; and (c) the average eith rays completely within the study region, and dashed lines (teleseismic) repres
rocessed by An et al. (2009) and Feng and An (2010). All these dataorm the best lateral data coverage to date for the Bayan Har Terranend its surrounding regions. The seismic stations and events usedn this study are shown in Fig. 2a as red triangles and yellow circles,espectively. The color image indicates the seismic-ray density at aeriod of 10 s, defined as the number of measurements intersectingach 0.4◦ × 0.4◦ (∼40 km × 44 km) area. The average ray density isetter than ∼150 within most of the pink rectangle region.
According to the number of group-velocity measurements atifferent periods, we ultimately use group-velocity measurementst periods of 5–10 s with an interval of 1 s, at periods of 10–20 s withn interval of 2 s, at periods of 20–60 s with an interval of 5 s, andt periods of 60–150 s with an interval of 10 s. Fig. 2b and c respec-ively shows the total number of group-velocity measurements andverage epicentral distances at different periods, where solid linesepresent regional measurements with rays completely within thetudy region, and dashed lines represent teleseismic measurementsith rays partly within the study region. At 10 s period, the number
f regional group-velocity measurements is 9378 and the averagepicentral distance is ∼7.6◦ (∼800 km). The large content of short-eriod data will hopefully result in a better resolved lithospheric-wave velocity model for the Bayan Har Terrane. According tohe data coverage and period content of our surface-wave group-elocity measurements, we model an area as shown in Fig. 2a butimit our following discussion to the pink rectangle region whereeismic ray density is good enough. The 3-D model is parameterizedith a grid spacing of 0.4◦ in both longitude and latitude, and with
variable layer thickness in the vertical direction. The layer thick-ess is 5 km for depths less than 170 km, 10 km for depths from 170o 250 km, and 50 km for depths from 250 to 300 km.
To decrease the degree of nonlinearity of surface-wave inversionor S-wave velocity, it is important to start from a 3-D refer-nce model that is close to being realistic in the 3-D inversion.s the Moho is the sharpest discontinuity within the lithosphere
nd surface-waves are more sensitive to S-wave velocity than todiscontinuity, the primary consideration in constructing the 3- reference model is crustal thickness or Moho depth below sea
evel rather than S-wave velocity. We thus collected/digitized point
s are seismic stations and epicenters within the study region, respectively; (b) thetral distance at different periods. Solid lines in (b) and (c) (regional) represent datata with rays partly within the study region.
crustal thickness constraints from the published literature (Tenget al., 1983; Hirn et al., 1984; Cui et al., 1995; Zhao et al., 2001,2006; Vergne et al., 2002; Wittlinger et al., 2004, 2009; Zhang andKlemperer, 2005; Li et al., 2006b; Liu et al., 2006, 2009; Shi et al.,2009; Wittlinger et al., 2009; Zhang et al., 2009; Mechie et al., 2011)and compiled a 3-D crustal thickness model for the study region(see Fig. 3). Crustal thickness for the INDEPTH-IV stations is esti-mated in the present study using the receiver function techniqueof Yuan et al. (1997). The grey and black circles in Fig. 3 denote loca-tions where we have crustal thickness values from passive seismicreceiver function studies and from controlled-source seismic stud-ies, respectively. Regions without a priori point crustal thicknessvalues are mainly constrained by the 3-D model of Li et al. (2006a)and by CRUST2.0 (Bassin et al., 2000). As to date there is no wellestablished 3-D lithospheric S-wave velocity model for Tibet, weultimately created the 3-D reference model by combining our com-piled crustal-thickness model with the S-wave velocities of IASP91(Kennett and Engdahl, 1991).
3. Model appraisal
The data fits between estimated and observed group veloci-ties are qualitative indicators in evaluating the final inverted 3-Dtomographic model. Fig. 4 shows four example dispersion-curvefits between observed and estimated group velocities. The disper-sion curves estimated from the inverted model (solid lines) showa reasonable fit to the observed dispersion curves (triangles). Fur-thermore, as expected, the data fits of the inverted model are betterthan the fits of the reference model (dotted lines).
We routinely carried out checkerboard tests to show the spa-tial resolving power of the final model. To test lateral and verticalresolving power simultaneously, we set a 3-D synthetic modelwith horizontally- and vertically–alternating checkers. The input
S-wave velocities were set as varying by ±7% relative to the refer-ence model. As the surface waves of different periods have varyingsensitivity and lateral resolution at different depths, we performedsynthetic tests with three different checker sizes: 2◦ × 2◦ × 4 layers
M. Feng et al. / Journal of Geodynamics 52 (2011) 432– 442 435
Fig. 3. Crustal thickness model compiled by the present study by collecting/digitizing point crustal thickness constraints from the published literature. The grey and blackcircles denote locations where we have crustal thickness values from passive seismic studies and from controlled-source seismic studies, respectively.
2.5
3.0
3.5
4.0
Gro
up v
eloc
ity (k
m/s
)
1 2
2.5
3.0
3.5
4.0
Gro
up v
eloc
ity (k
m/s
)
14012010080604020
Period (s)
3
14012010080604020
Period (s)
4
12
3
4
Fig. 4. Four example data fits between observed and predicted group-velocity dispersion curves. The dispersion curve number in the upper left of each frame correspondst observc ectivt
i34nm
ea
o the ray path indicated by the same number in the inset map. Triangles denote
urves from the inverted S-wave velocity model and from the reference model, resphe four dispersion curves.
n the x, y and z directions (∼200 km × 222 km × 20 km; Fig. 5a),.2◦ × 3.2◦ × 6 layers (∼320 km × 350 km × 30 km; Fig. 5b), and◦ × 4◦ × 14 layers (∼400 km × 440 km × 70 km; Fig. 5c). Randomoise was added to all the synthetic group-velocity measure-
ents.For most of the study region, the model retrieved 2◦ × 2◦ check-rs down to 50 km depth, 3.2◦ × 3.2◦ checkers down to 70 km depth,nd 4◦ × 4◦ checkers down to 200 km depth. Lebedev and Nolet
ed dispersion curves, while solid and dotted lines represent predicted dispersionely. The inset map shows the paths, stations (triangles), and epicenters (circles) for
(2003) suggested that the actual resolution is half of the recov-ered checker size. Therefore, the average lateral resolution lengthin the target study region is ∼1◦ (∼110 km) down to ∼50 km depth,∼1.6◦ (∼180 km) down to ∼50 km, and ∼2◦ (∼220 km) down to
∼200 km. Vertically, the average resolution is ∼10 km down to∼50 km depth, ∼15 km down to ∼70 km and ∼35 km down to∼200 km. The resolution decreases with depth and in marginalregions.
436 M. Feng et al. / Journal of Geodynamics 52 (2011) 432– 442
F . The sv slicem the se
oressrigaaassittitd
4
ds
ig. 5. Lateral and vertical S-wave velocity slices of the checkerboard test resultsertically), (b) 3.2◦ × 3.2◦ × 6 layers, and (c) 4◦ × 4◦ × 14 layers. The odd rows showodel. The locations of vertical cross-sections are shown in the horizontal slices in
To test the resolving ability for realistic structures, we carriedut hypothesis testing for a profile crossing through our studyegion. Fig. 6 shows the input and retrieved profiles of the hypoth-sis testing results. The structures of the input model (Fig. 6a) areet to be similar to the structures of our final inverted model on theame profile (to be shown in Fig. 7c). The retrieved model (Fig. 6b)ecovers most of the structural features of the input model, includ-ng the thickness and depth extensions of the layers or plates, theently dipping angle of the simulated Indian plate, the relativenomaly strength of the different plates (e.g., the Indian plate has
stronger positive anomaly than the paleo-Asian plate) and thepproximate location of the low-to-high anomaly transition. As 3-Dmoothing constraints have been applied in the tomographic inver-ion to stabilize the inversion, the low-to-high anomaly transitionn the retrieved model becomes wider than in the input model, andhe anomaly amplitude in the retrieved model is smaller than inhe input model. However, the anomaly pattern of the input models very well recovered by the retrieved model. We therefore believehat our dataset and inversion system is able to resolve structuresown to ∼200 km depth reliably.
. S-wave velocity structures
Here, we extract three S-wave velocity transects which crossifferent parts of the NE Tibetan Plateau (Fig. 7, transect locationhown in Fig. 1). The S-wave velocities derived from the surface-
izes of 3-D checkers are (a) 2◦ × 2◦ × 4 layers (longitude and latitude 2◦; 4 layerss through the input model, and the even rows show slices through the retrievedcond row.
wave tomography are expressed as perturbations in percentagesrelative to the reference model.
Fig. 7a is a NE striking S-wave velocity transect (transect kk′)perpendicular to the north boundary of the Bayan Har Terrane,the East Kunlun Fault. From south to north, the profile crossesthrough the Lhasa, Qiangtang, Bayan Har, and Kunlun-Qaidam ter-ranes. At the top of the transect is exaggerated topography. Thetransect is generally dominated by low velocities (warm colors). Atdepths of ∼110–200 km (beneath the pink dashed line in Fig. 7a),the Lhasa, southern Qiangtang, and Kunlun-Qaidam terranes havehigher velocities than the northern Qiangtang and Bayan Har ter-ranes. The relatively high velocity beneath the Lhasa and southernQiangtang terranes extends in a nearly horizontal direction, possi-bly reflecting the front of the Indian Plate as it subducts beneaththe plateau, while the relatively high velocity beneath the Kunlun-Qaidam terrane possibly reflects the paleo-Asian lithosphere. Thenorthern Qiangtang and Bayan Har terranes are characterized byvery low velocities, and are bordered by the above mentioned twoareas of relatively high velocity. Along the INDEPTH-III seismic pro-file, Tilmann et al. (2003) imaged such strong low upper-mantlevelocities beneath the Qiangtang terrane in their teleseismic tomo-graphic study and correlated them to an upwelling. As our regional
model only covers depths above 200 km and the low-velocity areaextends not as a narrow belt but is very wide, we prefer corre-lating the low velocity with a gap or high-temperature extrusionsbetween the converging Indian and Asian lithospheres (Feng et al.,
M. Feng et al. / Journal of Geodynamics 52 (2011) 432– 442 437
rossin
2a
ptevaaFvutqB
pGm(hiTLbvmbmTuJsnb
Fig. 6. Input (a) and retrieved structures (b) of hypothesis testing for a profile c
010). The Kunlun earthquake occurred above a low-velocity crustnd upper mantle (Fig. 7a).
Fig. 7b is a NW striking S-wave velocity transect (transect ww’)erpendicular to the east boundary of the Bayan Har Terrane,he Longmen Shan Fault. This transect mainly crosses the east-rn Bayan Har Terrane and the Sichuan Basin. The topographyaries markedly across the Longmen Shan Fault. Both the crustnd the upper-mantle lithosphere have strong lateral velocity vari-tions. The Bayan Har Terrane, northwest of the Longmen Shanault, has a low-velocity layer above ∼150 km, and a weak high-elocity layer underneath. For the Sichuan Basin, both the crust andpper-mantle lithosphere show marked high velocities, except forhe shallow low-velocity sedimentary layer. The Wenchuan earth-uake occurred on the transition zone between the low-velocityayan Har Terrane and the high-velocity Yangtze Craton (Fig. 7b).
Fig. 7c is a NE striking S-wave velocity transect (transect yy′)erpendicular to the west boundary of the Bayan Har Terrane, theanze-Yushu-Fenghuoshan Fault. The lateral variation of upper-antle lithospheric velocity is similar to that shown in transect kk′
Fig. 7a). The Lhasa, Bayan Har, and Kunlun-Qaidam terranes haveigh upper-mantle lithospheric velocities, whereas in between
s a distinctive low-velocity zone below the Qiangtang Terrane.he weakly northward-dipping high velocity zone beneath thehasa terrane may represent the subducting Indian lithosphereeneath the Tibetan plateau. The wide horizontal extent of the highelocity zone beneath the Bayan Har and Kunlun-Qaidam terranesay reflect the paleo-Asian lithosphere. The low velocity zone in
etween may represent the high-temperature extrusions/partialelts caused by the converging Indian and Asian lithospheres.
he Yushu earthquake occurred above a low-velocity crust andpper mantle (Fig. 7c). This transect partly overlaps with profile
in the teleseismic body-wave study of Li et al. (2008). Our tran-ect yy′ images the subducting Indian Plate much further to theorth than shown in profile J of Li et al. (2008). The difference maye caused by the different data types used and different resolution
g the Ganze-Yushu-Fenghuoshan Fault (profile yy′ , location is shown in Fig. 1).
lengths provided at lithospheric depths by teleseismic body-wavetomography and regional surface-wave tomography. In contrast,besides showing more detailed structures, our regional surface-wave tomographic model images a similar northward extensionof the Indian Plate and similar long wavelength structures to theglobal surface-wave tomographic model of Lebedev and Van derHilst (2008) in the same area, confirming the robustness and relia-bility of our regional surface-wave tomographic model.
Another common feature shown both on transect kk′ and tran-sect yy′ is that a weak velocity discontinuity at ∼110 km depth(marked as pink dashes in Fig. 7a and c) seems to exist, whichseparates the Tibetan upper-mantle lithosphere into two distinctlayers.
5. Discussion
5.1. Stacking of the Tibetan lithospheres
Lithospheric mantle is generally characterized by high veloci-ties compared with the overlying low-velocity crust and underlyingasthenosphere, so a qualitative analysis of thickness or geometryof the lithospheric mantle beneath the study region can be carriedout based on our S-wave velocity anomaly at uppermost man-tle depths. High or relatively high velocities at the south-westernends of profiles kk′ and yy′ (beneath central-south Tibet) extenddown to at least 170–200 km, indicating a very thick lithosphereof at least 170–200 km in central-south Tibet. A wide region oflow-velocities between the Bangong-Nujiang-Suture (BNS) and theBayan Har terrane on profiles kk′ and yy′ implies a strongly thinnedlithosphere in central-north Tibet. High or relatively high velocitiesdown to ∼200 km appear again beneath the Kunlun-Qaidam ter-
rane on profiles kk′ and yy′, implying that the lithosphere thicknessincreases again beneath the Kunlun-Qaidam terrane. Jiménez-Munt et al. (2008) have made a dynamic model of the Himalayasbased on topography, gravity, geoid and heat flow data along a 2D
438 M. Feng et al. / Journal of Geodynamics 52 (2011) 432– 442
Fig. 7. S-wave velocity transects across different parts of the NE Tibetan Plateau. (a) Profile kk′ crossing the East Kunlun Fault; (b) profile ww′ crossing the Longmen ShanFault; and (c) profile yy′ crossing the Ganze-Yushu-Fenghuoshan Fault. The top of each transect shows exaggerated topography; small black circles are historic earthquakes;b g Sut–
ct∼rabd
lack dashes are Moho depths from the 3-D reference model; BNS – Bangong-Nujian Ganze-Yushu-Fenghuoshan Fault.
ross-section that is located between our profiles k–k′and y–y′. Inheir dynamic model, the lithosphere reaches a maximum depth of260 km beneath the southern Plateau (not covered by our study
egion), and thins abruptly northward to ∼100 km under the centralnd northern Plateau. The lithospheric thickness increases againeneath the Qaidam basin and Qilian Shan to ∼160 km. The ten-ency of the lithospheric thickness variations across the Tibetan
ure; JS – Jingsha suture; EKF – East Kunlun Fault; LMSF – Longmen Shan Fault; GYFF
Plateau indicated by our S-wave velocities is well consistent withthe dynamic model of Jiménez-Munt et al. (2008).
Normally, the thickness of non-cratonic lithosphere (∼100 km)
is smaller than cratonic lithosphere (150–250 km) (An and Shi,2006). The Tibetan Plateau is of a non-cratonic nature. However,transects kk′ and yy′ (Fig. 7a and c) both exhibit relatively highor high upper-mantle lithospheric velocities down to 160–200 km
eodynamics 52 (2011) 432– 442 439
bstStdtllt
aifpltston∼u
ttIHcttFtrsMbtbtK
snpttetKpertbll(stP
2p“t
Bayan HarKunlunQaidam
Model 1
Model 2
Model 3
Bayan HarKunlunQaidam
(b)
thickened lithosphere
Paleo-AsianBayan HarKunlunQaidam
Paleo-AsianBayan HarKunlunQaidam
(a)
110 km depth
M. Feng et al. / Journal of G
eneath the Lhasa and Kunlun-Qaidam terranes, suggesting a litho-phere as thick as that for a craton, and confirming that thehickness of the lithosphere beneath Tibet is ∼160–220 km (An andhi, 2006). Previous studies (e.g., Feng et al., 2010) have proposedhat the southern Tibetan lithosphere may be thickened due to aoubling of the subducting Indian Plate, but they did not explainhe lithosphere thickening in the NE Tibetan Plateau. If the Tibetanithosphere was really thickened, it is still unclear which part of theithosphere pertains to the plateau itself, and which part is due toectonic emplacement.
In our model, the upper-mantle lithospheric S-wave velocitiesbove ∼110 km, as for example on transects kk′ and yy′, are seem-ngly different from the velocities below ∼110 km. This structuraleature may suggest that though the lithosphere of the Tibetanlateau is as thick as ∼160–220 km (An and Shi, 2006), the original
ithosphere of the plateau could be not thicker than ∼110 km andhe part below could be assigned to the emplaced Indian slab in theouthern plateau or others in the northeastern plateau. Accordingo this interpretation, for the stacked lithosphere with a thicknessf ∼160–220 km, after subtracting the overlying ∼110 km origi-al lithosphere of the plateau, the emplaced lithosphere should be50–110 km thick, which is also a reasonable thickness for typicalpper-mantle lithosphere (not including crustal thickness).
For the southern Tibetan Plateau (the Lhasa and southern Qiang-ang terranes in Fig. 7a and c), it is easy to understand thathe lithospheric stacking/doubling is caused by the subduction ofndian lithosphere, as previously proposed by Feng et al. (2010).owever, for the northeastern plateau, there remains difficulty tolarify the cause of the lithosphere thickening. To understand bet-er the possible evolution of the NE Tibetan Plateau, we proposehe possible dynamic process as shown by the cartoons in Fig. 8.ig. 8a is a simplified model for the NE Tibetan Plateau based onhe structural image of Fig. 7c. For the northeastern plateau, someesearchers believe that the Kunlun-Qaidam Terrane has subductedouthwards, along the Kunlun suture zone, from the late to middleiocene (Tapponnier et al., 2001; Kind et al., 2002), as illustrated
y “model 1” in Fig. 8b. If so, the lithospheric thickening beneathhe Bayan Har terrane south of the East Kunlun Fault (Fig. 7c) maye caused by this southward Kunlun-Qaidam subduction. However,his model cannot explain the thickened lithosphere beneath theunlun-Qaidam terrane itself.
Alternatively, if the Kunlun-Qaidam terrane never underwentouthwards subduction, the lithospheric thickening beneath theortheastern Tibetan Plateau could be related to the pre-existingaleo-Asian lithosphere, as shown by “model 2” in Fig. 8b. Sincehe Late Mesozoic, the Qaidam Basin has been separated fromhe Tarim Basin (Ge and Liu, 2000) and has then moved north-astwards with a distance of several hundred kilometers duringhe Indian–Eurasian collision/post-collision. More specifically, theunlun-Qaidam terrane has been deformed by northeastwardsush transferred from the Bayan Har Terrane south of it. If the pre-xisting paleo-Asian lithosphere had a stable and thick lithosphereoot (e.g., ∼200 km), the northeastward push transferred by thehinner Kunlun-Qaidam lithosphere (∼110 km thick) would onlye able to move northeastwards the upper part of the paleo-Asian
ithosphere (above ∼110 km), while the root of the paleo-Asianithosphere (depth below ∼110 km) would have been left, unmoved“model 2” in Fig. 8b). In this way, an unmoved, pre-existing litho-pheric root of the paleo-Asian Plate could be responsible forhe stacking of the lithosphere beneath the northeastern Tibetanlateau.
Furthermore, in the convergent movement indicated by “model
”, the Kunlun-Qaidam terrane may also overthrust the paleo-Asianlate as illustrated by “model 3” in Fig. 8b. Both “model 2” andmodel 3” could finally result in the present structural image withhickened lithosphere in the NE Tibetan Plateau.Fig. 8. Cartoons to illustrate possible dynamic processes involved in the evolution ofthe NE Tibetan Plateau. (a) Simplified model according to Fig. 7c. (b) Three possibledynamic models. See text for further discussion.
In summary, the deep structure of the northeastern TibetanPlateau (including the Bayan Har Terrane and its surroundingregions) are not only controlled by the northwards subduction ofthe Indian Plate, as previously proposed by many researchers, butpossibly also by pre-existing remnants of the paleo-Asian litho-sphere.
5.2. Lithospheric structures and seismogenic environment ofstrong earthquakes
Fig. 9a and b shows horizontal slices of velocities at 15 and120 km depths, and earthquakes of magnitude bigger than 5.0since 1962 (from www.GlobalCMT.org) with well-determined focalmechanisms (colored circles). The short bar across the circlesindicates the horizontal projection of the P-axis, as indicated bythe focal mechanism solution. Fig. 9a shows a poor correlationbetween seismicity and crustal velocity anomalies, though mostearthquakes in the Tibetan Plateau occur in the shallow crust. Incomparison, Fig. 9b shows a general correlation between seismicity
(also refer to Fig. 1 for earthquakes with magnitudes of 4.0–5.0) andupper-mantle lithospheric velocity anomalies. The western BayanHar Terrane, with low upper-mantle lithospheric velocities, is seis-mically more active than the eastern part of the terrane, which has
440 M. Feng et al. / Journal of Geodynamics 52 (2011) 432– 442
F (a) 15w es ind
hnirwe
ig. 9. Horizontal sections showing lithospheric S-wave velocity at the depths of
ell-determined focal mechanisms (colored circles). The short bars across the circl
igh velocities. Similarly, the western Qiangtang Terrane, domi-ated by distinctly low velocities in the upper-mantle lithosphere,
s seismically more active than the Lhasa and Kunlun-Qaidam ter-anes to the south and north of it. The correlation may confirm thateak or ductile upper-mantle lithosphere, with low velocities, is
asier to deform than strong or brittle upper-mantle lithosphere
and (b) 120 km and earthquakes of magnitudes bigger than 5.0 since 1962 withicate the horizontal projection of the P-axis from the focal mechanism solution.
with high velocities. Furthermore, Fig. 9b shows that faults in thelow-velocity region in upper-mantle lithosphere are normally char-
acterized by normal (extension) to strike-slip movements (circlesshaded with cool colors), while reverse fault movements (com-pression), sometimes with a small strike-slip component (circlesshaded with warm colors), normally occur in the low-to-high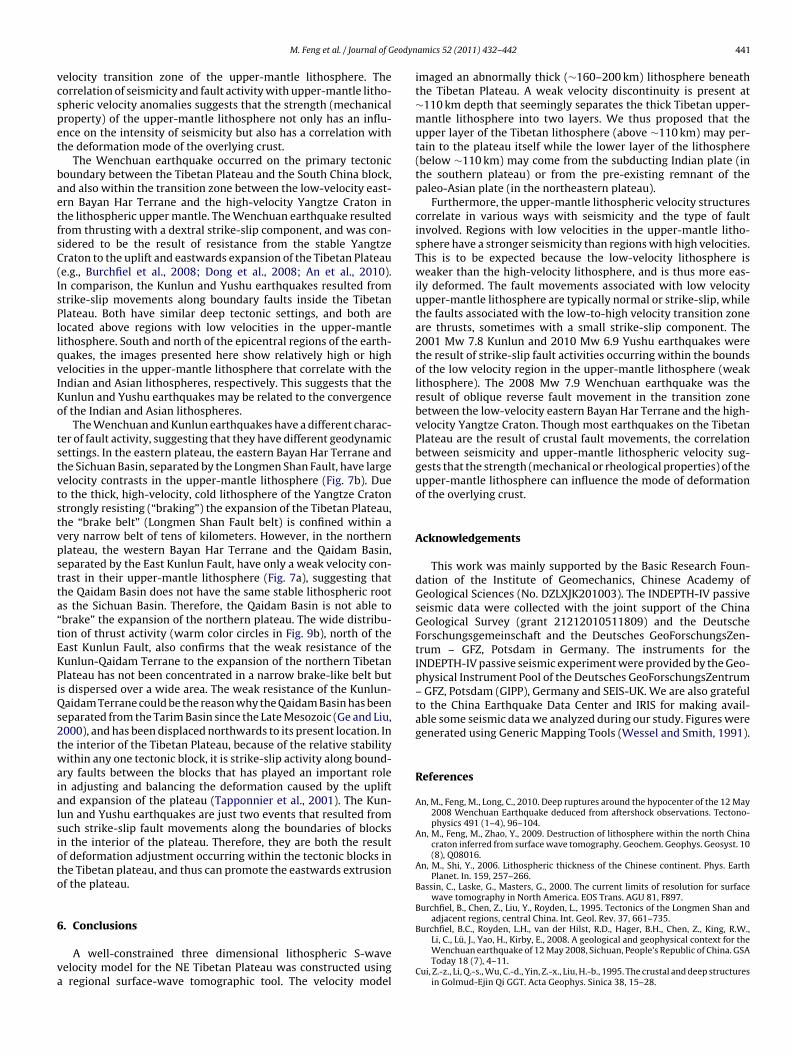
eodyn
vcspet
baetfsC(IsPllqvIKo
tstvtstvpstta“tEKPiQs2twaialsioto
6
va
M. Feng et al. / Journal of G
elocity transition zone of the upper-mantle lithosphere. Theorrelation of seismicity and fault activity with upper-mantle litho-pheric velocity anomalies suggests that the strength (mechanicalroperty) of the upper-mantle lithosphere not only has an influ-nce on the intensity of seismicity but also has a correlation withhe deformation mode of the overlying crust.
The Wenchuan earthquake occurred on the primary tectonicoundary between the Tibetan Plateau and the South China block,nd also within the transition zone between the low-velocity east-rn Bayan Har Terrane and the high-velocity Yangtze Craton inhe lithospheric upper mantle. The Wenchuan earthquake resultedrom thrusting with a dextral strike-slip component, and was con-idered to be the result of resistance from the stable Yangtzeraton to the uplift and eastwards expansion of the Tibetan Plateaue.g., Burchfiel et al., 2008; Dong et al., 2008; An et al., 2010).n comparison, the Kunlun and Yushu earthquakes resulted fromtrike-slip movements along boundary faults inside the Tibetanlateau. Both have similar deep tectonic settings, and both areocated above regions with low velocities in the upper-mantleithosphere. South and north of the epicentral regions of the earth-uakes, the images presented here show relatively high or highelocities in the upper-mantle lithosphere that correlate with thendian and Asian lithospheres, respectively. This suggests that theunlun and Yushu earthquakes may be related to the convergencef the Indian and Asian lithospheres.
The Wenchuan and Kunlun earthquakes have a different charac-er of fault activity, suggesting that they have different geodynamicettings. In the eastern plateau, the eastern Bayan Har Terrane andhe Sichuan Basin, separated by the Longmen Shan Fault, have largeelocity contrasts in the upper-mantle lithosphere (Fig. 7b). Dueo the thick, high-velocity, cold lithosphere of the Yangtze Cratontrongly resisting (“braking”) the expansion of the Tibetan Plateau,he “brake belt” (Longmen Shan Fault belt) is confined within aery narrow belt of tens of kilometers. However, in the northernlateau, the western Bayan Har Terrane and the Qaidam Basin,eparated by the East Kunlun Fault, have only a weak velocity con-rast in their upper-mantle lithosphere (Fig. 7a), suggesting thathe Qaidam Basin does not have the same stable lithospheric roots the Sichuan Basin. Therefore, the Qaidam Basin is not able tobrake” the expansion of the northern plateau. The wide distribu-ion of thrust activity (warm color circles in Fig. 9b), north of theast Kunlun Fault, also confirms that the weak resistance of theunlun-Qaidam Terrane to the expansion of the northern Tibetanlateau has not been concentrated in a narrow brake-like belt buts dispersed over a wide area. The weak resistance of the Kunlun-aidam Terrane could be the reason why the Qaidam Basin has been
eparated from the Tarim Basin since the Late Mesozoic (Ge and Liu,000), and has been displaced northwards to its present location. Inhe interior of the Tibetan Plateau, because of the relative stabilityithin any one tectonic block, it is strike-slip activity along bound-
ry faults between the blocks that has played an important rolen adjusting and balancing the deformation caused by the upliftnd expansion of the plateau (Tapponnier et al., 2001). The Kun-un and Yushu earthquakes are just two events that resulted fromuch strike-slip fault movements along the boundaries of blocksn the interior of the plateau. Therefore, they are both the resultf deformation adjustment occurring within the tectonic blocks inhe Tibetan plateau, and thus can promote the eastwards extrusionf the plateau.
. Conclusions
A well-constrained three dimensional lithospheric S-waveelocity model for the NE Tibetan Plateau was constructed using
regional surface-wave tomographic tool. The velocity model
amics 52 (2011) 432– 442 441
imaged an abnormally thick (∼160–200 km) lithosphere beneaththe Tibetan Plateau. A weak velocity discontinuity is present at∼110 km depth that seemingly separates the thick Tibetan upper-mantle lithosphere into two layers. We thus proposed that theupper layer of the Tibetan lithosphere (above ∼110 km) may per-tain to the plateau itself while the lower layer of the lithosphere(below ∼110 km) may come from the subducting Indian plate (inthe southern plateau) or from the pre-existing remnant of thepaleo-Asian plate (in the northeastern plateau).
Furthermore, the upper-mantle lithospheric velocity structurescorrelate in various ways with seismicity and the type of faultinvolved. Regions with low velocities in the upper-mantle litho-sphere have a stronger seismicity than regions with high velocities.This is to be expected because the low-velocity lithosphere isweaker than the high-velocity lithosphere, and is thus more eas-ily deformed. The fault movements associated with low velocityupper-mantle lithosphere are typically normal or strike-slip, whilethe faults associated with the low-to-high velocity transition zoneare thrusts, sometimes with a small strike-slip component. The2001 Mw 7.8 Kunlun and 2010 Mw 6.9 Yushu earthquakes werethe result of strike-slip fault activities occurring within the boundsof the low velocity region in the upper-mantle lithosphere (weaklithosphere). The 2008 Mw 7.9 Wenchuan earthquake was theresult of oblique reverse fault movement in the transition zonebetween the low-velocity eastern Bayan Har Terrane and the high-velocity Yangtze Craton. Though most earthquakes on the TibetanPlateau are the result of crustal fault movements, the correlationbetween seismicity and upper-mantle lithospheric velocity sug-gests that the strength (mechanical or rheological properties) of theupper-mantle lithosphere can influence the mode of deformationof the overlying crust.
Acknowledgements
This work was mainly supported by the Basic Research Foun-dation of the Institute of Geomechanics, Chinese Academy ofGeological Sciences (No. DZLXJK201003). The INDEPTH-IV passiveseismic data were collected with the joint support of the ChinaGeological Survey (grant 21212010511809) and the DeutscheForschungsgemeinschaft and the Deutsches GeoForschungsZen-trum – GFZ, Potsdam in Germany. The instruments for theINDEPTH-IV passive seismic experiment were provided by the Geo-physical Instrument Pool of the Deutsches GeoForschungsZentrum– GFZ, Potsdam (GIPP), Germany and SEIS-UK. We are also gratefulto the China Earthquake Data Center and IRIS for making avail-able some seismic data we analyzed during our study. Figures weregenerated using Generic Mapping Tools (Wessel and Smith, 1991).
References
An, M., Feng, M., Long, C., 2010. Deep ruptures around the hypocenter of the 12 May2008 Wenchuan Earthquake deduced from aftershock observations. Tectono-physics 491 (1–4), 96–104.
An, M., Feng, M., Zhao, Y., 2009. Destruction of lithosphere within the north Chinacraton inferred from surface wave tomography. Geochem. Geophys. Geosyst. 10(8), Q08016.
An, M., Shi, Y., 2006. Lithospheric thickness of the Chinese continent. Phys. EarthPlanet. In. 159, 257–266.
Bassin, C., Laske, G., Masters, G., 2000. The current limits of resolution for surfacewave tomography in North America. EOS Trans. AGU 81, F897.
Burchfiel, B., Chen, Z., Liu, Y., Royden, L., 1995. Tectonics of the Longmen Shan andadjacent regions, central China. Int. Geol. Rev. 37, 661–735.
Burchfiel, B.C., Royden, L.H., van der Hilst, R.D., Hager, B.H., Chen, Z., King, R.W.,
Li, C., Lü, J., Yao, H., Kirby, E., 2008. A geological and geophysical context for theWenchuan earthquake of 12 May 2008, Sichuan, People’s Republic of China. GSAToday 18 (7), 4–11.Cui, Z.-z., Li, Q.-s., Wu, C.-d., Yin, Z.-x., Liu, H.-b., 1995. The crustal and deep structuresin Golmud-Ejin Qi GGT. Acta Geophys. Sinica 38, 15–28.

4 eodyn
D
D
D
F
F
GH
H
J
K
K
L
L
L
L
L
L
L
L
M
N
N
42 M. Feng et al. / Journal of G
ensmore, A.L., Ellis, M.A., Li, Y., Zhou, R., Hancock, G.S., Richardson, N., 2007. Activetectonics of the Beichuan and Pengguan faults at the eastern margin of theTibetan Plateau. Tectonics 26, TC4005.
ewey, J.F., Shackleton, R.M., Chengfa, C., Yiyin, S., 1988. The tectonic evolution of theTibetan Plateau. Philos. Trans. Roy. Soc. London A: Math. Phys. Sci. 327 (1594),379–413.
ong, S., Zhang, Y., Long, C., Wu, Z., An, M., Zhang, Y., Yang, N., Chen, Z., Lei, W., Shi, W.,Shi, J., 2008. Surface rupture investigation of the Wenchuan Ms 8.0 earthquakeof May 12th, 2008, West Sichuan, and analysis of its occurrence setting. ActaGeosci. Sinica 29 (3), 392–396.
eng, M., An, M., 2010. Lithospheric structure of the Chinese mainland determinedfrom joint inversion of regional and teleseismic Rayleigh-wave group velocities.J. Geophys. Res. 115, B06317.
eng, M., van der Lee, S., An, M., Zhao, Y., 2010. Lithospheric thickness, thinning,subduction, and interaction with the asthenosphere beneath China from thejoint inversion of seismic S-wave train fits and Rayleigh-wave dispersion curves.Lithos, doi:10.1016/j.lithos.2009.11.017.
e, X., Liu, J., 2000. Broken Western China Craton. Acta Petrol. Sinica 16 (1), 59–66.irn, A., Lepine, J.-C., Jobert, G., Sapin, M., Wittlinger, G., Xin, X.Z., Yuan, G.E., Jing,
W.X., Wen, T.J., Bai, X.S., Pandey, M.R., Tater, J.M., 1984. Crustal structure andvariability of the Himalayan border of Tibet. Nature 307, 23–25.
uang, Z., Su, W., Peng, Y., Zheng, Y., Li, H., 2003. Rayleigh wave tomography of Chinaand adjacent regions. J. Geophys. Res. 108 (B2), 2073.
iménez-Munt, I., Fernàndez, M., Vergés, J., Platt, J.P., 2008. Lithosphere structureunderneath the Tibetan Plateau inferred from elevation, gravity and geoidanomalies. Earth Planet. Sci. Lett. 267, 276–289.
ennett, B.L.N., Engdahl, E.R., 1991. Traveltimes for global earthquake location andphase identification. Geophys. J. Int. 105, 429–465.
ind, R., Yuan, X., Saul, J., Nelson, D., Sobolev, V., Mechie, S., Zhao, J., Kosarev, W.,Ni, G., Achauer, J., Jiang, U.M., 2002. Seismic images of crust and upper mantlebeneath Tibet: evidence for Eurasian plate subduction. Science 298, 1219–1221.
ebedev, S., Nolet, G., 2003. Upper mantle beneath Southeast Asia from S velocitytomography. J. Geophys. Res. 108 (B1), 2048.
ebedev, S., Van der Hilst, R.D., 2008. Global upper-mantle tomography with theautomated multi-mode surface and S waveforms. Geophys. J. Int. 173 (2),505–518.
i, C., van der Hilst, R.D., Meltzer, A.S., Engdahl, E.R., 2008. Subduction of the Indianlithosphere beneath the Tibetan Plateau and Burma. Earth Planet. Sci. Lett. 274,157–168.
i, S.L., Mooney, W.D., Fan, J.C., 2006a. Crustal structure of mainland China from deepseismic sounding data. Tectonophysics 420, 239–252.
i, Y.H., Tian, X.B., Wu, Q.J., Zeng, R.S., Zhang, R.Q., 2006b. The Poisson ratio and crustalstructure of the central Qinghai-Xizang inferred from INDEPTH-III teleseismicwaveforms: geological and geophysical implications. Chinese J. Geophys. 49 (4),1037–1044.
in, A., Fu, B., Guo, J., Zeng, Q., Dang, G., He, W., Zhao, Y., 2002. Co-seismic strike-slipand rupture length produced by the 2001 Ms 8.1 central Kunlun earthquake.Science 296, 2015–2017.
iu, M., Mooney, W.D., Li, S., Okaya, N., Detweiler, S., 2006. Crustal structure of thenortheastern margin of the Tibetan plateau from the Songpan-Ganzi terrane tothe Ordos basin. Tectonophysics 420, 253–266.
iu, Q.Y., Li, Y., Chen, J.H., Guo, B., Li, S.C., Wang, J., Zhang, X.Q., Qi, S.H., 2009.Wenchuan Ms8.0 earthquake: preliminary study of the S-wave velocity struc-ture of the crust and upper mantle. Chinese J. Geophys. 52 (2), 309–319.
echie, J., Kind, R., Saul, J., 2011. The seismological structure of the Tibetan Plateaucrust and mantle down to 700 km depth. In: Gloaguen, R., Ratschbacher, L. (Eds.),Growth and Collapse of the Tibetan Plateau. Geological Society of London, Lon-don, pp. 109–125.
abelek, J., Vergne, J., Hetenyi, G., Hi-CLIMB team, 2005. Project Hi-CLIMB: a synopticview of the Himalayan Collision Zone and Southern Tibet. EOS Trans. AGU 86(52), Abstract T52A-02.
elson, K.D., Zhao, W., Brown, L.D., Kuo, J., Che, J., Liu, X., Klemperer, S.L., Makovsky,Y., Meissner, R., Mechie, J., Kind, R., Wenzel, F., Ni, J., Nabelek, J., Leshou, C., Tan,
amics 52 (2011) 432– 442
H., Wei, W., Jones, A.G., Booker, J.U., Kidd, M., Hauck, W.S.F., Alsdorf, M., Ross,D., Cogan, A., Wu, M., Sandvol, C., Edwards, E.M., 1996. Partially molten middlecrust beneath southern Tibet: synthesis of project INDEPTH results. Science 274,1684–1688.
Ritzwoller, M.H., Shapiro, N.M., Barmin, M.P., Levshin, A.L., 2002. Global surface wavediffraction tomography. J. Geophys. Res. 107 (B12), 2335.
Shi, D., Shen, Y., Zhao, W., Li, A., 2009. Seismic evidence for a Moho offset and south-directed thrust at the easternmost Qaidam-Kunlun boundary in the NortheastTibetan plateau. Earth Planet. Sci. Lett. 288, 329–334.
Su, W., Peng, Y., Zheng, Y., Huang, Z., 2002. Crust and upper mantle shear veloc-ity structure beneath the Tibetan Plateau and adjacent areas. ACTA GeoscientiaSinica 23 (3), 193–200.
Tapponnier, P., Xu, Z., Roger, F., Meyer, B., Arnaud, N., Wittlinger, G., Yang, J., 2001.Oblique stepwise rise and growth of the Tibetan Plateau. Science 294 (5547),1671–1677.
Teng, J.-W., Sun, K.-Z., Xiong, S.-B., Yin, Z.-X., Yao, H., Chen, L.-F., 1983. Deep seismicreflection waves and structure of the crust from Dangxung to Yadong on theXizang Plateau (Tibet). Phys. Earth Planet. Ints. 31, 293–306.
Tilmann, F., Ni, J., INDEPTH III Seismic Team, 2003. Seismic imaging of the down-welling Indian lithosphere beneath central Tibet. Science 300, 1424–1427.
Vergne, J., Wittlinger, G., Qiang, H., Tapponnier, P., Poupinet, G., Jiang, M., Herquel,G., Paul, A., 2002. Seismic evidence for stepwise thickening of the crust acrossthe NE Tibetan plateau. Earth Planet. Sci. Lett. 203, 25–33.
Wessel, P., Smith, W.H.F., 1991. Free software helps map and display data. EOS Trans.AGU 72, 441.
Wittlinger, G., Farra, V., Hetenyi, G., Vergne, J., Nabelek, J., 2009. Seismic velocities inSouthern Tibet lower crust: a receiver function approach for eclogite detection.Geophys. J. Int. 177, 1037–1049.
Wittlinger, G., Vergne, J., Tapponnier, P., Farra, V., Poupinet, G.J., Su, M., Herquel,H., Paul, G.A., 2004. Teleseismic imaging of subducting lithosphere and Mohooffsets beneath western Tibet. Earth Planet. Sci. Lett. 221, 117–130.
Xiao, X., Li, T., 2000. Tectonic Evolution and Uplift Mechanism of the Tibetan Plateau.Guangdong Science Publishing House, Guang Zhou, 313 pp.
Xu, X., Wen, X., Chen, G., Yu, G., 2008. Discovery of the Longriba Fault Zone in East-ern Bayan Har Block and its geotectoinc implication. Sci. China Ser. D 38 (5),529–542.
Yuan, X., Ni, J., Kind, R., Mechie, J., Sandvol, E., 1997. Lithospheric and upper mantlestructure of southern Tibet from a seismological passive source experiment. J.Geophys. Res. 102 (B12), 27491–27500.
Zhang, X., Sun, R., Teng, J., 2007. Study on crustal, lithospheric and asthenosphericthickness beneath the Qinghai-Tibet Plateau and its adjacent areas. Chinese Sci.Bull. 52 (6), 797–804.
Zhang, Z., Klemperer, S.L., 2005. West-east variation in crustal thickness in northernLhasa block, central Tibet, from deep seismic sounding data. J. Geophys. Res. 110,B09403.
Zhang, Z., Wang, Y., Chen, Y., Houseman, G.A., Tian, X., Wang, E., Teng, J., 2009. Crustalstructure across Longmenshan fault belt from passive source seismic profiling.Geophys. Res. Lett. 36, L17310.
Zhao, J., Mooney, W.D., Zhang, X., Li, Z., Jin, Z., Okaya, N., 2006. Crustal structureacross the Altyn Tagh Range at the northern margin of the Tibetan plateau andtectonic implications. Earth Planet. Sci. Lett. 241, 804–814.
Zhao, W., Brown, L., Wu, Z., Klemperer, S.L., Shi, D., Mechie, J., Su, H., Tilmann, F.,Karplus, M.S., Makovsky, Y., 2008. Seismology across the northeastern edge ofthe Tibetan plateau. EOS Trans. Am. Geophys. Union 89, 487.
Zhao, W., Mechie, J., Brown, L.D., Guo, J., Haines, S., Hearn, T., Klemperer, S.L., Ma,Y.S.R., Nelson, M.K.D., Ni, J.F., Pananont, P., Rapine, R.A.R., Saul, J., 2001. Crustalstructure of central Tibet as derived from project INDEPTH wide-angle seismicdata. Geophys. J. Int. 145, 486–498.
Zhao, W., Nelson, K.D., Project INDEPTH Team, 1993. Deep seismic reflection evi-dence for continental underthrusting beneath southern Tibet. Nature 366,557–559.
Zhou, B., Peng, J., Zhang, J., 2009. Development and distribution patterns of activefault zones in Qinghai Province. J. Eng. Geol. 17 (5), 612–618.