U-Pb thermochronology: creating a temporal record of lithosphere thermal evolution
22
ORIGINAL PAPER U-Pb thermochronology: creating a temporal record of lithosphere thermal evolution Terrence Blackburn • Samuel A. Bowring • Blair Schoene • Kevin Mahan • Francis Dudas Received: 26 June 2010 / Accepted: 3 January 2011 Ó Springer-Verlag 2011 Abstract A new approach to U-Pb accessory mineral thermochronology allows high-resolution time-tempera- ture histories to be extracted from lower crustal xenoliths. The combination of the U-Pb system’s dual decay scheme with the effects of temperature dependent Pb-diffusion can yield a time sensitive record of Pb production/diffusion within accessory phases. The difference in half-life for parent isotopes 238 U and 235 U results in the time-variable production of Pb isotopes 206 Pb and 207 Pb, while Pb dif- fusion can result in large variations in the time-scales at which Pb retention occurs between grains of different sizes. The combined effects of variable production rates between the two systems and diffusion result in data topologies on a concordia diagram that permit distinction between slow cooling and reheating t-T paths. In slowly cooled systems, the difference in time for Pb retention for grains of variable size yields a measure of partial retention zone (PRZ) residence time, and provides a robust measure of cooling rate through the PRZ. In Montana, three lower crustal xenoliths, each from a different depth, yield U-Pb rutile data that record a prolonged ( [ 1 Ga) and slow cooling history towards a steady state geothermal gradient following the amalgamation of the terrain onto North America. The shallowest samples record the initial recovery of a conductive geothermal gradient and cool through the mineral PRZ at rates of \ 0.25°C/Ma over *500 Ma. Deeper xenoliths record cooling at younger times over similar time scales and rates. This multi-depth thermal history provides a long-term record of lithosphere cooling and stabilization. Keywords U-Pb Thermochronology Lithosphere Thermal evolution Lower crust Xenoliths Rutile Introduction Over the past 20 years thermochronologic techniques including U-Pb, Rb-Sr, K-Ar, 40 Ar/ 39 Ar, fission track and (U-Th)/He systems have allowed earth scientists to accurately describe the time-temperature evolution of rock samples. The diffusive loss of daughter isotopes in these systems can be quantified by volume-diffusion theory and exploited as a reliable method to yield tem- perature sensitive dates. Low-temperature ( \ 400–60°C) thermochronometric systems, such as 40 Ar/ 39 Ar and (U-Th)/He have typically been applied to structural, tectonic and geomorphologic studies of the upper crust with the goal of constraining near-surface thermal histories. Reconstructing a samples thermal history can be used to quantify heat transfer mechanisms operating within the lithosphere, providing a time-dependent measure for this process. Communicated by T. L. Grove. Electronic supplementary material The online version of this article (doi:10.1007/s00410-011-0607-6) contains supplementary material, which is available to authorized users. T. Blackburn (&) S. A. Bowring F. Dudas Massachusetts Institute of Technology, EAPS, 77 Massachusetts Ave MIT Bldg 54-1117, Cambridge, MA 02139, USA e-mail: [email protected] B. Schoene Department of Geosciences, Princeton University, 219 Guyot Hall, Princeton, NJ 08544, USA K. Mahan Department of Geological Sciences, University of Colorado-Boulder, 2200 Colorado Ave., Campus Box 399, Boulder, CO 80309, USA 123 Contrib Mineral Petrol DOI 10.1007/s00410-011-0607-6
-
Upload
independent -
Category
Documents
-
view
1 -
download
0
Transcript of U-Pb thermochronology: creating a temporal record of lithosphere thermal evolution
ORIGINAL PAPER
U-Pb thermochronology: creating a temporal recordof lithosphere thermal evolution
Terrence Blackburn • Samuel A. Bowring •
Blair Schoene • Kevin Mahan • Francis Dudas
Received: 26 June 2010 / Accepted: 3 January 2011
� Springer-Verlag 2011
Abstract A new approach to U-Pb accessory mineral
thermochronology allows high-resolution time-tempera-
ture histories to be extracted from lower crustal xenoliths.
The combination of the U-Pb system’s dual decay scheme
with the effects of temperature dependent Pb-diffusion can
yield a time sensitive record of Pb production/diffusion
within accessory phases. The difference in half-life for
parent isotopes 238U and 235U results in the time-variable
production of Pb isotopes 206Pb and 207Pb, while Pb dif-
fusion can result in large variations in the time-scales at
which Pb retention occurs between grains of different
sizes. The combined effects of variable production rates
between the two systems and diffusion result in data
topologies on a concordia diagram that permit distinction
between slow cooling and reheating t-T paths. In slowly
cooled systems, the difference in time for Pb retention for
grains of variable size yields a measure of partial retention
zone (PRZ) residence time, and provides a robust measure
of cooling rate through the PRZ. In Montana, three lower
crustal xenoliths, each from a different depth, yield U-Pb
rutile data that record a prolonged ([1 Ga) and slow
cooling history towards a steady state geothermal gradient
following the amalgamation of the terrain onto North
America. The shallowest samples record the initial
recovery of a conductive geothermal gradient and cool
through the mineral PRZ at rates of \0.25�C/Ma over
*500 Ma. Deeper xenoliths record cooling at younger
times over similar time scales and rates. This multi-depth
thermal history provides a long-term record of lithosphere
cooling and stabilization.
Keywords U-Pb � Thermochronology � Lithosphere �Thermal evolution � Lower crust � Xenoliths � Rutile
Introduction
Over the past 20 years thermochronologic techniques
including U-Pb, Rb-Sr, K-Ar, 40Ar/39Ar, fission track and
(U-Th)/He systems have allowed earth scientists to
accurately describe the time-temperature evolution of
rock samples. The diffusive loss of daughter isotopes in
these systems can be quantified by volume-diffusion
theory and exploited as a reliable method to yield tem-
perature sensitive dates. Low-temperature (\400–60�C)
thermochronometric systems, such as 40Ar/39Ar and
(U-Th)/He have typically been applied to structural, tectonic
and geomorphologic studies of the upper crust with the
goal of constraining near-surface thermal histories.
Reconstructing a samples thermal history can be used to
quantify heat transfer mechanisms operating within the
lithosphere, providing a time-dependent measure for this
process.
Communicated by T. L. Grove.
Electronic supplementary material The online version of thisarticle (doi:10.1007/s00410-011-0607-6) contains supplementarymaterial, which is available to authorized users.
T. Blackburn (&) � S. A. Bowring � F. Dudas
Massachusetts Institute of Technology, EAPS, 77 Massachusetts
Ave MIT Bldg 54-1117, Cambridge, MA 02139, USA
e-mail: [email protected]
B. Schoene
Department of Geosciences, Princeton University,
219 Guyot Hall, Princeton, NJ 08544, USA
K. Mahan
Department of Geological Sciences,
University of Colorado-Boulder, 2200 Colorado Ave.,
Campus Box 399, Boulder, CO 80309, USA
123
Contrib Mineral Petrol
DOI 10.1007/s00410-011-0607-6
In contrast to noble gas thermochronology, U-Pb
accessory phase thermochronometry (minerals: apatite,
titanite and rutile) allows estimates of cooling rates of
rocks as they pass through moderate to high temperatures
(400–800�C) corresponding to thermal histories for rocks
between 20 and 50 km depth. Most attempts to employ
U-Pb thermochronometers have produced dates consistent
with exhumation of post-peak metamorphic lower crustal
terranes (Baldwin et al. 2004; Flowers et al. 2006). Schmitz
et al. (2003), however, applied U-Pb accessory phase
thermochronology to explore the thermal relaxation of
ancient cratonic lithosphere by dating rutile, titanite and
apatite from exhumed lower crustal xenoliths. Lower
crustal xenoliths may preserve ancient cooling histories,
from the high temperatures during and following igneous
crystallization and/or metamorphism (700–1,000�C), to the
low temperatures predicted for a steady state geotherm in
the lower crust (ca 450–550�C). This history is initially
recorded by high temperature geochronometers such as
zircon or monazite, while cooling is recorded by moderate
temperature thermochronometers apatite, rutile and titanite.
Archean cratons are characterized by thick ([200 km)
lithospheric mantle of depleted peridotite that effectively
insulate the crust from thermal and tectonic perturbations
(e.g. Jordan 1988). Though the antiquity of the crust and
keels is well established, the time-scales of cooling and
stabilization of these cratons is poorly understood. U-Pb
thermochronology of lower crustal xenoliths can be used to
constrain the long-term thermal relaxation of these tectonic
terranes, and potentially decipher the magnitude of heat
transfer mechanisms operating over the history of a craton.
An additional contrast between U-Pb and noble gas
thermochronology is the U-Pb system’s dual decay
scheme, where two parent isotopes, 238U and 235U, decay
to daughter isotopes 206Pb and 207Pb respectively. The
difference in decay rates between parent isotopes imposes a
time-variant parent and daughter isotopic composition for
any point in Earth’s history. Volume diffusion behavior, in
particular for slowly cooled systems, induces age gradients
within single grains and among grains of varying size as a
result of partial retention of radiogenic daughter and dif-
fusion’s length-scale dependency. This results in the
retention of Pb between grains of different sizes over dif-
ferent time-scales, with each grain acquiring a unique
parent-daughter ratio and daughter isotopic composition.
The dual decay scheme can be exploited as two separate
thermochronologic systems that when combined, can yield
data that is unique to a particular cooling path. This is a
distinct advantage over single isotope systems that are
often plagued by non-unique data sets in particular the
ambiguity of potentially identical internal diffusion profiles
and grain size-age relationships that can be produced by
slow-cooling and reheating time-temperature (t-T) paths.
The purpose of this paper to is to: (1) outline new
numerical and laboratory procedures for U-Pb thermo-
chronology, (2) demonstrate how the U-Pb system’s dual
decay scheme can yield time sensitive information on Pb
diffusion allowing for the determination of unique cooling
paths, (3) show how duration in the Pb PRZ affects the
topology of U-Pb data plotted on a concordia diagram,
which in turn can provide a robust estimate of cooling rate
and (4) demonstrate that an approach involving multiple
xenolith samples from different depths can further be used
to decipher thermal histories for the deep lithosphere.
U-Pb thermochronology
A major goal of radioisotopic thermochronology is to
determine an accurate time-temperature history for a
sample as it passes through the closure interval of different
mineral-isotopic chronometers. Temperature sensitive
U-Pb dates are the result of thermally activated volume
diffusion of radiogenic Pb that is produced by the decay of
U. In order to assign meaningful temperatures to U-Pb
dates, we need a quantitative assessment of Pb diffusion
behavior within the accessory minerals of interest (rutile,
apatite, titanite). This behavior can be approximated by the
1-D diffusion-production equation:
oC
ot¼ D Tð Þ o
2C
or2þ P ð1Þ
where the change in concentration of an element (C) (in
this case Pb) with time (t) is equal to the second order
spatial derivative of the element concentration multiplied
by a Diffusion constant (D), which is itself a function of
temperature (T). A production term (P) accounts for the
in-situ decay of radiogenically produced daughter. A suc-
cessful solution to this equation will provide us with a
book-keeping method for radiogenically produced 206Pb
and 207Pb as it varies within a grain from diffusion (D) and
decay of uranium (P) as a function of time.
The variability of both daughter production and daughter
retention with temperature and time presents a significant
complication in understanding the meaning of measured
dates of whole mineral grains. The open versus closed
system behavior of elements in solids is dependent upon
whether diffusion or production controls the budget of Pb
within an accessory phase. Open system behavior occurs at
higher temperatures when diffusion is fast enough to induce
the loss of radiogenic daughter as quickly as it is produced
by decay. Closed system behavior occurs at low tempera-
tures when diffusive loss of Pb is so slow that all radio-
genically produced Pb is effectively retained. The region of
time-temperature space between open and closed system
behavior is defined as the Partial Retention Zone (PRZ), a
Contrib Mineral Petrol
123
region where both production and diffusion are operating at
or a near a balance resulting in the partial retention of
radiogenic daughter. Any measured U-Pb date, is a result of
the daughter isotope gained since the time of system closure
plus the daughter acquired in the PRZ. The partial retention
of radiogenic daughter is controlled by three different
variables, all simultaneously and independently operating
to create a unique partial retention zone for a particular
thermal history. These variables are: (1) temperature
dependent diffusion of radiogenic daughter, (2) production
of radiogenic daughter and (3) diffusion’s length depen-
dency. This first variable, the diffusion of radiogenic
daughter, is controlled by the sample’s time-temperature
path and results in a unique PRZ for a specific t-T path. For
example, fast cooling rates condense the values of diffu-
sivity that may yield partial retention behavior and limit the
effects of PRZ residence. Slow cooling, in contrast, results
in prolonged time periods with an effective diffusivity that
induces partial loss of daughter, yielding a PRZ that is
unique to a cooling path. The second key variable, daughter
production, will vary both in time as the activity of the
parent isotope changes and between different radiometric
system. For example, the difference in daughter production
rates from the decay of 238U and 235U results in a unique
PRZ for the 235U-207Pb and 238U-206Pb systems. Lastly, the
length scale dependency of diffusion requires that radio-
genic daughter that is produced within the cores of grains
has a physically longer distance to travel than the daughter
product produced at the edges. The difference in time-scales
between Pb-retention in the core and rim of a grain leads to
an apparent difference in the time of grain core vs. rim
closure while simultaneously providing a temporal record
of PRZ residence. For grains of variable size, this length
scale-dependency will result in each individual grain size
partially retaining Pb over different time periods which in
turn results in each grain having its own unique PRZ. The
ultimate goal of assigning a meaningful temperature to any
measured thermochronometric date requires an under-
standing for how all of these variables contribute to affect
the duration of PRZ residence. The most commonly used
method for estimating PRZ residence and assigning a
temperature to a measured thermochronologic date is the
Dodson method (Dodson 1973).
The Dodson method has been successfully applied to
upper-crustal thermochronologic studies, but some of the
models inherent assumptions are likely violated in the
lower crust. These assumptions include: (1) a monotonic
cooling path and (2) cooling through the PRZ occurs on
time-scales far shorter than the half-lives of radioactive
parent elements, allowing the solution to assume a linear
production of radiogenic daughter. One characteristic of
the U-Pb rutile and titanite data produced in this study as
well as two previous studies of lower crustal xenoliths
(Davis et al. 2003; Schmitz et al. 2003) are discordant
arrays of U-Pb dates. Measurements of varying grain size
yield dispersion in measured U-Pb dates of hundreds of
millions of years, defining a curvilinear array on a con-
cordia diagram. This extreme discordance indicates a loss
of equilibrium within the U-Pb system that could poten-
tially be interpreted as the result of two different t-T paths:
(1) reheating, violating the monotonic cooling history
required to use Dodson’s approach and (2) slow-cooling,
which must consider radiogenic production over the hun-
dreds of millions of years of potential PRZ residence. This
requires that we utilize a solution to the diffusion-produc-
tion equation that allows testing of both slow cooling and
reheating time temperature paths, and that accounts for the
production of specific Pb isotopes during prolonged resi-
dence within the PRZ.
Analytical solution to the diffusion equation
In the late 1950s and early 1960s as U-Pb zircon geo-
chronology was being developed, volume diffusion theory
and analytical solutions to the diffusion equation were
derived in an effort to explain the loss of Pb and discor-
dance observed in nearly all zircon measurements.
Wetherill (1956) developed a graphical method using the
concordia curve to determine both the timing of zircon
crystallization and a secondary event, potentially a
reheating event, that he hypothesized induced the diffusive
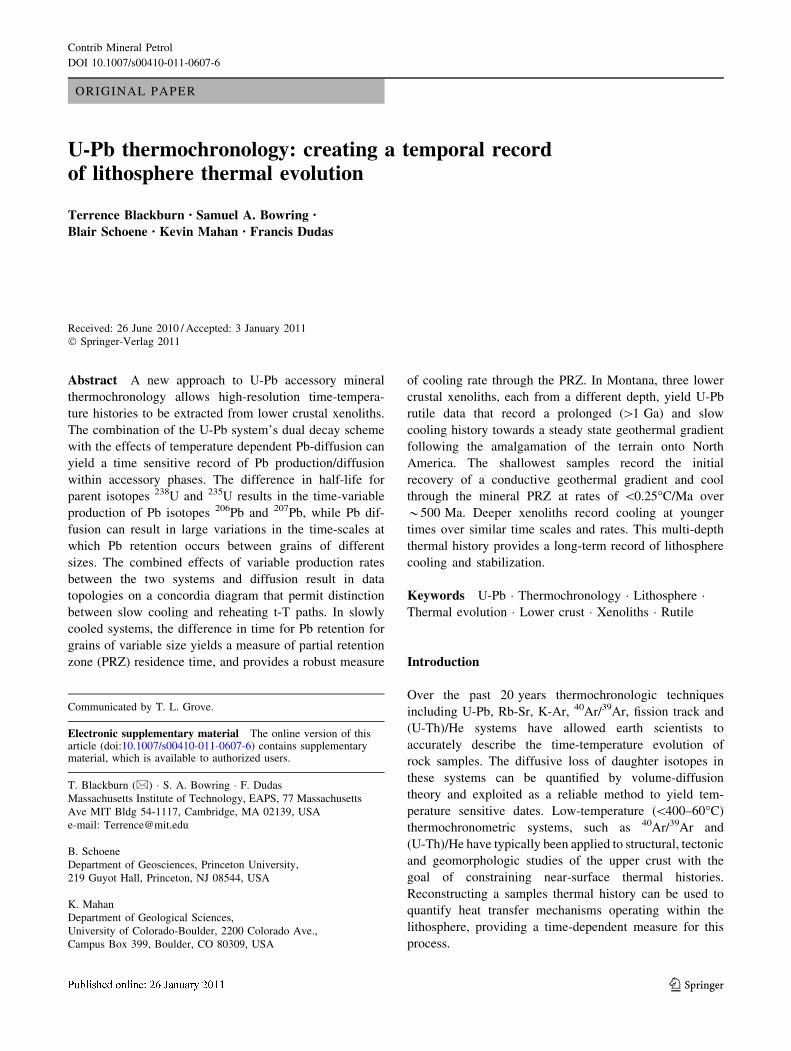
loss of Pb,. The topology of data predicted by the episodic
Pb-loss model is a straight line connecting the U/Pb ratios
corresponding to the time of initial system closure (t1) and
the time of system reset or partial reset (t2) (Fig. 1a). In this
model the variation in U/Pb ratios along this discordia line
is due to volume-diffusion’s dependence on diffusion
domain (a). The smallest domains are most susceptible to
loss and yield the youngest dates, while the larger domains
are less susceptible to Pb loss and yield older dates.
Seeking an alternative mechanism for Pb-loss within
zircons, Tilton (1960), suggested a model for the ‘contin-
uous’ loss of Pb within zircons. This diffusion model
assumed that zircon grains were continually losing lead
between the time of system formation until the time of
system closure. Tilton (1960) presented an analytical
solution to the diffusion equation for both U-Pb systems
and thus plotted on a U-Pb concordia diagram. This ana-
lytical solution is restricted to using a constant diffusivity,
i.e. temperature sensitive diffusivity cannot be modeled.
Results from this solution are plotted in Fig. 1b (cross
symbol). Start time in this sample calculation is 3,000 Ma.
Unlike the secondary Pb-loss event model, the modeled
data define a curvilinear array between the time of system
formation and the origin. The curvilinear diffusion trajec-
tory curves asymptomatically as it approaches the origin.
Contrib Mineral Petrol
123
The asymptotic nature of the Pb diffusion trajectory as it
approaches concordia is unique to continuous diffusion and
will serve as a characteristic signature within real data sets.
Though the analytical solutions are restricted to a con-
stant diffusivity, the difference in the data topology
between the two models demonstrates how powerful the
dual U-Pb system can be for monitoring time-variant Pb
diffusion. The Wetherill and Tilton models for Pb loss are
analogous to the end-member cases of reheating and slow
cooling t-T paths, respectively. Below we will show how
modeling reheating and slow cooling t-T paths within
systems obeying temperature dependent diffusion will
produce data topologies with the same distinguishable
characteristics as the Wetherill and Tilton models.
Numerical solution to diffusion equation
A more flexible solution to Eq. 1 by finite difference
methods can be used to calculate Pb concentration profiles
for grains with variable temperature dependent diffusivity.
A forward time, centered space solution to the diffusion
equation provides a means to forward model synthetic
U-Pb data for comparison to measured thermochronometric
data (Schoene and Bowring 2007). In general terms, the
concentration of radiogenic daughter is solved for by
assuming a time-temperature path, parent element distri-
bution, and grain size. Both age and grain size can be
accurately measured for each real grain that is dated. The
key parameter space that remains to be explored is the t-T
path. In this exploratory study we assume a homogenous
distribution of parent elements. By forward calculation of
the Pb concentrations for a series of grain sizes, we can
create a synthetic data set that includes the predicted Pb
diffusion profile, grain size vs. age curve, and data topol-
ogy in U-Pb concordia space, for any pre assumed t-T path.
The correct time temperature path is qualitatively deduced
by how synthetic data compare to measured thermochro-
nometric dates. The accuracy of the finite-difference
solution has been evaluated by comparing results (at a
constant T) to the analytical solution developed by Tilton
(1960). Figure 1b shows the results of a comparison of
constant diffusivity between the finite difference (circles)
and analytical solutions (cross). The U/Pb values produced
by the numerical solution agree with no more than 0.4%
deviation from the analytical solution.
Data topology
Resolving a unique cooling path
The nearly identical data produced by both slow cooling
and reheating has long been noted and debated in ther-
mochronology (Heizler 2002; Hodges and Bowring 1995;
Schoene and Bowring 2007). In past studies, geological
considerations and the magnitude of local and regional
thermal events have been used to decide between slow-
cooling and reheating t-T paths (Hodges and Bowring
1995). Ambiguity in a rock’s cooling path arises from the
possibility that data from internal diffusion profiles and
grain size-age relationships may be produced from either
slow-cooling or reheating time-temperature paths. The
finite difference solution to the diffusion equation can be
used to demonstrate how the dual decay scheme can be
0 2 4 6 8 10 12 14 16 180
0.1
0.2
0.3
0.4
0.5
0.6
0.7
Analytical Solution from Tilton, (1960)
Numerical Solution using explicit FD method
a
b
t1t2
timing of system formation
timing of Pb-loss event
smallest diffusion domains
largest diffusion domains
smallest diffusion domains
largest diffusion domains
0 2 4 6 8 10 12 14 16 18 200
0.1
0.2
0.3
0.4
0.5
0.6
0.7
t1
t2 small reheating event
medium reheating event
large reheating event
207 235Pb U
206
2
38P
b
U
207 235Pb U
206
2
38P
b
U
Fig. 1 Comparison of data topologies on U-Pb concordia diagram for
a Episodic/reheating and b continuous or slow cooling time
temperature paths. Forward calculated reheating time-temperature
paths are plotted as symbols along with the graphical solution in black(line) from Wetherill (1956) a Discordant arrays of data are produced
by rapidly cooling the sample at some initial time (t1) followed by a
secondary reheating event at t2. The reheating event is modeled as a
half-space model. Constant model parameters for all tested t-T paths
include: grain sizes, start temperature and time, distance of sample
from dike, diffusion kinetics, intrusion temperature and intrusion
time. Only the size of the intrusion is varied. b A comparison between
analytical (crosses) and numerical solution (circles) for continuous
diffusion is used to test the accuracy of the finite difference solution
Contrib Mineral Petrol
123
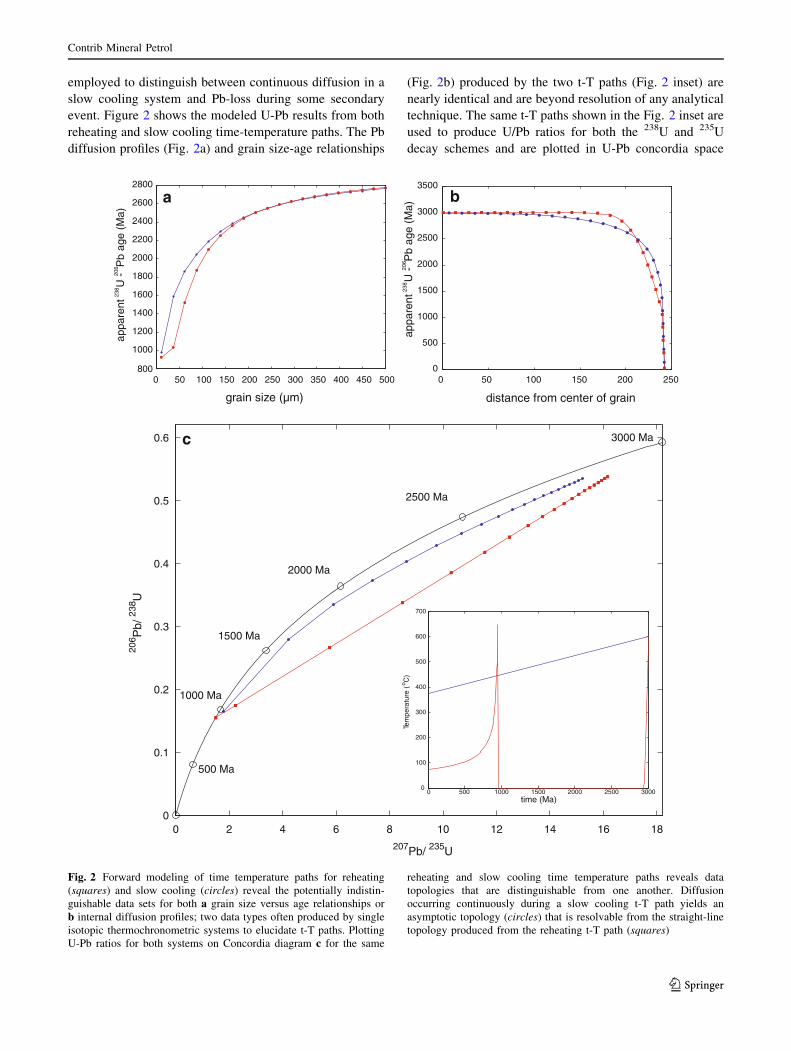
employed to distinguish between continuous diffusion in a
slow cooling system and Pb-loss during some secondary
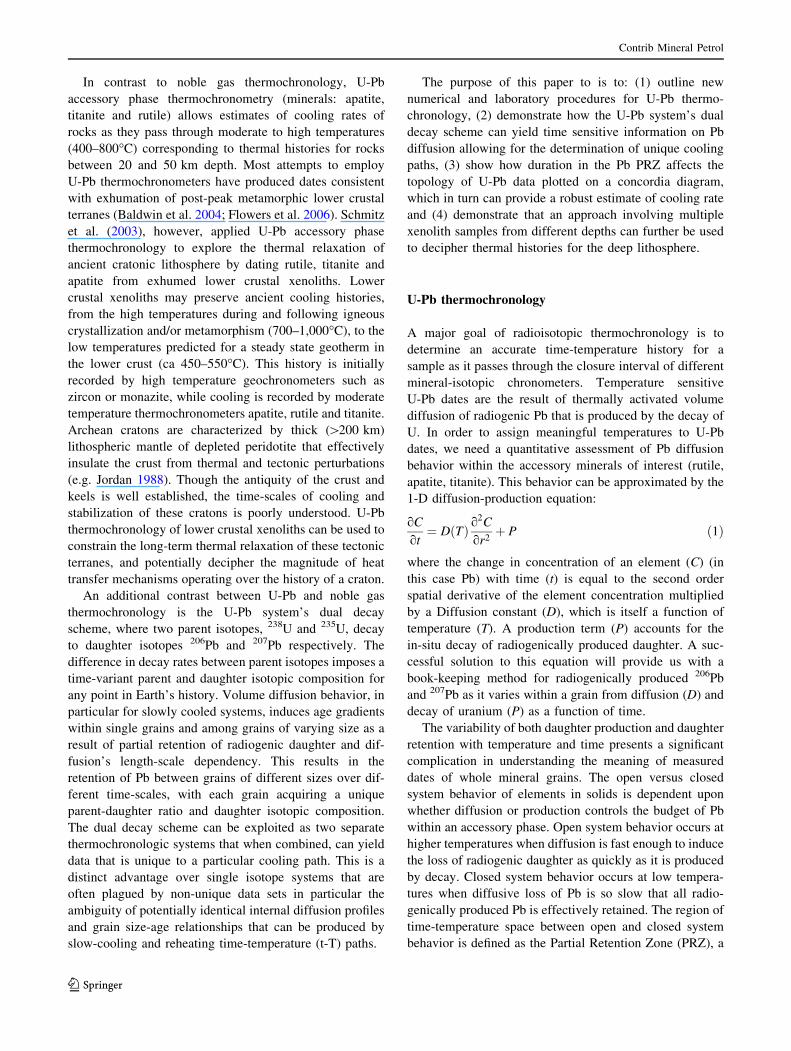
event. Figure 2 shows the modeled U-Pb results from both
reheating and slow cooling time-temperature paths. The Pb
diffusion profiles (Fig. 2a) and grain size-age relationships
(Fig. 2b) produced by the two t-T paths (Fig. 2 inset) are
nearly identical and are beyond resolution of any analytical
technique. The same t-T paths shown in the Fig. 2 inset are
used to produce U/Pb ratios for both the 238U and 235U
decay schemes and are plotted in U-Pb concordia space
0 2 4 6 8 10 12 14 16 180
0.1
0.2
0.3
0.4
0.5
0.6
1000 Ma
500 Ma
2500 Ma
2000 Ma
1500 Ma
3000 Ma
0 500 1000 1500 2000 2500 30000
100
200
300
400
500
600
700
time (Ma)
Tem
pera
ture
(o C
)
800
1000
1200
1400
1600
1800
2000
2200
2400
2600
2800
grain size (µm)
appa
rent
U
- P
b ag
e (M
a)23
8 20
6
a
0 50 100 150 200 250 300 350 400 450 500 0 50 100 150 200 2500
500
1000
1500
2000
2500
3000
3500
distance from center of grainap
pare
nt
U -
Pb
age
(Ma)
238
206
b
c
207Pb/ 235U
206 P
b/ 23
8 U
Fig. 2 Forward modeling of time temperature paths for reheating
(squares) and slow cooling (circles) reveal the potentially indistin-
guishable data sets for both a grain size versus age relationships or
b internal diffusion profiles; two data types often produced by single
isotopic thermochronometric systems to elucidate t-T paths. Plotting
U-Pb ratios for both systems on Concordia diagram c for the same
reheating and slow cooling time temperature paths reveals data
topologies that are distinguishable from one another. Diffusion
occurring continuously during a slow cooling t-T path yields an
asymptotic topology (circles) that is resolvable from the straight-line
topology produced from the reheating t-T path (squares)
Contrib Mineral Petrol
123
(Fig. 2c); the topologies are distinguishable for each t-T
path. The slow-cooling modeled data define curvilinear
arrays that become asymptotic near the lower intercept and
are easily distinguishable from the straight-line of the
reheating t-T path. The topology of data exhibited by a
single sample will be an important tool to deciphering
cooling paths for the case study region presented below. In
the following sections we will explore why each t-T path
results in the data topologies and how we can exploit these
data trends to further interpret a samples t-T path.
Interpreting thermochronologic data on a concordia
diagram also allows users to extract cooling rates from
samples that do not exhibit perfect single domain behavior.
In a grain size versus age plot (Fig. 2c), an internal fast
diffusion pathway (grain cracks, defects or inter-growths)
would yield a younger measured date and thus ‘fall’ off an
array of data points. On a concordia diagram this data would
still lie on the diffusion trajectory, however the data would
have lower 206Pb/238U and 207Pb/235U ratios than well-
behaved single domain grains of the same size. Mixing two
separate diffusion domains that have experienced the same
thermal history will always plot on the diffusion trajectory
as a mixture between the domain sizes (Tilton 1960).
Slow cooling: relationship between internal Pb profiles
and whole grain U-Pb dates
Diffusion is a length-scale dependent process. As such,
radiogenic daughter that is produced within the cores of
grains has a physically longer distance to travel than the
daughter product produced at the edges. This results in a
difference in the time of grain core versus rim closure. In the
context of the slow cooling model the timing of entry and
exit into the PRZ is recorded by the core and rims of a grain,
respectively. If the sample cooled slowly enough, the
resulting difference in time between core and rim closure
may be significant, with longer durations in the PRZ yielding
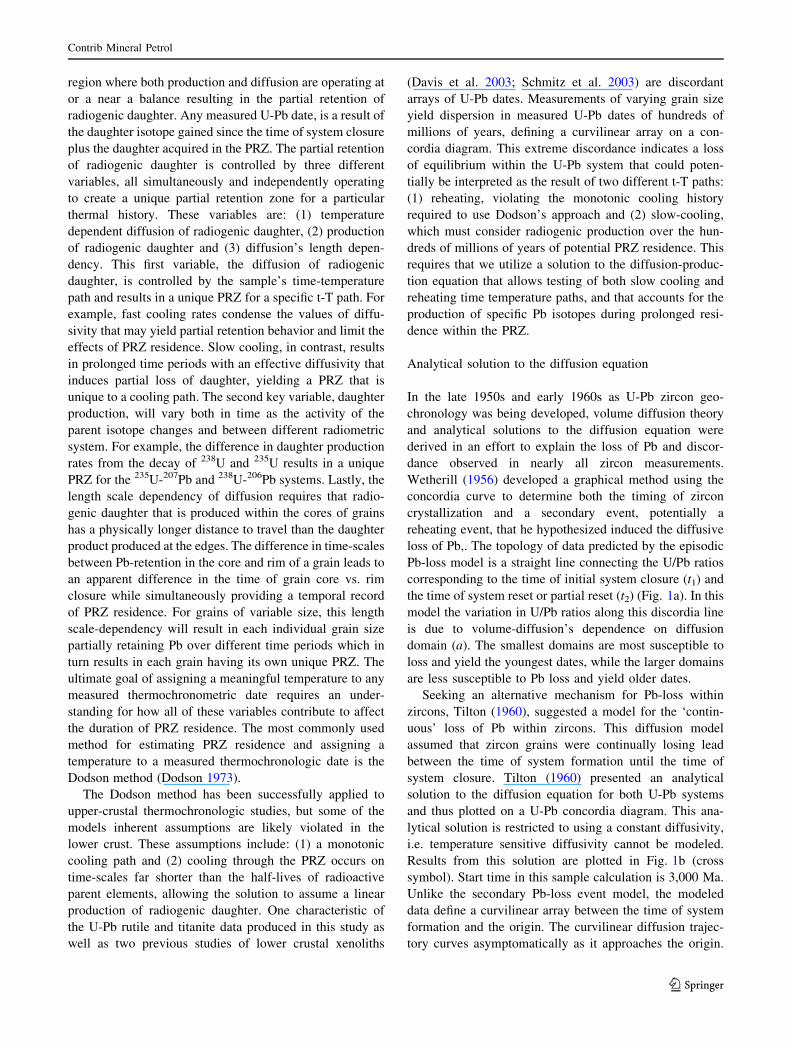
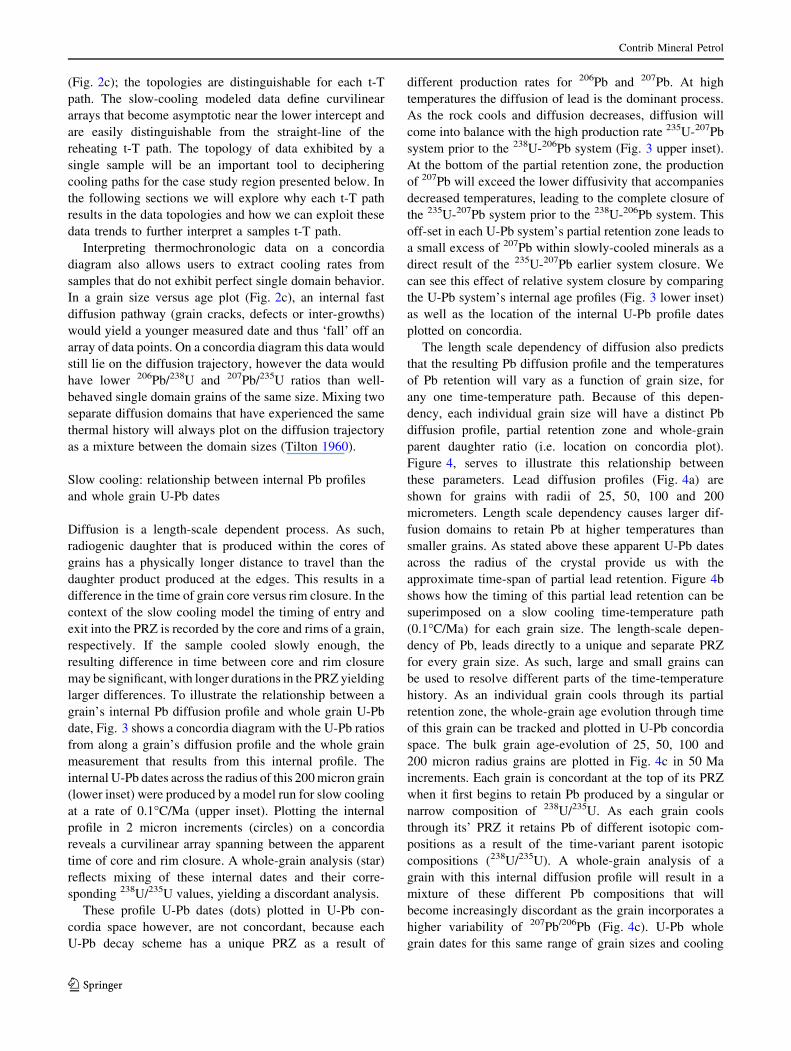
larger differences. To illustrate the relationship between a
grain’s internal Pb diffusion profile and whole grain U-Pb
date, Fig. 3 shows a concordia diagram with the U-Pb ratios
from along a grain’s diffusion profile and the whole grain
measurement that results from this internal profile. The
internal U-Pb dates across the radius of this 200 micron grain
(lower inset) were produced by a model run for slow cooling
at a rate of 0.1�C/Ma (upper inset). Plotting the internal
profile in 2 micron increments (circles) on a concordia
reveals a curvilinear array spanning between the apparent
time of core and rim closure. A whole-grain analysis (star)
reflects mixing of these internal dates and their corre-
sponding 238U/235U values, yielding a discordant analysis.
These profile U-Pb dates (dots) plotted in U-Pb con-
cordia space however, are not concordant, because each
U-Pb decay scheme has a unique PRZ as a result of
different production rates for 206Pb and 207Pb. At high
temperatures the diffusion of lead is the dominant process.
As the rock cools and diffusion decreases, diffusion will
come into balance with the high production rate 235U-207Pb
system prior to the 238U-206Pb system (Fig. 3 upper inset).
At the bottom of the partial retention zone, the production
of 207Pb will exceed the lower diffusivity that accompanies
decreased temperatures, leading to the complete closure of
the 235U-207Pb system prior to the 238U-206Pb system. This
off-set in each U-Pb system’s partial retention zone leads to
a small excess of 207Pb within slowly-cooled minerals as a
direct result of the 235U-207Pb earlier system closure. We
can see this effect of relative system closure by comparing
the U-Pb system’s internal age profiles (Fig. 3 lower inset)
as well as the location of the internal U-Pb profile dates
plotted on concordia.
The length scale dependency of diffusion also predicts
that the resulting Pb diffusion profile and the temperatures
of Pb retention will vary as a function of grain size, for
any one time-temperature path. Because of this depen-
dency, each individual grain size will have a distinct Pb
diffusion profile, partial retention zone and whole-grain
parent daughter ratio (i.e. location on concordia plot).
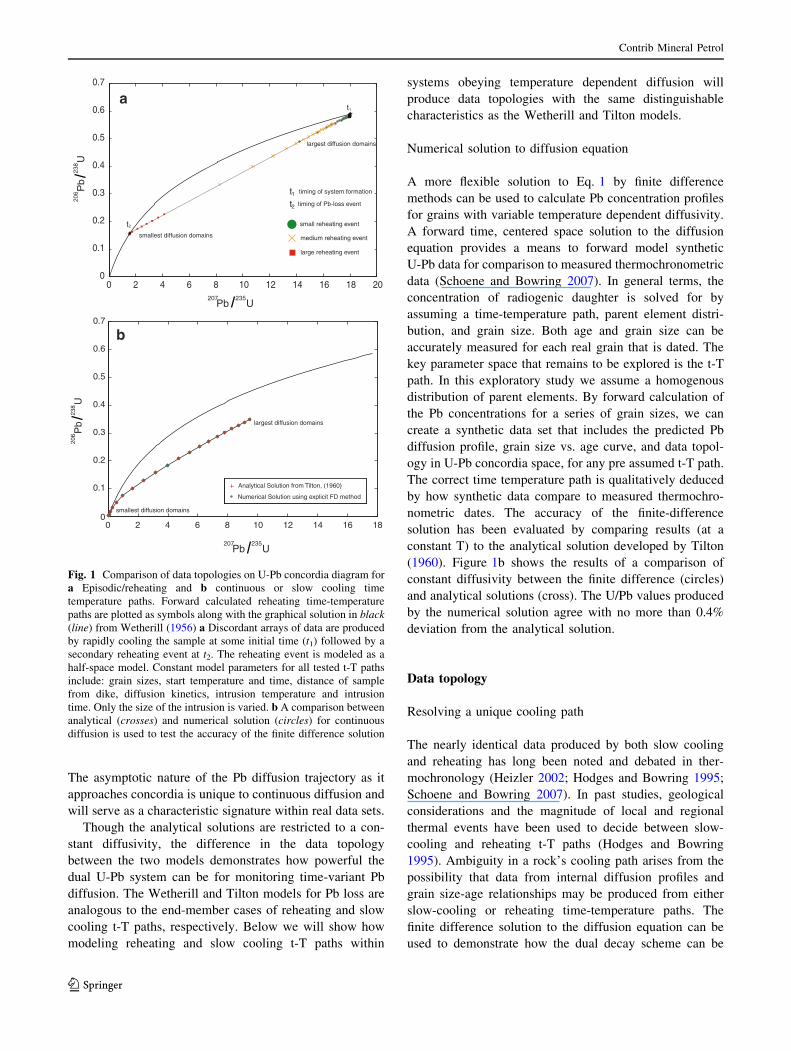
Figure 4, serves to illustrate this relationship between
these parameters. Lead diffusion profiles (Fig. 4a) are
shown for grains with radii of 25, 50, 100 and 200
micrometers. Length scale dependency causes larger dif-
fusion domains to retain Pb at higher temperatures than
smaller grains. As stated above these apparent U-Pb dates
across the radius of the crystal provide us with the
approximate time-span of partial lead retention. Figure 4b
shows how the timing of this partial lead retention can be
superimposed on a slow cooling time-temperature path
(0.1�C/Ma) for each grain size. The length-scale depen-
dency of Pb, leads directly to a unique and separate PRZ
for every grain size. As such, large and small grains can
be used to resolve different parts of the time-temperature
history. As an individual grain cools through its partial
retention zone, the whole-grain age evolution through time
of this grain can be tracked and plotted in U-Pb concordia
space. The bulk grain age-evolution of 25, 50, 100 and
200 micron radius grains are plotted in Fig. 4c in 50 Ma
increments. Each grain is concordant at the top of its PRZ
when it first begins to retain Pb produced by a singular or
narrow composition of 238U/235U. As each grain cools
through its’ PRZ it retains Pb of different isotopic com-
positions as a result of the time-variant parent isotopic
compositions (238U/235U). A whole-grain analysis of a
grain with this internal diffusion profile will result in a
mixture of these different Pb compositions that will
become increasingly discordant as the grain incorporates a
higher variability of 207Pb/206Pb (Fig. 4c). U-Pb whole
grain dates for this same range of grain sizes and cooling
Contrib Mineral Petrol
123
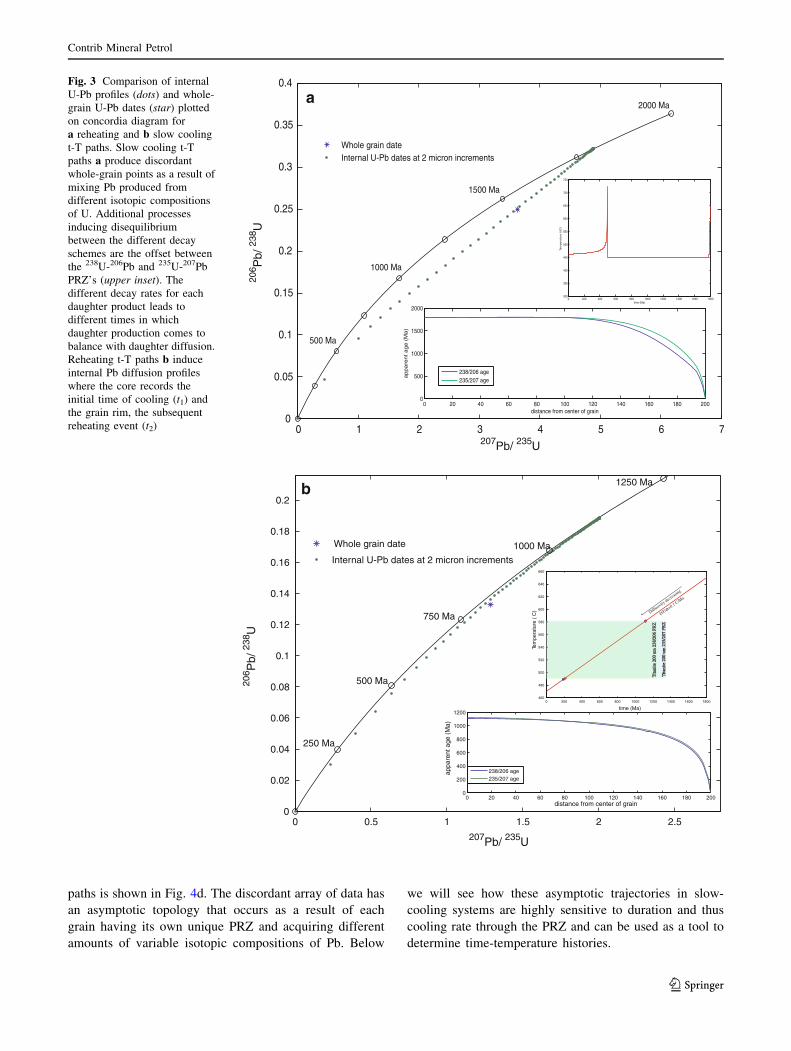
paths is shown in Fig. 4d. The discordant array of data has
an asymptotic topology that occurs as a result of each
grain having its own unique PRZ and acquiring different
amounts of variable isotopic compositions of Pb. Below
we will see how these asymptotic trajectories in slow-
cooling systems are highly sensitive to duration and thus
cooling rate through the PRZ and can be used as a tool to
determine time-temperature histories.
0 1 2 3 4 5 6 70
0.05
0.1
0.15
0.2
0.25
0.3
0.35
0.4
Whole grain dateInternal U-Pb dates at 2 micron increments
500 Ma
1000 Ma
1500 Ma
2000 Ma
0 20 40 60 80 100 120 140 160 180 2000
500
1000
1500
2000
distance from center of graina
pp
are
nt
ag
e (
Ma
)
238/206 age235/207 age
0 200 400 600 800 1000 1200 1400 1600 1800300
350
400
450
500
550
600
650
700
750
time (Ma)
Tem
pera
ture
(ûC
)
a
0 0.5 1 1.5 2 2.50
0.02
0.04
0.06
0.08
0.1
0.12
0.14
0.16
0.18
0.2
Whole grain date
Internal U-Pb dates at 2 micron increments
250 Ma
500 Ma
750 Ma
1000 Ma
1250 Ma
0 20 40 60 80 100 120 140 160 180 2000
200
400
600
800
1000
1200
distance from center of grain
appa
rent
age
(M
a)
238/206 age235/207 age
0 200 400 600 800 1000 1200 1400 1600 1800460
480
500
520
540
560
580
600
620
640
660
time (Ma)
Tita
nite
200
um
235
/207
PR
ZT
itani
te 2
00 u
m 2
35/2
07 P
RZ
Diffusiv
ity decr
easing
Tita
nite
200
um
238
/206
PR
ZT
itani
te 2
00 u
m 2
3 8/2
06 P
RZ
Tem
pera
ture
( C
)o
DT/dt=0.1 C/Ma
o
b
207Pb/ 235U
207Pb/ 235U
206 P
b/ 23
8 U20
6 Pb/
238 U
Fig. 3 Comparison of internal
U-Pb profiles (dots) and whole-
grain U-Pb dates (star) plotted
on concordia diagram for
a reheating and b slow cooling
t-T paths. Slow cooling t-T
paths a produce discordant
whole-grain points as a result of
mixing Pb produced from
different isotopic compositions
of U. Additional processes
inducing disequilibrium
between the different decay
schemes are the offset between
the 238U-206Pb and 235U-207Pb
PRZ’s (upper inset). The
different decay rates for each
daughter product leads to
different times in which
daughter production comes to
balance with daughter diffusion.
Reheating t-T paths b induce
internal Pb diffusion profiles
where the core records the
initial time of cooling (t1) and
the grain rim, the subsequent
reheating event (t2)
Contrib Mineral Petrol
123
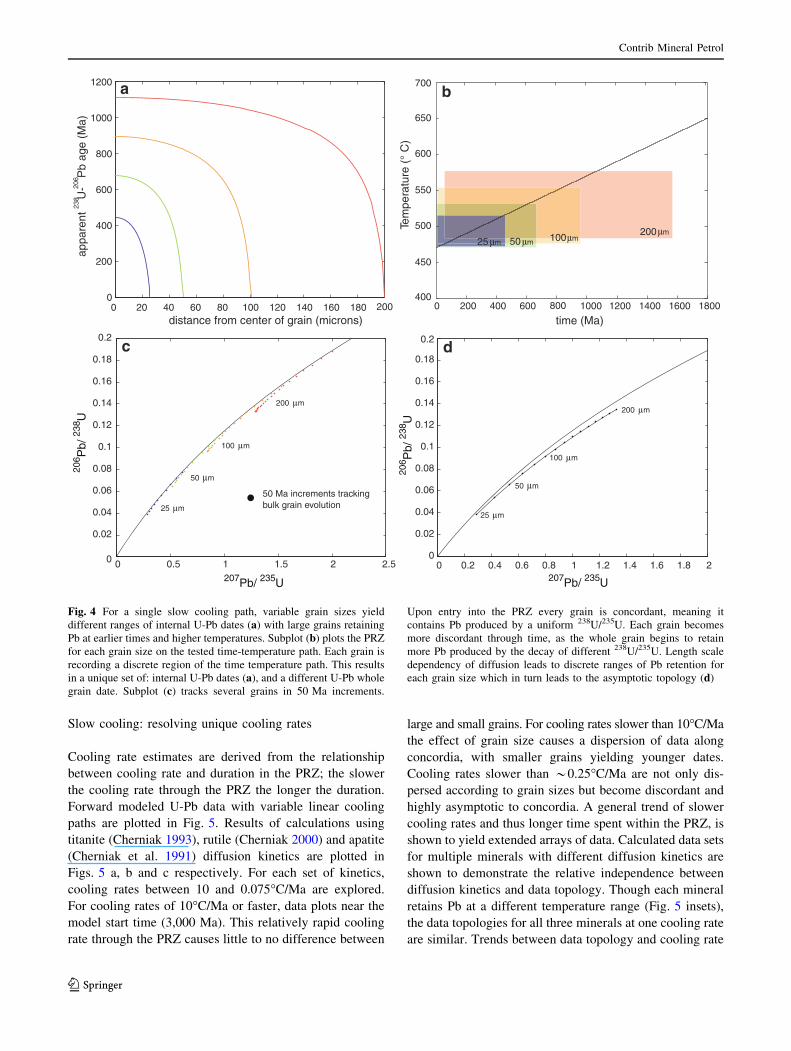
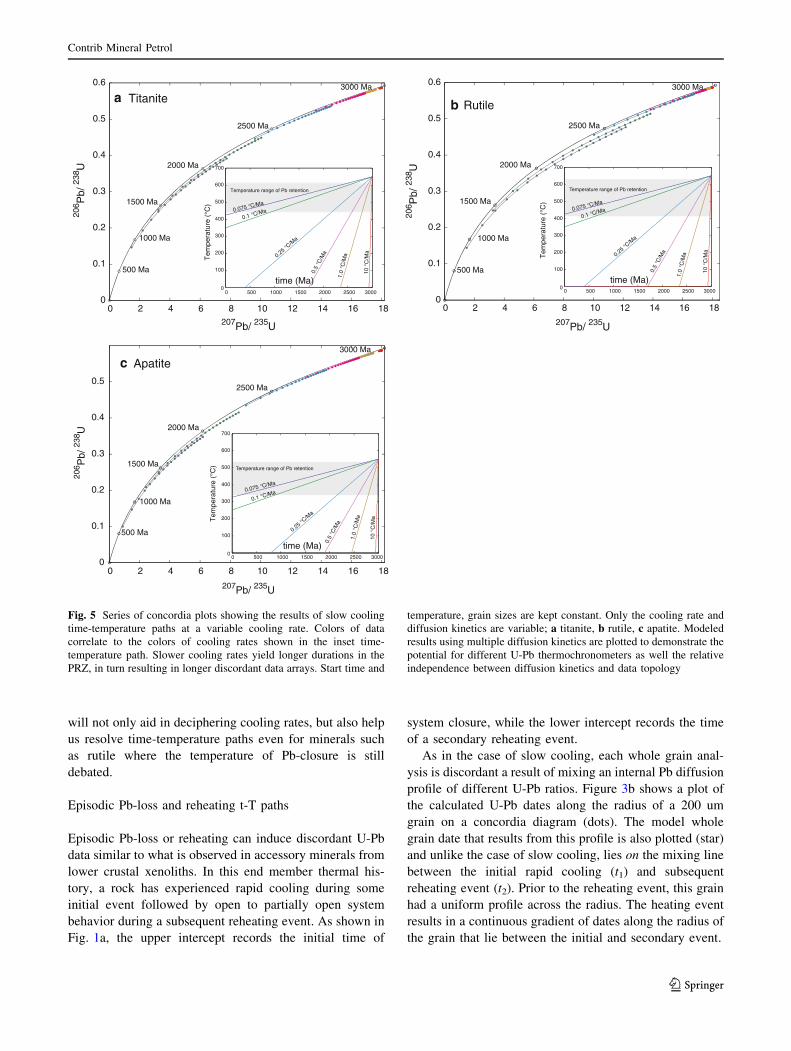
Slow cooling: resolving unique cooling rates
Cooling rate estimates are derived from the relationship
between cooling rate and duration in the PRZ; the slower
the cooling rate through the PRZ the longer the duration.
Forward modeled U-Pb data with variable linear cooling
paths are plotted in Fig. 5. Results of calculations using
titanite (Cherniak 1993), rutile (Cherniak 2000) and apatite
(Cherniak et al. 1991) diffusion kinetics are plotted in
Figs. 5 a, b and c respectively. For each set of kinetics,
cooling rates between 10 and 0.075�C/Ma are explored.
For cooling rates of 10�C/Ma or faster, data plots near the
model start time (3,000 Ma). This relatively rapid cooling
rate through the PRZ causes little to no difference between
large and small grains. For cooling rates slower than 10�C/Ma
the effect of grain size causes a dispersion of data along
concordia, with smaller grains yielding younger dates.
Cooling rates slower than *0.25�C/Ma are not only dis-
persed according to grain sizes but become discordant and
highly asymptotic to concordia. A general trend of slower
cooling rates and thus longer time spent within the PRZ, is
shown to yield extended arrays of data. Calculated data sets
for multiple minerals with different diffusion kinetics are
shown to demonstrate the relative independence between
diffusion kinetics and data topology. Though each mineral
retains Pb at a different temperature range (Fig. 5 insets),
the data topologies for all three minerals at one cooling rate
are similar. Trends between data topology and cooling rate
b
25 m
0 200 400 600 800 1000 1200 1400 1600 1800400
450
500
550
600
650
700
Tem
pera
ture
(°
C)
0.2
distance from center of grain (microns)
0
200
400
600
800
1000
1200
0 20 40 60 80 100 120 140 160 180 200
25 m
100 m
200 m
50 m
time (Ma)
0 0.2 0.4 0.6 0.8 1 1.2 1.4 1.6 1.8 20
0.02
0.04
0.06
0.08
0.1
0.12
0.14
0.16
0.18d
50 Ma increments trackingbulk grain evolution
0 0.5 1 1.5 2 2.50
0.02
0.04
0.06
0.08
0.1
0.12
0.14
0.16
0.18
0.2
25 m
100 m
200 m
50 m
c
a
50 m 100 m 200 m
appa
rent
U
- P
b ag
e (M
a)23
820
6
207Pb/ 235U 207Pb/ 235U
206 P
b/ 23
8 U
206 P
b/ 23
8 U
Fig. 4 For a single slow cooling path, variable grain sizes yield
different ranges of internal U-Pb dates (a) with large grains retaining
Pb at earlier times and higher temperatures. Subplot (b) plots the PRZ
for each grain size on the tested time-temperature path. Each grain is
recording a discrete region of the time temperature path. This results
in a unique set of: internal U-Pb dates (a), and a different U-Pb whole
grain date. Subplot (c) tracks several grains in 50 Ma increments.
Upon entry into the PRZ every grain is concordant, meaning it
contains Pb produced by a uniform 238U/235U. Each grain becomes
more discordant through time, as the whole grain begins to retain
more Pb produced by the decay of different 238U/235U. Length scale
dependency of diffusion leads to discrete ranges of Pb retention for
each grain size which in turn leads to the asymptotic topology (d)
Contrib Mineral Petrol
123
will not only aid in deciphering cooling rates, but also help
us resolve time-temperature paths even for minerals such
as rutile where the temperature of Pb-closure is still
debated.
Episodic Pb-loss and reheating t-T paths
Episodic Pb-loss or reheating can induce discordant U-Pb
data similar to what is observed in accessory minerals from
lower crustal xenoliths. In this end member thermal his-
tory, a rock has experienced rapid cooling during some
initial event followed by open to partially open system
behavior during a subsequent reheating event. As shown in
Fig. 1a, the upper intercept records the initial time of
system closure, while the lower intercept records the time
of a secondary reheating event.
As in the case of slow cooling, each whole grain anal-
ysis is discordant a result of mixing an internal Pb diffusion
profile of different U-Pb ratios. Figure 3b shows a plot of
the calculated U-Pb dates along the radius of a 200 um
grain on a concordia diagram (dots). The model whole
grain date that results from this profile is also plotted (star)
and unlike the case of slow cooling, lies on the mixing line
between the initial rapid cooling (t1) and subsequent
reheating event (t2). Prior to the reheating event, this grain
had a uniform profile across the radius. The heating event
results in a continuous gradient of dates along the radius of
the grain that lie between the initial and secondary event.
0 2 4 6 8 10 12 14 16 180
0.1
a
c
b
0.2
0.3
0.4
0.5
0.6
207Pb/ 235U
206 P
b/ 23
8 U
Titanite3000 Ma
2500 Ma
2000 Ma
1500 Ma
1000 Ma
500 Ma
2500 Ma
0 2 4 6 8 10 12 14 16 180
0.1
0.2
0.3
0.4
0.5
0.6
207Pb/ 235U
206 P
b/ 23
8 U
Rutile
3000 Ma
2000 Ma
1500 Ma
1000 Ma
500 Ma
3000 Ma
2500 Ma
2000 Ma
1500 Ma
1000 Ma
500 Ma
0 2 4 6 8 10 12 14 16 180
0.1
0.2
0.3
0.4
0.5
207Pb/ 235U
206 P
b/ 23
8 U
Apatite
0 500 1000 1500 2000 2500 30000
100
200
300
400
500
600
700
0.075 °C/Ma
0.1 °C/Ma
0.25 °C/M
a
0.5
°C/M
a
1.0
°C/M
a
10 °
C/M
a
Temperature range of Pb retention
0 500 1000 1500 2000 2500 30000
100
200
300
400
500
600
700
0.075 °C/Ma
0.1 °C/Ma
0.25 °C/M
a
0.5
°C/M
a
1.0
°C/M
a aM/
C° 01
Temperature range of Pb retention
0 500 1000 1500 2000 2500 30000
100
200
300
400
500
600
700
time (Ma)
0.075 °C/Ma
0.1 °C/Ma
0.25 °C/M
a
0.5
°C/M
a
1.0
°C/M
a
10 °
C/M
a
Temperature range of Pb retention
Tem
pera
ture
(°C
)
time (Ma)
Tem
pera
ture
(°C
)
time (Ma)
Tem
pera
ture
(°C
)
Fig. 5 Series of concordia plots showing the results of slow cooling
time-temperature paths at a variable cooling rate. Colors of data
correlate to the colors of cooling rates shown in the inset time-
temperature path. Slower cooling rates yield longer durations in the
PRZ, in turn resulting in longer discordant data arrays. Start time and
temperature, grain sizes are kept constant. Only the cooling rate and
diffusion kinetics are variable; a titanite, b rutile, c apatite. Modeled
results using multiple diffusion kinetics are plotted to demonstrate the
potential for different U-Pb thermochronometers as well the relative
independence between diffusion kinetics and data topology
Contrib Mineral Petrol
123

The finite difference diffusion model allows us to
explore the effects of different heating magnitudes and
durations. Figure 1 shows the results of forward modeled
titanite U-Pb dates for reheating of grains of varying size.
A reheating event at 1,000 Ma is modeled as a dike or half-
space intrusion of variable half-widths and an initial tem-
perature of 1,200�C. All parameters, including start time
and temperature, distance from the intrusion to the sample,
grain sizes and initial cooling rate are held constant. Only
the size of the intrusion is varied between model runs.
Comparison of reheating data sets to the linear cooling
reveal that heating events such as the 100 m half-width
dike cause sufficient lead loss to completely change the
data topology. Much like the internal profile for a reheating
path shown in Fig. 3b, the variable grain size data define a
linear array between the initial start of the system and the
time of reheating (Fig. 1b). Small deviations from the
linear array are due to the conductive cooling of the half-
space after reheating. Larger intrusions on the order of
1 km, yield extremely discordant data arrays that nearly
span the distance between primary and secondary events.
A large event will induce almost complete Pb loss, with
modeled data clustered at a lower intercept. For a given
mineral, there is a trade-off between duration and tem-
perature of heating events such that small intrusions of high
temperature can induce the same Pb loss as larger intru-
sions at lower temperatures. Analysis of multiple thermo-
chronometers can solve this ambiguity and deliver a unique
cooling path (Schoene and Bowring 2007).
Multiple sample approach
In addition to using the topology of individual data sets to
determine cooling path and rate, we can employ a multiple
sample approach where data from multiple xenoliths, each
of a different depth, contribute to a unique thermal history
for the entire lithospheric column. This method assumes
that the thermal history recorded by a suite of xenoliths
reflects that of the lithosphere. Let us consider the two end-
member t-T paths of reheating and slow cooling within a
section of lithosphere where three xenoliths, each from a
different depth are dated.
Slow cooling t-T paths for samples of variable depth can
be modeled by allowing a column of lithosphere at a
specified initial temperature, thickness and internal heat
production, to cool by conduction. The purpose of this
thermal model is to predict how variable depths influence
the time temperature path and the resulting U-Pb therm-
ochronometric data. Time-temperature paths for ‘samples’
at 20, 30 and 40 km depths within the lithosphere have the
same shape, cool at comparable rates, but at different times
(Fig. 6a). The initial cooling along an exponential t-T path
is controlled by sample depth, with the shallowest samples
cooling fastest and the deep sample the slowest. Once a
near steady thermal state is reached, however, samples cool
at similar rates independent of residence depth (Fig. 6a
inset). Like modeled data from previous slow cooling
model runs, modeled U-Pb data arrays are highly discor-
dant and become asymptotic to concordia. Because the
0 0.5 1 1.5 2 2.5 3 3.5 4 4.5 50
0.05
0.1
0.15
0.2
0.25
0.3
207Pb/ 235U
206 P
b/ 23
8 U
0 500 1000 1500 2000450
500
550
time (Ma)
500 Ma
1000 Ma
1500 Ma
Tem
pera
ture
(°C
)
20 km
30 km
40 km
Intrusionhalf-space
20 km
30 km
40 km
0 0.5 1 1.5 2 2.5 3 3.50
0.05
0.1
0.15
0.2
0.25
207Pb/ 235U
206 P
b/ 23
8 U
500 Ma
1000 Ma
1500 Ma
0 500 1000 1500300
400
500
600
700
800
time (Ma)
Tem
pera
ture
(° C
)
0 200 400 600 800 1000 1200 250
200
150
100
50
0
Temperature (°C)
dept
h (k
m)
40 km
35 km
30 km
a b
Fig. 6 Forward modeling U-Pb data for multiple xenolith samples of
different depths within the lithosphere produced by thermal models
for lithosphere a slow cooling and b reheating. Multiple sample
analyses of a Slow cooling b lithosphere yields curvilinear discordant
arrays of U-Pb data with resolvable and unique upper and lower
intercepts. Reheated lithosphere (a) produce overlapping straightlines of discordant U-Pb data with a common irresolvable lower
intercept. The intercepts of these lines are coincident in with the
timing of initial cooling and the reheating event or with cooling
shortly after
Contrib Mineral Petrol
123
time of entry and exit into the PRZ is different for each
depth, both the lower and upper intercepts of these data
arrays are resolvable from one another.
A similar multiple sample analog can be set up to
examine the effects of reheating on a column of lithosphere
where 3 xenolith samples, each at a different depth, are
heated during a large-scale regional thermal event. The
duration and temperature of reheating events required to
induce a similar magnitude of discordance as those observed
in the data are considerable ([50% fractional loss Pb);
requiring holding times on the order of millions of years for
reheating events below 1,000�C and durations in the hun-
dreds to thousands of years at mantle temperatures (Schmitz
et al. 2003). Any significant thermal event such as this will
likely be recorded by each sample within the lithosphere
with the effects of the reheating event varying as function of
the sample distance from the heat source. To simulate this
setting, a half-space model was used to heat the base of the
lithosphere, with samples positioned at 20, 30 and 40 km
from the heat source margin (Fig. 6b inset). Because each
sample is from a different distance from the source of heat,
each will experience a different magnitude of reheating,
simulating the effects of variable xenolith residence depth.
The U-Pb thermochronologic data that results from t-T paths
for each sample are plotted on concordia diagram in Fig. 6b.
Unlike the slow cooling end member, the discordant arrays
of data share a common lower intercept that is coincident in
time with the reheating event.
Testing the effects of magmatic exhumation
In addition to understanding the thermal history of lower
crustal samples, we must quantify the thermal affects of
volcanic exhumation on the U-Pb systematics in accessory
phases. Petrologic and experimental studies of xenolith
bearing magmas (Canil and Fedortchouk 1999; Edgar et al.
1988; Eggler and Wendlandt 1979; Esperanca and
Holloway 1987) along with dynamical force balancing
(Morin and Corriveau 1996; Sparks et al. 2006; Spera
1984) allow us to estimate the temperatures and holding
times experienced by a lower crustal sample during exhu-
mation. These conditions can then be used to calculate the
minimum temperatures and holding times required to per-
turb U-Pb systematics within accessory phases.
Reliable estimates of xenolith residence time and host
magma temperature are key to understanding the effects of
volcanic exhumation on U-Pb systematics. Magma ascent
rates for alkalic, mantle-derived magmas can in general be
considered a rapid process. The occasional presence of
diamonds, abundant xenoliths, some as large as 100 cm in
diameter, imply that eruption rates are fast enough to
transport the xenolith load from lower crustal and upper
mantle depths. Typical ascent rates for alkaline magmas
are estimated to be on the order of 101–103 cm/s or 1–5 day
durations from upper mantle to lower crustal depths
(Rutherford 2008). Kimberlite and minette eruption rates
have been further refined to rates on the order of hours to
days by both dynamic calculations and experimental
studies (Canil and Fedortchouk 1999; Morin and Corriveau
1996; Rutherford 2008). An upper bound of magma tem-
peratures can be provided from estimates of magma liq-
uidus temperatures, which for kimberlite and minette
magmas has been estimated between 1,050 and 1,200�C
(Edgar et al. 1988; Eggler and Wendlandt 1979; Esperanca
and Holloway 1987). The actual magma transport tem-
peratures are likely lower than the liquidus temperatures as
a result of heat loss to country rock/xenoliths and volatile
degassing (Sparks et al. 2006).
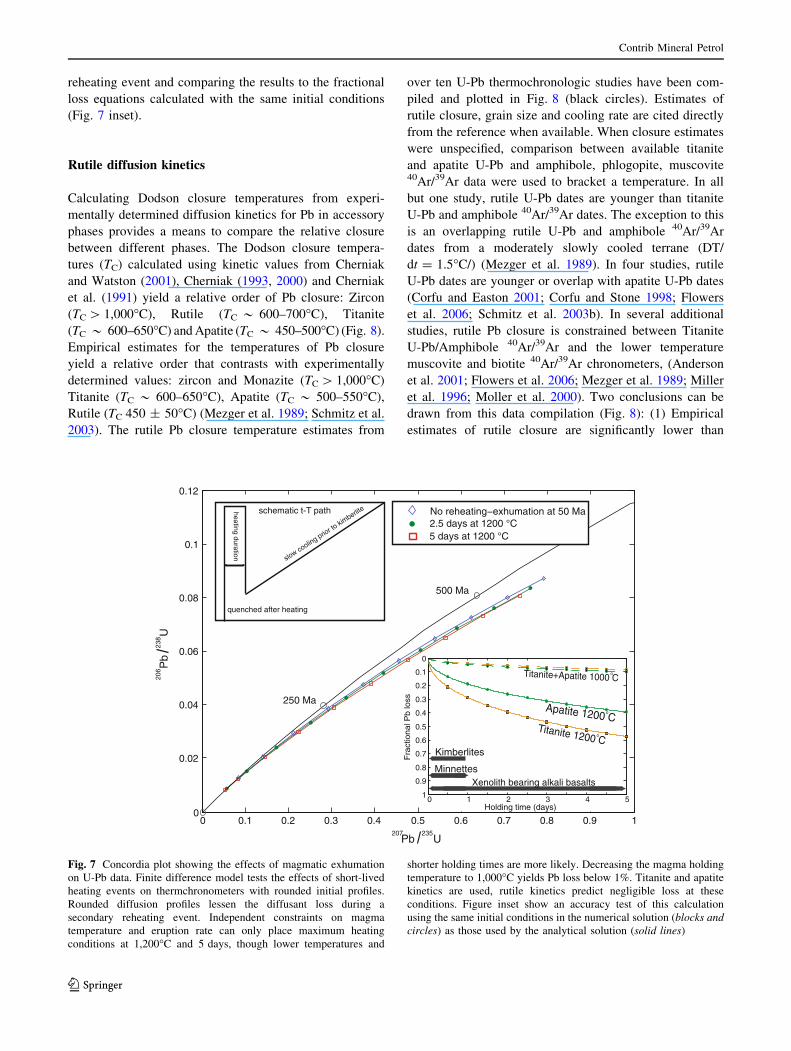
The extreme upper boundary conditions of 5 days and
1,200�C can be used to estimate the maximum effects of
volcanic transport on the topology of U-Pb data. This
calculation has typically been solved for using the frac-
tional loss equations from Crank (1956). This calculation
provides us only with a minimum estimate to the condi-
tions required to induce Pb-loss, as the solution assumes a
homogenous initial distribution of diffusant within the
crystal prior to perturbation. Accessory minerals that have
experienced slow cooling or reheating, however, have pre-
existing rounded diffusion profiles that will respond more
slowly to diffusive loss during thermal perturbation. In
reality the transporting magma would have to be hotter
and/or heat longer to induce the same amount of fractional
loss as with a homogenous distribution of Pb. The finite
different model presented above can be used to simulate
the conditions of magmatic heating on a rounded diffusion
profile demonstrating that the fractional loss of Pb is as
much as 10% less with a rounded initial profile when
compared to a homogenous one. The finite difference
calculation suggests that short-lived high temperature
heating events of this magnitude do induce some Pb-loss
even on grains with rounded initial profiles. Figure 7 shows
the predicted effect of magmatic heating on U-Pb ther-
mochronologic data. The 5 day maximum of holding time
at the temperature of 1,200�C is shown to have a slight
effect on the topology of U-Pb data, shifting all data points
to lower U/Pb values. The loss of Pb, however, has little
effect on the topology of U-Pb data and the final inter-
pretation of a t-T path. This observation coupled with the
likelihood that the eruptions of the xenolith bearing lavas
are likely faster and cooler than the maximum limit mod-
eled here, suggest that the effect of Pb loss from magmatic
heating can largely be ignored. Only titanite and apatite
kinetics allow loss of Pb, there is no appreciable Pb loss
(\0.25%) using rutile diffusion kinetics. The accuracy of
this finite difference calculation can be tested using a
homogenous initial concentration of Pb prior to the
Contrib Mineral Petrol
123
reheating event and comparing the results to the fractional
loss equations calculated with the same initial conditions
(Fig. 7 inset).
Rutile diffusion kinetics
Calculating Dodson closure temperatures from experi-
mentally determined diffusion kinetics for Pb in accessory
phases provides a means to compare the relative closure
between different phases. The Dodson closure tempera-
tures (TC) calculated using kinetic values from Cherniak
and Watston (2001), Cherniak (1993, 2000) and Cherniak
et al. (1991) yield a relative order of Pb closure: Zircon
(TC [ 1,000�C), Rutile (TC * 600–700�C), Titanite
(TC * 600–650�C) and Apatite (TC * 450–500�C) (Fig. 8).
Empirical estimates for the temperatures of Pb closure
yield a relative order that contrasts with experimentally
determined values: zircon and Monazite (TC [ 1,000�C)
Titanite (TC * 600–650�C), Apatite (TC * 500–550�C),
Rutile (TC 450 ± 50�C) (Mezger et al. 1989; Schmitz et al.
2003). The rutile Pb closure temperature estimates from
over ten U-Pb thermochronologic studies have been com-
piled and plotted in Fig. 8 (black circles). Estimates of
rutile closure, grain size and cooling rate are cited directly
from the reference when available. When closure estimates
were unspecified, comparison between available titanite
and apatite U-Pb and amphibole, phlogopite, muscovite40Ar/39Ar data were used to bracket a temperature. In all
but one study, rutile U-Pb dates are younger than titanite
U-Pb and amphibole 40Ar/39Ar dates. The exception to this
is an overlapping rutile U-Pb and amphibole 40Ar/39Ar
dates from a moderately slowly cooled terrane (DT/
dt = 1.5�C/) (Mezger et al. 1989). In four studies, rutile
U-Pb dates are younger or overlap with apatite U-Pb dates
(Corfu and Easton 2001; Corfu and Stone 1998; Flowers
et al. 2006; Schmitz et al. 2003b). In several additional
studies, rutile Pb closure is constrained between Titanite
U-Pb/Amphibole 40Ar/39Ar and the lower temperature
muscovite and biotite 40Ar/39Ar chronometers, (Anderson
et al. 2001; Flowers et al. 2006; Mezger et al. 1989; Miller
et al. 1996; Moller et al. 2000). Two conclusions can be
drawn from this data compilation (Fig. 8): (1) Empirical
estimates of rutile closure are significantly lower than
0 0.1 0.2 0.3 0.4 0.5 0.6 0.7 0.8 0.9 10
0.02
0.04
0.06
0.08
0.1
0.12
250 Ma
500 Ma
heating duration
quenched after heating
slow cooling prior to
kimberlit
e schematic t-T path
207 235Pb U
206
2
38P
b
U
No reheating−exhumation at 50 Ma
5 days at 1200 °C2.5 days at 1200 °C
0 1 2 3 4 5
0
0.1
0.2
0.3
0.4
0.5
0.6
0.7
0.8
0.9
1
Kimberlites
MinnettesXenolith bearing alkali basalts
Fra
ctio
nal P
b lo
ss
Titanite 1200 Co
Apatite 1200 Co
Titanite+Apatite 1000 C
Holding time (days)
o
Fig. 7 Concordia plot showing the effects of magmatic exhumation
on U-Pb data. Finite difference model tests the effects of short-lived
heating events on thermchronometers with rounded initial profiles.
Rounded diffusion profiles lessen the diffusant loss during a
secondary reheating event. Independent constraints on magma
temperature and eruption rate can only place maximum heating
conditions at 1,200�C and 5 days, though lower temperatures and
shorter holding times are more likely. Decreasing the magma holding
temperature to 1,000�C yields Pb loss below 1%. Titanite and apatite
kinetics are used, rutile kinetics predict negligible loss at these
conditions. Figure inset show an accuracy test of this calculation
using the same initial conditions in the numerical solution (blocks andcircles) as those used by the analytical solution (solid lines)
Contrib Mineral Petrol
123
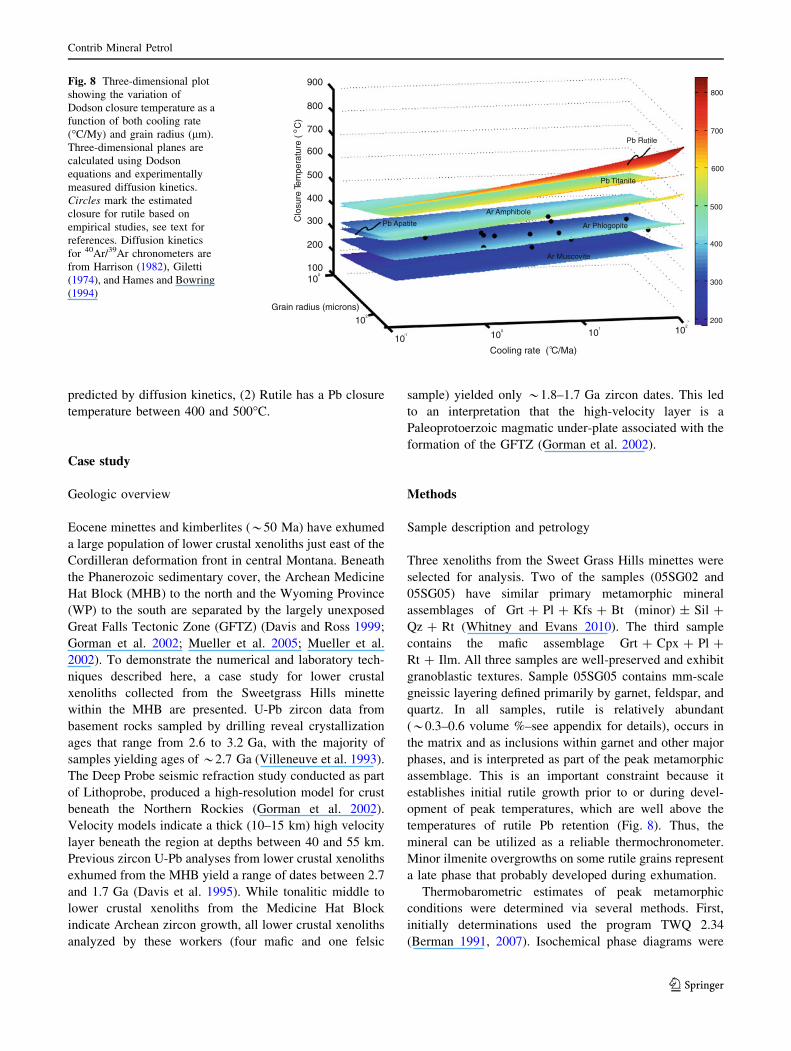
predicted by diffusion kinetics, (2) Rutile has a Pb closure
temperature between 400 and 500�C.
Case study
Geologic overview
Eocene minettes and kimberlites (*50 Ma) have exhumed
a large population of lower crustal xenoliths just east of the
Cordilleran deformation front in central Montana. Beneath
the Phanerozoic sedimentary cover, the Archean Medicine
Hat Block (MHB) to the north and the Wyoming Province
(WP) to the south are separated by the largely unexposed
Great Falls Tectonic Zone (GFTZ) (Davis and Ross 1999;
Gorman et al. 2002; Mueller et al. 2005; Mueller et al.
2002). To demonstrate the numerical and laboratory tech-
niques described here, a case study for lower crustal
xenoliths collected from the Sweetgrass Hills minette
within the MHB are presented. U-Pb zircon data from
basement rocks sampled by drilling reveal crystallization
ages that range from 2.6 to 3.2 Ga, with the majority of
samples yielding ages of *2.7 Ga (Villeneuve et al. 1993).
The Deep Probe seismic refraction study conducted as part
of Lithoprobe, produced a high-resolution model for crust
beneath the Northern Rockies (Gorman et al. 2002).
Velocity models indicate a thick (10–15 km) high velocity
layer beneath the region at depths between 40 and 55 km.
Previous zircon U-Pb analyses from lower crustal xenoliths
exhumed from the MHB yield a range of dates between 2.7
and 1.7 Ga (Davis et al. 1995). While tonalitic middle to
lower crustal xenoliths from the Medicine Hat Block
indicate Archean zircon growth, all lower crustal xenoliths
analyzed by these workers (four mafic and one felsic
sample) yielded only *1.8–1.7 Ga zircon dates. This led
to an interpretation that the high-velocity layer is a
Paleoprotoerzoic magmatic under-plate associated with the
formation of the GFTZ (Gorman et al. 2002).
Methods
Sample description and petrology
Three xenoliths from the Sweet Grass Hills minettes were
selected for analysis. Two of the samples (05SG02 and
05SG05) have similar primary metamorphic mineral
assemblages of Grt ? Pl ? Kfs ? Bt (minor) ± Sil ?
Qz ? Rt (Whitney and Evans 2010). The third sample
contains the mafic assemblage Grt ? Cpx ? Pl ?
Rt ? Ilm. All three samples are well-preserved and exhibit
granoblastic textures. Sample 05SG05 contains mm-scale
gneissic layering defined primarily by garnet, feldspar, and
quartz. In all samples, rutile is relatively abundant
(*0.3–0.6 volume %–see appendix for details), occurs in
the matrix and as inclusions within garnet and other major
phases, and is interpreted as part of the peak metamorphic
assemblage. This is an important constraint because it
establishes initial rutile growth prior to or during devel-
opment of peak temperatures, which are well above the
temperatures of rutile Pb retention (Fig. 8). Thus, the
mineral can be utilized as a reliable thermochronometer.
Minor ilmenite overgrowths on some rutile grains represent
a late phase that probably developed during exhumation.
Thermobarometric estimates of peak metamorphic
conditions were determined via several methods. First,
initially determinations used the program TWQ 2.34
(Berman 1991, 2007). Isochemical phase diagrams were
10-1
100
10 2
10 2
10 1
100
Cooling rate ( C/Ma) o
Grain radius (microns)
100
800
800
700
600
500
400
Clo
sure
Tem
pera
ture
( C
)o
900
300
200
Pb Rutile
Pb Titanite
Ar Amphibole
Ar Muscovite
Ar PhlogopitePb Apatite
700
600
500
400
300
200
Fig. 8 Three-dimensional plot
showing the variation of
Dodson closure temperature as a
function of both cooling rate
(�C/My) and grain radius (lm).
Three-dimensional planes are
calculated using Dodson
equations and experimentally
measured diffusion kinetics.
Circles mark the estimated
closure for rutile based on
empirical studies, see text for
references. Diffusion kinetics
for 40Ar/39Ar chronometers are
from Harrison (1982), Giletti
(1974), and Hames and Bowring
(1994)
Contrib Mineral Petrol
123
also calculated with the program Perple_X (Connolly and
Petrini 2002) using the Na2O-CaO-K2O-FeO-MgO-Al2O3-
SiO2-H2O-TiO2 chemical system. Temperatures were also
estimated based on Zr-in-rutile thermometry (Ferry and
Watson 2007; Watson et al. 2006). The best estimates of
peak metamorphic conditions for samples 05SG02,
05SG05 and 05SG20 are 0.8 GPa/900�C, 1.1 GPa/900�C
and 1.3GPa/890�C, respectively. These data allow us to
construct a relative stratigraphy between the MHB sam-
ples; from shallow to deep, 05SG02, 05SG05 and 05SG20.
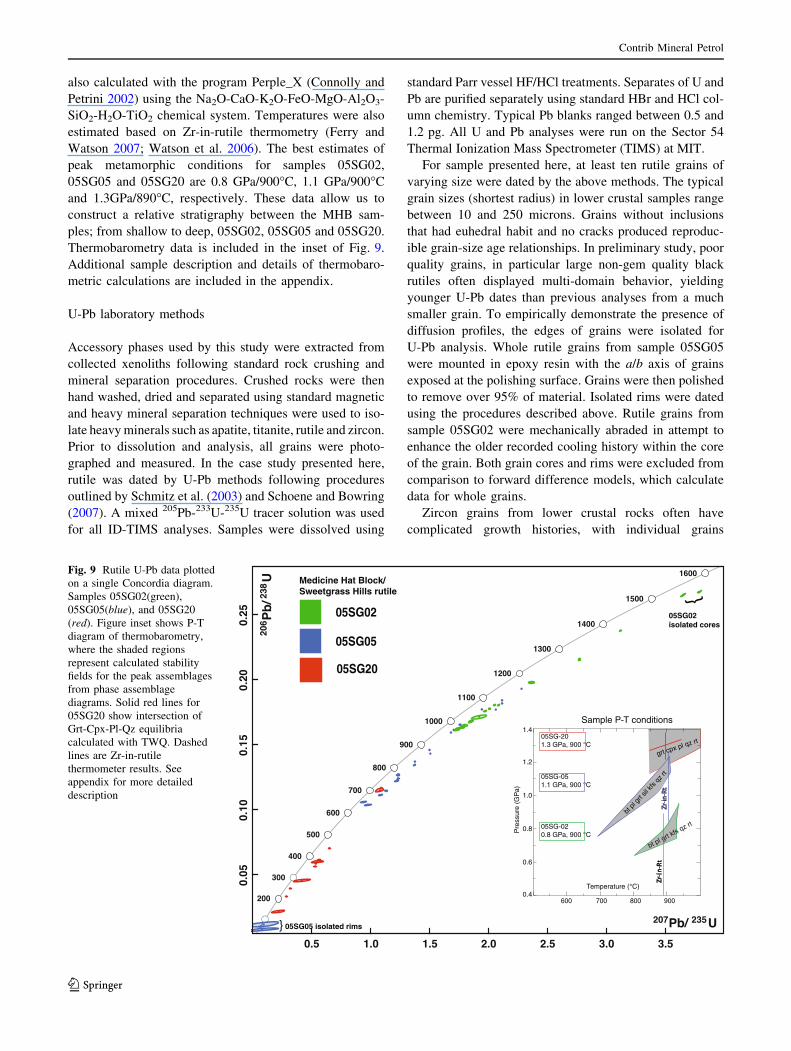
Thermobarometry data is included in the inset of Fig. 9.
Additional sample description and details of thermobaro-
metric calculations are included in the appendix.
U-Pb laboratory methods
Accessory phases used by this study were extracted from
collected xenoliths following standard rock crushing and
mineral separation procedures. Crushed rocks were then
hand washed, dried and separated using standard magnetic
and heavy mineral separation techniques were used to iso-
late heavy minerals such as apatite, titanite, rutile and zircon.
Prior to dissolution and analysis, all grains were photo-
graphed and measured. In the case study presented here,
rutile was dated by U-Pb methods following procedures
outlined by Schmitz et al. (2003) and Schoene and Bowring
(2007). A mixed 205Pb-233U-235U tracer solution was used
for all ID-TIMS analyses. Samples were dissolved using
standard Parr vessel HF/HCl treatments. Separates of U and
Pb are purified separately using standard HBr and HCl col-
umn chemistry. Typical Pb blanks ranged between 0.5 and
1.2 pg. All U and Pb analyses were run on the Sector 54
Thermal Ionization Mass Spectrometer (TIMS) at MIT.
For sample presented here, at least ten rutile grains of
varying size were dated by the above methods. The typical
grain sizes (shortest radius) in lower crustal samples range
between 10 and 250 microns. Grains without inclusions
that had euhedral habit and no cracks produced reproduc-
ible grain-size age relationships. In preliminary study, poor
quality grains, in particular large non-gem quality black
rutiles often displayed multi-domain behavior, yielding
younger U-Pb dates than previous analyses from a much
smaller grain. To empirically demonstrate the presence of
diffusion profiles, the edges of grains were isolated for
U-Pb analysis. Whole rutile grains from sample 05SG05
were mounted in epoxy resin with the a/b axis of grains
exposed at the polishing surface. Grains were then polished
to remove over 95% of material. Isolated rims were dated
using the procedures described above. Rutile grains from
sample 05SG02 were mechanically abraded in attempt to
enhance the older recorded cooling history within the core
of the grain. Both grain cores and rims were excluded from
comparison to forward difference models, which calculate
data for whole grains.
Zircon grains from lower crustal rocks often have
complicated growth histories, with individual grains
05SG20
05SG05
05SG02
Medicine Hat Block/Sweetgrass Hills rutile
05SG05 isolated rims}
05SG02isolated cores
}
bt p
l grt
sil kf
s qz r
t
600 700 800 9000.4
0.6
0.8
1.2
1.0
1.4
Pre
ssur
e (G
Pa)
Temperature (°C)
bt pl grt kfs qz rt
-rZ
05SG-201.3 GPa, 900 °C
05SG-051.1 GPa, 900 °C
05SG-020.8 GPa, 900 °C
Sample P-T conditions
grt cpx pl qz rt
Fig. 9 Rutile U-Pb data plotted
on a single Concordia diagram.
Samples 05SG02(green),
05SG05(blue), and 05SG20
(red). Figure inset shows P-T
diagram of thermobarometry,
where the shaded regions
represent calculated stability
fields for the peak assemblages
from phase assemblage
diagrams. Solid red lines for
05SG20 show intersection of
Grt-Cpx-Pl-Qz equilibria
calculated with TWQ. Dashed
lines are Zr-in-rutile
thermometer results. See
appendix for more detailed
description
Contrib Mineral Petrol
123
consisting of an older core surrounded by as many as 1–3
periods of zircon growth. Procedures for dating complex
zircons include imaging grains by Cathode Luminescence
(CL) followed by micro-sampling each distinct zircon
growth history for analysis using Chemical Abrasion U-Pb
Thermal Ionization Mass Spectrometry (CA-TIMS)
(Mattinson 2005).
Results
U-Pb data
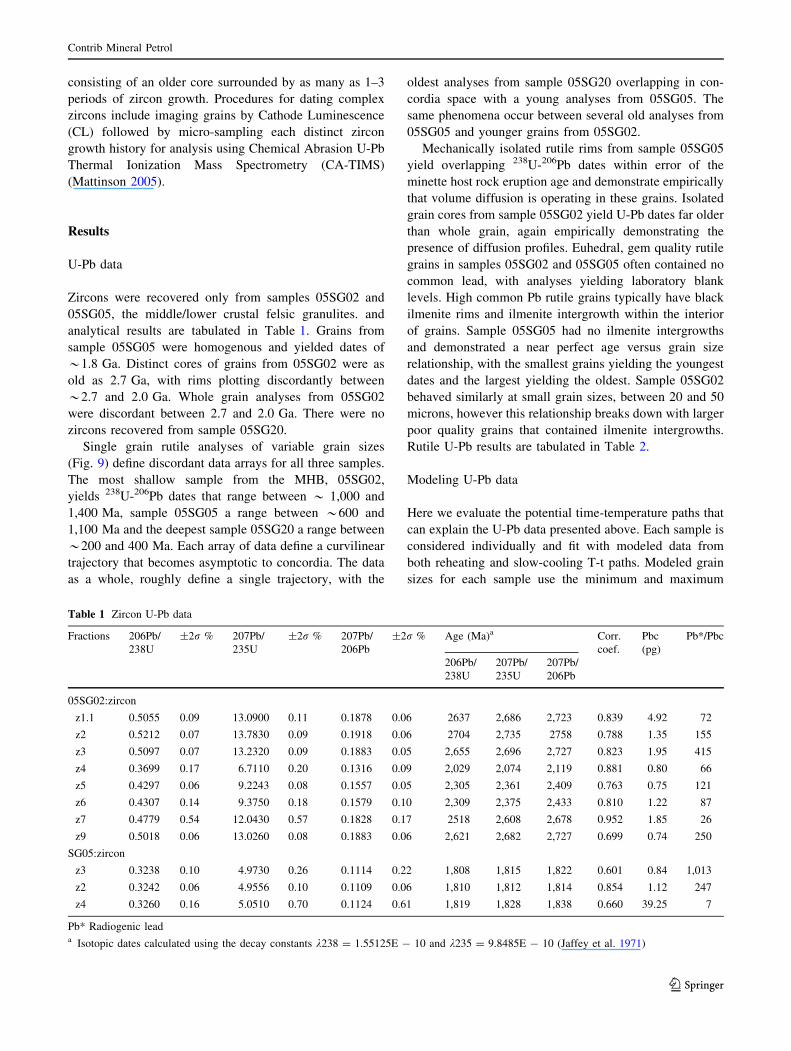
Zircons were recovered only from samples 05SG02 and
05SG05, the middle/lower crustal felsic granulites. and
analytical results are tabulated in Table 1. Grains from
sample 05SG05 were homogenous and yielded dates of
*1.8 Ga. Distinct cores of grains from 05SG02 were as
old as 2.7 Ga, with rims plotting discordantly between
*2.7 and 2.0 Ga. Whole grain analyses from 05SG02
were discordant between 2.7 and 2.0 Ga. There were no
zircons recovered from sample 05SG20.
Single grain rutile analyses of variable grain sizes
(Fig. 9) define discordant data arrays for all three samples.
The most shallow sample from the MHB, 05SG02,
yields 238U-206Pb dates that range between * 1,000 and
1,400 Ma, sample 05SG05 a range between *600 and
1,100 Ma and the deepest sample 05SG20 a range between
*200 and 400 Ma. Each array of data define a curvilinear
trajectory that becomes asymptotic to concordia. The data
as a whole, roughly define a single trajectory, with the
oldest analyses from sample 05SG20 overlapping in con-
cordia space with a young analyses from 05SG05. The
same phenomena occur between several old analyses from
05SG05 and younger grains from 05SG02.
Mechanically isolated rutile rims from sample 05SG05
yield overlapping 238U-206Pb dates within error of the
minette host rock eruption age and demonstrate empirically
that volume diffusion is operating in these grains. Isolated
grain cores from sample 05SG02 yield U-Pb dates far older
than whole grain, again empirically demonstrating the
presence of diffusion profiles. Euhedral, gem quality rutile
grains in samples 05SG02 and 05SG05 often contained no
common lead, with analyses yielding laboratory blank
levels. High common Pb rutile grains typically have black
ilmenite rims and ilmenite intergrowth within the interior
of grains. Sample 05SG05 had no ilmenite intergrowths
and demonstrated a near perfect age versus grain size
relationship, with the smallest grains yielding the youngest
dates and the largest yielding the oldest. Sample 05SG02
behaved similarly at small grain sizes, between 20 and 50
microns, however this relationship breaks down with larger
poor quality grains that contained ilmenite intergrowths.
Rutile U-Pb results are tabulated in Table 2.
Modeling U-Pb data
Here we evaluate the potential time-temperature paths that
can explain the U-Pb data presented above. Each sample is
considered individually and fit with modeled data from
both reheating and slow-cooling T-t paths. Modeled grain
sizes for each sample use the minimum and maximum
Table 1 Zircon U-Pb data
Fractions 206Pb/
238U
±2r % 207Pb/
235U
±2r % 207Pb/
206Pb
±2r % Age (Ma)a Corr.
coef.
Pbc
(pg)
Pb*/Pbc
206Pb/
238U
207Pb/
235U
207Pb/
206Pb
05SG02:zircon
z1.1 0.5055 0.09 13.0900 0.11 0.1878 0.06 2637 2,686 2,723 0.839 4.92 72
z2 0.5212 0.07 13.7830 0.09 0.1918 0.06 2704 2,735 2758 0.788 1.35 155
z3 0.5097 0.07 13.2320 0.09 0.1883 0.05 2,655 2,696 2,727 0.823 1.95 415
z4 0.3699 0.17 6.7110 0.20 0.1316 0.09 2,029 2,074 2,119 0.881 0.80 66
z5 0.4297 0.06 9.2243 0.08 0.1557 0.05 2,305 2,361 2,409 0.763 0.75 121
z6 0.4307 0.14 9.3750 0.18 0.1579 0.10 2,309 2,375 2,433 0.810 1.22 87
z7 0.4779 0.54 12.0430 0.57 0.1828 0.17 2518 2,608 2,678 0.952 1.85 26
z9 0.5018 0.06 13.0260 0.08 0.1883 0.06 2,621 2,682 2,727 0.699 0.74 250
SG05:zircon
z3 0.3238 0.10 4.9730 0.26 0.1114 0.22 1,808 1,815 1,822 0.601 0.84 1,013
z2 0.3242 0.06 4.9556 0.10 0.1109 0.06 1,810 1,812 1,814 0.854 1.12 247
z4 0.3260 0.16 5.0510 0.70 0.1124 0.61 1,819 1,828 1,838 0.660 39.25 7
Pb* Radiogenic leada Isotopic dates calculated using the decay constants k238 = 1.55125E - 10 and k235 = 9.8485E - 10 (Jaffey et al. 1971)
Contrib Mineral Petrol
123
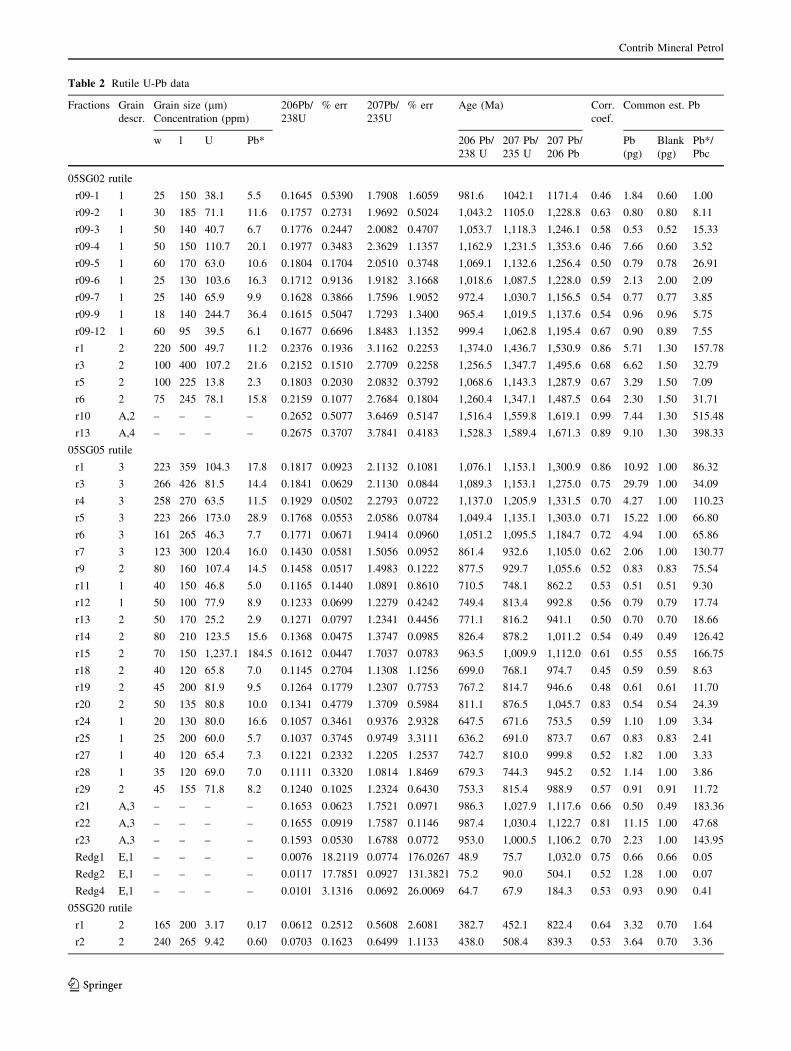
Table 2 Rutile U-Pb data
Fractions Grain
descr.
Grain size (lm)
Concentration (ppm)
206Pb/
238U
% err 207Pb/
235U
% err Age (Ma) Corr.
coef.
Common est. Pb
w l U Pb* 206 Pb/
238 U
207 Pb/
235 U
207 Pb/
206 Pb
Pb
(pg)
Blank
(pg)
Pb*/
Pbc
05SG02 rutile
r09-1 1 25 150 38.1 5.5 0.1645 0.5390 1.7908 1.6059 981.6 1042.1 1171.4 0.46 1.84 0.60 1.00
r09-2 1 30 185 71.1 11.6 0.1757 0.2731 1.9692 0.5024 1,043.2 1105.0 1,228.8 0.63 0.80 0.80 8.11
r09-3 1 50 140 40.7 6.7 0.1776 0.2447 2.0082 0.4707 1,053.7 1,118.3 1,246.1 0.58 0.53 0.52 15.33
r09-4 1 50 150 110.7 20.1 0.1977 0.3483 2.3629 1.1357 1,162.9 1,231.5 1,353.6 0.46 7.66 0.60 3.52
r09-5 1 60 170 63.0 10.6 0.1804 0.1704 2.0510 0.3748 1,069.1 1,132.6 1,256.4 0.50 0.79 0.78 26.91
r09-6 1 25 130 103.6 16.3 0.1712 0.9136 1.9182 3.1668 1,018.6 1,087.5 1,228.0 0.59 2.13 2.00 2.09
r09-7 1 25 140 65.9 9.9 0.1628 0.3866 1.7596 1.9052 972.4 1,030.7 1,156.5 0.54 0.77 0.77 3.85
r09-9 1 18 140 244.7 36.4 0.1615 0.5047 1.7293 1.3400 965.4 1,019.5 1,137.6 0.54 0.96 0.96 5.75
r09-12 1 60 95 39.5 6.1 0.1677 0.6696 1.8483 1.1352 999.4 1,062.8 1,195.4 0.67 0.90 0.89 7.55
r1 2 220 500 49.7 11.2 0.2376 0.1936 3.1162 0.2253 1,374.0 1,436.7 1,530.9 0.86 5.71 1.30 157.78
r3 2 100 400 107.2 21.6 0.2152 0.1510 2.7709 0.2258 1,256.5 1,347.7 1,495.6 0.68 6.62 1.50 32.79
r5 2 100 225 13.8 2.3 0.1803 0.2030 2.0832 0.3792 1,068.6 1,143.3 1,287.9 0.67 3.29 1.50 7.09
r6 2 75 245 78.1 15.8 0.2159 0.1077 2.7684 0.1804 1,260.4 1,347.1 1,487.5 0.64 2.30 1.50 31.71
r10 A,2 – – – – 0.2652 0.5077 3.6469 0.5147 1,516.4 1,559.8 1,619.1 0.99 7.44 1.30 515.48
r13 A,4 – – – – 0.2675 0.3707 3.7841 0.4183 1,528.3 1,589.4 1,671.3 0.89 9.10 1.30 398.33
05SG05 rutile
r1 3 223 359 104.3 17.8 0.1817 0.0923 2.1132 0.1081 1,076.1 1,153.1 1,300.9 0.86 10.92 1.00 86.32
r3 3 266 426 81.5 14.4 0.1841 0.0629 2.1130 0.0844 1,089.3 1,153.1 1,275.0 0.75 29.79 1.00 34.09
r4 3 258 270 63.5 11.5 0.1929 0.0502 2.2793 0.0722 1,137.0 1,205.9 1,331.5 0.70 4.27 1.00 110.23
r5 3 223 266 173.0 28.9 0.1768 0.0553 2.0586 0.0784 1,049.4 1,135.1 1,303.0 0.71 15.22 1.00 66.80
r6 3 161 265 46.3 7.7 0.1771 0.0671 1.9414 0.0960 1,051.2 1,095.5 1,184.7 0.72 4.94 1.00 65.86
r7 3 123 300 120.4 16.0 0.1430 0.0581 1.5056 0.0952 861.4 932.6 1,105.0 0.62 2.06 1.00 130.77
r9 2 80 160 107.4 14.5 0.1458 0.0517 1.4983 0.1222 877.5 929.7 1,055.6 0.52 0.83 0.83 75.54
r11 1 40 150 46.8 5.0 0.1165 0.1440 1.0891 0.8610 710.5 748.1 862.2 0.53 0.51 0.51 9.30
r12 1 50 100 77.9 8.9 0.1233 0.0699 1.2279 0.4242 749.4 813.4 992.8 0.56 0.79 0.79 17.74
r13 2 50 170 25.2 2.9 0.1271 0.0797 1.2341 0.4456 771.1 816.2 941.1 0.50 0.70 0.70 18.66
r14 2 80 210 123.5 15.6 0.1368 0.0475 1.3747 0.0985 826.4 878.2 1,011.2 0.54 0.49 0.49 126.42
r15 2 70 150 1,237.1 184.5 0.1612 0.0447 1.7037 0.0783 963.5 1,009.9 1,112.0 0.61 0.55 0.55 166.75
r18 2 40 120 65.8 7.0 0.1145 0.2704 1.1308 1.1256 699.0 768.1 974.7 0.45 0.59 0.59 8.63
r19 2 45 200 81.9 9.5 0.1264 0.1779 1.2307 0.7753 767.2 814.7 946.6 0.48 0.61 0.61 11.70
r20 2 50 135 80.8 10.0 0.1341 0.4779 1.3709 0.5984 811.1 876.5 1,045.7 0.83 0.54 0.54 24.39
r24 1 20 130 80.0 16.6 0.1057 0.3461 0.9376 2.9328 647.5 671.6 753.5 0.59 1.10 1.09 3.34
r25 1 25 200 60.0 5.7 0.1037 0.3745 0.9749 3.3111 636.2 691.0 873.7 0.67 0.83 0.83 2.41
r27 1 40 120 65.4 7.3 0.1221 0.2332 1.2205 1.2537 742.7 810.0 999.8 0.52 1.82 1.00 3.33
r28 1 35 120 69.0 7.0 0.1111 0.3320 1.0814 1.8469 679.3 744.3 945.2 0.52 1.14 1.00 3.86
r29 2 45 155 71.8 8.2 0.1240 0.1025 1.2324 0.6430 753.3 815.4 988.9 0.57 0.91 0.91 11.72
r21 A,3 – – – – 0.1653 0.0623 1.7521 0.0971 986.3 1,027.9 1,117.6 0.66 0.50 0.49 183.36
r22 A,3 – – – – 0.1655 0.0919 1.7587 0.1146 987.4 1,030.4 1,122.7 0.81 11.15 1.00 47.68
r23 A,3 – – – – 0.1593 0.0530 1.6788 0.0772 953.0 1,000.5 1,106.2 0.70 2.23 1.00 143.95
Redg1 E,1 – – – – 0.0076 18.2119 0.0774 176.0267 48.9 75.7 1,032.0 0.75 0.66 0.66 0.05
Redg2 E,1 – – – – 0.0117 17.7851 0.0927 131.3821 75.2 90.0 504.1 0.52 1.28 1.00 0.07
Redg4 E,1 – – – – 0.0101 3.1316 0.0692 26.0069 64.7 67.9 184.3 0.53 0.93 0.90 0.41
05SG20 rutile
r1 2 165 200 3.17 0.17 0.0612 0.2512 0.5608 2.6081 382.7 452.1 822.4 0.64 3.32 0.70 1.64
r2 2 240 265 9.42 0.60 0.0703 0.1623 0.6499 1.1133 438.0 508.4 839.3 0.53 3.64 0.70 3.36
Contrib Mineral Petrol
123
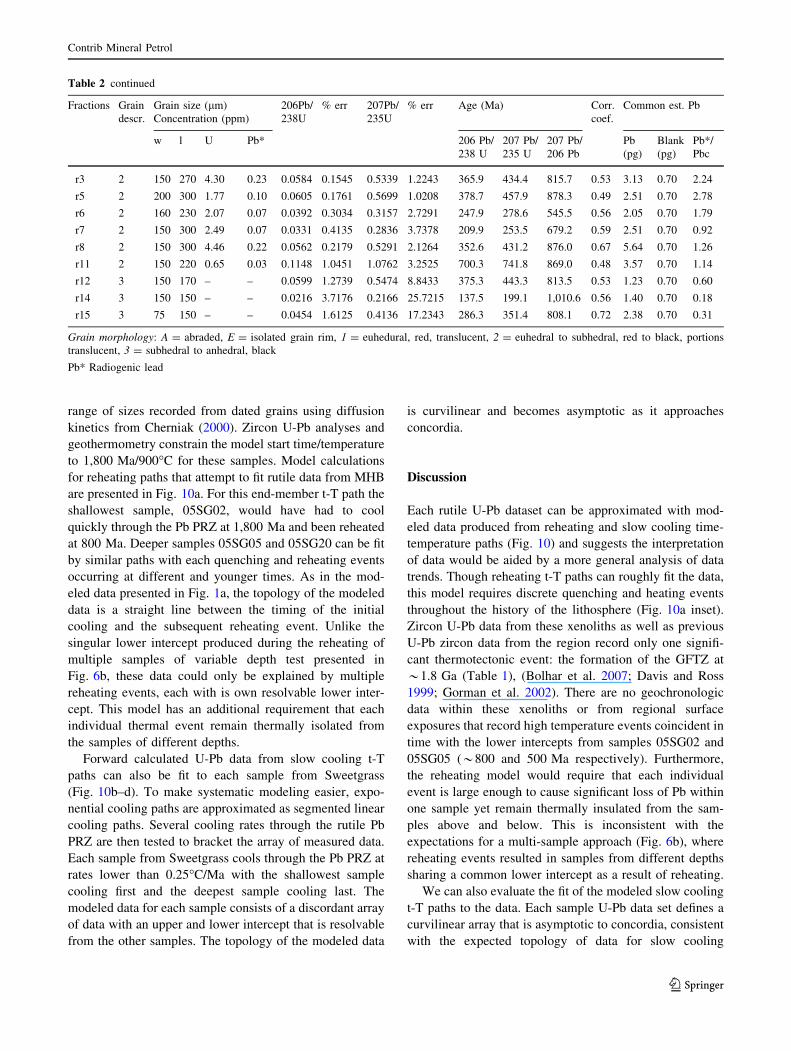
range of sizes recorded from dated grains using diffusion
kinetics from Cherniak (2000). Zircon U-Pb analyses and
geothermometry constrain the model start time/temperature
to 1,800 Ma/900�C for these samples. Model calculations
for reheating paths that attempt to fit rutile data from MHB
are presented in Fig. 10a. For this end-member t-T path the
shallowest sample, 05SG02, would have had to cool
quickly through the Pb PRZ at 1,800 Ma and been reheated
at 800 Ma. Deeper samples 05SG05 and 05SG20 can be fit
by similar paths with each quenching and reheating events
occurring at different and younger times. As in the mod-
eled data presented in Fig. 1a, the topology of the modeled
data is a straight line between the timing of the initial
cooling and the subsequent reheating event. Unlike the
singular lower intercept produced during the reheating of
multiple samples of variable depth test presented in
Fig. 6b, these data could only be explained by multiple
reheating events, each with is own resolvable lower inter-
cept. This model has an additional requirement that each
individual thermal event remain thermally isolated from
the samples of different depths.
Forward calculated U-Pb data from slow cooling t-T
paths can also be fit to each sample from Sweetgrass
(Fig. 10b–d). To make systematic modeling easier, expo-
nential cooling paths are approximated as segmented linear
cooling paths. Several cooling rates through the rutile Pb
PRZ are then tested to bracket the array of measured data.
Each sample from Sweetgrass cools through the Pb PRZ at
rates lower than 0.25�C/Ma with the shallowest sample
cooling first and the deepest sample cooling last. The
modeled data for each sample consists of a discordant array
of data with an upper and lower intercept that is resolvable
from the other samples. The topology of the modeled data
is curvilinear and becomes asymptotic as it approaches
concordia.
Discussion
Each rutile U-Pb dataset can be approximated with mod-
eled data produced from reheating and slow cooling time-
temperature paths (Fig. 10) and suggests the interpretation
of data would be aided by a more general analysis of data
trends. Though reheating t-T paths can roughly fit the data,
this model requires discrete quenching and heating events
throughout the history of the lithosphere (Fig. 10a inset).
Zircon U-Pb data from these xenoliths as well as previous
U-Pb zircon data from the region record only one signifi-
cant thermotectonic event: the formation of the GFTZ at
*1.8 Ga (Table 1), (Bolhar et al. 2007; Davis and Ross
1999; Gorman et al. 2002). There are no geochronologic
data within these xenoliths or from regional surface
exposures that record high temperature events coincident in
time with the lower intercepts from samples 05SG02 and
05SG05 (*800 and 500 Ma respectively). Furthermore,
the reheating model would require that each individual
event is large enough to cause significant loss of Pb within
one sample yet remain thermally insulated from the sam-
ples above and below. This is inconsistent with the
expectations for a multi-sample approach (Fig. 6b), where
reheating events resulted in samples from different depths
sharing a common lower intercept as a result of reheating.
We can also evaluate the fit of the modeled slow cooling
t-T paths to the data. Each sample U-Pb data set defines a
curvilinear array that is asymptotic to concordia, consistent
with the expected topology of data for slow cooling
Table 2 continued
Fractions Grain
descr.
Grain size (lm)
Concentration (ppm)
206Pb/
238U
% err 207Pb/
235U
% err Age (Ma) Corr.
coef.
Common est. Pb
w l U Pb* 206 Pb/
238 U
207 Pb/
235 U
207 Pb/
206 Pb
Pb
(pg)
Blank
(pg)
Pb*/
Pbc
r3 2 150 270 4.30 0.23 0.0584 0.1545 0.5339 1.2243 365.9 434.4 815.7 0.53 3.13 0.70 2.24
r5 2 200 300 1.77 0.10 0.0605 0.1761 0.5699 1.0208 378.7 457.9 878.3 0.49 2.51 0.70 2.78
r6 2 160 230 2.07 0.07 0.0392 0.3034 0.3157 2.7291 247.9 278.6 545.5 0.56 2.05 0.70 1.79
r7 2 150 300 2.49 0.07 0.0331 0.4135 0.2836 3.7378 209.9 253.5 679.2 0.59 2.51 0.70 0.92
r8 2 150 300 4.46 0.22 0.0562 0.2179 0.5291 2.1264 352.6 431.2 876.0 0.67 5.64 0.70 1.26
r11 2 150 220 0.65 0.03 0.1148 1.0451 1.0762 3.2525 700.3 741.8 869.0 0.48 3.57 0.70 1.14
r12 3 150 170 – – 0.0599 1.2739 0.5474 8.8433 375.3 443.3 813.5 0.53 1.23 0.70 0.60
r14 3 150 150 – – 0.0216 3.7176 0.2166 25.7215 137.5 199.1 1,010.6 0.56 1.40 0.70 0.18
r15 3 75 150 – – 0.0454 1.6125 0.4136 17.2343 286.3 351.4 808.1 0.72 2.38 0.70 0.31
Grain morphology: A = abraded, E = isolated grain rim, 1 = euhedural, red, translucent, 2 = euhedral to subhedral, red to black, portions
translucent, 3 = subhedral to anhedral, black
Pb* Radiogenic lead
Contrib Mineral Petrol
123
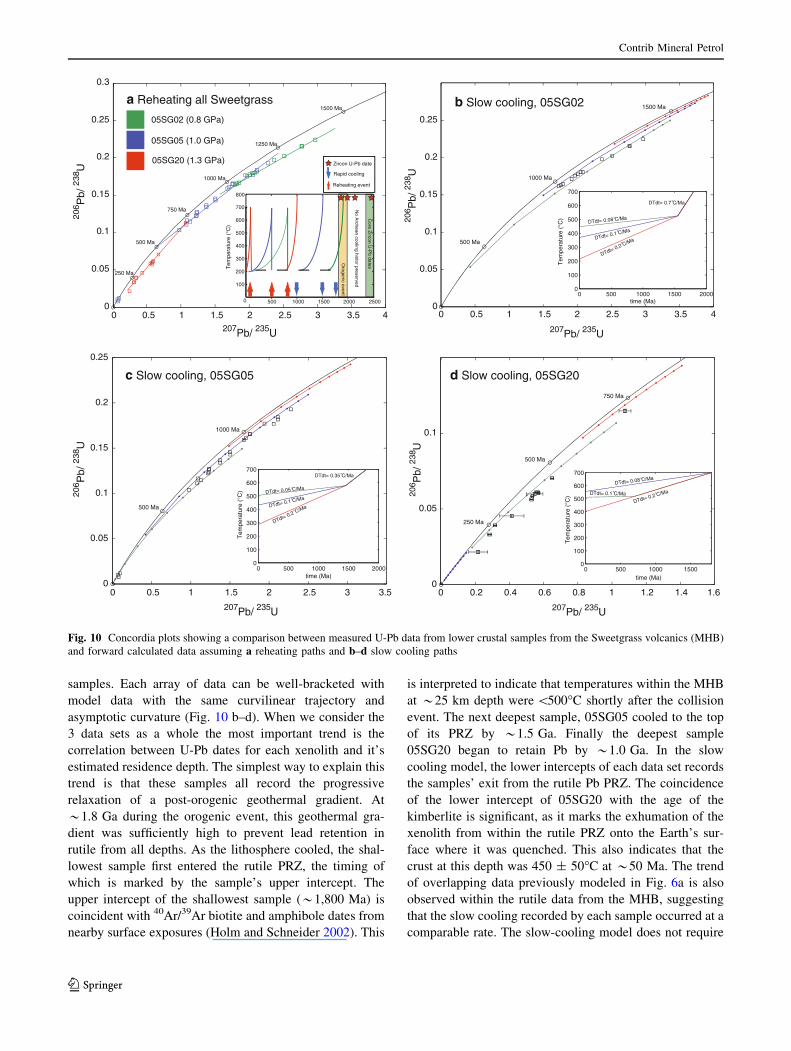
samples. Each array of data can be well-bracketed with
model data with the same curvilinear trajectory and
asymptotic curvature (Fig. 10 b–d). When we consider the
3 data sets as a whole the most important trend is the
correlation between U-Pb dates for each xenolith and it’s
estimated residence depth. The simplest way to explain this
trend is that these samples all record the progressive
relaxation of a post-orogenic geothermal gradient. At
*1.8 Ga during the orogenic event, this geothermal gra-
dient was sufficiently high to prevent lead retention in
rutile from all depths. As the lithosphere cooled, the shal-
lowest sample first entered the rutile PRZ, the timing of
which is marked by the sample’s upper intercept. The
upper intercept of the shallowest sample (*1,800 Ma) is
coincident with 40Ar/39Ar biotite and amphibole dates from
nearby surface exposures (Holm and Schneider 2002). This
is interpreted to indicate that temperatures within the MHB
at *25 km depth were \500�C shortly after the collision
event. The next deepest sample, 05SG05 cooled to the top
of its PRZ by *1.5 Ga. Finally the deepest sample
05SG20 began to retain Pb by *1.0 Ga. In the slow
cooling model, the lower intercepts of each data set records
the samples’ exit from the rutile Pb PRZ. The coincidence
of the lower intercept of 05SG20 with the age of the
kimberlite is significant, as it marks the exhumation of the
xenolith from within the rutile PRZ onto the Earth’s sur-
face where it was quenched. This also indicates that the
crust at this depth was 450 ± 50�C at *50 Ma. The trend
of overlapping data previously modeled in Fig. 6a is also
observed within the rutile data from the MHB, suggesting
that the slow cooling recorded by each sample occurred at a
comparable rate. The slow-cooling model does not require
0 0.5 1 1.5 2 2.5 3 3.50
0.05
0.1
0.15
0.2
0.25
207Pb/ 235U
206 P
b/ 23
8 U
0 500 1000 1500 20000
100
200
300
400
500
600
700
time (Ma)
Tem
pera
ture
(°C
)
500 Ma
1000 Ma
c Slow cooling, 05SG05
0 0.5 1 1.5 2 2.5 3 3.5 40
0.05
0.1
0.15
0.2
0.25
0.3
250 Ma
500 Ma
750 Ma
1000 Ma
1250 Ma
1500 Ma
05SG20 (1.3 GPa)
05SG05 (1.0 GPa)
05SG02 (0.8 GPa)
0 500 1000 1500 2000 2500
100
200
300
400
500
600
700
Tem
pera
ture
(°C
)
800
Core Z
ircon U-P
b dates
Orogenic event
No A
rchean cooling histor preserved
Zircon U-Pb date
Rapid cooling
Reheating event
a Reheating all Sweetgrass
0 0.2 0.4 0.6 0.8 1 1.2 1.4 1.60
0.05
0.1
207Pb/ 235U
206 P
b/ 23
8 U
0 500 1000 15000
100
200
300
400
500
600
700
time (Ma)
Tem
pera
ture
(°C
)
250 Ma
500 Ma
750 Ma
d Slow cooling, 05SG20
206 P
b/ 23
8 U
207Pb/ 235U
DTdt= 0.35 C/Mao
DTdt= 0.2 C/Mao
DTdt= 0.05 C/Mao
DTdt= 0.1 C/MaoDTdt= 0.2 C/Mao
DTdt= 0.08 C/Mao
DTdt= 0.1 C/Mao
0 0.5 1 1.5 2 2.5 3 3.5 40
0.05
0.1
0.15
0.2
0.25
0 500 1000 1500 20000
100
200
300
400
500
600
700
time (Ma)
Tem
pera
ture
(°C
)
500 Ma
1000 Ma
1500 Mab Slow cooling, 05SG02
207Pb/ 235U
206 P
b/ 23
8 U
DTdt= 0.7 C/Mao
DTdt= 0.2 C/Mao
DTdt= 0.08 C/Mao
DTdt= 0.1 C/Mao
Fig. 10 Concordia plots showing a comparison between measured U-Pb data from lower crustal samples from the Sweetgrass volcanics (MHB)
and forward calculated data assuming a reheating paths and b–d slow cooling paths
Contrib Mineral Petrol
123

temporally discrete quenching or reheating events and the
trends within the data can be explained by a simple model
for lithospheric thermal evolution. In the following section
we will try to define an upper limit to the cooling rate for
these samples by exploring the relationship between data
topology and diffusion kinetics.
Data topology and the effects of diffusion kinetics
In a slowly cooled system, the degree of discordance in the
U-Pb system is controlled by the cooling rate through PRZ.
The extent of the PRZ in time-temperature space, based on
numerical modeling (Fig. 5), is fairly insensitive to the
diffusion kinetics. Further exploration of the relationship
between PRZ residence time and diffusion kinetics can be
made using the Dodson solution for closure temperature
(Dodson 1973). This analytical solution provides a rapid
way to evaluate how variation in diffusion kinetics affects
the duration of partial system behavior; the later of which is
roughly approximated by the difference in time (Dt)
between the largest and smallest grain sizes for a particular
cooling rate (Fig. 11). At the slow cooling rates we are
examining, the absolute values of Dt predicted by the
Dodson solution are inaccurate, as the solution does not
accurately account for exponential Pb production by
radiogenic decay. However, for our purpose of examining
the trends between variable diffusion kinetics and the
extent of partial system behavior, the Dodson solution is
suitable. At cooling rates of 1.0�C/My and faster, the size
of the PRZ is nearly completely insensitive to diffusion
kinetics, yielding comparable Dt’s for all combinations of
kinetic values (Fig. 11). At cooling rates slower than
1.0�C/My, diffusion kinetics have an increased though
second order effect on the size of the PRZ. For example, at
a rate of 0.25�C/My, the entire range of Pb activation
energies and diffusion coefficients yields a *50% maxi-
mum range of Dt’s, while decreasing the cooling rate from
0.25 to 0.1�C/My would change the Dt over 200%. At
cooling rates as low as 0. 1�C/My, the range of the PRZ
becomes highly sensitive to diffusion kinetics, thus
decreasing our ability to conclude on a cooling rate a this
range. At cooling rates between 1 and 0.25�C/My relative
independence between diffusion kinetics and the size of the
PRZ suggests that the topology of rutile U-Pb data alone
can be used to place an upper limit to the cooling rate
through the minerals’ PRZ.
Though one cannot accurately model the exact temper-
atures of Pb retention in rutile without accurate diffusion
kinetics, U-Pb data does confirm that rutile is obeying
volume diffusion behavior based on the grain size depen-
dencies in measured U-Pb dates, in particular the high
quality grains from sample 05SG05 and 05SG02 (Fig. 9).
Combining the empirical constraints on rutile Pb closure
(Fig. 8) and a demonstration of cooling rate dependent data
10-10
10-9
10-8
10-7
10-6
10-5
10-4
10-3
0
200
400
600
Δt (
Ma) 800
1000
1200
1400
D =
Apa
tite
0
D =
Tita
nite
0
D =
Rut
ile0
DTdt = 0.1 C/Mao
DTdt = 0.25 C/Mao
DTdt = 1.0 C/Mao
Ea = Apatite
Ea = Titanite
Ea = Rutile
Diffusion coefficient (m2/s)
Dod
son
Clo
sure
Tem
pera
ture
(°C
)
grain size
Tem
pera
ture
( C
)o
time (Ma)
((em
DTdt
Δt
Fig. 11 Dodson equation
calculated difference in time
between small and large
diffusion domains (Dt) over a
range of diffusion coefficients,
activation energies (Ea) and
cooling rates (DTdt). Boxes are
placed at the intersection of Ea
and D0 for each phase, marking
the Dt at a particular cooling
rate for that phase. The Dodson
analytical solution provides a
rapid way to test how sensitive
the size of the Pb partial
retention zone is to diffusion
kinetics
Contrib Mineral Petrol
123

topology that is relatively insensitive to diffusion kinetics
(Figs. 5 and 11) allows for the conclusion that the cooling
rate for samples from the Sweetgrass hills, through the
rutile thermal window (450 ± 50�C) is on the order of
0.25�C/My or less.
Thermal state recorded by lower crustal
thermochronometers
We can evaluate the thermal/tectonic state and mechanism
of cooling within the lithosphere through a comparison of
both the absolute temperatures recorded by the lower crustal
thermochronometers and those predicted by physical
models for heat transfer in the lithosphere (Ehlers et al.
2005). One of the most broadly applicable lithosphere
thermal models is a stratified 1-D calculation, first described
by (Pollack and Chapman 1977), that extrapolates the
measured surface heat flux to the rest of the lithosphere
while stripping out the internal heat contribution from the
crust, lower crust and lithospheric mantle. This model
allows us to test the sensitivity of lower crustal temperatures
to any model parameter and explore a possible range of
lower crustal temperatures. The assumed surface heat flux
in this calculation has the most significant effect on lower
crustal temperatures, with temperatures at 40 km depth
ranging between 380�C on a cratonic geotherm (40mW/m2)
to over 800�C at a high geothermal gradient (80mW/m2)
(Chapman 1986). Other influential parameters include the
distribution and concentration of heat producing elements
(HPE) within the crust (Rudnick et al. 2003, 1998), thermal
conductivity and Moho depth. Realistic variations in each
of these parameters can cumulatively effect the temperature
at 40 km depth by over 10%, yielding a range of lower
crustal temperatures between 380 and 450�C for a cratonic
geotherm (40mW/m2) (Chapman 1986). These tempera-
tures predicted for the low cratonic geothermal gradient are
well within the temperatures of rutile Pb retention.
Conclusions
We have demonstrated how U-Pb thermochronology can
be used to resolve unique time-temperature paths for lower
crustal rocks exhumed by volcanic eruptions. Numerical
solutions to the diffusion equation provide us with the
means to exploring the U-Pb thermochronologic system’s
dependencies on: (1) grain size, (2) decay rate (238U vs.235U), (3) cooling rate through the partial retention zone
(PRZ) and (4) sensitivity to diffusion kinetics.
1. The length scale dependency of Pb diffusion causes
grains of variable size to each have its own unique
zone of Pb retention in time-temperature space. This
results in grains of one size to retain a different Pb
isotopic composition (produced by the decay of a
different composition of parent U) than a grain of any
other size.
2. The dramatically different decay rates for 238U and235U are manifested in two ways. First, because the
PRZ of any system is dependent upon production rate,
the 235U-207Pb and 238U-206Pb systems each have their
own PRZ. The higher production rate of 207Pb leads to
a relative excess in retained 207Pb. Second, the
difference in 238U and 235U decay constants yields
time sensitive information on Pb diffusion that can be
utilized for resolving the difference between reheating
and slow-cooling events. Reheating time-temperature
paths lie along a straight line between the time of
initial quenching and the subsequent thermal event.
Slow cooling t-T paths yield an asymptotic topology of
data for multiple analyses of variable grain size.
3. The topology of data produced by slow cooling t-T
paths is strongly dependent upon cooling rate through
the PRZ. Longer durations yield longer more discor-
dant arrays of data providing a tool for estimating the
cooling rate through the PRZ.
4. The topology of this variable grain size data is
generally insensitive to kinetics in comparison to
cooling rate, allowing users to estimate cooling rate for
minerals with poorly constrained diffusion kinetics.
In the Montana study area, rutile U-Pb data from three
xenoliths derived from different depths from a single vol-
canic epicenter are best interpreted by slow cooling t-T
paths where the shallowest sample cooled first and the
deepest last. Combining the topological dependence of
U-Pb data on cooling path with the multiple sample of
variable depth approach supports the conclusion that lower
crustal thermochronometers record a slow thermal relaxa-
tion since the Paleoproterozoic. Comparing the rates pre-
dicted by these thermochronologic results with the rates
predicted for physical models of heat transfer within the
earth will allow future studies to evaluate the mechanisms
for cooling and heat transfer within the lithosphere.
Acknowledgments Primary funding for this project was provided
through EarthScope grant EAR- 0746205. The authors would like to
thank D. Canil and F. Corfu for their constructive reviews and
Timothy Grove for his editorial handling. Discussions throughout this
study with both Doug Walker and Noah McLean were insightful and
greatly appreciated.
References
Anderson SD, Jamieson RA, Reynolds PH, Dunning GR (2001)
Devonian extension in northwestern Newfoundland: 40Ar/39Ar
Contrib Mineral Petrol
123
and U‘AePb data from the ming‘aos bight area, baie verte
peninsula. J Geol 109(2):191–211
Baldwin J, Bowring SA, Williams ML, Williams IS (2004) Eclogites
of the Snowbird tectonic zone: petrological and U-Pb geochro-
nological evidence for Paleoproterozoic high-pressure metamor-
phism in the western Canadian Shield. Contrib Mineral Petrol
147:528–548
Berman RG (1991) Thermobarometry using multi-equilibrium cal-
culations; a new technique, with petrological applications;
quantitative methods in petrology; an issue in honor of Hugh
J. Greenwood. Can Mineral 29:833–855
Berman RG (2007) winTWQ (version 2.3): a software package for
performing internally consistent thermobarometric calculations.
In: Geological survey of canada open file report 5462, p 41
Bolhar R, Kamber BS, Collerson KD (2007) U-Th-Pb fractionation in
Archaean lower continental crust: implications for terrestrial Pb
isotope systematics. Earth Planet Sci Lett 254:127–145
Canil D, Fedortchouk Y (1999) Garnet dissolution and the emplace-
ment of kimberlites. Earth Planet Sci Lett 167(3–4):227–237
Chapman DS (1986) Thermal gradients in the continental crust. Geol
Soc London Spec Publ 24(1):63–70
Cherniak DJ (1993) Lead diffusion in titanite and preliminary results
on the effects of radiation damage on Pb transport. Chem Geol
110(1–3):177–194
Cherniak DJ (2000) Pb diffusion in rutile. Contrib Mineral Petrol
139:198–207
Cherniak DJ, Watston EB (2001) Pb diffusion in zircon. Chem Geol
172(1):5–24
Cherniak DJ, Lanford WA, Ryerson FJ (1991) Lead diffusion in
apatite and zircon using ion implantation and Rutherford
Backscattering techniques. Geochim Cosmochim Acta
55(6):1663–1673
Connolly JAD, Petrini K (2002) An automated strategy for calcula-
tion of phase diagram sections and retrieval of rock properties as
a function of physical conditions. J Metamorph Geol 20:267–708
Corfu F, Easton RM (2001) U-Pb evidence for polymetamorphic
history of Huronian rocks within the Grenville front tectonic
zone east of Sudbury, Ontario, Canada. Chem Geol
172(1–2):149–171
Corfu F, Stone D (1998) The significance of titanite and apatite U-Pb
ages: constraints for the post-magmatic thermal-hydrothermal
evolution of a batholithic complex, Berens River area, north-
western Superior Province, Canada. Geochim Cosmochim Acta
62(17):2979–2995
Crank J (1956) Mathematics of diffusion. Clarendon Press, Oxford
Davis WJ, Ross GM (1999) Proterozoic underplating of the Archean
wyoming craton and medicine hatt block during Assembly of
Western Laurentia. Ninth annual V.M. Goldschmidt conference
Davis WJ, Berman R, Kjarsgaard B (1995) U-Pb geochronology and
isotopic studies of crustal xenoliths from the Archean Medicine
Hat block, northern Montana and southern Alberta: paleoprote-
rozoic reworking of Archean lower crust. In: Ross GM (ed)
Alberta basement transects: lithoprobe report #47, pp 329–334
Davis WJ, Canil D, MacKenzie JM, Carbno GB (2003) Petrology and
U-Pb geochronology of lower crustal xenoliths and the devel-
opment of a craton, Slave Province, Canada. Lithos 71:541–573
Dodson MH (1973) Closure temperature in cooling geochronological
and petrological systems. Contrib Mineral Petrol 40:259–274
Edgar AD, Arima M, Baldwin DK, Bell DR, Shee SR, Skinner EMW,
Walker EC (1988) High-pressure-high-temperature melting
experiments on a SiO 2 -poor aphanitic kimberlite from the
Wesselton Mine, Kimberley, South Africa. Am Mineral
73:524–533
Eggler DH, Wendlandt E (1979) Experimental studies on the
relationship between kimberlite magmas and partial melting of
peridotite. In: Boyd FR, Meyer HOA (eds) Kimberlites,
diatremes, and diamonds: their geology petrology and geochem-
istry. American Geophysical Union, Washington, pp 330–338
Ehlers TA, Chaudhri T, Kumar S, Fuller CW, Willett SD, Ketcham R,
Brandon MT, Belton D, Kohn B, Gleadow AJ, Dunai T, Fu F
(2005) Computational tools for low-temperature thermochro-
nometer interpretation. Rev Mineral Geochem 58:589–622
Esperanca S, Holloway JR (1987) On the origin of some mica-
lamprophyres: experimental evidence from a mafic minette.
Contrib Mineral Petrol 95(2):207–216
Ferry J, Watson E (2007) New thermodynamic models and revised
calibrations for the Ti-in-zircon and Zr-in-rutile thermometers.
Contrib Mineral Petrol 154(4):429–437
Flowers RM, Mahan KH, Bowring SA, Williams ML, Pringle MS,
Hodges KV (2006) Multistage exhumation and juxtaposition of
lower continental crust in the western Canadian Shield: linking
high-resolution U-Pb and 40Ar/39Ar thermochronometry with
pressure-temperature-deformation paths. Tectonics 25(4):TC4003
Giletti BJ (1974) Studies in diffusion I: Argon in phlogopitic mica. In:
Hoffman AW, Giletti BJ, Yoder HS, Yund RA (eds) Geochem-
ical transport and kinetics, vol 634. Carnegie Institute of
Washington, Washington, DC, pp 107–115
Gorman AR, Clowes RM, Ellis RM, Henstock TJ, Spence GD, Keller
RG, Levander A, Snelson CM, Burianyk M, Kanasewich ER,
Asudeh I, Hajnal Z, Miller KC (2002) Deep Probe: imaging the
roots of western North America. Can J Earth Sci 39(3):375
Hames WE, Bowring SA (1994) An empirical evaluation of the argon
diffusion geometry in muscovite. Earth Planet Sci Lett
124(1–4):161–169
Harrison TM (1982) Diffusion of 40Ar in hornblende. Contrib
Mineral Petr 78(3):324–331
Heizler M (2002) Slow-cooling or reheating: can SW USA thermo-
chronological data be reconciled? In: Geological Society of
America, vol 80–4. Denver
Hodges KV, Bowring SA (1995) 40Ar/39Ar thermochronology of
isotopically zoned micas: Insights from the southwestern USA
proterozoic orogen. Geochim Cosmochim Acta
59(15):3205–3220
Holm D, Schneider D (2002) 40Ar/39Ar evidence for ca. 1800 Ma
tectonothermal activity along the Great Falls tectonic zone,
central Montana. Can J Earth Sci 39(12):1719
Jaffey AH, Flynn KF, Glendenin LE, Bentley WC, Essling AM
(1971) Precision measurement of half-lives and specific activ-
ities of 235U and 238U. Phys Rev C 4(5):1889
Jordan TH (1988) Structure and formation of the cotinental
tectosphere. J Petrol 1:11–37
Mattinson JM (2005) Zircon U-Pb chemical abrastion (‘‘CA-TIMS’’)
method: combined annealing and multi-step partial dissolution
analysis for improved precision and accuracy of zircon ages.
Chem Geol 220:47–66
Mezger K, Hanson GN, Bohlen SR (1989) High-precision U-Pb ages
of metamorphic rutile: application to the cooling history of high-
grade terranes. Earth Planet Sci Lett 96:106–118
Miller BV, Dunning GR, Barr SM, Raeside RP, Jamieson RA,
Reynolds PH (1996) Magmatism and metamorphism in a
Grenvillian fragment: U-Pb and 40Ar/39Ar ages from the Blair
River Complex, Northern Cape Breton Island, Nova Scotia,
Canada. Geol Soc Am Bull 108(2):127–140
Moller A, Mezger K, Schenk V (2000) U-Pb dating of metamorphic
minerals: Pan-African metamorphism and prolonged slow cool-
ing of high pressure granulites in Tanzania, East Africa.
Precambrian Res 104(3–4):123–146
Morin D, Corriveau L (1996) Fragmentation processes and xenolith
transport in a Proterozoic minette dyke, Grenville province,
Quebec. Contrib Mineral Petrol 125(4):319–331
Mueller PA, Heatherington AL, Kelly DM, Wooden JL, Mogk D
(2002) Paleoproterozoic crust within the Great Falls tectonic
Contrib Mineral Petrol
123
zone: implications for the assembly of southern Laurentia.
Geology 30(2):127–130
Mueller PA, Burger HR, Wooden JL, Brady JB, Cheney JT, Harms
TA, Heatherington AL, Mogk DW (2005) Paleoproterozoic
metamorphism in the northern wyoming province: implications
for the assembly of laurentia. J Geol 113:169–179
Pollack HN, Chapman DS (1977) On the regional variation of heat
flow, geotherms, and lithospheric thickness. Tectonophysics
38:279–296
Rudnick RL, McDonough WF, O’Connell RJ (1998) Thermal
structure, thickness and composition of continental lithosphere.
Chem Geol 145(3–4):395–411
Rudnick RL, Gao S, Heinrich DH, Karl KT (2003) Composition of
the continental crust. In: Treatise on geochemistry. Pergamon,
Oxford, pp 1–64
Rutherford MJ (2008) Magma Ascent Rates. In: Putirka KD, Tepley
FJ (eds) Minerals, inclusions and volcanic processes, vol 69.
Mineralogical Society of America, Washington, pp 241–271
Schmitz MD, Bowring SA (2003) Constraints on the thermal
evolution of continental lithosphere from U-Pb accessory
mineral thermochronometry of lower crustal xenoliths, southern
Africa. Contrib Mineral Petrol 144:592–618
Schoene B, Bowring SA (2007) Determining accurate temperature-
time paths from U-Pb thermochronology: An example from the
Kaapvaal craton, southern Africa. Geochim Cosmochim Acta
70:165–185
Sparks RSJ, Baker L, Brown RJ, Field M, Schumacher J, Stripp G,
Walters A (2006) Dynamical constraints on kimberlite volca-
nism. J volcanol Geotherm Res 155(1–2):18–48
Spera FJ (1984) Carbon dioxide in petrogenesis III: role of volatiles in
the ascent of alkaline magma with special reference to xenolith-
bearing mafic lavas. Contrib Mineral Petrol 88(3):217–232
Tilton GR (1960) Volume diffusion as a mechanism for discordant
lead ages. J Geophys Res 65(9):2945–2963
Villeneuve ME, Ross GM, Theriault RJ, Miles W, Parrish RR,
Broome J (1993) Tectonic subdivision and U-Pb geochronology
of the crystalline basement of the Alberta Basin, Western
Canada. Geol Surv Can Bull 447:86
Watson E, Wark D, Thomas J (2006) Crystallization thermometers for
zircon and rutile. Contrib Mineral Petrol 151(4):413–433
Wetherill G (1956) Discordan Uranium-Lead ages, I. Transactions.
Am Geophys Union 37(3):320–326
Whitney DL, Evans BW (2010) Abbreviations for names of rock-
forming minerals. Am Mineral 5(1):185–187
Contrib Mineral Petrol
123