The deep structure of the Iranian Plateau
12
The deep structure of the Iranian Plateau K. Motaghi a,b,c , M. Tatar b, ⁎, K. Priestley d , F. Romanelli c,e , C. Doglioni f , G.F. Panza c,e,g,h a Institute for Advanced Studies in Basic Sciences, 45195-1159 Zanjan, Iran b International Institute of Earthquake Engineering and Seismology, 19395-3913 Tehran, Iran c Department of Mathematics and Geosciences, University of Trieste, Via Weiss, I-34127 Trieste, Italy d Bullard Laboratories, University of Cambridge, UK e International Centre for Theoretical Physics — SAND group, I-34151 Trieste, Italy f Dipartimento Scienze Terra, Universita` La Sapienza, Roma, Italy g Institute of Geophysics, China Earthquake Administration, Beijing, 100080, China h International Seismic Safety Organization, ISSO abstract article info Article history: Received 26 October 2013 Received in revised form 28 February 2014 Accepted 22 April 2014 Available online xxxx Handling Editor: A.R.A. Aitken Keywords: Iranian Plateau Crust Deep structure Receiver function Surface wave Bouguer gravity modeling High resolution structures of the lithosphere–asthenosphere system beneath a seismic profile in Iran are obtained by the simultaneous inversion of data from receiver functions and fundamental mode Rayleigh wave group velocity and validated by modeling Bouguer gravity anomaly data. The seismic data are gathered over a profile extending across Zagros, Sanandaj–Sirjan Zone (SSZ), Urumieh–Dokhtar magmatic arc (UDMA), Central Iran, Alborz–Binalud Mountain ranges and Kopeh Dagh Mountain ranges. The results confirm the presence of crustal roots at the north and south of Iranian Plateau where it meets the Arabian Plate and Eurasia. The high velocity lithosphere of the Arabian Plate gently plunges NNE-ward beneath Central Iran supporting the subduction of the continental litho- sphere responsible for the seismicity of the area. The crust and lithosphere are thinner beneath Central Iran, where two low velocity structures are very likely related to magma sources of the UDMA and in east of Iran, around Lut block, where the volcanism shows calcalkaline subduction-related geochemistry. The crustal-lithospheric root to the north of the Iranian Plateau may represent the relict of a previous “cimmeric” subduction zone. Therefore the Iranian lithosphere–asthenosphere system could be the result of the coalescence of two separate subduction zones. © 2014 International Association for Gondwana Research. Published by Elsevier B.V. All rights reserved. 1. Introduction The complex features in the Iranian crust, lithospheric mantle and asthenosphere structure result from the Arabia–Eurasia Plate conver- gence. The SSW-overriding of Eurasia over Arabia during late Mesozoic caused the subduction under Central Iran. Collision occurred between ~35 and 12 Ma ago (e.g., Hessami et al., 2001; Allen and Armstrong, 2008; Mouthereau et al., 2012). This collision is associated with two suture zones in Iran: Zagros mountain range in the south, along Main Zagros Thrust (MZT) Fault (e.g. Kaviani et al., 2007; Paul et al., 2010 and references therein); Kopeh Dagh mountain range in the northeast, along Main Kopeh Dagh Fault, Bakharden–Quchan Fault system as well as the river between Alborz–Binalud and Kopeh Dagh Mountan ranges, i.e. Atrak River (ATR, Fig. 1) (e.g. Alavi, 1992, 1996; Hollingsworth et al., 2006; Shabanian et al., 2009; Motaghi et al., 2012b)(Fig. 1). The conver- gence during continent–continent collision caused shortening and thick- ening beneath both Zagros and Kopeh Dagh mountain ranges and the Iranian Plateau, which is located between these mountains. Paul et al. (2006, 2010) analyzed the data gathered by a network of 66 seismolog- ical stations (Zagros profile hereafter) along a profile perpendicular to the tectonic strike of Zagros and calculated P receiver functions (PRFs) beneath all stations. They found an ~67 km crustal root north of Zagros Mountain, beneath Sanandaj–Sirjan Zone (SSZ, Fig. 1) which is a highly deformed and moderately metamorphosed remnant of the southern margin of Central Iran. Later, Motaghi et al. (2012a) used 16 broadband stations installed along the profile across Central Iran, Binalud and Kopeh Dagh Mountains (NE Iran profile) to do the same analysis. In fact, NE Iran profile (operating from 2006 to 2008) is a continuation of Zagros profile (operating from 2000 to 2001). The latter profile overlaps with the older one (with two stations located in similar locations) and follows a similar trend. Motaghi et al. (2012a) calculated PRFs and found an ~55 km crustal root beneath Binalud foreland. None of these roots are located beneath high topography, in the study area, thus it is reasonable to speculate that they are supported by relatively deep geodynamic processes and not by the surface load of mountain ranges and the mechanism of isostasy. These studies indicate that the litho- spheres of the Arabia and Eurasia Plates along the suture zones are under-thrust beneath Central Iran and that doubling of lithosphere occurs at the north and south boundaries of Central Iran. Therefore we test Gondwana Research xxx (2014) xxx–xxx ⁎ Corresponding author. E-mail address: [email protected] (M. Tatar). GR-01258; No of Pages 12 http://dx.doi.org/10.1016/j.gr.2014.04.009 1342-937X/© 2014 International Association for Gondwana Research. Published by Elsevier B.V. All rights reserved. Contents lists available at ScienceDirect Gondwana Research journal homepage: www.elsevier.com/locate/gr Please cite this article as: Motaghi, K., et al., The deep structure of the Iranian Plateau, Gondwana Research (2014), http://dx.doi.org/10.1016/ j.gr.2014.04.009
Transcript of The deep structure of the Iranian Plateau
Gondwana Research xxx (2014) xxx–xxx
GR-01258; No of Pages 12
Contents lists available at ScienceDirect
Gondwana Research
j ourna l homepage: www.e lsev ie r .com/ locate /gr
The deep structure of the Iranian Plateau
K. Motaghi a,b,c, M. Tatar b,⁎, K. Priestley d, F. Romanelli c,e, C. Doglioni f, G.F. Panza c,e,g,h
a Institute for Advanced Studies in Basic Sciences, 45195-1159 Zanjan, Iranb International Institute of Earthquake Engineering and Seismology, 19395-3913 Tehran, Iranc Department of Mathematics and Geosciences, University of Trieste, Via Weiss, I-34127 Trieste, Italyd Bullard Laboratories, University of Cambridge, UKe International Centre for Theoretical Physics — SAND group, I-34151 Trieste, Italyf Dipartimento Scienze Terra, Universita` La Sapienza, Roma, Italyg Institute of Geophysics, China Earthquake Administration, Beijing, 100080, Chinah International Seismic Safety Organization, ISSO
⁎ Corresponding author.E-mail address: [email protected] (M. Tatar).
http://dx.doi.org/10.1016/j.gr.2014.04.0091342-937X/© 2014 International Association for Gondwa
Please cite this article as: Motaghi, K., et al.,j.gr.2014.04.009
a b s t r a c t
a r t i c l e i n f oArticle history:Received 26 October 2013Received in revised form 28 February 2014Accepted 22 April 2014Available online xxxx
Handling Editor: A.R.A. Aitken
Keywords:Iranian PlateauCrustDeep structureReceiver functionSurface waveBouguer gravity modeling
High resolution structures of the lithosphere–asthenosphere system beneath a seismic profile in Iran are obtainedby the simultaneous inversion of data from receiver functions and fundamentalmodeRayleighwave group velocityand validated by modeling Bouguer gravity anomaly data. The seismic data are gathered over a profile extendingacross Zagros, Sanandaj–Sirjan Zone (SSZ), Urumieh–Dokhtar magmatic arc (UDMA), Central Iran, Alborz–BinaludMountain ranges and Kopeh Dagh Mountain ranges. The results confirm the presence of crustal roots at the northand south of Iranian Plateau where it meets the Arabian Plate and Eurasia. The high velocity lithosphere of theArabian Plate gently plunges NNE-ward beneath Central Iran supporting the subduction of the continental litho-sphere responsible for the seismicity of the area. The crust and lithosphere are thinner beneath Central Iran,where two low velocity structures are very likely related tomagma sources of the UDMA and in east of Iran, aroundLut block, where the volcanism shows calcalkaline subduction-related geochemistry. The crustal-lithospheric rootto the north of the Iranian Plateau may represent the relict of a previous “cimmeric” subduction zone. Thereforethe Iranian lithosphere–asthenosphere system could be the result of the coalescence of two separate subductionzones.
© 2014 International Association for Gondwana Research. Published by Elsevier B.V. All rights reserved.
1. Introduction
The complex features in the Iranian crust, lithospheric mantle andasthenosphere structure result from the Arabia–Eurasia Plate conver-gence. The SSW-overriding of Eurasia over Arabia during late Mesozoiccaused the subduction under Central Iran. Collision occurred between~35 and 12 Ma ago (e.g., Hessami et al., 2001; Allen and Armstrong,2008; Mouthereau et al., 2012). This collision is associated with twosuture zones in Iran: Zagros mountain range in the south, along MainZagros Thrust (MZT) Fault (e.g. Kaviani et al., 2007; Paul et al., 2010 andreferences therein); Kopeh Dagh mountain range in the northeast,along Main Kopeh Dagh Fault, Bakharden–Quchan Fault system as wellas the river between Alborz–Binalud and Kopeh Dagh Mountan ranges,i.e. Atrak River (ATR, Fig. 1) (e.g. Alavi, 1992, 1996; Hollingsworth et al.,2006; Shabanian et al., 2009; Motaghi et al., 2012b) (Fig. 1). The conver-gence during continent–continent collision caused shortening and thick-ening beneath both Zagros and Kopeh Dagh mountain ranges and theIranian Plateau, which is located between these mountains. Paul et al.
na Research. Published by Elsevier B.
The deep structure of the Ira
(2006, 2010) analyzed the data gathered by a network of 66 seismolog-ical stations (Zagros profile hereafter) along a profile perpendicular to thetectonic strike of Zagros and calculated P receiver functions (PRFs)beneath all stations. They found an ~67 km crustal root north of ZagrosMountain, beneath Sanandaj–Sirjan Zone (SSZ, Fig. 1) which is a highlydeformed and moderately metamorphosed remnant of the southernmargin of Central Iran. Later, Motaghi et al. (2012a) used 16 broadbandstations installed along the profile across Central Iran, Binalud andKopeh Dagh Mountains (NE Iran profile) to do the same analysis. Infact, NE Iran profile (operating from 2006 to 2008) is a continuation ofZagros profile (operating from 2000 to 2001). The latter profile overlapswith the older one (with two stations located in similar locations) andfollows a similar trend. Motaghi et al. (2012a) calculated PRFs andfound an ~55 km crustal root beneath Binalud foreland. None of theseroots are located beneath high topography, in the study area, thus it isreasonable to speculate that they are supported by relatively deepgeodynamic processes and not by the surface load of mountain rangesand the mechanism of isostasy. These studies indicate that the litho-spheres of the Arabia and Eurasia Plates along the suture zones areunder-thrust beneath Central Iran and that doubling of lithosphere occursat the north and south boundaries of Central Iran. Therefore we test
V. All rights reserved.
nian Plateau, Gondwana Research (2014), http://dx.doi.org/10.1016/

Fig. 1. Study area; region covered by seismic stations (triangles: Zagros profile, inverted triangles: NE Iran profile) along a line (A–B) from the Zagros which is the north edge of ArabianPlate in Iran across the Sanandaj–Sirjanmetamorphic Zone (SSZ), the Urumieh–Dokhtarmagmatic arc (UDMA), Central Iran, the Alborz–BinaludMountains to the Kopeh DaghMountainswhich is the south edge of Eurasian TuranPlate. Solid lines represent the active faults (Hessami et al., 2003). The distance along theprofiles is calculated relative to NIK (black triangle)withpositive values in the NE direction. MZT: main Zagros thrust fault, DF: Doruneh fault, ATR: Atrak river.Geological map modified from the structural map of NGDIR (National Geoscience Database of Iran, http://www.ngdir.ir).
2 K. Motaghi et al. / Gondwana Research xxx (2014) xxx–xxx
whether the presence of two ophiolitic suture zones is indicative of twosubduction processes or is the result of an intermediate lithosphericstretching.
Regional tomography studies over Iran show that the low velocitylithosphere of Central Iran is located between two high velocity andprobably colder lithospheres of Arabia (e.g. Maggi and Priestley, 2005;Kaviani et al., 2007; Shomali et al., 2011; Shad Manaman et al., 2011)and Eurasia (e.g. Motaghi et al., 2012b) Plates. The large amount ofcrustal seismic activity in the Zagros, Alborz–Binalud and Kopeh DaghMountains shows that these ranges are still active (e.g., Maggi et al.,2000; Tatar et al., 2004). Crustal seismicity is observed everywhere inthese mountains, but no relevant subcrustal earthquakes have beenlocated, so far (Turkelli et al., 2003). The subduction of continental lith-osphere has been demonstrated in the Alps (Panza and Müller, 1978;Panza et al., 1982;Müller and Panza, 1986) and these pioneering papers
Please cite this article as: Motaghi, K., et al., The deep structure of the Iraj.gr.2014.04.009
have been recognized in several other collisional belts such as theHimalaya or in retreating slabs as in the Apennines (Doglioni et al.,2007). Moreover, the rheology of the continental lithosphere is respon-sible for the termination of seismicity at a depth less than that of oceaniclithosphere (Carminati et al., 2002). As an example, the Himalayas andcentral-northern Apennines subduction zones have no deep seismicity,but they are active as shown by any type of geodynamic data. Therefore,the absence of deep seismicity is not an indication of an inactive subduc-tion, which could rather be of continental nature. During collisionalstages, the convergence/shortening ratio along subduction zones de-creases, due to the increasing partitioning between contraction in theorogenic prism and subduction (Doglioni et al., 2007). Priestley et al.(2012) show a high velocity thickened lithosphere beneath the Zagroswhich is stabilized from delamination by depletion. The signature fordepletion is the volcanic eruptions above the Zagros which have a low
nian Plateau, Gondwana Research (2014), http://dx.doi.org/10.1016/

Fig. 2. Azimuthal distribution of 250 events used in this study (circles) in relationship tothe study area (triangle).
3K. Motaghi et al. / Gondwana Research xxx (2014) xxx–xxx
density, depleted source (McKenzie and Priestley, unpublished results).These studies show that there are still open questions about the fate ofsubduction activity beneath the Zagros, although there are several linesof evidences supporting a seismically silent (but active) slab at depth(Chen and Yang, 2004).
About half of the current convergence between Arabia and Eurasiainside Iran (~10 mm/y) is accommodated by shortening in the ZagrosMountains (Tatar et al., 2002) and the remnant is mainly accommodatedacross Alborz–Binalud and Kopeh Dagh Mountains as well as SouthCaspian Sea (Vernant et al., 2004). Both the Eurasia and Arabia Platesmove westerly relative to themantle, albeit Eurasia is faster and overrid-ing SW-ward Arabia (Crespi et al., 2007). This geodynamic frameworkconstrains the active subduction zone, although continental in composi-tion. The relative convergence between the Eurasia and Arabia is compli-cated by the contemporaneous CCW subrotation (Cuffaro et al., 2008) oftheArabia lowerplate. Central Iran consists of amosaic of various tectonicrigid blocks, the Lut block, located in the east of Iran, is one of these blocks(Fig. 1), and most of the seismic deformation has been concentratedwithin the deformational zones among these rigid blocks.
The Iranian Plateau is a natural laboratory for investigating geo-dynamical processes related to the early phases of continent–continentcollision. Here we present the high resolution crust and uppermostmantle (lithosphere–asthenosphere system) structure along a transectfrom the Zagros, which is the north edge of Arabian Plate in southIran, across Sanandaj–Sirjan metamorphic zone (SSZ), which is a rem-nant of the southern active margin of Central Iran, Urumieh–Dokhtarmagmatic arc (UDMA), which is characterized by volcanic activityfrom Eocene to Miocene (e.g. Chiu et al., 2013), Central Iran, which is arelatively less deformed block surrounded by active margins, theAlborz–Binalud Mountains which are the north edge of Central Iran toKopeh Dagh Mountains which are the south edge of Eurasian TuranPlate (Fig. 1). In this paper, we consider the data gathered bybroad-band stations of Zagros profile and NE Iran profile to calculate1-D absolute S-wave velocity distribution with depth beneath eachseismic station, using the joint inversion of PRF and Rayleigh-wavedispersion (Julia et al., 2000). To achieve this, we calculate and analyzethe PRFs of those records for which the signal to noise ratio can be im-proved by stacking many waveform traces and we present one or twohigh quality stacked receiver functions for each station. The procedureused to simultaneously invert the PRF and the surface wave dispersion(Section 4) can be summarized as follows. We juxtapose all absolute1-D velocity models obtained from the joint inversion to construct a2-D S-wave velocity model along the profile AB in Fig. 1. The obtainedresolution of the lateral variability of the lithosphere–asthenospheresystem is validated with the Bouguer gravity anomaly along the profile:starting from a densitymodel obtained from the S-wave velocitymodel,via a standard relation between density and S-wave velocity (e.g.Ludwig et al., 1970). The density distribution beneath seismic profileis determined by linear inversion of Bouguer anomaly. The structuresresolved by this procedure are interpreted in terms of subduction andasthenosphere upwelling.
2. Data set
From August 2006 to February 2008, the International Institute ofEarthquake Engineering and Seismology (IIEES), Tehran, in collaborationwith Cambridge University in the United Kingdom installed a temporarynetwork of 16 broadband stations positioned along a profile from thesouthern edge of Central Iran, across Binalud Mountains to the KopehDagh (inverted triangles in Fig. 1). The profile is oriented N46°E, almostperpendicular to the structural trend of the Binalud and Kopeh Daghand along the trend of the Tectonic Equator (TE) and its perturbation(Crespi et al., 2007; Panza et al., 2010). Each seismograph consists of aCMG-3TD 120 s three-component Guralp sensor and CMG-DM24 dataloggers belong to Cambridge University. The data were continuouslysampled at 100 samples per second and stamped with GPS time.
Please cite this article as: Motaghi, K., et al., The deep structure of the Iraj.gr.2014.04.009
The interstation distance varies between 20 km and 100 kmwith anaverage of ~30 km. The interstation distance is smaller (~20 km) thanaverage in the NE continental collision zones, i.e., Kopeh Dagh andBinalud Mountain ranges, where strong lateral variation in the crustalthickness is expected, and is larger (~50–100 km) in Central Iranwhich is a less deformed tectonic block. The limited number of seismicinstruments and the different logistic situation of Central Iran whichcan be extremely hot and sandymade it difficult to find the suitable sta-tion location in this area— resulting in larger interstation distance there.
To expand our study area, we used the data fromZagros profile (Paulet al., 2006), primarily using the data from themedium and broad-bandstations. The average interstation distance of selected stations of thisprofile was ~35 km. The profile resulting from the merging of Zagrosand NE Iran profiles, referred to as the Iran Profile, is 1200 km longand it includes 32 seismic stations (Fig. 1).
We use 250 teleseismic records of earthquakes with magnitude 5.5or greater and epicentral distances between 25° and 95° (Fig. 2). Around85% of these events are recorded from back-azimuth of 25° to 125°.Most of the events are in the 40° to 90° distance range.
3. Data preparation
3.1. Calculation of P-wave receiver function (PRF)
For each event, a 120 s time-window centered at the direct P arrivalis selected and used for the calculation of the PRF. Receiver functions aredetermined using the iterative deconvolution method of Ligorria andAmmon (1999). The Gaussian smoothing factor of 1.0 is equivalent ofthe application of a 0.5 Hz low pass filter to the seismograms. The dataset of acceptable receiver functions was arranged with increasing theo-retical back-azimuth. The PRFs calculated for stations located in a lessdeformed tectonic area, i.e. Central Iran, show a rather simple structurecompared with those obtained from stations that are located over themountain ranges. Some examples of the calculated PRFs are given byMotaghi et al. (2012a).
We next stack the PRFs to improve the signal to noise ratio. Stacking isstraightforwardwhen thePRFs are similar to eachother and represent thesame structure. The PRFs obtained for one station can change with the
nian Plateau, Gondwana Research (2014), http://dx.doi.org/10.1016/

4 K. Motaghi et al. / Gondwana Research xxx (2014) xxx–xxx
variation of two parameters: 1 — source–station distance and 2 — back-azimuth. To overcome the effect of distance on PRFs, we make a move-out correction using a simple migration technique. The basic concept isto apply a time stretching factor and amplitude scale factor to a receiverfunction to map it into a receiver function generated with a referenceray parameter. To consider the dependence on the back-azimuth, whichis due to complicated crustal structure beneath the receiver, we groupreceiver functions with similar P-wave delay time and stack each groupseparately. The individual PRFs are aligned according to the P-wavearrival and stacked and then used in themodeling of velocity structuresusing the joint inversion procedure.
3.2. Dispersion data
The data of the fundamental mode Rayleigh-wave group velocitiesare extracted from the tomographic study by Rahimi et al. (underreview). Group velocities from teleseismic events recorded at 29 per-manent broad-band stations within Iran were measured for the funda-mental mode Rayleigh waves, for the 10–100 s period range. Thefundamental mode was identified using the frequency time analysis(FTAN) approach (Levshin et al., 1972, 1992) and was applied for 1586teleseismic records. The ray paths were selected in a way to satisfy thetwo-station method conditions (e.g., Mitchell, 1995) and the inter-station path average group velocity was calculated using Wienerdeconvolution (e.g., Hwang and Mitchell, 1986). More than 240 inter-station group velocity dispersion curves, covering all Iran Plateau, wereinverted to prepare tomographic maps by applying the 2-D tomographymethod described byYanovskaya andDitmar (1990). The tests presentedby Rahimi et al. (under review) show that resolution length (the meansize of the averaging area) of the tomographic maps is mainly less than100 km along the Iran profile. The available dispersion data in the regionare discretized using a uniform 0.5° × 0.5° grid, therefore, in the joint in-version, for each station the fundamentalmode Rayleighwave dispersionis taken from the relevant tomographic 0.5° × 0.5° cell containing thatstation.
4. Inversion procedure
We briefly describe here the procedure we used to jointly invert thestacked receiver function and surfacewave dispersion data. We employthe program joint96 which is available in the software package“Computer Program in Seismology” (Herrmann and Ammon, 2003).
The damped least square method (Menke, 1989) is used to invertthe two data sets for a S-wave velocitymodel. Thismethod is a commonregularization method, which searches for the “simplest”model that fitsthe data within the limits of its variance (Menke, 1989; Ammon et al.,1990). One important parameter in this method, the damping factorthat balances the trade-off between model stability and resolution, hasbeen chosen equal to 0.5. The selection of a common value for all thestations may allow some trivial features to enter in the model; however,the stability tests performed after the inversion helped to remove thosefeatures successfully.
Another important factor in the joint inversion is the factor, p, that isrelated to the weight given to the dispersion data in comparison withreceiver function. Selecting a high value for p (close to 1) causes moreweight to dispersion data in inversion. We select p = 0.25 to give moreweight to receiver function and find a relatively high resolution modelfor our study area.
The procedure used for the joint inversion is based on the lineariza-tion of a non-linear inversion problem. Based on this fact, the finalmodel is dependent on the initial model. The drawbacks intrinsic insuch problems can be minimized by considering reliable startingmodels obtained from other studies. The initial models used in thisstudy are taken from Rahimi et al. (under review) who has presenteda set of S-wave velocitymodels for each tectonic area of Iran consideredin this study (e.g. Zagros, Central Iran, and KopehDagh), obtained by the
Please cite this article as: Motaghi, K., et al., The deep structure of the Iraj.gr.2014.04.009
Hedgehog inversion of the dispersion curves (e.g. Panza, 1981). Sincethis method of inversion is nonlinear, it can take into account the non-uniqueness of the inverse problem presenting several models for eachregion, with an indication of their related uncertainties.
For each initialmodel, the linearized joint inversion is controlled by amisfit function that controls the variation of percent of fit between thetheoretical and experimental receiver functions at each iteration: ifthe variation is less than 0.05%, the process is terminated.
In such away, we obtain a set of initialmodels and thus a large set ofsolutions for each station. It is useful to identify a representative modelto summarize and interpret the results. In this study, the representativemodel is chosen according to the following criteria: the solution withthe closest percentage of fit to the average value of all percentages offits obtained from all the solutions for the station. This criterion reducesthe effects of the projection of possible systematic errors into theinverted structural model. This criterion is similar to the selection ofthe median model.
5. Stability tests
We perform stability tests for each station to find the most robustvelocity model that is consistent, within errors, with the observeddata sets. The stability tests are made in two steps: 1 — search for the“optimal” parameterization for the joint inversion, 2 — regularizationof the model output of the inversion procedure. The second stabilitytest aims also to investigate if the resolution improvement is localizedeither in the crust or in the entire model. To answer this question, wedivide the layers of the crust and upper mantle by IS/1.5 and IS/1.0respectively (IS, or “incremental step”, is theminimum thickness resolv-able by the dispersion data), and compare the resultant models withthose in which all layers are divided by IS/1.5. We observe that only inrare cases is the fit improved by the thinning of layers in the uppermantle.
5.1. Search of the “optimal” parameterization
In order to find the optimal parameterization for the joint inversion,we assign to each layer of the model a thickness equal to the IS used inthe non-linear inversion of dispersion measurements reported byRahimi et al. (under review). The IS is dependent on several parameters,including the dispersion curve error (e.g. Panza, 1981). Based on the factthat receiver functions are relatively higher in frequency time series,they may resolve smaller features in the Earth in comparison with dis-persion data. Thus, the layers of the initial models are subdivided insub-layers with thickness equal to IS divided by 1.0, 1.25, 1.50 and 2.0.We then operate the joint inversion for each parameterization andkeep track of the percentage of fit to observed receiver function. If thin-ning the layers improves the fit, the new parameterization is acceptedand a new iteration in the inversion is performed selecting thinnerlayers. If the improvement is less than 1% (which is chosen empirically),the new parameterization is rejected and the iterations are terminated.
The final models obtained for the four parameterizations, IS/1.0, IS/1.25, IS/1.5, IS/2.0 respectively, are presented in Fig. 3 for KAM station.In most of the cases, the procedure of thinning of layers improves thefit to the receiver function of up to IS/1.5.
5.2. Regularization of the inverted models
The S-wave velocity model obtained with the receiver function anddispersion data inversion is simplified to one with a smaller numberof layers (model regularization). The model regularization permitsidentifying robust, reliable features of the models (e.g. Foulger et al.,2013) and can be summarized as follows.
The main velocity boundaries in the model are identified and thenthe average velocity of the layers located between those assumedboundaries is calculated. With this regularized model, by forward
nian Plateau, Gondwana Research (2014), http://dx.doi.org/10.1016/

Fig. 3. Final results obtained for the four different parameterizations performed for the sta-tion KAM (shown in Fig. 1). The starting thickness of the layerswas determined by Rahimiet al. (under review) using the concept of the resolving power of dispersion data (Panza,1981). The thickness of inverted layers was subdivided in sub-layers with thicknessequal to the IS divided by 1 (a), 1.25 (b), 1.5 (c) and 2 (d) respectively. For each case,the percentage indicates the average value obtained for the fit (between theoretical andexperimental RFs) considering all the initial models.
Fig. 4. Simplifying the inverted velocity model for station CHA (shown in Fig. 1).a) Observed stacked receiver function (black line) with its error bar (black dashed lines) andsynthetic (red line) receiver function computed for the simplified crustal model shown bythe red line in (c). b) The observed (solid black line) group velocity with its error bar(black dashed lines) and synthetic (red line) group velocity computed for the simplifiedcrustal model shown by the red line in (c). c) Velocity model obtained from joint inversion(solid blue line) and the simplified crustal model (solid red line), which is considered asthe finalmodel. Dashed line is the initial velocitymodel. (For interpretation of the referencesto color in this figure legend, the reader is referred to the web version of this article.)
5K. Motaghi et al. / Gondwana Research xxx (2014) xxx–xxx
modeling, the synthetic receiver function and dispersion curve are com-puted. If the synthetic curves generally fall within the experimentalerror bars, the simplifiedmodel is considered the endmodel. Otherwise,smaller features, averaged before, are added again to the simplifiedmodel to achieve a better fit (synthetic data within the error bars).This method robustly removes the small structural details that are notreally required by the observed data. Fig. 4 shows the final model ob-tained from inversion (blue model in Fig. 4-c) for the station CHA andthe simplifiedmodel (redmodel in Fig. 4-c) aswell as synthetic and ob-served PRFs and dispersion curves. The resolution kernels are computedfor the initial crustal structure used on the joint inversion of dispersioncurves and receiver functions. For all the stations the model resolutionkernels seem reasonable, indicating that the velocity and thickness ofthe layers are well constraint. Fig. 5 represents the resolution kernelscalculated for the final velocity model of station CHA, shown in Fig. 4-c.Red lines represent normalized values of each column of the resolutionmatrix. This matrix is ideally an identity matrix if all inverted parametersare not correlated; in practice, due to the unavoidable correlation, if themodel is satisfactorily resolved, it is amatrixwith narrowpeaks occurringnear the main diagonal. This matrix shows that the estimated model pa-rameters turn out to be linear combinations of the correlated true model
Please cite this article as: Motaghi, K., et al., The deep structure of the Iraj.gr.2014.04.009
parameters (Menke, 1989). For example, as can be deduced from Fig. 5,the estimated value for layer 15 is the average of the true values forthat layer and its two adjacent ones (i.e. layers 14 and 16). The same ap-plies to the other 14 overlying layers, and the one below, but not to layers17–20. Since the longest available period of the group velocity dispersioncurve is 100 s, i.e. surface waves sample to depth less than 350 km andthe sensitivity kernels (obtained for all stations) show that the resolvablefeatures are not deeper than 250–300 km, we limit our maximum depthof investigation to 300 km.
6. Independent geophysical constraint: gravity modeling
A powerful approach for defining realistic geophysical models isthe joint interpretation of different geophysical data, or at least ofone specific data set, constrained by the results of other independentgeophysical data. In this section, we use the geometry of the velocitymodels obtained in previous section as a priori constraints for the linearinversion of gravity Bouguer anomaly data to density. The 2-D S-wavevelocitymodel is converted to densitymodel, keeping the layer's geom-etry fixed, to define the initial densitymodel for the study area. It is wellknown that a range of densities is possible for rockswith a given seismicvelocity (Nafe–Drake relation: Ludwig et al., 1970). The empirical rela-tionship between these two parameters is generally used to connect theS-wave velocity with the density, but with some uncertainty. Thedensity anomaly is calculated by subtracting this density model froma reference density model defined as follows: density of 2.50 g/cm3
for the upper 20 km, density of 2.70 g/cm3 for 20–30 km, density of3.20 g/cm3 for 30–200 km and density of 3.55 g/cm3 for 200–300 kmof depth.
nian Plateau, Gondwana Research (2014), http://dx.doi.org/10.1016/

Fig. 5. Resolution kernels (red curves) calculated for the chosen parameterization of the final velocitymodel for station CHA (blue curve, taken from Fig. 4.c); the layer number, correspondingto each resolution kernel, is given below the right pane. The kernel plots are normalizedwith respect to themaximumvalue of the resolutionmatrix,whosediagonal elements are related to theresolving power, accordingly with Panza (1981). (For interpretation of the references to color in this figure legend, the reader is referred to the web version of this article.)
6 K. Motaghi et al. / Gondwana Research xxx (2014) xxx–xxx
The initial misfit between predicted and observed Bouguer anomalyis large, therefore the density in each layer has been iterativelymodifiedby choosing the new value in the range defined by the error band ofthe Nafe–Drake relation: ±0.2 g/cm3 in the crust (where thedensity b3 g/cm3) and ±0.22 g/cm3 for upper mantle (where thedensity N3.2 g/cm3). The smallest perturbation step used is 0.05 g/cm3,well consistent with the resolving power of our data, and the densityperturbation is made following the equation:
ρ f ¼ ρi � n � 0:05 g=cm3
where ρi is the starting density and ρf is the final accepted value, n is thenumber of perturbation steps and 0.05 is our assumed density resolution.
Observed Bouguer anomaly data, used for this research, were ex-tracted from a global gravity model called GIF48 (Ries et al., 2011) andwere retrieved from the database of International Center for GlobalEarth Models (ICGEM).
7. Results and discussion
The absolute S-wave velocity structure of the lithosphere–astheno-sphere system beneath the Iran profile has been resolved by simulta-neously inverting data from receiver functions and fundamental modeRayleigh wave group velocity. The method generates a 1-D absoluteS-velocity model beneath each station. The thickness of crust andseismic lithosphere (called lithosphere, hereafter) is extracted fromeach calculated 1-D velocity model and presented in Table 1. Thesevalues are resolvable with the error in the range ±1.5 to ±3.5 km forthe crust and about ±15 km for the lithosphere. These uncertaintiesare defined as ± half of the parameter's step at that depth (i.e., equalhalf of minimum thickness, found by first stability test described inSection 5). The thickness of lithosphere is equivalent to the depth inwhich a low velocity layer is distinguished in the obtained 1-D velocitymodels.
Combining the 35 1-D velocity distributions with depth obtainedin this research, a 2-D velocity model beneath Iran, along profile ABin Fig. 1, has been assembled. The cross-section beneath this profileis presented in Fig. 6 that shows the crustal velocity model, i.e., velocitydistributions with depth of up to 70 km, and Fig. 7 that shows the
Please cite this article as: Motaghi, K., et al., The deep structure of the Iraj.gr.2014.04.009
lithosphere–asthenosphere system, down to about 300 km depth. AGaussian filter width of 30 km and 100 km was employed to smoothFigs. 6 and 7, respectively. The crustal model is shown in a separatefigure because the resolving power of our data set in the crust ishigher than in the upper mantle. This model (Figs. 6 and 7) shows ev-idence for strong heterogeneities in the uppermost 300 km beneaththe profile.
7.1. Variability in the crustal structure
The crustal velocity structure is presented in Fig. 6. The upper crust(including sedimentary and crystalline layers: depth range 0–20 km,Vs 2.5–3.2 km/s) has the lower velocity in the south and north of theprofile, i.e., beneath the Zagros (south of profile) as well as the KopehDagh, Binalud and northmost of Central Iran (north of profile). Thehigher velocity upper crust is located in the middle of the profilebeneath SSZ, UDMA and the south andmiddle of Central Iran. These ob-servations are consistent with geology. The Zagros area is covered by atleast 10 km of Cambrian to Miocene sediments (e.g. Stöcklin, 1974;Stoneley, 1981; Hatzfeld et al., 2003) and it is widely accepted that theconstruction of the Zagros Mountains has occurred in large part by fold-ing and thickening of the sedimentary cover on the leading edge of theArabian platform (e.g. see Hatzfeld and Molnar, 2010, and the referencestherein). This is the forebelt of the double verging orogeny. The KopehDagh has 10–17 km thick Mesozoic and Tertiary sediments which werefolded during the Oligo-Miocene orogenic movements (Stöcklin, 1968;AfsharHarb, 1979; Lyberis andManby, 1999).Moving toward the interiorof the orogeny, from thin-skinned tectonics, the deformation becomesthick-skinned.
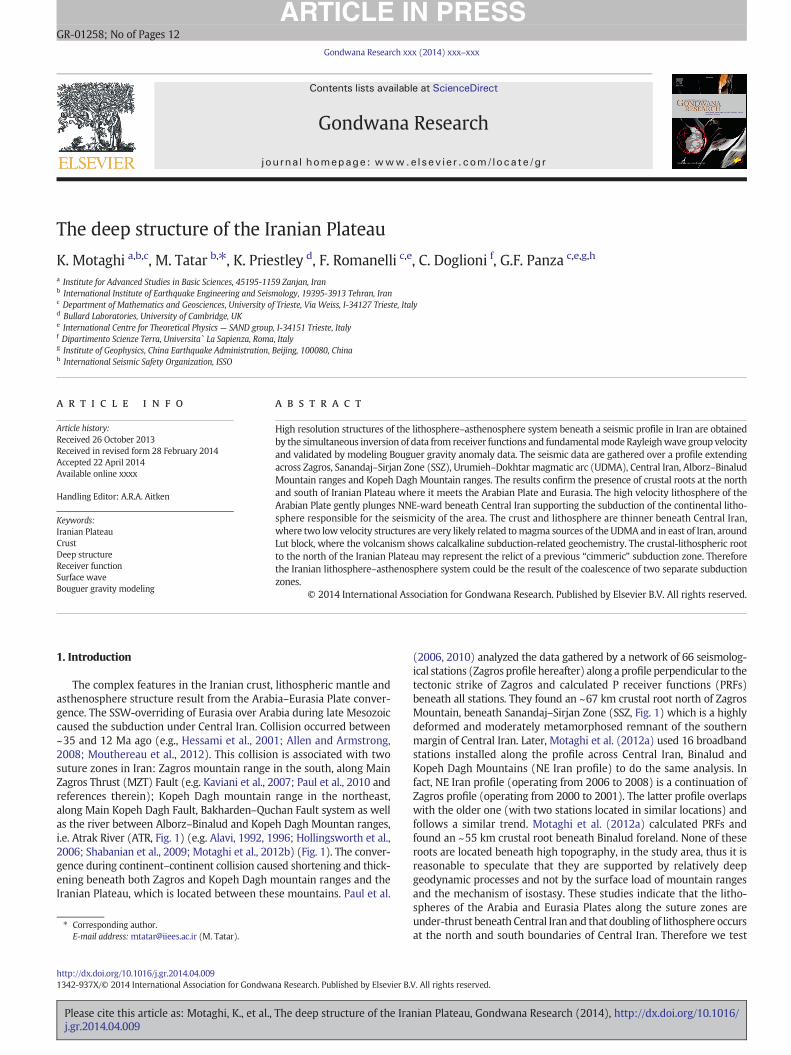
TheMohoboundary and an interpolated crustal thickness are shownin Figs. 6 and 7 by black squares connected by black dashed line, respec-tively. The crustal thickness is large beneath Zagros (~50 km) and it in-creases beneath SSZ and UDMAwhere it reaches its maximum ~59 km.To the north, a smooth decrease is seen at the south and middle ofCentral Iran, reaching its local minimum at the middle of Central Iran,~35 km. Motaghi et al. (2012a) used a migration method described byZhu and Kanamori (2000) to migrate P-to-S converted waves from theMoho boundary (extracted from stacked PRFs) to the Moho depth andreport an even thinner crust ~27.5 km. This value is the smallest crustal
nian Plateau, Gondwana Research (2014), http://dx.doi.org/10.1016/

Table 1The thickness of the crust and the lithosphere extracted from 1-D velocity models. Stations are ordered based on their position in profile from south to north.
Station name F13 M1 A1 A3 M2 B1 B2 B3 M4 M5 M6 C2 D1 D3 NIK M7 JANMoho depth 51 ± 1.5 49 ± 1.5 51 ± 2 51 ± 2 51 ± 1.5 47 ± 2 45 ± 2 47 ± 2 59 ± 1.5 55 ± 1.5 57 ± 1.5 52 ± 1.5 37 ± 1.5 47 ± 1.5 49 ± 3.5 – 40 ± 3.5LAB depth – – – – – – – – – – 147 – 107 147 137 123 133
Table 1 (continued)
Station name JAN CHA SAL TAR SEN KAM NAM KTH BAH group 1 BAH group 2 MOG KBD group 1 KBD group 2 KAR ZOW HAM group 1 HAM group 2 ISGMoho depth 40 ± 3.5 38 ± 2.5 38 ± 2.5 35 ± 2.5 40 ± 3.5 54 ± 1.5 40 ± 1.5 54 ± 1.5 54 ± 1.5 43 ± 1.5 42 ± 1.5 42 ± 1.5 47 ± 2.5 40 ± 1.5 37 ± 1.5 37 ± 1.5 30 ± 1.5 40 ± 2.0LAB depth 133 123 113 123 133 110 123 123 123 – – – 93 – 94 – 120 –
Group 1: model has found using the receiver functions stacked from the back-azimuth: 105°–165°: these back-azimuths differ by less than 30° from the line orthogonal with the east of strike of the array.Group 2: model has found using the receiver functions stacked from the back-azimuth 15°–75°: these back-azimuths differ by less than 30° from the north of strike of the array.
7K.M
otaghietal./Gondw
anaResearch
xxx(2014)
xxx–xxx
Pleasecite
thisarticle
as:Motaghi,K
.,etal.,The
deepstructure
oftheIranian
Plateau,Gondw
anaResearch
(2014),http://dx.doi.org/10.1016/j.gr.2014.04.009
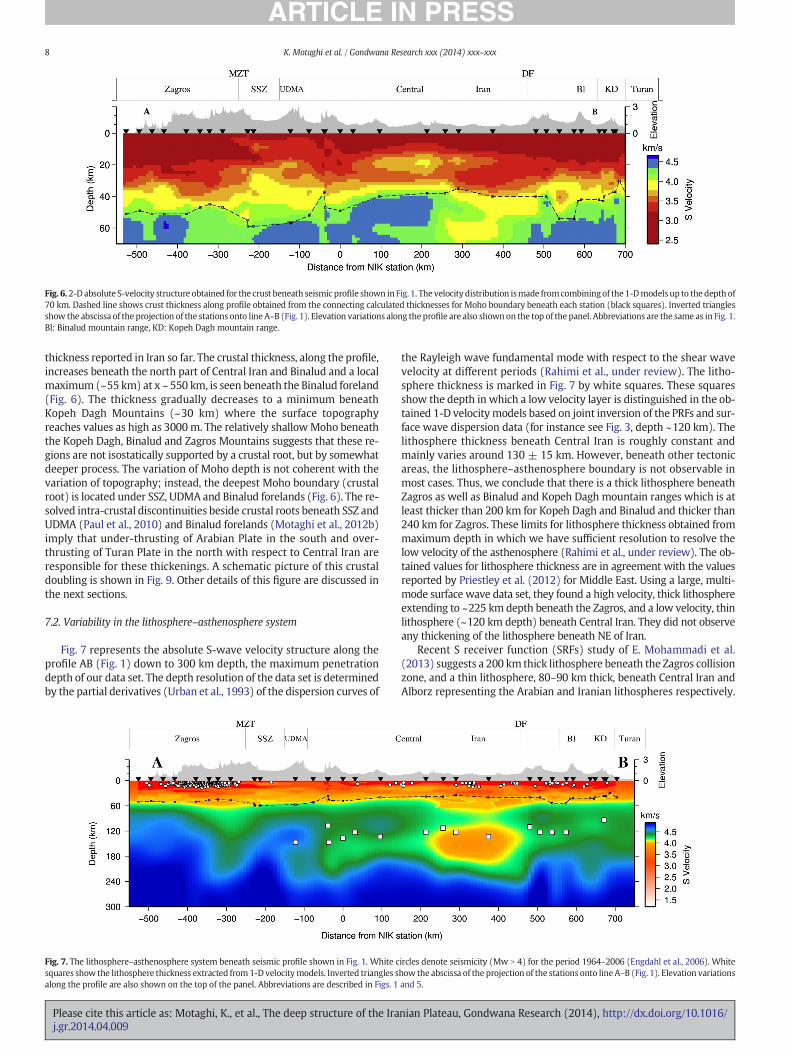
Fig. 6.2-D absolute S-velocity structure obtained for the crust beneath seismic profile shown in Fig. 1. The velocity distribution ismade fromcombiningof the 1-Dmodels up to the depth of70 km. Dashed line shows crust thickness along profile obtained from the connecting calculated thicknesses for Moho boundary beneath each station (black squares). Inverted trianglesshow the abscissa of the projection of the stations onto line A–B (Fig. 1). Elevation variations along the profile are also shown on the top of the panel. Abbreviations are the same as in Fig. 1.Bl: Binalud mountain range, KD: Kopeh Dagh mountain range.
8 K. Motaghi et al. / Gondwana Research xxx (2014) xxx–xxx
thickness reported in Iran so far. The crustal thickness, along the profile,increases beneath the north part of Central Iran and Binalud and a localmaximum (~55 km) at x ~ 550 km, is seen beneath the Binalud foreland(Fig. 6). The thickness gradually decreases to a minimum beneathKopeh Dagh Mountains (~30 km) where the surface topographyreaches values as high as 3000m. The relatively shallowMoho beneaththe Kopeh Dagh, Binalud and Zagros Mountains suggests that these re-gions are not isostatically supported by a crustal root, but by somewhatdeeper process. The variation of Moho depth is not coherent with thevariation of topography; instead, the deepest Moho boundary (crustalroot) is located under SSZ, UDMA and Binalud forelands (Fig. 6). The re-solved intra-crustal discontinuities beside crustal roots beneath SSZ andUDMA (Paul et al., 2010) and Binalud forelands (Motaghi et al., 2012b)imply that under-thrusting of Arabian Plate in the south and over-thrusting of Turan Plate in the north with respect to Central Iran areresponsible for these thickenings. A schematic picture of this crustaldoubling is shown in Fig. 9. Other details of this figure are discussed inthe next sections.
7.2. Variability in the lithosphere–asthenosphere system
Fig. 7 represents the absolute S-wave velocity structure along theprofile AB (Fig. 1) down to 300 km depth, the maximum penetrationdepth of our data set. The depth resolution of the data set is determinedby the partial derivatives (Urban et al., 1993) of the dispersion curves of
Fig. 7. The lithosphere–asthenosphere system beneath seismic profile shown in Fig. 1. White csquares show the lithosphere thickness extracted from 1-D velocitymodels. Inverted triangles salong the profile are also shown on the top of the panel. Abbreviations are described in Figs. 1
Please cite this article as: Motaghi, K., et al., The deep structure of the Iraj.gr.2014.04.009
the Rayleigh wave fundamental mode with respect to the shear wavevelocity at different periods (Rahimi et al., under review). The litho-sphere thickness is marked in Fig. 7 by white squares. These squaresshow the depth in which a low velocity layer is distinguished in the ob-tained 1-D velocitymodels based on joint inversion of the PRFs and sur-face wave dispersion data (for instance see Fig. 3, depth ~120 km). Thelithosphere thickness beneath Central Iran is roughly constant andmainly varies around 130 ± 15 km. However, beneath other tectonicareas, the lithosphere–asthenosphere boundary is not observable inmost cases. Thus, we conclude that there is a thick lithosphere beneathZagros as well as Binalud and Kopeh Dagh mountain ranges which is atleast thicker than 200 km for Kopeh Dagh and Binalud and thicker than240 km for Zagros. These limits for lithosphere thickness obtained frommaximum depth in which we have sufficient resolution to resolve thelow velocity of the asthenosphere (Rahimi et al., under review). The ob-tained values for lithosphere thickness are in agreement with the valuesreported by Priestley et al. (2012) for Middle East. Using a large, multi-mode surface wave data set, they found a high velocity, thick lithosphereextending to ~225 km depth beneath the Zagros, and a low velocity, thinlithosphere (~120 km depth) beneath Central Iran. They did not observeany thickening of the lithosphere beneath NE of Iran.
Recent S receiver function (SRFs) study of E. Mohammadi et al.(2013) suggests a 200 km thick lithosphere beneath the Zagros collisionzone, and a thin lithosphere, 80–90 km thick, beneath Central Iran andAlborz representing the Arabian and Iranian lithospheres respectively.
ircles denote seismicity (Mw N 4) for the period 1964–2006 (Engdahl et al., 2006). Whitehow the abscissa of the projection of the stations onto line A–B (Fig. 1). Elevation variationsand 5.
nian Plateau, Gondwana Research (2014), http://dx.doi.org/10.1016/

9K. Motaghi et al. / Gondwana Research xxx (2014) xxx–xxx
They interpreted their inclined observed structure within the Arabianlithosphere (at 80–150 km depth) as the remnant of the subductedNeo-Tethyan ocean slab. However, their observations for the remnantof the Neo-Tethyan ocean slab are not supported with our findings. Inprevious SRFs study (N. Mohammadi et al., 2013) a thick lithosphereof about 130 and 150 km had been defined beneath the Zagros andSSZ respectively.
At shallow depths of up to ~70 km, the uppermost mantle beneaththe whole profile from A to B is slow, but at deeper parts a high speedS-wave velocity uppermantle is observed beneath the Zagros,which per-sists to more than ~240 km depth. However, the upper mantle beneaththe rest of the profile, i.e. central and NE Iran, is slow up to 180 kmdepth. These results are consistent with the observations of Priestleyet al. (2012) for upper mantle velocity model of the Middle East derivedfrom the surface wave analysis.
Before interpreting velocity variation in upper mantle, we validated,in Section 6 anomalous values against Bouguer gravity anomaly. Fig. 8represents the density model (Fig. 8-lower panel), which predictsBouguer gravity anomaly (red circles) similar to observed (graysquares) data (Fig. 8-upper panel). Strong heterogeneity along theprofile still persists at depths between 60 and 240 km. A high velocity/density lithosphere beneath Zagros (Vs ~4.8 km/s, ρ ≥ 3.4) is observedplunging beneath SSZ, UDMA and Central Iran. We believe this isthe leading edge of Arabian shield subducted under Central Iran. TheV-shaped low velocity anomaly just beneath the MZT (area shown bylight green at ~x = −300 km) is confirmed by gravity modeling: thelow density feature in the range 3.0 g/cm3 and 3.2 g/cm3 beneathMZT. The effect of this low density anomaly is responsible for the longwavelength negative Bouguer anomaly peaking in this location. Paulet al. (2006) who modeled this anomaly as due to the crustal thicknessproperties beneath SSZ andUDMA (Fig. 6) proposed a shalloworigin forthis feature and explained the space shift between Bouguer anomalyand thickened crust introducing a complicated crustal model thatimplies crustal doubling in the region. We think that a deeper feature,
Fig. 8.Up: observed Bouguer anomaly (gray squares) along study area aswell as predicted Bougthe study area. Elevation variations along the profile are also shown on the top of the density mcolor in this figure legend, the reader is referred to the web version of this article.)
Please cite this article as: Motaghi, K., et al., The deep structure of the Iraj.gr.2014.04.009
located in upper mantle and thus well consistent with the S-wave ve-locity model, likely generates such a long wavelength (λ) variation(where λ/2 ~600 km) in the Bouguer anomaly. This V-shaped anomalyprovides evidence for a thickened collided lithosphere located beneaththe Zagros; the lithospheric upper mantle may not be a single layer fea-ture but instead is a layered feature. Shortening and thickening due tocontinental collision, (which makes the lithosphere thicker) affect allintra-lithosphere layers. Since we cannot resolve the lower boundary ofthe lithosphere beneath Zagros, we present this feature as an evidencefor thickening of lithosphere and consequent interruption of astheno-sphere. In addition, the V-shaped low density feature certainly causespositive buoyancy as it is laterally surrounded by denser material andcan contribute to the uplift in Zagros starting from 15 to 12Ma and con-tinuing to the present (Mouthereau et al., 2012 and references therein).However, since the Zagros is an on-going continental subduction system,the orogenic uplift can be inferred as related to the shortening and thick-ening by thrusts and folds of the upper and lower plates, although thebelt has not yet reached the topographic and isostatic steady stateregime.
Two localized low density/velocity anomalies are seen in frontof the V-shaped feature beneath the south and middle of CentralIran at −100 km b x b 100 km and 200 km b x b 400 km at depth be-tween 120 km and 180 km (Fig. 8). These anomalous features are locatedbeneath the thin lithosphere (~135 km) in the study area. Thefirst anom-aly is located north of the UDMA, which is a volcanic arc near and sub-parallel to Main Zagros Thrust Fault (MZT) and the suture betweenArabian Plate and Central Iran. The second anomaly is located, in CentralIran, beneath stations located at NW of Lut block. The surficial projectionof these anomalies coincides with volcanic extrusions that might be sup-plied by such low velocity/density features. The feature almost beneathUDMA is probably a partial melting zone due to fluids produced by dehy-dration of subductedArabian slabmaterial beneath Central Iran. The inef-ficient Sn propagation for paths crossing northern and central Iran(Kadinsky-Cade et al., 1981; Sandvol et al., 2001; Al-Damegh et al.,
uer anomaly (red circles). Down: calculated density distributionwith depth (down) alongodel. Abbreviations are described in Figs. 1 and 5. (For interpretation of the references to
nian Plateau, Gondwana Research (2014), http://dx.doi.org/10.1016/

10 K. Motaghi et al. / Gondwana Research xxx (2014) xxx–xxx
2004) where our results (Figs. 7 and 8) and the surface tomographymodel (Priestley et al., 2012) show very slow upper mantle shear wavevelocity implies high temperatures and the possible presence of somemelt in the uppermost mantle (Molnar and Oliver, 1969). Priestley et al.(2012) using a T(Vs, Z) relation similar to that of Priestley andMcKenzie (2006) which showed that the upper mantle beneath CentralIran has temperature greater than 1405 ± 20 °C at 125 km depth. Theyobserved very low temperature at this depth beneath the Zagros.
Above the anomaly in Central Iran in the upper-mantle there are twoother interesting features: 1— a low velocity anomaly is located just be-neath the crust (around x ~ 300 km, Fig. 7). This feature is confirmed byour densitymodeling (Fig. 8) and by other investigations on Pn velocityvariations beneath the Iranian Plateau (Amini et al., 2012) andwe in-terpret this anomaly as a signature of the accumulation of partialmelts at the base of the crust, i.e., underplating; 2 — there is a high ve-locity feature, with two maxima at x ~ 200 km and x ~ 300 km insidethe crust (Fig. 6), above the underplating zone and we interpret thishigh velocity anomaly as a remnant of igneous intrusion into thelower crust.
Some magmatism of the Lut block (46–25 Ma) is calcalkaline-shoshonitic, i.e., constraining the Eocene–Oligocene age and locationof the Arabia subduction, when the subduction plane was locatedmore to the NE than now, as expected in a laterally growing belt associ-ated to a NE-directed subduction zones.
Pang et al. (2012) studied the volcanic extrusions positioned aroundLut block (Fig. 1). Using 40Ar/39Ar dating they found that volcanismaround Lut block occurred from ~14 Ma to 1.6 Ma ago and has a veryyoung origin and that the alkali basalts observed around Lut most likelyhave asthenospheric origin. The modeling of rare earth element concen-trations in the basalts suggests that the basalts could have been formedby low degrees of partial melting (~3–10%) of an enrichedmantle sourceat garnet-stable depths.Magmas erupted in this setting are geochemicallysimilar to ocean island basalts and there are no geochemical featurespointing to arc-related signature characteristic of the Iranian sub-continental lithospheric mantle (Walker et al., 2009; Pang et al., 2012).However, Mazhari and Safari (2013) have alternatively shown that the
Fig. 9. Simplified sketch illustrating how Iran could be interpreted as the coalescence of at leasouthwestern slab the second presently active. Volcanism was supplied by magmatism generaorogen expanded to the southwest, also the slab and the relatedmagmatismmoved in the samembayment or ophiolitic suites in the Cimmerides and later in Zagros. This interpretation iswelin this paper and shown in Figs. 6, 7 and 8.
Please cite this article as: Motaghi, K., et al., The deep structure of the Iraj.gr.2014.04.009
volcanism around the Lut block is calcoalkaline. Moreover the Zouzanpluton is one of the intrusive bodies in theNE of Lut block enclosed by Ce-nozoic volcanic and sedimentary rocks. It consists of two distinct maficand felsic magmas which are genetically unrelated. All studied rocks arecalc-alkaline in nature, with LILE/REE and HFSE/REE ratios compatiblewith arc related magmatism (Mazhari and Safari, 2013). Relatively highcontents of incompatible elements, low Na2O and Mg# N 44 suggestthat they were derived from partial melting of metabasalt sources in asubduction setting (Mazhari and Safari, 2013). Therefore all thismagmatism appears to be formed by partial melting in the mantlewedge in the hanging wall of the Arabian slab beneath Iran.
Our results are compatible with earlier studies – surface wave dis-persion (e.g., Kaviani et al., 2007; Maggi and Priestley, 2005; Priestleyet al., 2012), Pn velocities (Al-Lazki et al., 2003, 2004; Amini et al.,2012) and P- and S-wave tomography (Alinaghi et al., 2007; Kavianiet al., 2007; Paul et al., 2010) – that found low velocities in the upper-most mantle of Central Iran. But, our findings do not support the ideaof a breakoff of the oceanic Neo-Tethyan slab beneath Central Iran assuggested by E. Mohammadi et al. (2013) and Shomali et al. (2011). Asketch representing a new model for the deep structures beneathIranian Plateau based on our results is presented in Fig. 9. The geologicalmap, the distribution of separated ophiolite belts, and themigration andwidening in time of the orogenic shortening support the notion of atleast two independent subduction events since the Mesozoic. Thiscould be associated to the coalescence of microplates intervening be-tween the Eurasian and Arabian plates. NE-directed subduction zoneslike the Zagros are characterized by slab hinge migrating toward theupper plate. This implies diffuse contraction and double verging orogenin the hangingwall of the subduction zone, plus crustal and lithosphericthickening. Oceanic subduction is superimposed by continental subduc-tion. The double subduction evolution recorded in the surface geology issupported by the geophysical data presented here. The two gravity lowsand the density anomalies in Fig. 8 mark the inferred location of the in-dependent subduction zones: the oldest is the one to the northeastwhile the subduction beneath the Zagros mountains (to the southwest)is the active one.
st two separate subduction zones, the northeastern one the oldest (Cimmerides), and theted by fluids triggering partial melting in the mantle wedge of the upper plate. Since thee direction. L, lower plate, H, subduction hinge, U, upper plate. The black crust is an oceanicl supported by geological data and the geophysical data (gravity and seismology) discussed
nian Plateau, Gondwana Research (2014), http://dx.doi.org/10.1016/

11K. Motaghi et al. / Gondwana Research xxx (2014) xxx–xxx
8. Conclusion
Absolute S-wave velocity structures of the lithosphere–asthenospheresystem beneath a seismic profile in Iran were defined by simultaneouslyinverting data from receiver functions and fundamental mode Rayleighwave group velocity. The seismic profile crosses the Zagros, Sanandaj–Sirjan Zone (SSZ), Urumieh–Dokhtar magmatic arc (UDMA), CentralIran, Alborz–Binaludmountain ranges and Kopeh Daghmountain ranges.To validate the resolved S-wave velocity structures, Bouguer anomalydata have been inverted with the geometrical constrain taken from theS-wave velocity models. The main results obtained are listed below:
1. The upper crust thickness varies considerably beneath the profile: itis thinner in the middle part beneath Central Iran. A roughly similartrend is observed for the total crustal thickness, with the exceptionof two abrupt changes beneath SSZ and UDMA at the south, andbeneath Binalud foreland at the north. Thin crust in Central Iranmay be explained by the rifting episode along the passive margins ofmicrocontinents that characterized this Tethyan realm (e.g., Sengorand Natalin, 1996).
2. The high velocity lithosphere of the Arabia Plate, plunging beneathCentral Iran, is clearly observedbeneath Zagros. This feature representsthe leading edge of Arabian shield subduction beneath Central Iran.The V-shape low velocity/density anomaly in the upper mantle ob-served beneath the MZT can be interpreted as an intra-lithosphericlayer thickened within the continental collision zone.
3. The two low velocity/density anomalies observable in our model be-neath the thin lithosphere of Central Iran (thickness ~135 km) can beinterpreted as due to partial melting in the mantle wedge above theArabian slab, and feeding this magmatic arc (located beside UDMA)and feeding the magmatic extrusions observed around Lut block,respectively.
4. The subduction under Zagros apparently interrupts the LVZ, henceweakening and thinning the inferred NE-wardmantle flow, accordingto the notion of relative westerly directed net rotation of the litho-sphere (Panza et al., 2010).
5. The presence of at least two independent ophiolite belts in Iran sup-ports the presence of two separate ocean branches, which allowedthe initiation of two NE-directed subduction zones. The southwesternone is the most active and responsible for the present seismicity,whereas the northern one could be a result of an earlier Mesozoic–Early Cenozoic Cimmeride subduction. The two subduction zones arecoherent with the thicker and possibly doubled lithosphere in north-eastern and southwestern Iran respectively, with the intervening lith-osphere which underwent Mesozoic Tethyan rifting (Fig. 9).
Acknowledgments
We warmly thank Esmaeil Shabanian (IASBS) for his helpful andconstructive comments and discussion. We warmly thank the ob-servers and drivers who enthusiastically participated in the field-work. Special thanks to Daniel Rham (Cambridge University) forhis valuable help during the installation of the seismic stations. Weappreciate Habib Rahimi (University of Tehran) for supplying thedispersion curves. We thank Robert Herrmann who provided the re-ceiver function/surface wave inversion routine. We thank the editorand two anonymous reviewers for their constructive comments.First author has been financially supported by the Abdus Salam Inter-national Center for Theoretical Physics (ICTP) through bilateralIIEES-ICTP agreement during the 6 month visit of ICTP SAND group.This research is supported by the International Institute of Earth-quake Engineering and Seismology (IIEES) under research project5339 entitled: study of lateral velocity variation of the upper mantlein Northeast Iran continental collision zone. Seismic instrumentationfor the fieldwork described in this research was provided by SEISUKand Cambridge University. This research has benefited also from the
Please cite this article as: Motaghi, K., et al., The deep structure of the Iraj.gr.2014.04.009
partial support from the project 2010–2011, funded by Italian MIUR(Ministero dell'Istruzione, dell'Università e della Ricerca): “Subduc-tion and exhumation of continental lithosphere: implications onorogenic architecture, environment and climate”.
References
Afshar Harb, A., 1979. The stratigraphy, tectonics and petroleum geology of the KopetDagh region, northeastern Iran. (PhD thesis) Petroleum Geology Section, RoyalSchool of Mines, Imperial College of Science and Technology, London.
Alavi, M., 1992. Thrust tectonics of the Binalood region, NE Iran. Tectonics 11, 360–370.Alavi, M., 1996. Tectonostratigraphic synthesis and structural style of the Alborz mountain
system in northern Iran. Journal of Geodynamics 21, 1–33.Al-Damegh, K., Sandvol, E., Al-Lazki, A., Barazangi, M., 2004. Regional seismic wave prop-
agation (Lg and Sn) and Pn attenuation in the Arabian Plate and surrounding regions.Geophysical Journal International 157, 775–795. http://dx.doi.org/10.1111/j.1365-246X.2004.02246.x.
Alinaghi, A., Koulakov, I., Thybo, H., 2007. Seismic tomographic imaging of P- and S wavesvelocity perturbations in the upper mantle beneath Iran. Geophysical Journal Interna-tional 169, 1089–1102.
Al-Lazki, A., Seber, I.D., Sandvol, E., Turkelli, N., Mohamad, R., Barazangi, M., 2003. Tomo-graphic Pn velocity and anisotropy structure beneath the Anatolian plateau (easternTurkey) and the surrounding regions. Geophysical Research Letters 30 (24), 8043.
Al-Lazki, A.I., Sandvol, E., Seber, D., Barazangi, M., Turkelli, N., Mohamad, R., 2004. Pntomographic imaging of mantle lid velocity and anisotropy at the junction of theArabian, Eurasian and African plates. Geophysical Journal International 158, 1024–1040.
Allen, M., Armstrong, H., 2008. Arabia–Eurasia collision and the forcing of mid-Cenozoicglobal cooling. Palaeogeography, Palaeoclimatology, Palaeoecology 265, 52–58.
Amini, S., Shomali, Z.H., Koyi, H., Roberts, R.G., 2012. Tomographic upper-mantle velocitystructure beneath the Iranian Plateau. Tectonophysics 554–557, 42–49.
Ammon, C.J., Randall, G.E., Zandt, G., 1990. On the nonuniqueness of receiver function in-versions. Journal of Geophysical Research 95, 15303–15318.
Carminati, E., Giardina, F., Doglioni, C., 2002. Rheological control of subcrustal seismicityin the Apennines subduction (Italy). Geophysical Research Letters 29 (18), 1882.http://dx.doi.org/10.1029/2001GL014084.
Chen, W.P., Yang, Z., 2004. Earthquakes beneath the Himalayas and Tibet: evidence forstrong lithospheric mantle. Science 304 (5679), 1949–1952. http://dx.doi.org/10.1126/science.1097324.
Chiu, H.Y., Chung, S.L., Zarrinkoub, M.H., Mohammadi, S.S., Khatib, M.M., Iizuka, Y., 2013.Zircon U–Pb age constraints from Iran on the magmatic evolution related toNeotethyan subduction and Zagros orogeny. Lithos 162–163, 70–87.
Crespi, M., Cuffaro, M., Doglioni, C., Giannone, F., Riguzzi, F., 2007. Space geodesy valida-tion of the global lithospheric flow. Geophysical Journal International 168, 491–506.http://dx.doi.org/10.1111/j.1365-246X.2006.03226.x.
Cuffaro, M., Caputo, M., Doglioni, C., 2008. Plate sub-rotations. Tectonics 27, TC4007.http://dx.doi.org/10.1029/2007TC002182.
Doglioni, C., Carminati, E., Cuffaro, M., Scrocca, D., 2007. Subduction kinematics anddynamic constraints. Earth Science Reviews 83, 125–175. http://dx.doi.org/10.1016/j.earscirev.2007.04.001.
Engdahl, E.R., Jackson, J.A., Myers, S.C., Bergman, E.A., Priestley, K., 2006. Relocation andassessment of seismicity in the Iran region. Geophysical Journal International 167,761–778.
Foulger, G.R., Panza, G.F., Artemieva, I.M., Bastow, I.D., Cammarano, F., Evans, J.R., Hamilton,W.R., Julina, B.R., Lustrino, M., Thybo, H., Yanovskaya, T.B., 2013. Caveats on tomograph-ic images. Terra Nova 25, 259–281. http://dx.doi.org/10.1111/ter.12041.
Hatzfeld, D., Molnar, P., 2010. Comparisons of the kinematics and deep structures of theZagros and Himalaya and of the Iranian and Tibetan plateaus and geodynamic impli-cations. Reviews of Geophysics 48, RG2005.
Hatzfeld, D., Tatar, M., Priestley, K., Ghafor-Ashtiany, M., 2003. Seismological constraintson the crustal structure beneath the Zagros Mountain belt (Iran). Geophysical JournalInternational 155, 403–410.
Herrmann, R.B., Ammon, C.J., 2003. Computer Programs in Seismology, Version 3.20, Sur-faceWaves, Receiver Functions and Crustal structure. Department of Earth and Atmo-spheric Sciences, Saint Louis University, St Louis.
Hessami, K., Koyi, H., Talbot, C., Tabassi, H., Shabanian, E., 2001. Progressive unconfor-mities within an evolving foreland fold–thrust belt, Zagros Mountains. Journal ofthe Geological Society 158, 969–981.
Hessami, K., Jamali, F., Tabassi, H., 2003. Major Active Faults of Iran, Edition 2003. Interna-tional Institute of Earthquake Engineering and Seismology, Tehran.
Hollingsworth, J., Jackson, J., Walker, R., Gheitanchi, M.R., Bolourchi, M.J., 2006. Strike–slipfaulting, rotation and along-strike elongation in the Kopeh Dagh Mountains, NE Iran.Geophysical Journal International 166, 1161–1177.
Hwang, H.J., Mitchell, B.J., 1986. Inter-station surface wave analysis by frequency-domainWiener deconvolution and modal isolation. Bulletin of the Seismological Society ofAmerica 76, 847–864.
Julia, J., Ammon, C.J., Herrmann, R.B., Correig, A.M., 2000. Joint inversion of receiver func-tion and surface wave dispersion observations. Geophysical Journal International143, 1–19.
Kadinsky-Cade, K., Barazangi, M., Oliver, J., Isacks, B., 1981. Lateral variations in high-frequency seismic wave propagation at regional distances across the Turkish andIranian plateaus. Journal of Geophysical Research 86, 9377–9396.
Kaviani, A., Paul, A., Bourova, E., Hatzfeld, D., Pedersen, H., Mokhtari, M., 2007. A strongseismic velocity contrast in the shallow mantle across the Zagros collision zone(Iran). Geophysical Journal International 171, 399–410.
nian Plateau, Gondwana Research (2014), http://dx.doi.org/10.1016/

12 K. Motaghi et al. / Gondwana Research xxx (2014) xxx–xxx
Levshin, A.L., Pisarenko, V.F., Pogrebinsky, G.A., 1972. On a frequency time analysis ofoscillations. Annales Geophysicae 28, 211–218.
Levshin, A.L., Ratnikova, L., Berger, J., 1992. Peculiarities of surface wave propagationacross Central Eurasia. Bulletin of the Seismological Society of America 82,2464–2493.
Ligorria, J.P., Ammon, C.J., 1999. Iterative deconvolution and receiver-function estimation.Bulletin of the Seismological Society of America 89 (5), 1395–1400.
Ludwig, W.J., Nafe, J.E., Drake, C.L., 1970. Seismic Refraction. Wiley InterScience, New York.Lyberis, N., Manby, G., 1999. Oblique to orthogonal convergence across the Turan block in
the post-Miocene. American Association of Petroleum Geologists Bulletin 83 (7),1135–1160.
Maggi, A., Priestley, K., 2005. Surface waveform tomography of the Turkish Iranianplateau. Geophysical Journal International 160, 1068–1080.
Maggi, M., Jackson, J., McKenzie, D., Priestley, K., 2000. Earthquake focal depths, effectiveelastic thickness, and the strength of the continental lithosphere. Geology 28 (6),495–498.
Mazhari, S.A., Safari, M., 2013. High-K calc-alkaline plutonism in Zouzan, NE of Lut block,Eastern Iran: an evidence for arc related magmatism in Cenozoic. Journal of the Geo-logical Society of India 81 (5), 698–708.
Menke, W., 1989. Geophysical Data Analysis: Discrete Inverse Theory. Academic Press,Inc., New York.
Mitchell, B.J., 1995. Anelastic structure and evolution of the continents from seismic sur-face wave attenuation. Reviews of Geophysics 33, 441–462.
Mohammadi, E., Sodoudi, F., Kind, R., Rezapour, M., 2013. Presence of a layered litho-sphere beneath the Zagros collision zone. Tectonophysics 608, 366–375.
Mohammadi, N., Sodoudi, F., Mohammadi, E., Sadidkhouy, A., 2013. New constraints onlithospheric thickness of the Iranian plateau using converted waves. Journal of Seis-mology 17 (3), 883–895.
Molnar, P., Oliver, J., 1969. Lateral variations of attenuation in the uppermost mantleand discontinuities in the lithosphere. Journal of Geophysical Research 74,2648–2683.
Motaghi, K., Tatar, M., Priestley, K., 2012a. Crustal thickness variation across the northeastIran continental collision zone from teleseismic convertedwaves. Journal of Seismology16, 253–260.
Motaghi, K., Tatar, M., Shomali, Z.H., Kaviani, A., Priestley, K., 2012b. High resolution imageof uppermost mantle beneath NE Iran continental collision zone. Physics of the Earthand Planetary Interiors 208–209, 38–49.
Mouthereau, F., Lacombe, O., Vergés, J., 2012. Building the Zagros collisional orogen:timing, strain distribution and the dynamics of Arabia/Eurasia plate convergence.Tectonophysics 532–535, 27–60.
Müller, S., Panza, G.F., 1986. In: Wezel, F.C. (Ed.), Evidence of a Deep-reaching Lithospher-ic Root Under the Alpine Arc. The Origin of Arcs, vol. 21. Elsevier, pp. 93–113.
Pang, K.N., Chung, S.L., Zarrinkoub, M.H., Mohammadi, S.S., Yang, H.M., Chu, C.H., Lo, C.H.,2012. Age, geochemical characteristics and petrogenesis of Late Cenozoic intraplatealkali basalts in the Lut–Sistan region, eastern Iran. Chemical Geology 306, 40–53.
Panza, G.F., 1981. The resolving power of seismic surface waves with respect to crust andupper mantle structural models. In: Cassinis, R. (Ed.), The Solution of the InverseProblem in Geophysical Interpretation. Plenum Publishing Corporation, pp. 39–77.
Panza, G.F., Müller, S., 1978. The plate boundary between Eurasia and Africa in the AlpineArea. Memorie di Scienze Geologiche (Padova) 33, 43–50.
Panza, G.F., Müller, S., Calcagnile, G., Knopoff, L., 1982. Delineation of the north centralItalian upper mantle anomaly. Nature 296, 238–239.
Panza, G.F., Doglioni, C., Levshin, A., 2010. Asymmetric ocean basins. Geology 38 (1),59–62.
Paul, A., Kaviani, A., Hatzfeld, D., Vergne, J., Mokhtari, M., 2006. Seismological evidence forcrustal-scale thrusting in the Zagros mountain belt (Iran). Geophysical Journal Inter-national 166, 227–237.
Please cite this article as: Motaghi, K., et al., The deep structure of the Iraj.gr.2014.04.009
Paul, A., Kaviani, A., Hatzfeld, D., Tatar, M., Pequegnat, C., 2010. Seismic imaging of the lith-ospheric structure of the Zagros mountain belt (Iran). In: Leturmy, P., Robin, C. (Eds.),Tectonic and Stratigraphic Evolution of Zagros and Makran During the Meso-Cenozoic. Geological Society, London, Special Publications, 330, pp. 5–18.
Priestley, K., McKenzie, D., 2006. The thermal structure of the lithosphere from shearwave velocities. Earth and Planetary Science Letters 244, 285–301.
Priestley, K., McKenzie, D., Barron, J., Tatar, M., Debayle, E., 2012. The Zagros core: defor-mation of the continental lithospheric mantle. Geochemistry, Geophysics,Geosystems 13, Q11014.
Rahimi, H., Hamzehloo, H., Vaccari, F., Panza, G.F., 2014. Shear-wave velocity tomographyof the lithosphere–asthenosphere system beneath the Iranian Plateau. Bulletin of theSeismological Society of America (under review).
Ries, J.C., Bettadpur, S., Poole, S., Richter, T., 2011. Mean background gravity fields for GRACEprocessing. Presented at the GRACE Science Team Meeting, Austin, TX, August 8–10.
Sandvol, E., Al-Damegh, K., Calvert, A., Seber, D., Barazangi, M., Mohamad, R., Gok, R.,Turkelli, N., Gurbuz, C., 2001. Tomographic imaging of Lg and Sn propagation in theMiddle East. Pure and Applied Geophysics 158, 1121–1163.
Sengor, A.M.C., Natalin, B.A., 1996. Paleotectonics of Asia: fragments of a synthesis. In: Yin,A., Harrison, M. (Eds.), The Tectonic Evolution of Asia, pp. 486–641.
Shabanian, E., Siame, L., Bellier, O., Benedetti, L., Abbassi, M.R., 2009. Quaternary slip ratesalong the northeastern boundary of the Arabia–Eurasia collision zone (Kopeh DaghMountains, Northeast Iran). Geophysical Journal International 178, 1055–1077.
Shad Manaman, N., Shomali, H., Koyi, H., 2011. New constraints on upper-mantle S-velocitystructure and crustal thickness of the Iranian plateau using partitionedwaveform inver-sion. Geophysical Journal International 184, 247–267.
Shomali, Z.H., Keshvari, F., Hassanzadeh, J., Mirzaei, N., 2011. Lithospheric structure be-neath the Zagros collision zone resolved by non-linear teleseismic tomography. Geo-physical Journal International 187, 394–406.
Stöcklin, J., 1968. Structural history and tectonics of Iran: a review. American Associationof Petroleum Geologists Bulletin 52 (7), 1229–1258.
Stöcklin, J., 1974. Possible ancient continental margins in Iran. In: Burke, C.A., Drake, C.L.(Eds.), The Geology of Continental Margins. Springer, New York, pp. 873–887.
Stoneley, R., 1981. The geology of the Kuh-e-Dalneshin area of southern Iran, and its bear-ings on the evolution of southern Thetys. Journal of the Geological Society, London138, 509–526.
Tatar, M., Hatzfeld, D., Martinod, J., Walpersdorf, A., Ghafori-Ashtiany, M., Chéry, J., 2002.The present-day deformation of the central Zagros from GPS measurements. Geo-physical Research Letters 29 (19), 1927.
Tatar, M., Hatzfeld, D., Ghafori-Ashtiany, M., 2004. Tectonics of the Central Zagros (Iran)deduced from microearthquake seismicity. Geophysical Journal International 156,255–266.
Turkelli, N., et al., 2003. Seismogenic zones in eastern Turkey. Geophysical Research Let-ters 30 (24), 8039.
Urban, L., Cichowicz, A., Vaccari, F., 1993. Computation of analytical partial derivatives ofphase and group velocities for Rayleigh waves with respect to structural parameters.Studia Geophysica et Geodaetica 37, 14–36.
Vernant, Ph., Nilforoushan, F., Hatzfeld, D., Abbassi, M.R., Vigny, C., Masson, F., Nankali, H.,Martinod, J., Ashtiani, A., Bayer, R., Tavakoli, F., Chéry, J., 2004. Present-day crustal de-formation and plate kinematics in the Middle East constrained by GPSmeasurementsin Iran and northern Oman. Geophysical Journal International 157, 381–398.
Walker, R., Gans, P., Allan, M., Jackson, J., Khatib, M., Saunders, A., Zarrinkoub, M., 2009.Late Cenozoic volcanism and rates of active faulting in eastern Iran. Geophysical Jour-nal International 177, 783–805.
Yanovskaya, T.B., Ditmar, P.G., 1990. Smoothness criteria in surface-wave tomography.Geophysical Journal International 102, 63–72.
Zhu, L.P., Kanamori, H., 2000. Moho depth variation in southern California fromteleseismic receiver functions. Journal of Geophysical Research 105, 2969–2980.
nian Plateau, Gondwana Research (2014), http://dx.doi.org/10.1016/