Autotrophic microbe metagenomes and metabolic pathways differentiate adjacent Red Sea brine pools
Upload
nationalagriculturalresearchinraCategory
view
1download
0
Water Science and Technology
New urban wastewater treatment with Autotrophic Membrane Bioreactor (AutoMBR) atlow COD/N substrate ratio
--Manuscript Draft--
Manuscript Number: WST-EM131121R1
Full Title: New urban wastewater treatment with Autotrophic Membrane Bioreactor (AutoMBR) atlow COD/N substrate ratio
Article Type: Research Paper (Editorial Office Upload)
Keywords: autotrophic membrane bioreactor; COD/N ratio; nitrogen removal; energy demand;activated sludge population dynamics
Corresponding Author: Marc Heran, A.Pr.European membrane instituteMontpellier, FRANCE
Corresponding Author SecondaryInformation:
Corresponding Author's Institution: European membrane institute
Corresponding Author's SecondaryInstitution:
First Author: Y. Yang
First Author Secondary Information:
Order of Authors: Y. Yang
G. Lesage
M. Barret
N. Bernet
A. Grasmick
J. Hamelin
Marc Heran, A.Pr.
Order of Authors Secondary Information:
Manuscript Region of Origin: FRANCE
Abstract: The potential for total nitrogen removal from municipal wastewater has been evaluatedin an autotrophic membrane bioreactor (AutoMBR) running with low COD/N ratio tosimulate its combination with an upstream physicochemical process retaining a largepart of organic matter. The tests were conducted in a lab-scale submerged membranebioreactor loaded with a synthetic influent. Nitrogen loading rate was 0.16 kgN-NH4+.m-3.d-1 and sodium acetate was added as carbon source. Results have shownthat nitrogen elimination could reach 85% for a COD/N ratio of 5, with a COD removalexceeding 97%. However, a COD/N ratio of 3.5 was found to be the limiting factor toreach successfully the overall target value of 10 mgN.L-1 in the effluent. Nevertheless,low COD/N ratios permit to work with low total suspended solids (TSS) concentrationsin the bioreactor, which greatly facilitates the membrane fouling control by simpleaeration and backwashing strategy.
Powered by Editorial Manager® and ProduXion Manager® from Aries Systems Corporation

New urban wastewater treatment with Autotrophic Membrane Bioreactor (AutoMBR)
at low COD/N substrate ratio
Y. Yang*, G. Lesage*, M. Barret**, N. Bernet**, A. Grasmick*, J. Hamelin**, M. Héran*
*Institut Européen des Membranes, CNRS, UMR 5635, Université Montpellier II,
Montpellier, France. Corresponding author : [email protected]. **
INRA, UR0050, Laboratoire de Biotechnologie de l’Environnement, Avenue des Etangs,
Narbonne, F-11100, France.
Abstract
The potential for total nitrogen removal from municipal wastewater has been evaluated
in a autotrophic membrane bioreactor (AutoMBR) running with low COD/N ratio to simulate
its combination with an upstream physicochemical process retaining a large part of organic
matter. The tests were conducted in a lab-scale submerged membrane bioreactor loaded with a
synthetic influent. Nitrogen loading rate was 0.16 kgN-NH4+.m-3
.d-1
and sodium acetate was
added as carbon source. Results have shown that nitrogen elimination could reach 85% for a
COD/N ratio of 5, with a COD removal exceeding 97%. However, the COD/N ratio of 3.5 is
the limiting factor to reach successfully the overall target value of 10 mgN.L-1
in the effluent.
Nevertheless, low COD/N ratios permit to work with low total suspended solids (TSS)
concentrations in the bioreactor, which greatly facilitates the membrane fouling control by
simple aeration and backwashing strategy. An efficient separation step has been maintained
for 180 days with only two membranes chemical cleaning. These results and ASM modeling
development will permit to define the optimal AutoMBR operating conditions for which
carbon and nitrogen removal would be sustainable and efficient.
Keywords: SRT; population dynamics; nitrogen removal; membrane bioreactor, energy
demand, fouling.
1. Introduction
The demographic growth and the climate change are expected to adversely increase the
global water stress in the next ten years. Thus, the world challenge is no longer how to acquire
new water resource, but rather how to manage efficiently the available water resource. Global
assessments by the World Health Organization and UNICEF show that over 80% of used
water worldwide is not collected or treated (Corcoran et al., 2010). Moreover, the increase of
environmental and public health concerns has also led to more stringent wastewater
regulations, which has impelled more efforts to achieve better effluent quality especially with
regard to nitrogen (Henze et al., 2008). Thus, there is an increasing need to use reliable,
efficient and sustainable technologies to treat wastewaters; to obtain treated water quality for
reuse and to drastically reduce energy consumption or eventually produce sustainable energy.
Sewage treatment processes are defined today to remove organic, particulate and dissolved
fractions and in more sensitive areas: nitrogen and phosphorus compounds. Recent studies
have shown the possibility of intensifying the conventional activated sludge based processes
by replacing the settling phase separation with a selective membrane barrier which gave rise
to membrane bioreactors: MBR (Grasmick et al., 2007). It is well known that MBR are one of
the most promising technology to treat wastewater but necessitate important energy
requirements due to (i) the biological operating conditions (high biomass concentration and
ManuscriptClick here to download Manuscript: 289 -Full paper.docx
1 2 3 4 5 6 7 8 9 10 11 12 13 14 15 16 17 18 19 20 21 22 23 24 25 26 27 28 29 30 31 32 33 34 35 36 37 38 39 40 41 42 43 44 45 46 47 48 49 50 51 52 53 54 55 56 57 58 59 60 61 62 63 64 65

low oxygen transfer inside the bioreactors) and (ii) the necessity of additional aeration to
control membrane fouling (Lebègue et al., 2009; Kraume and Drews, 2010). The energy
consumption in submerged MBR is in the range of 0.6 to 1 kWh.m-3
of treated water in place
of 0.3 to 0.4 kWh.m-3
for conventional activated sludge. The oxygen supply represents 50 to
60% of the total energy requirement of the global wastewater plant, including oxygen for
bioreactions (40 to 50%) and air membrane to control reversible fouling (Kraume and
Bracklow, 2003; Krause and Cornell, 2007).
MBR development could be strategic to favor wastewater reuse in future and thus protect
fresh water resources. The new concept developed here is based on relevant positive-energy
wastewater treatment plant providing high-quality use of treated water while reducing the
whole plant footprint and the energetic cost of operation. This novelty configuration is
composed (i) on the water line, by the association of a physico-chemical treatment (to remove
and concentrate organic carbon in primary sludge) and an Autotrophic Membrane Bioreactor
(AutoMBR to remove nitrogen, residual soluble organic matter and germs) and (ii) on the
sludge line, by sludge digestion (to recover methane and energy) associated with a
conventional sludge dewatering. Thus, AutoMBR receives an influent with a very small
residual organic carbon concentration, but still all the nitrogen fraction. The low organic
carbon load is very favorable to the nitrification stage (as nitrification is carried out by
autotrophic bacteria) but may become an obstacle for a full denitrification and impact the total
nitrogen removal of treated water (Sun et al., 2010). The concentration of total nitrogen in
effluent should generally not exceed 10 mgN.L-1
, which correspond to an elimination of 80 to
90% of the nitrogen present in raw water (Deronzier et al., 2001).
The interest of such a proposal is double: (i) only nitrogen compounds and a portion of the
soluble organic matter enter into the AutoMBR which permit to favor the development of a
mixed culture rich in autotrophic populations (Li et al., 2006) and reduce the energy
requirement (twice lower for reactions because only ammonium has to be oxidized and twice
lower for air membrane supply because of higher filterability of such autotrophic
suspensions), and (ii) recovering a large production of settled primary organic matter able to
generate more energy by anaerobic digestion: the fresh sludge has a capacity to produce
methane twice higher than sludge coming from conventional activated sludge process where
sludge stabilization is more advanced. Then because the oxygen requirement can be twice
lower in AutoMBR and the methane production from primary sludge twice higher, the global
system can present a positive aspect in terms of energy balance.
Our research on the AutoMBR is focused on the identification of (i) the boundaries of the
denitrification step at low COD/N ratios, (ii) the biological kinetics and treatment
performances, (iii) the oxygen requirements (which must be greatly reduced by the lack of
organic material to oxidize and therefore the demand for air power), (iv) and the potential
gain of suspensions filterability by reducing heterotrophic populations growth due to low
organic carbon concentration (Mengchun et al., 2004).
2. Material and Methods
2.1. Membrane bioreactor operation
The experimental setup was based on two lab-scale bioreactors with identical volume of
30 L connected in series. One worked in anoxic conditions and mixed liquor was recycled
between the two vessels through a volumetric pump with a recirculation rate (R) set at 400%
of the input flow. The second tank was aerated and equipped with submerged flat sheet
membranes with a pore size of 0.04 µm and a surface area of 0.34 m2 (Microdyn-Nadir,
Germany). Air diffusers were set below the membrane modules; the aeration not only
1 2 3 4 5 6 7 8 9 10 11 12 13 14 15 16 17 18 19 20 21 22 23 24 25 26 27 28 29 30 31 32 33 34 35 36 37 38 39 40 41 42 43 44 45 46 47 48 49 50 51 52 53 54 55 56 57 58 59 60 61 62 63 64 65

supplied oxygen to microorganisms, but also produced hydraulic shearing forces on the
membrane surface to delay membrane fouling. The filtration was carried out by a volumetric
pump, creating a depression between the membranes and the pump. The transmembrane
pressure (PTM in kPa) was defined by the difference between the atmospheric pressure and
the permeate pressure which is measured on the membrane downstream side.
The Autotrophic submerged Membrane Bioreactor (AutoMBR) was fed with a synthetic
substrate containing 70 mgNH4+-N.L-1
in tap water, which is representative of urban
wastewater. Acetate at different concentrations (from 245 to 560 mgCOD.L-1
) was added in the
AutoMBR influent to simulate different performances of the primary treatment upstream the
AutoMBR. Thus, the influence of COD/N ratio was studied for successive values of 8, 5 and
3.5, which correspond to lower values compared to a conventional influent ranging from 9 to
12 (Grasmick et al., 2007). The bioreactor was inoculated with seed sludge taken from a
sewage treatment plant working under low mass loading to remove nitrogen compounds.
Experiments were performed during 180 days with various sludge retention time (SRT),
hydraulic retention time (HRT) and influent concentrations as detailed in table 1.
During the acclimatization period of 15 days, the AutoMBR was operated in batch mode,
without sludge purging and with a COD/N ratio of 8 in the influent. Thereafter, the HRT
varied from 12.6 to 25.2 hours and the SRT ranged from 20 to 40 days (with a 9-day period
without sludge purge in phase 4). The AutoMBR was operated at room temperature and the
aerobic tank pH was regulated at 7.5 ± 0.5. The permeate flux was fixed with a pump
controlled by a timer. Membrane fouling was controlled by air diffusion and specific filtration
strategy. The 10-min operational cycle included 8.75 min of suction with a flow rate of 5.75
L.h-1
, 0.5 min break and 0.75 min of reverse-washing with a 3 L.h-1
flow rate. Thus, the
specific instant filtration rate was 17 LMH (L.h-1
.m-2
) and the average effective rate was close
to 14 LMH. A storage tank was added on the effluent line in order to provide a clean water
reserve for backwashing.
Table 1. Operating parameters of the AutoMBR during the 180 days of operation.
Phase 1
D0-D15 Starting phase
Phase 2
D16-D22
MBR
Phase 3
D23-D75
MBR
Phase 4
D76-D85
Batch
Phase 5
D86-D105
Reducing of
flow
Phase 6
D106-D108
Recovery of
flow
Phase 7
D109-D180
MBR
SRT (d) No extraction 20 40 No extraction 40 40 40
HRT (h) 12,6 12,6 12,6 No filtration 25,2 25,2-12,6 12,6
JW (L.h-1.m-2) 14 14 14 -- 7 714 14
OLP (kgCOD.m-3.j-1) 1,27 0,81 0,81 0 0,28 0,56 0,56
NLR (kgN. m-3.j-1) 0,16 0,16 0,16 0,03 0,08 0,16 0,16
COD/N 8 5 5 0 3,5 3,5 3,5
2.2. Modelling
The Activated Sludge Model 1 (ASM 1) published by the IWA task Group on
Mathematical Modelling for Design and Operation of Biological Wastewater Treatment is the
most widely recognized tool for aerobic biological wastewater treatment modeling and has
been used to simulate these operations (Henze et al., 2008). All the simulations were
performed with GPSX® software (Hydromantis, Canada). The bioreactor was assimilated to a
perfectly stirred reactor. ASM1 model was used with default kinetic parameters at 20°C.
Membrane separation was considered as a perfect particles separator with a negligible
volume.
2.3. Analytical methods
1 2 3 4 5 6 7 8 9 10 11 12 13 14 15 16 17 18 19 20 21 22 23 24 25 26 27 28 29 30 31 32 33 34 35 36 37 38 39 40 41 42 43 44 45 46 47 48 49 50 51 52 53 54 55 56 57 58 59 60 61 62 63 64 65

Approximately once a week, sludge samples were taken to analyze the suspended solids.
The concentration of Mixed Liquor Suspended Solids (MLSS) and Mixed Liquor Volatile
Suspended Solids (MLVSS) were measured using standard methods AFNOR NFT 90-105
and 90-029. The Chemical Oxygen Demand (COD) in the two reaction vessels and effluent
were regularly measured using standard methods AFNOR NFT 90-101.
Samples were taken from each tank to measure the NH4+-N, NO2
--N and NO3
--N
concentrations with spectrophotometric analysis on a HACH 2500 (Method salicylate by
Amver 26069-45 Test N'Tube ™ and cadmium reduction method by NitraVer ® 5 tests,
Hach, Loveland, CO, USA). In addition, a Varion®Plus 700 IQ probe was used to
continuously measure pH, temperature, ammonium and nitrate concentrations in the mixed
liquor (Wissenschaftlich-Technische Werkstätten GmbH, Germany). The suspension was also
characterized through conventional size measuring, soluble microbial products (proteins and
polysaccharides in solution) and settle ability index.
Total genomic DNA extraction from the AutoMBR samples was carried out following the
method detailed in Godon et al. (1997). The DNA extracts were purified with QIAamp DNA
Mini Kit (Qiagen). Fingerprints of bacterial communities were generated by Capillary
electrophoresis-single strand conformation polymorphism (CE-SSCP) (Zumstein et al., 2000).
The StatFingerprints library from R (Michelland et al., 2009) was used to analyze CE-SSCP
profiles. The fingerprints were first aligned with the internal standard ROX and the sum of the
peak areas were normalized to unit. The complexity of the bacterial community was estimated
using the Simpson’s diversity index, by considering the number of species (number of peaks)
as well as their relative abundance (area under each peak).
3. Results and Discussion
3.1. Suspended solids
Figure 1. MLSS and MLVSS concentrations (g.L
-1) for different organic and nitrogen loading
rate: experimental data (symbols) and modeling results (dotted line) during the 180 days of
AutoMBR operation.
1 2 3 4 5 6 7 8 9 10 11 12 13 14 15 16 17 18 19 20 21 22 23 24 25 26 27 28 29 30 31 32 33 34 35 36 37 38 39 40 41 42 43 44 45 46 47 48 49 50 51 52 53 54 55 56 57 58 59 60 61 62 63 64 65

The figure 1 shows the evolutions of MLSS and MLVSS from September 2012 to March
2013. During stationary phases, experimental results were confirmed by ASM modeling (the
dotted line represents the steady state results of simulation).
It has to be remarked that due to a slowdown in the nitrifying activity observed during
phase 3, the reactor was operated as a batch reactor during phase 4. To enhance the activity of
Nitrobacter, only nitrite was used as nitrogen load during this phase.
The MLSS and MLVSS monitoring allowed the quantification of some apparent kinetic
constants of cell growth (Table 2) like the biomass growth rate: rX (g.L-1
.d-1
), the apparent
growth rate of biomass: μapp (d-1
) and the apparent conversion rate: Yobs (kgMLVSS.kgCOD-1
).The
experimental data clearly show a higher growth dynamics during the transient period and μapp
and Yobs do not seem to depend on the COD/N ratio.
Table 2.Values of growth rate and conversion rate.
rx (g.L-1
.d-1
) app (d-1
) Yobs (kgMLVSS.kgCOD-1
) References
Yobs (kgMLVSS.kgCOD-1
)
Phase 2 - transient 0.16 0.042 0.2
Phase 3 - permanent 0.111 0.025 0.138 0.189 (Canziani et al., 2006)
Phase 7 - transient 0.146 0.043 0.26
Phase 7 - permanent 0.082 0.025 0.145 0,12 (Pollice et al., 2004)
3.2. Nitrogen removal
Experimental and modeling results are listed in table 3 for phase 3 and phase 7. During
these two phases, the NH4+-N concentration in influent was imposed at 70 mg.L
-1. During
phase 3, the experimental result of NH4+-N and NOx-N concentrations for anoxic and aerated
tanks are similar to those of modeling. During phase 7, experimental results of NH4+-N
concentration for the two tanks are slightly greater than values expected by modeling. In
opposite, there is a significant difference between result of experience and modeling for NOx-
N, this difference can be explained by the type of NOx-N ions. In fact, the model shows that
if the COD load is not sufficient in anoxic tank, a complete denitrification cannot be
achieved. But in our experiment, due to a pH relatively high in anoxic tank, a part of NH4+-N
can be transformed in NH3-N, which is an inhibitor for nitrifying Nitrobacter populations
(Yoo et al., 1999). As a result, the total oxidation of NH4+-N to NO3
--N can not be achieved
in aerated tank leading to the accumulation of NO2--N compounds. Besides, even with low
COD/N ratio, the denitrification can be obtained in anoxic tank. Indeed the shortcut nitrogen
removal which is the reduction of NO2--N to N2 instead of NO3
--N to N2 allows a potential
saving of 33% of the COD required (Ruiz et al., 2006).
Table 3. Experimental and modeling data for NH4+-N and NOx-N concentrations.
Phase COD/N N-NH4 Anox
(mg.L-1)
N-NH4 Aero
(mg.L-1)
N-NOx Anox
(mg.L-1)
N-NOx Aero
(mg.L-1) Experiment Modelling Experiment Modelling Experiment Modelling Experiment Modelling
3 5 14.9 14.8 0.5 0.2 0.3 0.3 11.8 15.8
7 3.5 18.5 15.3 0.6 0.2 0.5 11.7 12.5 27.6
3.3. Fouling dynamics
The dynamics of membrane fouling was quantified through the evolution of the trans-
membrane pressure. During 180 days of operation only two chemical cleaning were operated.
Conversely, when the biological process was stabilized (phase 3), the TMP increased slowly
1 2 3 4 5 6 7 8 9 10 11 12 13 14 15 16 17 18 19 20 21 22 23 24 25 26 27 28 29 30 31 32 33 34 35 36 37 38 39 40 41 42 43 44 45 46 47 48 49 50 51 52 53 54 55 56 57 58 59 60 61 62 63 64 65
and did not exceed 0.15 kPa.d-1
which meant a daily variation of the total hydraulic resistance
closed to 0.03 m-1
.d-1
. The evolution of TMP was very low except in specific conditions:
Phase acclimatization to new conditions (phases 1 and 2).
Abrupt change of filtration conditions (the permeate flux was doubled at the
beginning of phase 6).
Significant difference between the values of COD in the supernatant and permeate.
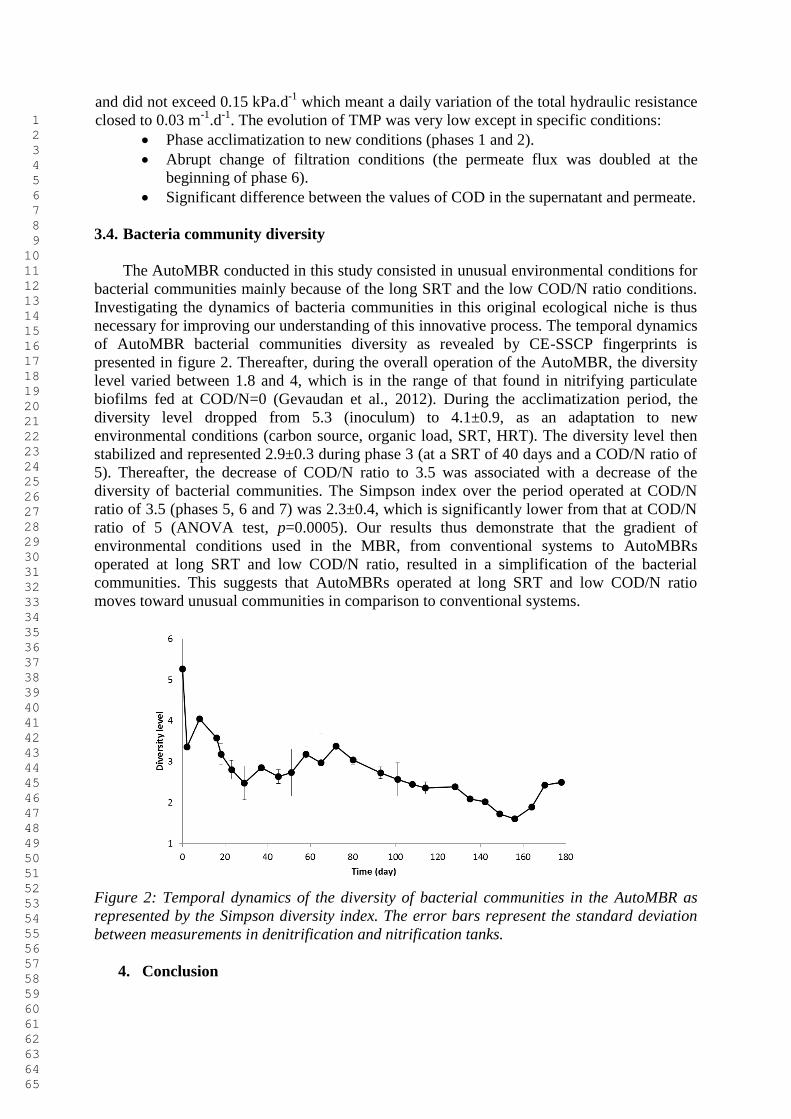
3.4. Bacteria community diversity
The AutoMBR conducted in this study consisted in unusual environmental conditions for
bacterial communities mainly because of the long SRT and the low COD/N ratio conditions.
Investigating the dynamics of bacteria communities in this original ecological niche is thus
necessary for improving our understanding of this innovative process. The temporal dynamics
of AutoMBR bacterial communities diversity as revealed by CE-SSCP fingerprints is
presented in figure 2. Thereafter, during the overall operation of the AutoMBR, the diversity
level varied between 1.8 and 4, which is in the range of that found in nitrifying particulate
biofilms fed at COD/N=0 (Gevaudan et al., 2012). During the acclimatization period, the
diversity level dropped from 5.3 (inoculum) to 4.1±0.9, as an adaptation to new
environmental conditions (carbon source, organic load, SRT, HRT). The diversity level then
stabilized and represented 2.9±0.3 during phase 3 (at a SRT of 40 days and a COD/N ratio of
5). Thereafter, the decrease of COD/N ratio to 3.5 was associated with a decrease of the
diversity of bacterial communities. The Simpson index over the period operated at COD/N
ratio of 3.5 (phases 5, 6 and 7) was 2.3±0.4, which is significantly lower from that at COD/N
ratio of 5 (ANOVA test, p=0.0005). Our results thus demonstrate that the gradient of
environmental conditions used in the MBR, from conventional systems to AutoMBRs
operated at long SRT and low COD/N ratio, resulted in a simplification of the bacterial
communities. This suggests that AutoMBRs operated at long SRT and low COD/N ratio
moves toward unusual communities in comparison to conventional systems.
Figure 2: Temporal dynamics of the diversity of bacterial communities in the AutoMBR as
represented by the Simpson diversity index. The error bars represent the standard deviation
between measurements in denitrification and nitrification tanks.
4. Conclusion
1 2 3 4 5 6 7 8 9 10 11 12 13 14 15 16 17 18 19 20 21 22 23 24 25 26 27 28 29 30 31 32 33 34 35 36 37 38 39 40 41 42 43 44 45 46 47 48 49 50 51 52 53 54 55 56 57 58 59 60 61 62 63 64 65

The experimental results have shown the possibility to achieve high removal efficiencies
of nitrogen compounds even with low COD/N ratio. The AutoMBR unit ensures well known
treatment performances for TSS and COD removal, 100% and more than 95% respectively.
For total nitrogen, 85% of removal has been obtained with a COD/N of 5, and this value was
confirmed by ASM1 modeling. When the COD/N ratio decreased to 3.5, the experimental
performance of total nitrogen removal was reduced to 82%. However, this result was higher
than the value simulated with ASM1. This difference was probably due to a partial
nitrification in the aerated tank limiting the Nitrobacter development. This possible shortcut
nitrogen removal has to be implemented in the ASM1 model to predict correctly the nitrogen
removal in these conditions.
5. Acknowledgements
This work is financially supported by the National French Agency (Ecotech Program
2010, CreativERU Project, ANR-10-ECOT-003-02) and TRIMATEC competitiveness
cluster.
6. References
APHA, 1995. Standard methods, 19th editi. ed. American public Health Association,
Washington, DC.
Canziani R., Valeria E., Massimiliano G., Francesca M., Eleonora P. and Gianluigi B. 2006
Effect of oxygen concentration on biological nitrification and microbial kinetics in a cross-
flow membrane bioreactor (MBR) and moving-bed biofilm reactor (MBBR) treating old
landfill leachate. Journal of Membrane Science, 286 (1-2), 202-212.
Corcoran E., Nellemann C., Baker E., Bos R., Osborn D. and Savelli H. 2010 Sick Water?
The Central Role of Wastewater Management in Sustainable Development. A Rapid Response
Assessment. The Hague, UN-Habitat/UNEP/GRID-Arendal.
Deronzier G., Schétrite S. and Racault Y. 2001 Traitement de l'azote dans les stations
d'épuration biologique des petites collectivités (Nitroge removal in small biological based
wastewater treatment plant). Ministère de l’agriculture et de la pêche, Cemagref, Document
technique, FNDAE n°25.
Gevaudan G., Hamelin J., Dabert P., Godon J.-J., Bernet N. 2012 Homogeneity and
Synchronous Dynamics of Microbial Communities in Particulate Biofilms: from Major
Populations to Minor Groups. Microbes Environment 27, 142–148.
Godon, J., Zumstein, E., Dabert, P., Habouzit, F., Moletta, R. 1997 Molecular microbial
diversity of an anaerobic digestor as determined by small-subunit rDNA sequence analysis.
Applied & Environmental Microbiology 63, 2802–2813.
Grasmick A., Cabassud C., Spérandio M. and Wisniewski C. 2007 Bioréacteurs à membranes
(BAM) et traitement des eaux usées (Membrane bioreactor and wastewater treatment).
Techniques de l’Ingénieur, W4 140, 1-16.
Henze M., Van Loosdrecht M.C.M., Ekama G.A., and Brdjanovic D. 2008 Biological
Wastewater Treatment: Principles, Modelling and Design. London: IWA Publishing, 112-139.
1 2 3 4 5 6 7 8 9 10 11 12 13 14 15 16 17 18 19 20 21 22 23 24 25 26 27 28 29 30 31 32 33 34 35 36 37 38 39 40 41 42 43 44 45 46 47 48 49 50 51 52 53 54 55 56 57 58 59 60 61 62 63 64 65

Li H., Yang M., Zhang Y., Yu T., Kamagata Y. 2006 Nitrification performance and microbial
community dynamics in a submerged membrane bioreactor with complete sludge retention.
Journal of Biotechnology, 123 (1), 60–70.
Kraume M. and Bracklow U. 2002 Membrane technology in the municipal waste water
treatment operating experience and design rules in Germany. Desalination, 146(1-3), 445-
449.
Kraume M. and Drews A. 2010 Membrane Bioreactors in Waste Water Treatment - Status
and Trends. Chemical Engineering and Technology, 33, 1251–1259.
Krause S. and Cornel P. 2007 Membrane Bioreactor’s Energy Demand in Wastewater
Treatment. 4th IWA Conference on membranes for water and wastewater treatment, 15-17
May 2007 Harrogate (United Kingdom).
Lebègue J., Héran M., Grasmick A. 2009 Membrane air flow rates and HF sludging
phenomenon in SMBR. Desalination, 236(1-3), 135-142.
Liu, H., Yang, F., Shi, S., and Liu, X. 2010 Effect of substrate COD/N ratio on performance
and microbial community structure of a membrane aerated biofilm reactor. Environmental
Science and Technolog, 22(4), 540–546.
Mengchun G., Min Y., Hongyan L., Yanming W. and Feng F. 2004 Nitrification and sludge
characteristics in a submerged membrane bioreactor on synthetic inorganic wastewater.
Desalination, 170: 177-185.
Michelland R.J., Dejean S., Combes S., Fortun-Lamothe L., Cauquil L. 2009 StatFingerprints:
a friendly graphical interface program for processing and analysis of microbial fingerprint
profiles. Molecular ecology resources, 9, 1359–63.
Pollice A., Laera G. and Blonda M. 2004 Biomass growth and activity in a membrane
bioreactor with complete sludge retention. Water Research, 38, 1799-1808.
Ruiz G., Jeison D., Rubilar O., Ciudad G. and Chamy R. 2006 Nitrification–denitrification via
nitrite accumulation for nitrogen removal from wastewaters. Bioresource Technology, 97,
330-350.
Sun S., Nacher C., Merkey B., Zhou Q., Xia S., Yang D., Sun J. and Smets B. 2010 Effective
biological nitrogen removal treatment processes for domestic wastewaters with low C/N ratios:
a review. Environ. Eng. Sci., 27, 111–126.
Yoo K., Ahn K.H., Lee H.J., Lee K.H., Kwak Y.J. and Song K.G. 1999 Nitrogen removal
from synthetic wastewater by simultaneous nitrification and denitrification (SND) via nitrite
in an intermittently-aerated reactor. Water Research, 33, 145-154.
Zumstein, E., Moletta, R., Godon, J. 2000 Examination of two years of community dynamics
in an anaerobic bioreactor using ¯ uorescence polymerase chain reaction ( PCR ) single-strand
conformation polymorphism analysis. Environmental Microbiology 2, 69–78.
1 2 3 4 5 6 7 8 9 10 11 12 13 14 15 16 17 18 19 20 21 22 23 24 25 26 27 28 29 30 31 32 33 34 35 36 37 38 39 40 41 42 43 44 45 46 47 48 49 50 51 52 53 54 55 56 57 58 59 60 61 62 63 64 65

We would like to thank the reviewers for their relevant comments and we hope the
modifications added will satisfy them. We submit a new copy of the paper where we consider
all the corrections suggested by the reviewers. Hereby we have answered to each of the
reviewer suggestions. The modified text was underlined in yellow in the corrected paper
To take into account the demand of editors (less than 5000 words including tables and figures)
and reviewers, we have slightly modified the presentation to clarify some points.
1- Reviewer #1: Minor remarks : Line 13 : Which type of physicochemical treatment is used to remove and concentrate organic carbon ? It is conventional physic-chemical treatment using primary settling or drum filter (in association or not with an upstream step of coagulation flocculation in accordance with the expected level of treatment). This point was indicated in the text. Lines 30 to 39 : could you please explain why energy requirement is twice lower for ammonium oxidation and for membrane supply ; why methane production is twice higher ? Depending of the primary treatment efficiency, the oxygen requirements is only used for nitrification, the BOD is indeed retained in the primary step. Then in accordance with conventional approach to evaluate oxygen demand (ASCE, 1992), it can be supposed a oxygen demand twice lower according to conventional composition of urban wastewater (300 mg BOD5/L and 70 mgN/L). Because low COD/N ratio, the sludge concentration in MBR also appears lower resulting in a better oxygen transfer and a better suspension filterability (linked to TSS and SMP production). The biogas production is linked to the potential of methane production that appears higher with fresh primary sludge than with secondary sludge. Moreover secondary sludge is often partially stabilized in the bioreactor when working under high SRT (> 15d) which is required for Nitrogen removal as necessary in sensitive area. This explanation was added in the text. Material and Methods : In the 2.1 part line 7 : Were some inorganic salts and inorganic carbon added to the synthetic effluent ? Because with only acetate and ammonium it seems a little bit reductive to talk about urban wastewater It’s right of course, but after a physicochemical treatment, the residual organic matter present in the effleunt is only composed by the soluble fraction of organic matter (to make it simple, acetate was selected to analyse the MBR performances in favourable working conditions) and the soluble part of Nitrogen mainly composed by ammonium salts. Of course the results obtained on lab scale with synthetic influent should be verified (or not) in an actual urban wastewater plant, it is the topic of next research. Line 15 : Sewage treatment plant characteristics ? The sewage plant was design for 5000 P.E and working with extended aeration. The sentence has been modified: “ an activated sludge process with extended aeration (5 000 P.E.)”. This element is indicated to precise that the seeding sludge is adapted to nitrification and denitrification.
Response to reviewersClick here to download Manuscript: Yang response to reviewers WST.docx
1 2 3 4 5 6 7 8 9 10 11 12 13 14 15 16 17 18 19 20 21 22 23 24 25 26 27 28 29 30 31 32 33 34 35 36 37 38 39 40 41 42 43 44 45 46 47 48 49 50 51 52 53 54 55 56 57 58 59 60 61 62 63 64 65

Line 23 : What are the characteristics of solution employed for pH regulation (concentration, molecule, way of introduction in the set up) ?
The following description has been added: “thanks to the addition of Sodium Hydroxyde (2 mole.L-1) through a pH controller and a dosing pump” Part 3.2 : Line 37 : What was the relatively high value of pH mentioned ? The pH was around 8.5 - 8.7, so the ratio between NH3/NH4 = 0.13. The pH value has been added in the text. Part 3.4 : Are you sure it is convenient to compare the level of diversity reached in this work with the one obtained with Gevaudan et al, 2012 who worked with COD/N ratio = 0 ? The remark of reviewer is relevant. In fact we keep this reference because we think that the population was mainly composed by autotrophic population in regards with the low COD/N ratio. Major comments : How the MBR stability was assessed during application of specific COD/N ratio ? Authors used the same reactor working in continual way, e.g. the same initial biomass consortium to evaluate the effects of different COD/N ratios. By this way, biomass was specified directly after the first COD/N ratio applied. Are you sure that you will get the same results, if COD/N ratio were applied on two different MBR reactors starting with the same biomass ? The remark of the reviewer is still relevant. In accordance with the long-time of sludge stabilization, this procedure was the one selected. Nevertheless, the experiments were systematically stopped during the summer time and new experiments carried out with the same seeding sludge coming from the same WWTP show comparative evolutions of population with COD/N ratio (results that should be submitted for publication in the next months). Part 2.3 : some analyses were performed on sludge suspension and mentioned as conventional size measuring, soluble microbial products and settle ability index. However the obtained results were not presented and could bring some interesting information about sludge evolution depending on COD/N ratio applied. I would advise the authors to add these results. In accordance with the editor instruction (< 5000 words including figures and tables), we were obliged to choose some results in place of other. No significant particle size distribution was observed in accordance with SRT (the particle size distribution was mainly linked to shear stresses in aerated tank which were not modified during the experiments). Moreover, in steady state conditions SMP production remained low with low SMP concentration in the bulk (the soluble COD in supernatant was only due to SMP and was lower than 40mg/L and lower than 15 mg/L in permeate) Part 3.1 : Line 4 : How the slowdown in the nitrifying activity was evaluated ? What happened during phase 3 ? Additional measures of nitrites and nitrates formation were carried out punctually in a parallel batch reactor to control kinetics rates. When pH increased in anoxic tank at the end of phase 3, the nitrobacteria activity was progressively decreased confirming the determining role of pH on nitrobacteria activity or inhibition by NH3 present in water. Table 2 : for the second COD/N ratio applied (3.5) transient and permanent phases have the same number 7. I think there is a mistake. Table 2 was modified to highlight results obtained during phases 3 and 7 and some explanation was added in the text. Values of growth rate and conversion rate were higher during transient phases. Could you please explain this result. Such results were identified by some authors in the seventies (Grau, Grady and others). To clarify the document on these points we only keep results obtained during phases 3 and 7. Part 3.2 : What are the ways to improve ASM model used in order to avoid such differences between experiment and model during phase 7 ? One solution is to take into account the NH3/NH4 ratio in regards to pH and NH3 inhibition effect on nitrobacteria.
1 2 3 4 5 6 7 8 9 10 11 12 13 14 15 16 17 18 19 20 21 22 23 24 25 26 27 28 29 30 31 32 33 34 35 36 37 38 39 40 41 42 43 44 45 46 47 48 49 50 51 52 53 54 55 56 57 58 59 60 61 62 63 64 65

Reviewer #2: Several minor points should be improved. 1- In section 3.3, the authors said that the evolution of TMP was very low except some specific conditions. Please describe the exceptional conditions in detail. It would be much better if TMP variations were given. The mode of membrane filtration (relaxation, backwash) has allowed a good control of average TMP evolution, closed to 3. 10
10 (m.d)
-1. The three main causes of higher TMP evolution rates were indicated. They were mainly
observed when punctual unsteady states conditions appeared (acclimatization periods, presence of COD (or SMP) accumulation in supernatant) or when abrupt changes of filtration rates were imposed (corresponding value of d(TMP)/dt were indicated). 2- In ASM model, the author use the kinetics parameters at 20 °C? while they described that the auto MBR was operated at room temperature. Please give the detailed temperature? Do they need any modification? Please discuss it. The range of the room temperature is 16 -21°C (except during 8 days in winter, 14-15°C, while the external temperature was cold or in end of July in summer, 26°C, while external temperature was high). During such short periods no significant modifications were observed in MBR performances. Of course in an actual WWTP, such temperature modifications can be significant and it is important to verify such results by working in an actual WWTP. It should be done in the project.
1 2 3 4 5 6 7 8 9 10 11 12 13 14 15 16 17 18 19 20 21 22 23 24 25 26 27 28 29 30 31 32 33 34 35 36 37 38 39 40 41 42 43 44 45 46 47 48 49 50 51 52 53 54 55 56 57 58 59 60 61 62 63 64 65

New urban wastewater treatment with Autotrophic Membrane Bioreactor (AutoMBR)
at low COD/N substrate ratio
Y. Yang*, G. Lesage*, M. Barret**, N. Bernet**, A. Grasmick*, J. Hamelin**, M. Heran*
*Institut Européen des Membranes, CNRS, UMR 5635, Université Montpellier II,
Montpellier, France. Corresponding author : [email protected]. **
INRA, UR0050, Laboratoire de Biotechnologie de l’Environnement, Avenue des Etangs,
Narbonne, F-11100, France.
Abstract
The potential for total nitrogen removal from municipal wastewater has been evaluated
in an autotrophic membrane bioreactor (AutoMBR) running with low COD/N ratio to
simulate its combination with an upstream physicochemical process retaining a large part of
organic matter. The tests were conducted in a lab-scale submerged membrane bioreactor
loaded with a synthetic influent. Nitrogen loading rate was 0.16 kgN-NH4+.m-3
.d-1
and sodium
acetate was added as carbon source. Results have shown that nitrogen elimination could reach
85% for a COD/N ratio of 5, with a COD removal exceeding 97%. However, a COD/N ratio
of 3.5 was found to be the limiting factor to reach successfully the overall target value of 10
mgN.L-1
in the effluent. Nevertheless, low COD/N ratios permit to work with low total
suspended solids (TSS) concentrations in the bioreactor, which greatly facilitates the
membrane fouling control by simple aeration and backwashing strategy.
Keywords: autotrophic membrane bioreactor; COD/N ratio; nitrogen removal; energy
demand; activated sludge population dynamics
1. Introduction
There is an increasing need to use reliable, efficient and sustainable technologies to (i)
treat wastewater and obtain sufficient quality of treated water for reuse, (ii) recover molecules
of interest and eventually (iii) produce sustainable energy. Urban wastewater treatment plants
are defined today to remove particulate and dissolved organic fractions and in more sensitive
areas Nitrogen and Phosphorus compounds. The most conventional well-known intensive
system to treat urban wastewater is the activated sludge process.
Recent studies have shown the possibility of intensification (in term of treated water
quality and unit compactness) by replacing the settling separation phase by a selective
membrane barrier which gives rise to membrane bioreactor: MBR (Grasmick et al., 2007).
Nevertheless the main but significant default of MBR is its important energy requirements
due to (i) aeration for aerobic reactions in concentrated biological suspensions and (ii)
aeration to control membrane fouling (Lebègue et al., 2009; Kraume and Drews, 2010;
Kraume and Bracklow, 2002; Krause and Cornell, 2007).
A new concept is then proposed to favor MBR presence in an intensive wastewater
treatment plant able to present a global positive energy balance. It is based (i) in the water
line, on the association of an upstream efficient liquid/solid separation, with
coagulation/flocculation associated to a laminar settler or a drum filter for example, able to
remove and concentrate organic matter in primary sludge (An et al. 2009) and an Autotrophic
Membrane Bioreactor (AutoMBR) able to remove nitrogen, residual soluble organic matter
and germs; and (ii) in the sludge line, on an anaerobic digestion able to recover methane and
Corrected ManuscriptClick here to download Manuscript: Yang WST version 3.docx
1 2 3 4 5 6 7 8 9 10 11 12 13 14 15 16 17 18 19 20 21 22 23 24 25 26 27 28 29 30 31 32 33 34 35 36 37 38 39 40 41 42 43 44 45 46 47 48 49 50 51 52 53 54 55 56 57 58 59 60 61 62 63 64 65

provide energy from fresh primary sludge. The AutoMBR receives then an influent containing
mainly the residual soluble fraction of organic carbon present in domestic wastewater and a
large part of Nitrogen fraction that escapes from the primary treatment. Therefore, the
AutoMBR influent presents a low COD/N ratio (depending on the performances imposed in
the upstream primary treatment) favorable to the nitrification stage (as nitrification is carried
out by autotrophic bacteria, Li et al., 2006) but which may be an obstacle for a sufficient
denitrification (Sun et al., 2010; Deronzier et al., 2001).
The residual organic matter is only used for denitrification when COD/N ratio is
sufficiently low and oxygen is only necessary for nitrification. The intensity of aeration in the
bioreactor then appears significantly lower (ASCE, 1992). Moreover air requirements to
minimize membrane fouling could be lower due to lower biomass concentration and activity
in the bioreactor bulk phase. At last, the global system can present a positive energy balance
because fresh primary settled sludge is able to generate more biogas (and energy) than
secondary sludge coming from conventional system. It is one of the challenges of this
research.
This paper is mainly focused on four points: (i) identification of the critical COD/N ratio
that allows a sufficient Nitrogen removal by nitrification/denitrification, (ii) the biological
kinetics and treatment performances, (iii) the oxygen requirements (iv) and the potential gain
of suspensions filterability by reducing heterotrophic populations growth due to low organic
carbon concentration in AutoMBR influent (Mengchun et al., 2004).
2. Material and Methods
2.1. Membrane bioreactor operation
The experimental lab scale bioreactor was composed with two tanks with identical volume
of 30 L connected in series. One worked in anoxic conditions, it received the influent
containing soluble organic matter and ammonium as Nitrogen source. The second tank was
aerated and equipped with submerged flat sheet membranes with a pore size of 0.04 µm and a
surface area of 0.34 m2 (Microdyn-Nadir, Germany). Air diffusers were set below the
membrane module; the aeration not only supplied oxygen to microorganisms, but also
produced hydraulic shearing forces closed to the membrane surface to delay membrane
fouling. The treated water was recovered by filtering the biological suspension present in the
aerated tank through the membrane barrier. The trans-membrane pressure (PTM in kPa) was
measured by specific pressure sensors placed up-stream and down-stream the membranes.
Nitrates were formed in aerated tank by ammonium oxidation. To ensure nitrate reduction, the
mixed liquor present in aerated tank was recycled towards the first anoxic tank. The recycle
ratio (R) was set at 400% in regards with the influent flow.
The autotrophic submerged membrane bioreactor (AutoMBR) was fed with a synthetic
substrate containing 70 mgNH4+-N.L-1
diluted in tap water, this value is closed to the nitrogen
concentration measured in raw domestic wastewater. Acetate at different concentrations (from
245 to 560 mgCOD.L-1
) was added in the AutoMBR influent to simulate the presence of
soluble organic matter coming out from primary treatment. According to the performances of
primary treatment, the COD/N ratio influence was studied for successive values, mainly 5 and
3.5, (in place of COD/N ratio from 10 to 12 encountered in domestic wastewater). The
bioreactor was inoculated with seed sludge taken from an activated sludge process treating
domestic wastewater under extended aeration (sludge age closed to 20 days). Experiments
were performed during 180 days with various sludge retention time (SRT), hydraulic retention
time (HRT) and influent concentrations as detailed in table 1.
1 2 3 4 5 6 7 8 9 10 11 12 13 14 15 16 17 18 19 20 21 22 23 24 25 26 27 28 29 30 31 32 33 34 35 36 37 38 39 40 41 42 43 44 45 46 47 48 49 50 51 52 53 54 55 56 57 58 59 60 61 62 63 64 65

Phases 1 and 2 corresponded to biomass acclimatization to the new operating conditions.
Phases 4, 5 and 6 were developed to analyze specific aspects not described in this document.
The results discussed in this paper correspond to data obtained during phases 3 and 7.
Table 1. Operating parameters of the AutoMBR during the 180 days of operation.
Phase 1
D0-D15 Starting phase
Phase 2
D16-D22
MBR
Phase 3
D23-D75
MBR
Phase 4
D76-D85
Batch
Phase 5
D86-D105
Reducing of
flow
Phase 6
D106-D108
Recovery of
flow
Phase 7
D109-D180
MBR
Solid Retention Time
SRT (d) No extraction 20 40 No extraction 40 40 40
Hydraulic Retention Time
HRT (h) 12.6 12.6 12.6 No filtration 25.2 25.2-12.6 12.6
Filtration flux
JW (L.h-1.m-2) 14 14 14 -- 7 714 14
Organic Loading Rate (kgCOD.m-3.d-1) 1.27 0.81 0.81 0 0.28 0.56 0.56
Nitrogen Loading Rate (kgN. m-3.d-1) 0.16 0.16 0.16 0.03 0.08 0.16 0.16
COD/N 8 5 5 0 3.5 3.5 3.5
The AutoMBR was operated at room temperature (16 to 21 °C except during 8 days in
winter with lower temperature (D68-D70 and D135-D138 with temperature below 15°C). The
pH of aerobic tank was regulated at 7.5 ± 0.5 thanks to the addition of a Sodium Hydroxyde
solution (2 mole.L-1
) by a pH controller and a dosing pump. Membrane fouling was controlled
by air diffusion and a specific filtration strategy composed by successive 10-min operational
filtration cycles including 8.75 min of suction (flow rate of 17 LMH (L.h-1
.m-2
)) followed by a
0.25 min of relaxation (no filtration), 0.75 min of reverse-washing (flow rate of 9 LMH) and
0.25 min of relaxation. Thus the average effective flow rate was close to 14 LMH. A storage
tank was present on the effluent line in order to provide a clean water reserve for backwashing
phases.
2.2. Modelling
The Activated Sludge Model 1 (ASM 1) was used to simulate the operations (Henze et
al., 2008). ASM1 model was used with default kinetic parameters at 20°C. Both tanks were
assimilated to perfectly stirred reactors, membrane separation step was considered as a perfect
particles separator with a negligible volume.
2.3. Analytical methods
Approximately once a week, sludge samples were taken to analyze the evolution of the
biological population. Total genomic DNA extraction from the AutoMBR samples was
carried out following the method detailed in Godon et al. (1997). The DNA extracts were
purified with QIAamp DNA Mini Kit (Qiagen). Fingerprints of bacterial communities were
generated by capillary electrophoresis-single strand conformation polymorphism (CE-SSCP)
(Zumstein et al., 2000). The StatFingerprints library from R (Michelland et al., 2009) was
used to analyze CE-SSCP profiles. The fingerprints were first aligned with the internal
standard ROX and the sum of the peak areas were normalized to unit. The complexity of the
bacterial community was estimated using the Simpson’s diversity index, by considering the
number of species (number of peaks) as well as their relative abundance (area under each
peak).
1 2 3 4 5 6 7 8 9 10 11 12 13 14 15 16 17 18 19 20 21 22 23 24 25 26 27 28 29 30 31 32 33 34 35 36 37 38 39 40 41 42 43 44 45 46 47 48 49 50 51 52 53 54 55 56 57 58 59 60 61 62 63 64 65

The concentration of Mixed Liquor Suspended Solids (MLSS), Mixed Liquor Volatile
Suspended Solids (MLVSS), Chemical Oxygen Demand (COD) were measured using
standard methods: AFNOR NFT 90-105, NFT 90-029 and NFT 90-101 respectively.
Nitrogen compounds (NH4+-N, NO2
--N and NO3
--N) were quantified by
spectrophotometric analysis (Salicylate method by Amver 26069-45 Test N'Tube ™ and
cadmium reduction method by NitraVer ® 5 tests, Hach, Loveland, CO, USA). In addition,
specific probes were used to continuously measure pH, temperature, ammonium and nitrate
ions in the mixed liquor (Wissenschaftlich-Technische Werkstätten GmbH, Germany). The
suspension was also characterized through conventional particle size measuring, soluble
microbial products (proteins and polysaccharides in solution) and settle ability index.
3. Results and Discussion
3.1. Suspended solids
Figure 1. MLSS and MLVSS concentrations (g.L
-1) for different organic and nitrogen loading
rate: experimental data (symbols) and modeling results (dotted line) during the 180 days of
AutoMBR operation.
Figure 1 shows the evolutions of MLSS and MLVSS from September 2012 to March
2013. During phase 2 and the beginning of phase 3 (transient period of phase 3) no sludge
extraction was practiced to reach quickly steady state conditions. During phase 6, the OLR
was drastically increased modifying then the growth rate of the biomass till the tenth day of
phase 7 (transient phase 7), this time of stabilization in phase 7 was probably due to the time
of assimilation of substrate in excess stored by biomass during phase 6. After the first
transient period in phase 7, a steady state was observed.
Experimental results (MLSS concentrations in the bulk phase) appear in agreement with
ASM simulations during steady state periods of phases 3 and 7 (simulations are represented
by the dotted line in figure 1).
3.2. Nitrogen removal
1 2 3 4 5 6 7 8 9 10 11 12 13 14 15 16 17 18 19 20 21 22 23 24 25 26 27 28 29 30 31 32 33 34 35 36 37 38 39 40 41 42 43 44 45 46 47 48 49 50 51 52 53 54 55 56 57 58 59 60 61 62 63 64 65

Experimental and modeling results are listed in table 2 for steady state periods of phases
3 and 7. During these two phases, the NH4+-N concentration in influent was imposed at 70
mgN.L-1
.
During phase 3 (COD/N=5), the experimental values of NH4+-N and NOx-N
concentrations for anoxic and aerated tanks are in agreement with modeling simulations.
During phase 7 (COD/N=3.5), experimental values of NH4+-N concentration for the two
tanks are slightly greater than values expected by modeling. In opposite, there is a significant
difference between experimental results and modeling for NOx-N, this is due to the fact that
the ASM1 has simulated an insufficient level of denitrification with such low COD/N ratio.
Due to a pH relatively high observed in anoxic tank (pH = 8.5-8.7), a part of NH4+-N was
probably transformed in NH3-N which is an inhibitor for nitrifying Nitrobacter populations
(Yoo et al., 1999). As a result, the total oxidation of NH4+-N to NO3
--N was not achieved in
aerated tank leading to the accumulation of NO2--N compounds. Such a low COD/N ratio
appeared sufficient for the reduction of N-NO2- in N2 in the anoxic tank sincethe N-NO3
-
shortcut allows a potential saving of 33% of the COD required (Ruiz et al., 2006). ASM
simulation hasn’t taken into account such insufficient pH control, nitrobacter inhibition and
nitrates shortcut which explains the important differences between modeling simulation and
experimental results.
3.3. Kinetics coefficients:
The MLSS and MLVSS monitoring allowed the quantification of some apparent kinetic
coefficients of apparent cell growth (Table 2).
Table 2. Values of biological kinetics and conversion rate (experimental data and ASM1 modeling results).
Phase 3 Phase 7
transient permanent transient permanent
Experiment Modelling Experiment Modelling
OLR (kgCOD.m-3
.d-1
) 0.81 0.81 0.81 0.56 0.56 0.56
NLR (kgN. m-3
.d-1
) 0.16 0.16 0.16 0.16 0.16 0.16
COD/N 5 5 5 3.5 3.5 3.5
biomass growing rate : rx (g.L-1
.d-1
) 0.122 0.12 0.121 0.146 0.082 0.086
Net growing rate: app (d-1
) 0.03 0.025 0.025 0.043 0.025 0.025
Yield coefficient for biomass growth
on substrate :
Yobs (kgMLVSS.kgCOD-1
) 0.151 0.148 0.15 0.26 0.145 0.154
N-NH4effluent (mgN.L-1
) 21 0.5 0.2 0.6 0.6 0.2
N-NO3effluent (mgN.L-1
) 15.5 11.8 12.8 13.3 12.5 27.6
Ammonium oxidation rate
(kgN-NH4+. m
-3.d
-1)
-- 0.39 0.25 -- 0.44 0.29
kgO2consumed . m-3
water -- < 0.32 -- -- 0.32 --
Except during the transient period at the beginning of phase 7, apparent rx and biomass
concentration increased with OLR (NLR was constant) but app and Yobs did not really
changed with OLR because the SRT was maintained at a constant value of 40 days.
The capacity of ammonium oxidation by the active biomass was measured
experimentally by punctual impulsions of ammonium in a batch reactor filled with biomass
taken from the AutoMBR. It was compared with ASM1 simulation results and Nitrogen
loading rates (NLR) imposed to the AutoMBR. As ASM1 simulation results, it appeared
1 2 3 4 5 6 7 8 9 10 11 12 13 14 15 16 17 18 19 20 21 22 23 24 25 26 27 28 29 30 31 32 33 34 35 36 37 38 39 40 41 42 43 44 45 46 47 48 49 50 51 52 53 54 55 56 57 58 59 60 61 62 63 64 65

higher than NLR but it did not indicate that Nitrification was not achieved with low COD/N
ratio.
As expected, oxygen requirements including Nitrogen oxidation and biomass respiration
was significantly lower than in conventional MBR (about twice lower).
3.4. Fouling dynamics
The dynamics of membrane fouling was quantified through the evolution of the trans-
membrane pressure. During 180 days of operation only two chemical cleaning were operated.
Conversely, when the biological process was stabilized (phase 3), the TMP increased slowly
and did not exceed 0.15 kPa.d-1
which meant a daily variation of the total hydraulic resistance
closed to 0.03 m-1
.d-1
. The evolution of TMP was in the low range of values observed in
literature except in specific conditions:
- Phase of acclimatization to new conditions (phases 1 and 2) and significant
difference between the COD values in supernatant and permeate, the rate of TMP
evolution was 0.23 kPa.d-1
(8 times higher).
- Abrupt change of filtration conditions (the permeate flux was doubled at the
beginning of phase 6), the rate of TMP evolution was 1.62 kPa.d-1
(50 times
higher).
3.5.Bacteria community diversity
The AutoMBR conducted in this study consisted in unusual environmental conditions for
bacterial communities mainly because of the long SRT and the low COD/N ratio conditions.
Investigating the dynamics of bacteria communities in this original ecological niche is thus
necessary for improving our understanding of this innovative process. The temporal dynamics
of AutoMBR bacterial communities’ diversity as revealed by CE-SSCP fingerprints is
presented in figure 2. Thereafter, during the overall operation of the AutoMBR, the diversity
level varied between 1.8 and 4, which is in the range of that found in nitrifying particulate
biofilms fed at COD/N=0 (Gevaudan et al., 2012). During the acclimatization period, the
diversity level dropped from 5.3 (inoculum) to 4.1±0.9, as an adaptation to new
environmental conditions (carbon source, organic load, SRT, HRT). The diversity level then
stabilized and represented 2.9±0.3 during phase 3 (at a SRT of 40 days and a COD/N ratio of
5). Thereafter, the decrease of COD/N ratio to 3.5 was associated with a decrease of the
diversity of bacterial communities. The Simpson index over the period operated at COD/N
ratio of 3.5 (phases 5, 6 and 7) was 2.3±0.4, which is significantly lower from that at COD/N
ratio of 5 (ANOVA test, p=0.0005). Our results thus demonstrate that the gradient of
environmental conditions used in the MBR, from conventional systems to AutoMBRs
operated at long SRT and low COD/N ratio, resulted in a simplification of the bacterial
communities. This suggests that AutoMBRs operated at long SRT and low COD/N ratio
moves toward unusual communities in comparison to conventional systems.
1 2 3 4 5 6 7 8 9 10 11 12 13 14 15 16 17 18 19 20 21 22 23 24 25 26 27 28 29 30 31 32 33 34 35 36 37 38 39 40 41 42 43 44 45 46 47 48 49 50 51 52 53 54 55 56 57 58 59 60 61 62 63 64 65

Figure 2: Temporal dynamics of the diversity of bacterial communities in the AutoMBR as
represented by the Simpson diversity index. The error bars represent the standard deviation
between measurements in denitrification and nitrification tanks.
4. Conclusion
The experimental results have shown the possibility to achieve high removal efficiencies
of nitrogen compounds even with a low COD/N ratio equal to 5g.g-1
. The AutoMBR unit
ensures well known treatment performances for TSS and COD removal, 100% and more than
95% respectively. For total nitrogen, 85% of removal has been obtained with a COD/N of 5 in
agreement with ASM1 modeling. When the COD/N ratio decreased to 3.5, the experimental
performance of total nitrogen removal was reduced to 82%. However, this result was higher
than the value simulated with ASM1 due to a too important pH value in anoxic tank that
induce a partial nitrification in the aerated tank limiting the Nitrobacter development.
Nevertheless it is important to notice the low biomass concentration in Auto MBR when
working under low COD/N ratio and the noticeable associated kinetics coefficients.
5. Acknowledgements
This work is financially supported by the National French Agency (Ecotech Program
2010, CreativERU Project, ANR-10-ECOT-003-02) and TRIMATEC competitiveness
cluster.
6. References
ASCE, 1992, Suspended growth biological treatment, in Design of Municipal Wastewater
treatment plants, Manual and Report on Engineering Practice, Volume 1, 517-674.
An Y, Wang ZW, Wu ZC, Yang DH, Zhou Q. 2009 Characterization of membrane foulants in
an anaerobic non-woven fabric membrane bioreactor for municipal wastewater treatment.
Chem Eng J, 155, 709-715.
1 2 3 4 5 6 7 8 9 10 11 12 13 14 15 16 17 18 19 20 21 22 23 24 25 26 27 28 29 30 31 32 33 34 35 36 37 38 39 40 41 42 43 44 45 46 47 48 49 50 51 52 53 54 55 56 57 58 59 60 61 62 63 64 65
Corcoran E., Nellemann C., Baker E., Bos R., Osborn D. and Savelli H. 2010 Sick Water?
The Central Role of Wastewater Management in Sustainable Development. A Rapid Response
Assessment. The Hague, UN-Habitat/UNEP/GRID-Arendal.
Deronzier G., Schétrite S. and Racault Y. 2001 Traitement de l'azote dans les stations
d'épuration biologique des petites collectivités (Nitroge removal in small biological based
wastewater treatment plant). Ministère de l’agriculture et de la pêche, Cemagref, Document
technique, FNDAE n°25.
Gevaudan G., Hamelin J., Dabert P., Godon J.-J., Bernet N. 2012 Homogeneity and
Synchronous Dynamics of Microbial Communities in Particulate Biofilms: from Major
Populations to Minor Groups. Microbes Environment 27, 142–148.
Godon, J., Zumstein, E., Dabert, P., Habouzit, F., Moletta, R. 1997 Molecular microbial
diversity of an anaerobic digestor as determined by small-subunit rDNA sequence analysis.
Applied & Environmental Microbiology 63, 2802–2813.
Grasmick A., Cabassud C., Spérandio M. and Wisniewski C. 2007 Bioréacteurs à membranes
(BAM) et traitement des eaux usées (Membrane bioreactor and wastewater treatment).
Techniques de l’Ingénieur, W4 140, 1-16.
Henze M., Van Loosdrecht M.C.M., Ekama G.A., and Brdjanovic D. 2008 Biological
Wastewater Treatment: Principles, Modelling and Design. London: IWA Publishing, 112-139.
Li H., Yang M., Zhang Y., Yu T., Kamagata Y. 2006 Nitrification performance and microbial
community dynamics in a submerged membrane bioreactor with complete sludge retention.
Journal of Biotechnology, 123 (1), 60–70.
Kraume M. and Bracklow U. 2002 Membrane technology in the municipal waste water
treatment operating experience and design rules in Germany. Desalination, 146(1-3), 445-
449.
Kraume M. and Drews A. 2010 Membrane Bioreactors in Waste Water Treatment - Status
and Trends. Chemical Engineering and Technology, 33, 1251–1259.
Krause S. and Cornel P. 2007 Membrane Bioreactor’s Energy Demand in Wastewater
Treatment. 4th IWA Conference on membranes for water and wastewater treatment, 15-17
May 2007 Harrogate (United Kingdom).
Lebègue J., Héran M., Grasmick A. 2009 Membrane air flow rates and HF sludging
phenomenon in SMBR. Desalination, 236(1-3), 135-142.
Liu, H., Yang, F., Shi, S., and Liu, X. 2010 Effect of substrate COD/N ratio on performance
and microbial community structure of a membrane aerated biofilm reactor. Environmental
Science and Technolog, 22(4), 540–546.
Mengchun G., Min Y., Hongyan L., Yanming W. and Feng F. 2004 Nitrification and sludge
characteristics in a submerged membrane bioreactor on synthetic inorganic wastewater.
Desalination, 170: 177-185.
1 2 3 4 5 6 7 8 9 10 11 12 13 14 15 16 17 18 19 20 21 22 23 24 25 26 27 28 29 30 31 32 33 34 35 36 37 38 39 40 41 42 43 44 45 46 47 48 49 50 51 52 53 54 55 56 57 58 59 60 61 62 63 64 65

Michelland R.J., Dejean S., Combes S., Fortun-Lamothe L., Cauquil L. 2009 StatFingerprints:
a friendly graphical interface program for processing and analysis of microbial fingerprint
profiles. Molecular ecology resources, 9, 1359–63.
Pollice A., Laera G. and Blonda M. 2004 Biomass growth and activity in a membrane
bioreactor with complete sludge retention. Water Research, 38, 1799-1808.
Ruiz G., Jeison D., Rubilar O., Ciudad G. and Chamy R. 2006 Nitrification–denitrification via
nitrite accumulation for nitrogen removal from wastewaters. Bioresource Technology, 97,
330-350.
Sun S., Nacher C., Merkey B., Zhou Q., Xia S., Yang D., Sun J. and Smets B. 2010 Effective
biological nitrogen removal treatment processes for domestic wastewaters with low C/N ratios:
a review. Environ. Eng. Sci., 27, 111–126.
Yoo K., Ahn K.H., Lee H.J., Lee K.H., Kwak Y.J. and Song K.G. 1999 Nitrogen removal
from synthetic wastewater by simultaneous nitrification and denitrification (SND) via nitrite
in an intermittently-aerated reactor. Water Research, 33, 145-154.
Zumstein, E., Moletta, R., Godon, J. 2000 Examination of two years of community dynamics
in an anaerobic bioreactor using ¯ uorescence polymerase chain reaction ( PCR ) single-strand
conformation polymorphism analysis. Environmental Microbiology 2, 69–78.
1 2 3 4 5 6 7 8 9 10 11 12 13 14 15 16 17 18 19 20 21 22 23 24 25 26 27 28 29 30 31 32 33 34 35 36 37 38 39 40 41 42 43 44 45 46 47 48 49 50 51 52 53 54 55 56 57 58 59 60 61 62 63 64 65
Copyright © 2022 FDOKUMEN