The use of photosynthetic fluorescence parameters from autotrophic biofilms for monitoring the...
31
The Use of Photosynthetic Fluorescence Parameters from Autotrophic Biofilms for Monitoring the Effect of Chemicals in River Ecosystems Nata `lia Corcoll, Marta Ricart, Stephanie Franz, Fre ´de ´ric Sans-Piche ´, Mechthild Schmitt-Jansen, and Helena Guasch Abstract Photosynthetic processes play a key role in aquatic ecosystems. These processes are highly sensitive to the presence of toxicants, leading to an increase in their use as ecotoxicological endpoints. The use of chlorophyll-a fluorescence techniques to assess the impact of toxicants on the photosynthesis of the autotrophic component of fluvial biofilms has increased in the last decades. However, these photosynthetic endpoints are not currently used in water quality monitoring programs. A review of the currently available literature—including studies dealing with toxicity assessment of both priority and emerging compounds—allowed the dis- cussion of the pros and cons of their use as ecotoxicological endpoints in fluvial systems as well as their inclusion in regular monitoring programs. Chlorophyll-a fluorescence measurements have the ability to detect effects of a large panel of chemical substances on the photosynthetic processes of fluvial biofilms, covering both functional and structural aspects of the biofilm community. Moreover, they might provide early warning signals of toxic effects. Thus, the application of the chlorophyll-a fluorescence measurement is recom- mended as a complementary measurement of toxic stress in aquatic ecosystems. N. Corcoll (*) • H. Guasch Department of Environmental Sciences, Institute of Aquatic Ecology, University of Girona, Campus de Montilivi, 17071 Girona, Spain e-mail: [email protected] M. Ricart Department of Environmental Sciences, Institute of Aquatic Ecology, University of Girona, Campus de Montilivi, 17071 Girona, Spain Catalan Institute for Water Research (ICRA), Scientific and Technologic Park of the University of Girona, 17003 Girona, Spain S. Franz • F. Sans-Piche ´ • M. Schmitt-Jansen Department of Bioanalytical Ecotoxicology, Helmholtz-Centre for Environmental Research-UFZ, Permoserstr. 15, 04318 Leipzig, Germany H. Guasch et al. (eds.), Emerging and Priority Pollutants in Rivers, Hdb Env Chem (2012) 19: 85–116, DOI 10.1007/978-3-642-25722-3_4, # Springer-Verlag Berlin Heidelberg 2012 85
-
Upload
independent -
Category
Documents
-
view
0 -
download
0
Transcript of The use of photosynthetic fluorescence parameters from autotrophic biofilms for monitoring the...

The Use of Photosynthetic Fluorescence
Parameters from Autotrophic Biofilms for
Monitoring the Effect of Chemicals in River
Ecosystems
Natalia Corcoll, Marta Ricart, Stephanie Franz, Frederic Sans-Piche,
Mechthild Schmitt-Jansen, and Helena Guasch
Abstract Photosynthetic processes play a key role in aquatic ecosystems. These
processes are highly sensitive to the presence of toxicants, leading to an increase in
their use as ecotoxicological endpoints. The use of chlorophyll-a fluorescence
techniques to assess the impact of toxicants on the photosynthesis of the autotrophic
component of fluvial biofilms has increased in the last decades. However, these
photosynthetic endpoints are not currently used in water quality monitoring
programs.
A review of the currently available literature—including studies dealing with
toxicity assessment of both priority and emerging compounds—allowed the dis-
cussion of the pros and cons of their use as ecotoxicological endpoints in fluvial
systems as well as their inclusion in regular monitoring programs.
Chlorophyll-a fluorescence measurements have the ability to detect effects of a
large panel of chemical substances on the photosynthetic processes of fluvial
biofilms, covering both functional and structural aspects of the biofilm community.
Moreover, they might provide early warning signals of toxic effects.
Thus, the application of the chlorophyll-a fluorescence measurement is recom-
mended as a complementary measurement of toxic stress in aquatic ecosystems.
N. Corcoll (*) • H. Guasch
Department of Environmental Sciences, Institute of Aquatic Ecology, University of Girona,
Campus de Montilivi, 17071 Girona, Spain
e-mail: [email protected]
M. Ricart
Department of Environmental Sciences, Institute of Aquatic Ecology, University of Girona,
Campus de Montilivi, 17071 Girona, Spain
Catalan Institute for Water Research (ICRA), Scientific and Technologic Park of the University
of Girona, 17003 Girona, Spain
S. Franz • F. Sans-Piche • M. Schmitt-Jansen
Department of Bioanalytical Ecotoxicology, Helmholtz-Centre for Environmental Research-UFZ,
Permoserstr. 15, 04318 Leipzig, Germany
H. Guasch et al. (eds.), Emerging and Priority Pollutants in Rivers,Hdb Env Chem (2012) 19: 85–116, DOI 10.1007/978-3-642-25722-3_4,# Springer-Verlag Berlin Heidelberg 2012
85

Their application is of special interest in the context of the Water Framework
Directive (WFD, Directive 2000/60/EC), where the development of new structural
and functional endpoints of the biological quality elements (e.g., biofilms) is required.
Keywords Biofilms • Chl-a fluorescence parameters • Emerging substances •
Priority substances • Rivers
Contents
1 Introduction . . . . . . . . . . . . . . . . . . . . . . . . . . . . . . . . . . . . . . . . . . . . . . . . . . . . . . . . . . . . . . . . . . . . . . . . . . . . . . . . 87
2 Physiological Basis of Photosynthesis . . . . . . . . . . . . . . . . . . . . . . . . . . . . . . . . . . . . . . . . . . . . . . . . . . . . 89
3 Chl-a Fluorescence Analysis and Derived Parameters . . . . . . . . . . . . . . . . . . . . . . . . . . . . . . . . . . 90
3.1 The Fast Fluorescence Induction Kinetics: PEA Fluorometry . . . . . . . . . . . . . . . . . . . . 90
3.2 The Slow Fluorescence Induction Kinetics: Standard PAM Fluorometry . . . . . . . . 91
4 The Use of Fluorescence Parameters to Assess the Effects of Toxicants on Biofilms . 96
4.1 PSII Inhibitors . . . . . . . . . . . . . . . . . . . . . . . . . . . . . . . . . . . . . . . . . . . . . . . . . . . . . . . . . . . . . . . . . . . . . . . 97
4.2 Other Photosynthetic Inhibitors . . . . . . . . . . . . . . . . . . . . . . . . . . . . . . . . . . . . . . . . . . . . . . . . . . . . 99
4.3 Toxicants with Unknown Mode of Action on Algae . . . . . . . . . . . . . . . . . . . . . . . . . . . . . . 101
4.4 Field Studies . . . . . . . . . . . . . . . . . . . . . . . . . . . . . . . . . . . . . . . . . . . . . . . . . . . . . . . . . . . . . . . . . . . . . . . . . 102
5 General Discussion and Perspectives . . . . . . . . . . . . . . . . . . . . . . . . . . . . . . . . . . . . . . . . . . . . . . . . . . . . . 108
6 Conclusions . . . . . . . . . . . . . . . . . . . . . . . . . . . . . . . . . . . . . . . . . . . . . . . . . . . . . . . . . . . . . . . . . . . . . . . . . . . . . . . . 110
References . . . . . . . . . . . . . . . . . . . . . . . . . . . . . . . . . . . . . . . . . . . . . . . . . . . . . . . . . . . . . . . . . . . . . . . . . . . . . . . . . . . . . . . 110
Abbreviations
AL Actinic light
BQE Biological quality element
F Fluorescence yield at the maximal reduced state
Fe Ferrodoxin
Fm Maximal fluorescence yield
Fm0 Fluorescence yield at actinic light steady state
Fo Minimal fluorescence yield
Fo(Bl) Fluorescence signal linked to cyanobacteria group
Fo(Br) Fluorescence signal linked to diatoms’ algal group
Fo(Gr) Fluorescence signal linked to green-algae algal group
Fo/Fv Efficiency of the water-splitting apparatus of PSII
Fo0 Fluorescence yield when actinic light is omitted
Fv Variable fluorescence yield
Fv/2 Fluorescence measurment of plastoquinone pool
ML Measuring light
NPQ Non-photochemical quenching without measuring Fo0
PAM Pulse amplitude modulated
PEA Plant efficiency analyzer
Pheo Pheophytin
PQ Plastoquinone pool
PQA Plastoquinone A
86 N. Corcoll et al.

PQB Plastoquinone B
PS Photosystem
PSI Photosystem I
PSII Photosystem II
qN Non-photochemical quenching
qP Photochemical quenching
SP Saturation pulse
UQDrel Relative unquenched fluorescence
WFD Water framework directive
F0PSII Effective quantum yield of PSII
FPSII Maximal quantum yield of PSII
1 Introduction
Photosynthesis is a major process for all illuminated ecosystems as it provides the
main source of organic material for the food chain. Autotrophic organisms carry out
this physiological process by converting the light energy into chemical energy,
building up organic molecules out of CO2 and water [1]. Derived organic matter
serves as food of the heterotrophic organisms. Understanding the physiological/
photochemical processes supporting this key function was focus of research for
hundreds of years, and several measuring techniques were developed based on
chemical analysis of pigments, 14C fixation, oxygen production, or chl-a fluores-
cence-based methods, among others. The latter methods provide a good basis for
application in monitoring algal density or photosynthetic processes in terms of
electron transport activity and energy dissipation processes [2].
The use of chl-a fluorescence techniques to assess photosynthesis performance
under changing environmental conditions has widely been proved as a rapid,
noninvasive, reliable method [3, 4]. Since the first acknowledgement of the analyti-
cal potential of chl-a fluorescence techniques [5, 6] until now, extensive research
has been carried out to apply this technique in different research fields. In the case
of ecotoxicology, chl-a fluorescence techniques have been used to evaluate the
toxicity of different pollutants and to locate their primary sites of damage in
photosynthetic organisms.
This review focuses on the use of chl-a fluorescence techniques to assess
chemical effects on the autotrophic component of fluvial biofilms, a nontarget
community present in all aquatic systems. Fluvial biofilms are made up mainly of
algae, bacteria, fungi, and other micro- and meiofauna organisms, embedded in a
matrix of extracellular polymeric substances [7]. In contrast to other autotrophic
groups, such as phytoplankton, biofilms have the particularity to live immobile;
therefore they are suitable for long-term monitoring and allow chemical toxicity to
be assessed at community level. This community approach is much closer to the
processes of an ecosystem than the use of single species tests and uses a biological
quality element (BQE) [8, 9], which is regularly monitored within the Water
Framework Directive (WFD, Directive 2000/60/EC) for the assessment of the
The Use of Photosynthetic Fluorescence Parameters 87
ecological status of water systems. Biofilms have the capacity to modify the transport
and accumulation of substances such as nutrients [10] as well as organic toxicants and
heavy metals [11]. Several studies have highlighted the sensitivity of these
communities to a large panel of toxicants such as heavy metals [12–14], herbicides
[15–19], pharmaceuticals, and personal care products [20–23]. Due to this sensitiv-
ity, fluvial biofilms can be used as early warning systems for the detection of the
effects of toxicants on aquatic systems [24]. The pertinence of the use of chl-afluorescence techniques for toxicity assessment on fluvial biofilms is attributed to
the basis that if a chemical produces effects on the photosynthesis processes (in a
direct or indirect way) the chl-a fluorescence parameters will reflect it. In the last
decade several investigations followed this approach [12, 15, 18, 20, 25–31, 33].
Based on the chl-a fluorescence techniques mainly two types of analysis of
fluorescence have been developed to assess photosynthesis performance: (a) the
fast fluorescence induction kinetics, measured by plant efficiency analyzer (PEA)
instruments, and (b) the slow fluorescence induction kinetics, measured by pulse
amplitude modulated (PAM) fluorometers. Although the first provides interesting
information on various steps of photosynthetic electron transport [32], it has not
been applied to complex samples such as fluvial biofilms.
Several PAM fluorescence instruments are provided to assess the photosynthetic
performance in biofilms; each one presenting a specific characteristic: (1) Standard
PAM fluorometers excite chlorophyll fluorescence at one wavelength (665 nm,
excitation maximum of the chlorophyll-a molecule) and have been applied on
biofilms to evaluate the global photosynthetic response of the autotrophic compart-
ment (e.g., [15, 25]). PAM fluorometers are available in different technical settings
(Fa. Walz, Effeltrich, Germany). Next to standard applications working with
cuvettes, a microscopy PAM fluorometer is available, suitable for the assessment
of selected cells within a biofilm on a microscopic scale [33]. The Maxi-Imaging
PAM fluorometer was developed to assess the photosynthetic capacity of large
surfaces, e.g., leaves or multiwell plates and is also suitable for measuring biofilms
[34, 35]. (2) Multiwavelength excitation PAM fluorometers (e.g., Phyto-PAM)
present the singularity to work with several excitation wavelengths, exciting
pigments with different absorption spectra, e.g., carotenoids, which are character-
istic for defined algal classes. After deconvolution of the fluorescent signals from
mixed algal samples the multiwavelength PAM fluorometry has the potential to
reveal the contribution of algal groups with different absorption spectra [36].
Different sources of chemical contamination (industrial, agricultural, or urban
activities) discharge a wide variety of compounds with different modes of action
(MoA), toxic concentrations, persistence into the ecosystem (accumulation, degra-
dation), etc.
The WFD (2000/60/EC) defines a strategy for protecting and restoring clean
waters across Europe. As a first step of this strategy, a list of priority substances was
adopted in the Directive 2008/105/EC, in which 33 substances of priority concern
were identified and regulated. The list includes mainly organic contaminants, such
as pesticides, and four toxic metals [37]. Besides this recognized contaminants,
more substances are being detected in the environment. The so-called emerging
88 N. Corcoll et al.

contaminants are compounds that are not currently covered by existing water
quality regulations and are thought to be potential threats to environmental
ecosystems [38]. The WFD follows two different assessment strategies: the chemi-
cal status evaluation and the ecological status. The “ecological status” represents
the “quality of the structure and functioning of aquatic ecosystems associated with
surface waters” (Directive 2000/60/EC). In order to establish the “ecological
status,” the WFD requires the sampling and interpretation of data on a broad suite
of “BQEs.” The WFD required that observed metric values for BQEs in a water
body undergoing monitoring were mathematically compared with expected values
for reference condition sites based on predictive modeling, hind casting, or expert
judgment [39]. Biofilms, referred to as periphyton in the WFD, have been included
as one major BQE. Concerning this BQE, the WFD recognized the diatom index
within biofilms to evaluate structural effects, which has been widely applied for
water managers. For non-diatom species from periphyton there is not a recognized
parameter to be evaluated.
This chapter introduces the measuring principles of chl-a fluorescence
techniques and summarizes studies that assess the toxicity of priority and emerging
substances on autotrophic biofilms by using chl-a fluorescence techniques. The
photosynthesis mechanism has been shown to be very sensitive to several toxic
substances such as heavy metals or herbicides [40, 41]. So the photosynthesis
process which is essential for the overall survival of phototrophs can be used as
an ecotoxicological endpoint to assess the impact of many toxicants [42].
The main aim of this chapter is to analyze the pros and cons of the use of chl-afluorescence techniques for water quality monitoring programs in the context of the
WFD. While not being an exhaustive review, 29 different investigations have been
analysed, including only field and laboratory investigations dealing about the
application of chl-a fluorescence parameters on biofilm communities.
2 Physiological Basis of Photosynthesis
Photoautotrophic organisms have the ability to synthesize organic compounds from
CO2 and water by converting light energy to molecular energy during photosynthesis.
Oxygenic photosynthesis is catalyzed in two photosystems (PS): PSI and PSII
containing chlorophyll molecules that are embedded in the thylakoid membrane
of the chloroplasts as integral membrane protein complexes. Starting point of
photosynthesis is the absorption of photons by the pigment molecules (chl a, chlb, phycobiliproteins, and carotenoids) of the antennae systems and the transfer of
energy of excited molecules to the reaction centers of PSI and PSII (Fig. 1). The
central chlorophyll molecule of the PSII, the first of the two photosystems activated
during this process, is excited by a previously excited molecule, in a type of energy
transfer that is called resonance energy transfer or excitation transfer. Promoted by
a Mn complex (an enzyme complex), the reaction center of the PSII gets electrons
from the cleavage of a water molecule, a reaction that produces O2 and protons H+.
The Use of Photosynthetic Fluorescence Parameters 89

The electrons from the water cleavage are subsequently transferred by a complex
system of acceptor and donor molecules: pheophytin (Pheo), plastoquinone A
(PQA) and B (PQB), the plastoquinone pool (PQ), and the cytochrome complex
to the PSI (Fig. 1). Finally, the excited molecules are transferred from the PSI to
ferredoxin (Fd), another acceptor molecule, which catalyzes the reduction of
NADP+, a phosphorylated derivate that carries reducing electrons. These energy-
rich products from photosynthesis are later used in the Calvin cycle to build up
hexoses and other organic matter [1]. The chl-a fluorescence techniques allow to
evaluate different photosynthetic processes occurring under light excitation.
3 Chl-a Fluorescence Analysis and Derived Parameters
Two types of chl-a fluorescence analysis have been developed and applied in
ecotoxicological studies: the “fast fluorescence induction kinetics” [32] and the
“slow fluorescence induction kinetics” [43].
3.1 The Fast Fluorescence Induction Kinetics: PEA Fluorometry
The rapid rise of fluorescence is measured with PEA and provides information on
various steps of the photosynthetic electron transport [32]. In the fast fluorescence
induction kinetics, the chl-a fluorescence transient follows a polyphasic pattern
of O–J–I–P electrons transients from the initial fluorescence level (Fo or O) to the
maximum fluorescence level (Fm or P) (Fig. 2). The rise from O (at 0.05 ms) to
the J phase (at 2 ms) is due to the net photochemical reduction of plastoquinone
(PQA–PQA) (photochemical phase). The J–I phase (at 30 ms) is due to the closure of
the remaining photosynthetic centers, and the I–P (ends about at 500 ms) is due to
the removal of plastoquinone quenching due to the reduction of PQ (non-
photochemical phase) [32]. The decrease in Fm and fluorescence levels at phases
H2O
Direc
tion
of in
crea
sing
ene
rgy
of e
-
Oxygen evolving complex(Mn complex)
2e-2e-
2e -
2e -Light
Light
P680 P700
P700*P680*
Cytochromeb6f
Pheo
PC
PQA - PQB
PSII PSI
Fd2NADP+ + 2H+
NADP+
reductase
2NADPH
2e -
1/2 O2 + 2H+
Fig. 1 Schematic overview of the z-scheme of electron transport between the two photosystems
(PSII and PSI) in the photosynthesis processes
90 N. Corcoll et al.

J and I is normally explained by the inhibition of the electron transport at the
electron donor side of PSII, which results in the accumulation of the excited
reaction center of PS II (P680*), a strong fluorescence quencher [44]. Thus the
fluorescence rise provides information on various steps of photosynthetic electron
transport [32]. The kinetics of OJIP transients obtained allows evaluating the toxic
effect of chemicals on specific characteristics of PSII as energy trapping processes
or antenna size. Besides, by using this fast fluorescence kinetics it is also possible to
calculate different photosynthetic parameters and the complementary area (CA)
[45]. The CA is a measure of the kinetics of fluorescence induction up to the P level
and it has been reported as a direct indicator of the PSII photochemistry [46]. CA
has been used for many years to assess the phytotoxicity of pollutants [40]. It is
reported that fast fluorescence induction kinetics can also allow the location of the
primary site of damage induced by environmental stress [47].
3.2 The Slow Fluorescence Induction Kinetics: StandardPAM Fluorometry
The slow fluorescence induction analyses are carried out by using PAM fluorome-
try. The so-called saturation pulse quenching analysis based on the principle that
light energy absorbed by PSII pigments can drive the photochemical energy
conversion at PSII reaction centers, be dissipated into heat, or be emitted in the
form of chl a fluorescence. As these three pathways of energy conversion are
complementary, the fluorescence yield may serve as a convenient indicator of
time- and state-dependent changes in the relative rates of photosynthesis and heat
dissipation. The PAM fluorescence method employs a combination of three different
types of light: modulated or measuring light (ML) ¼ 0.05 mmols photons m�2 s�1 in
msec pulses; actinic light (AL) ¼ from 1 to 600 mmols photons m�2 s�1; and strong
saturation pulses (SP) ¼ 8,000 mmols photons m�2 s�1 (Fig. 3), which allow the
adequate analysis of the fluorescence induction kinetics of photosynthetic organisms.
3.5
2.5
3
2
1.5
0.5
1
0
O
J
I
P
Log Time (ms)1 10 100 1000 10000 100000 1000000 10000000
Flu
roes
cenc
e yi
eld
(r.u
.)
Fig. 2 Typical rapid fluorescence kinetics measured with PEA fluorometer
The Use of Photosynthetic Fluorescence Parameters 91

By PAM fluorometry we can get two different types of measures: a biomass-related
ones (based on basal fluorescence emission) and a functional ones (based on changes
in fluorescence emission caused by strong saturation pulses).
During PAM fluorescence analysis, different information can be obtained from
a dark- or light-adapted sample.
3.2.1 Chlorophyll Fluorescence Characteristics in the Dark-Adapted State
In a dark-adapted phototropic organism modulated light with low energy is unable
to trigger electron transport; then the small fluorescence yield corresponds to the
constant fluorescence (Fo), which represents the light dissipation by excited
antennae of Chl-a molecules before the excitation energy is transferred to the
reaction centers of PSII [48–50].
The maximal fluorescence yield (Fm) is observed, when all PSII reaction centers
are closed after the application of a strong saturation pulse. The difference between
Fm and Fo is the maximal variable fluorescence yield (Fv). Fv/Fm is used as a
measure of the maximal photochemical efficiency of PSII (Fig. 3).
3.2.2 Chlorophyll Fluorescence Characteristics in the Light-Adapted State
Actinic light maintains the photosynthetic process in an active state, providing the
appropriate conditions to analyze fluorescence kinetics. The maximum fluores-
cence yield, reached under this condition, will determine the fluorescence transient
(F), where electron transport carriers are at a maximum reduced state. The
Fig. 3 Schematic representation of the slow fluorescence kinetics analysis by using the PAM
fluorometry. The different types of light are indicated (ML measuring light, AL actinic light, SPsaturation pulse). Modified from Schreiber [89]
92 N. Corcoll et al.

maximum variable fluorescence induced by a set of saturating flashes at a steady
state of fluorescence is represented by Fm0. The difference between Fm0 and F
indicates the variable fluorescence induced by actinic light at a steady state of
electron transport (DF). The Fo0 is the constant fluorescence when actinic light is
omitted (Fig. 3).
3.2.3 Parameters Used and Their Interpretation
Deriving from these dark and light chl-a fluorescence measurements several
parameters can be obtained (Table 1) and applied in ecotoxicological studies, to
assess the “health” status of the photosynthetic organisms through photosynthetic
activity measurements.
The minimal fluorescence yield (Fo) reflects the chl-a fluorescence emission of
all open reaction centers in a non-excited status. Fo can be used as a surrogate of
algal biomass since chlorophyll fluorescence is proportional to total chlorophyll
content [51, 52]. It is expected that Fo will decrease if toxic exposure causes
a reduction in the number of cells due to cell death (structural damage) or the
chlorophyll content of a sample. Biomass estimations based on Fo are not always
possible, losing linearity above a given biomass level if the thickness of the biofilms
is excessive producing self-shading [15, 53].
Table 1 Fluorescence parameters obtained by using PAM fluorometry
Parameter Name Equation References
ФPSII Maximal quantum yield ФPSII ¼ (Fm � Fo)/Fm Schreiber et al. [49] and Genty
et al. [54]
Ф0PSII Effective quantum yield Ф0
PSII ¼ (Fm0 � F)/Fm0 Schreiber et al. [49] and Genty
et al. [54]
qP Photochemical
quenching
qP ¼ (Fm0 � F)/
(Fm0 � Fo0)Schreiber et al. [49], Horton
et al. [57], and M€uller et al.[90]
qN Non-photochemical
quenching
qN ¼ 1 � [(Fm0 � Fo0)/(Fm � Fo)
Schreiber et al. [49], Horton
et al. [94], and M€uller et al.[90]
NPQ Non-photochemical
quenching
NPQ ¼ (Fm � Fm0)/Fm0
Bilger and Bj€orkman [91]
UQFrel Relative unquenched
fluorescence
UQFrel ¼ (F � Fo0)/(Fm0 � Fo0)
Juneau et al. [60]
Fv/2 Plastoquinone pool Fv/2 ¼ (Fm � Fo)/2 Bolhar-Nordenkampt and
Oquist [92]
Fo/Fv Efficiency of the
water-splitting
apparatus of PSII
Fo/Fv ¼ Fo/(Fm � Fo) Kriedemann et al. [93]
Fo Minimal fluorescence
yield
Serodio et al. [52] and
Rysgaard et al. [51]
The Use of Photosynthetic Fluorescence Parameters 93

The maximal or optimal quantum yield (ФPSII) measures the quantum yield of
PSII electron transport in a dark-adapted state (Table 1). It has been shown in many
studies that ФPSII can also be a measure of the quantum yield of photosynthesis
[4, 54]. It is an estimate of the potential maximal photosynthetic activity and it is
expected to be effected if a chemical produces alterations in the structure of the
photosynthetic apparatus (e.g., shade-adapted chloroplasts); in general this situation
occurs when biofilms are exposed to chemicals at high concentrations or during a
long-term exposure. The FPSII parameter could be named with other nomenclatures
or names in the bibliography: Fo [55], Fv/Fmax [18], photosynthetic capacity [20],
or photosynthetic activity [21]. In order to standardize nomenclatures we recom-
mend the use of FPSII.
The effective or operation quantum yield (Ф0PSII) measures the efficiency of
excitation energy capture by the open PSII reaction centers under light conditions
[49, 54], proportional to photosynthetic efficiency. A reduction of the Ф0PSII
indicates that the toxicant is reducing electron flow in the PSII. This parameter is
very sensitive to PSII-inhibiting herbicides, if they block the electron transport
flow (Table 1). The F0PSII parameter could be named with other nomenclatures
or names in the bibliography: FII [25], FPSII [56], yield or Y [28], photon yield
[26], photosynthetic efficiency at PSII or Yeff [29], or Yield II [53]. In order to
standardize nomenclatures the use of F0PSII is recommended.
The photochemical quenching (qP), which is determined by the redox state of
QA, the primary electron acceptor of PSII [4], represents the proportion of excita-
tion energy “trapped” by open PSII reaction centers used for electron transport [57]
(Table 1).
The non-photochemical quenching (qN) reflects the amount of light energy
dissipation inducing fluorescence quenching that involves nonradiative energy
process [57] (Table 1).
The non-photochemical quenching without measuring Fo0 (NPQ) is a simplified
non-photochemical quenching value, which assumed that NPQ is caused only by
one quenching factor [58], omitting other energy-consuming processes, not directly
involved in the PSII activity [59] (Table 1).
The relative unquenched fluorescence (UQDrel) is a parameter proposed by
Juneau et al. [60]. It is complementary to the relative quenching components qPreland qNrel proposed by Buschmann [58] that take into account the fraction of the
non-quenched fluorescence yield related to the proportion of closed PSI reactive
centers present under continuous irradiation (Table 1).
The plastoquinone pool (Fv/2) is a measure of the state of the pool of
plastoquinones. Its reduction was linked with inhibitory effects of metals on the
photosynthetic efficiency [61] (Table 1).
The efficiency of the water-splitting apparatus of PSII (Fo/Fv) reflects the stateof water-splitting this complex. Metal exposure may damage this apparatus [61]
(Table 1).
94 N. Corcoll et al.
3.2.4 Multiwavelengths PAM Fluorometry
The PAM fluorescence methodology is now available and applied in several
technical settings to monitor the influence of stress factors on microalgae photo-
synthesis (e.g., [95, 33, 36, 62]). In principle, this technique allows the researcher
to address different levels of biological complexity using the same fluorescence
parameters and was used in a comparative study by Schmitt-Jansen and
Altenburger [33]. For uniform suspensions of unicellular algae measurement of
variable chl-a fluorescence is a relatively straightforward exercise. Schreiber
et al. [36] used an ultrasensitive dual-channel chlorophyll fluorometer for the
assessment of diuron, deriving detection limits, sufficient for the demands of the
European Commission drinking water regulation (0.1 mg/L for each individual
substance).
Observation of variable fluorescence in biofilm communities, however, requires
distinction between the contributions from the different algal components with
respect to their differences in pigmentation and photosynthetic properties.
Recently, a microscopic setup became available enabling PAM chl-a fluorescence
measurements at a microscopic scale that allows excitation and detection of fluo-
rescence from single algal cells [95]. Therefore, the noninvasive assessment of
individual stress responses of cells in biofilms became possible. Another way to
address this challenge is to simultaneously use excitation light of different
wavelengths for excitation of the algal class-specific light harvesting complexes.
For instance, Chl b, which characterizes chlorophytes as a key pigment, shows
absorption peaks at 470 and 645 nm. Diatoms which are characterized by the key
pigments Chl c and carotenoids, especially fucoxanthin, can be studied by fluores-
cence excitation in the blue and green spectral range (400–665 nm). On the other
hand, in the case of cyanobacteria, fluorescence excitation in the blue and green is
weak, while strong excitation is observed around 620–640 nm, in the absorption
range of phycocyanin/allophycocyanin.
Using a four-wavelength excitation method, a differentiation of photosynthetic
parameters of microalgal communities between different spectral groups, e.g.,
chlorophytes, cyanophytes, and diatoms, seems possible [62]. This application
employs an array of light-emitting diodes (LED) to excite chlorophyll fluores-
cence at different wavelengths (470, 520, 645, and 665 nm). This particularity
gives the opportunity to deconvolute the overall fluorescence signal into the
contributions of algal groups [cyanobacteria-Fo(Bl), diatoms-Fo(Br), and green
algae-Fo(Gr)] from community samples, e.g., phytoplankton or biofilms, based on
the internal “reference excitation spectra” of a pure culture [36]. This application
has been validated in fluvial biofilms by Schmitt-Jansen and Altenburger [53].
Besides the provision of a relative measure of the fluorescence abundance of each
algal group it is possible to obtain values from fluorescence parameters specific of
each phototrophic group (green algae, diatoms, or cyanobacteria) present in the
community.
The Use of Photosynthetic Fluorescence Parameters 95

Beutler et al. [63] successfully applied a five-wavelength fluorometer to charac-
terize a depth profile of the plankton algal community of Lake Plußsee, Germany.
4 The Use of Fluorescence Parameters to Assess the Effects
of Toxicants on Biofilms
Chl-a fluorescence techniques based on PAM fluorometry have commonly been
used to assess the effects of chemicals on biofilms. More precisely, photosystems I
and II were recognized to be a good target for pesticides to control weed in
agriculture; therefore several herbicides were developed, blocking photosystems,
like the triazines or the phenylurea herbicides. The usefulness of fluorescence
parameters derived after multiturnover flashes has been demonstrated for herbicides
specifically inhibiting PSII activity in several studies [18, 19, 64–66]. On the other
hand, fast fluorescence techniques measured by plant efficient analysis (PEA) have
never been applied to assess chemical toxicity on biofilms. However, its use on
algal monocultures is well reported [40, 45, 67, 68]. The information provided by
PEA flurometers is different to that obtained by PAM fluorometry; the first allows
evaluating the toxic effects on PSII energy trapping and PSII antenna size. For
instance, Dewez et al. [68] assessed Cu and fludioxonil effects on Selenastrumobliquus by using PAM and PEA photosynthetic methods as well as by evaluating
different antioxidant enzymatic activities. They observed that Cu may alter the
energy storage in algae during photosynthesis but fludioxonil inhibitory effect
appeared not to be directly associated with photosynthetic electron transport as
seen for copper inhibition. By using the PEA method it was observed that the
fluorescence yields at J, I, and P transients were quenched under Cu exposure
(1–3 mg/L) and the authors attributed this disturbance on the energy trapping to
an inhibition of the PSII electrons transport via PQA, PQB, and the plastoquinone
pool. Also, they observed that copper altered the energy dissipation via the non-
photochemical energy dissipation (by PAM method) and the change of the struc-
tural organization of the antenna size via PSII light harvesting complex (by PEA
method). So, by using PEA and PAM fluorometers different but complementary
information was obtained to evaluate deeply Cu toxicity on photosynthesis pro-
cesses of S. obliquus.Several studies are presented in order to illustrate the pros and cons of the
application of PAM fluorometry technique on biofilm communities’ growth in the
laboratory to assess chemical toxicity of compounds with different MoA: PSII
inhibitors (Sect. 4.1), other photosynthetic inhibitors (Sect. 4.2), and toxicants
with unknown MoA on algae (Sect. 4.3). The use of PAM fluorometry to assess
chemical toxicity in field studies is presented in Sect. 4.4. PAM fluorometry gives
the opportunity to evaluate both functional and structural alterations in autotrophic
organisms. These alterations are related with the MoA of the toxicants as well as the
dose and the time of exposure.
96 N. Corcoll et al.

4.1 PSII Inhibitors
Pollutants with MoA directly interfering with the PSII are mainly represented by
organic herbicides (e.g., diuron, atrazine). Due to their specific MoA, studies
dealing with their toxicity commonly use photosynthetic endpoints. The inhibition
of the maximal and the effective quantum yield (FPSII, F0PSII) in biofilms exposed
to PSII inhibitors for short periods of time has been already demonstrated.
McClellan et al. [34] detected a reduction of the FPSII in biofilms exposed to diuron
(Table 2). Similar results have been obtained with atrazine, prometryn, and
isoproturon ([19, 33, 53]; see Table 2 for detailed information). The sensitivity of
biofilms to isoproturon under different light intensities was determined by Laviale
et al. [69], showing a clear reduction of photosynthesis (F0PSII and FPSII), and,
under dynamic light conditions, a clear reduction of the non-photochemical
quenching (NPQ) mechanisms was observed (Table 2). Effects of PSII inhibitors
on the biofilm structure are less reported, especially in the short-term toxicity
assessment. Schmitt-Jansen and Altenburger [18] found a 90% reduction of algal
biomass after 1 h of exposure to isoproturon (Table 2).
The chl-a fluorescence methods have also been applied to long-term toxicity
studies. Ricart et al. [29] analyzed the long-term effect of the herbicide diuron on
fluvial biofilms and detected a clear decrease of the F0PSII effective quantum
(Table 2). Ricart et al. [29] analyzed the long-term effect of the herbicide diuron
on fluvial biofilms and detected a clear decrease of the effective quantum (Table 2)
with increasing concentrations of diuron (Fig. 4), indicating a clear dose-dependent
effect, probably attributable to the MoA of the herbicide. A reduction of theFPSII of
biofilms was also observed by Tlili et al. [70] after 3 weeks of exposure to diuron
(Table 2). Schmitt-Jansen and Altenburger [18, 53] used these techniques to
evaluate the long-term effects of isoproturon to biofilm structure. They detected a
reduction in the algal biomass (measured as Fo) and a shift of the algal classes to a
dominance of green algae (Table 2). Effects of diuron on a simple food chain
(biofilm and grazers (snail Physella [Costatella] acuta)) have also been evaluated
using PAM fluorometry techniques. In a long-term experiment, Lopez-Doval et al.
[71] used F0PSII to monitor the physiological state of the biofilm, as well as to detect
the effect of diuron, grazers, and their interaction on the biofilm community.
A significant reduction in F0PSII was detected in both diuron and diuron + grazers
microcosms.
Chl-a fluorescence parameters have been used as a physiological endpoint to
investigate community adaptation following the pollution-induced community
tolerance (PICT) approach [72]. Briefly, the replacement of sensitive species by
tolerant ones driven by toxicant’s selection pressure is expected to increase the
EC50 of the community measured in acute dose–response tests using physiological
endpoints such as Ф0PSII. PICT of periphyton to isoproturon [18, 53], atrazine,
prometryn [19], and diuron [70] has been determined by testing inhibition ofФ0PSII
on pre-exposed and non-pre-exposed biofilm communities.
The Use of Photosynthetic Fluorescence Parameters 97

Table
2Summaryofstudiesapplyingchl-afluorescence
techniques
toassess
thetoxicityofPSIIinhibitors
onfluvialbiofilm
communities
Toxicant
Biofilm
community
Exposure
Conc.
ФPSII
Ф0 PSII
NPQ
Fo
Fo(Bl)
Fo(G
r)Fo(Br)
Reference
Diuron
Microcosm
sShort-term
0.4–100mg
/L�
��
McC
lellan
etal.[34]
Diuron
Microcosm
s29days
0.07–7mg
/L�
��
Ricartet
al.[29]
Diuron
Microcosm
s3weeks
10mg
/L�
�Tliliet
al.[70]
10mg
/L+PO43�
n.s.
Diuron
Microcosm
s29days
2mg
/L�
�Lopez-D
oval
etal.[71]
Atrazine
Microcosm
s1h
7.5–2,000mg
/L�
��
Schmitt-Jansenand
Altenburger
[19]
Prometryn
5–5,110mg
/L�
��
Isoproturon
2.4–3,120mg
/L�
��
Isoproturon
Microcosm
s1h
2.4–312mg
/L�
��
+�
��
Schmitt-Jansenand
Altenburger
[18]
Atrazine
Microcosm
s1h
7.5–2,000mg
/L�
��
Schmitt-Jansenand
Altenburger
[33]
Isoproturon
1h
2.4–312mg
/L�
��
Atrazine
Microcosm
s1h
7.5–2,000mg
/L�
��
Schmitt-Jansenand
Altenburger
[53]
Prometryn
2.5–320mg
/L�
��
Isoproturon
2.4–312mg
/L�
��
Isoproturon
Microcosm
s26days
2.4–156mg
/L�
�++
��
Isoproturon
Microcosm
s
(constantlight)
7h
0–2,000mg
/L�
��
��
n.s.
Laviale
etal.[69]
Microscosm
s
(dynam
iclight)
7h
2,6and20mg
/L�
��
��
+++
Thesignificantresponsesobserved
areindicated
by“�
”forinhibitionorby“+
”forincrease
anditsapproxim
atemagnitudeby:“�
”or“+
”ifitwas
slight
(10–30%
ofcontrol),by:“�
�”or“+
+”ifitwas
moderate(30–50%
ofcontrol)andby“�
��”
or“+
++”ifitwas
high(>
50%
ofcontrol)
n.s.notsignificant(p
>0.05)
98 N. Corcoll et al.

4.2 Other Photosynthetic Inhibitors
Chl-a fluorescence parameters have commonly been used to assess the toxicity of
chemicals affecting other processes than PSII electron transport. In these cases, the
obtained parameters may indicate secondary effects on the performance of the
photosynthetic apparatus or on algal biomass. For instance copper is a phytotoxic
chemical affecting the activity of photosystem II and electron transfer rates [61].
However, this metal is also known to cause the oxidation of sulphydryl groups of
enzymes leading to their inhibition [73] or to generate reactive oxygen species like
superoxide and hydroxyl radicals causing oxidative stress (for a review see [14])
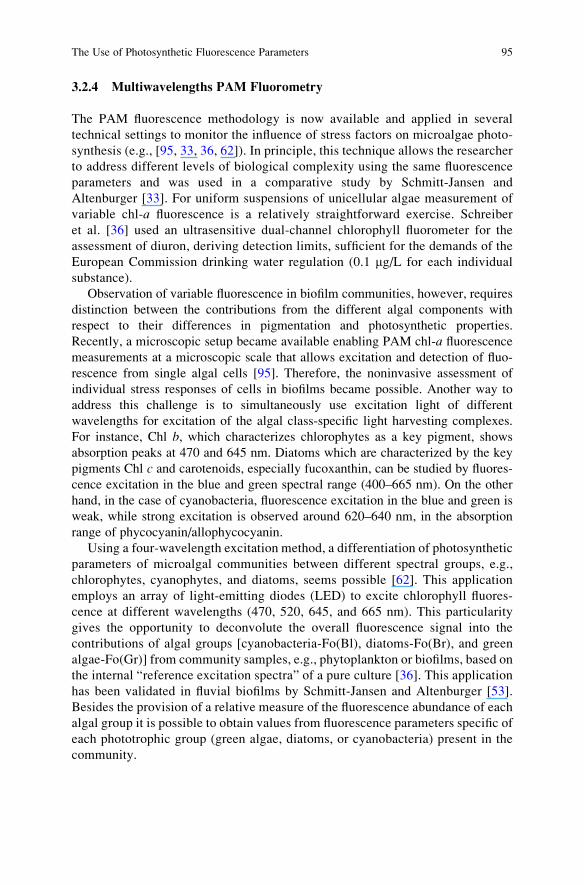
reducing growth as well as photosynthetic and respiratory activities [74]. Several
biofilm studies have used copper as model toxic compound (Table 3), applying in
many cases chl-a fluorescence parameters to assess biological responses. Serra et al.
[28] measured Ф0PSII to check the photosynthetic performance of biofilms during
the Cu retention experiment that lasted for few hours. Transient inhibition ofФ0PSII
was also observed by Corcoll et al. [31] after few hours of Zn exposure; however
this parameter recovered after longer exposure (Table 3).
Physiological chl-a parameters such as Ф0PSII may not consistently show the
effects caused by non-PSII inhibitors after longer exposure due to community
adaptation. Barranguet et al. [56] observed that biofilm exposed during 2 weeks to
Cu presented alterations in the Fo and that Ф0PSII was less affected. Barranguet
et al. [25] observed that the main factor regulating the sensitivity of biofilms to Cu
toxicity (based on the F0PSII endpoint) during short-term exposures was the
physical structure of the biofilm (package of cells and thickness), and not to the
species composition. These endpoints were used to show differences in sensitivity
between suspended cells and biofilm communities. Fo and Ф0PSII were also used
Fig. 4 Diuron effects on effective quantum yield of biofilm communities exposed to increasing
concentrations of the herbicide. Modified from Ricart et al. [29]
The Use of Photosynthetic Fluorescence Parameters 99
Table
3Summaryofstudiesapplyingchl-afluorescence
techniques
toassess
toxicityonfluvialbiofilm
communitiesofcompoundswithother
effectson
photosynthesis(differentfrom
PSIIinhibition)
Toxicant
Biofilm
community
Exposure
Conc.
ФPSII
Ф0 PSII
NPQ
Fo
Fo(Bl)
Fo(G
r)Fo(Br)
References
Cu
Microcosm
s24h;3days
445–1,905;
126mg
/L
�/�
��
��
Barranguet
etal.[25,56]
Zn
Microcosm
s72h
320mg
/Ln.s.
�n.s
n.s.
n.s.
n.s.
n.s.
Corcollet
al.[31]
5weeks
320mg
/L�
n.s.
��
��
��
n.s.
n.s.
�Cu
Microcosm
s6;16days
0–100mg
/L�
��
�Guasch
etal.
[12,27]
Cu,Zn,
Cu+Zn
Microcosm
s5days
636;6,356mg
/L�
n.s.
��
��
��
Garcıa-Meza
etal.[55]
Cu
Microcosm
s4weeks
30mg
/L+++
n.s.
��
�Serra
etal.[28]
noCuvs.Cu
pre-exposure
6h
100mg
/L�/
n.s.
n.s
Cu
Microcosm
s3weeks
30mg
/L�
Tliliet
al.[70]
30mg
/L+PO43�
n.s.
Significantresponsesobserved
areindicated
by“�
”forinhibitionorby“+
”forincrease
anditsapproxim
atemagnitudeby“�
”or“+
”ifitwas
slight(10–30%
ofcontrol),by“�
�”or“+
+”ifitwas
moderate(30–50%
ofcontrol)andby“�
��”
or“+
++”ifitwas
high(>
50%
ofcontrol)
n.s.notsignificant(p
>0.05)
100 N. Corcoll et al.

by Guasch et al. [12] and [55] to assess Cu and Cu plus Zn toxicity, respectively.
In both cases Fo appeared to be the most sensitive endpoint, whereas effective
concentrations based on Ф0PSII were always much higher (Table 3). In the second
example, multiwavelength fluorometers allowed following effects on the biomass
of the cyanobacteria and green-algae groups of the biofilm as well as their
respective ФPSII. Similarly, Serra et al. [28] demonstrated that community com-
position differed among biofilms with different Cu-exposure history. Community
changes were identified using multiwavelength fluorometry, whereas Cu adaptation
was assessed by comparing the Ф0PSII responses to short Cu exposure (Table 3).
Tlili et al. [70] used the ФPSII to evaluate the role of phosphorus on Cu toxicity on
biofilms. They observed that biofilms pre-exposed to Cu presented a lowerФPSII than
biofilms non-pre-exposed to Cu or pre-exposed to Cu plus phosphorus (Table 3).
4.3 Toxicants with Unknown Mode of Action on Algae
The impacts of personal care products and pharmaceuticals on the environment are
not generally well known [75] and its effects on fluvial biofilms have poorly been
investigated. Chemicals that damage membranes or proteins associated with photo-
synthetic electron transport or that inhibit any cellular process downstream of PSII,
such as carbon assimilation or respiration, will lead to excitation pressure on PSII
[76]. Therefore, chl-a fluorescence methods can also be used to assess the effects of
chemicals affecting metabolic processes not directly linked to photosynthetic electron
transport. This approach has recently been used to provide complementary endpoints
to evaluate direct and indirect effects of these compounds on biofilm [20, 21, 23].
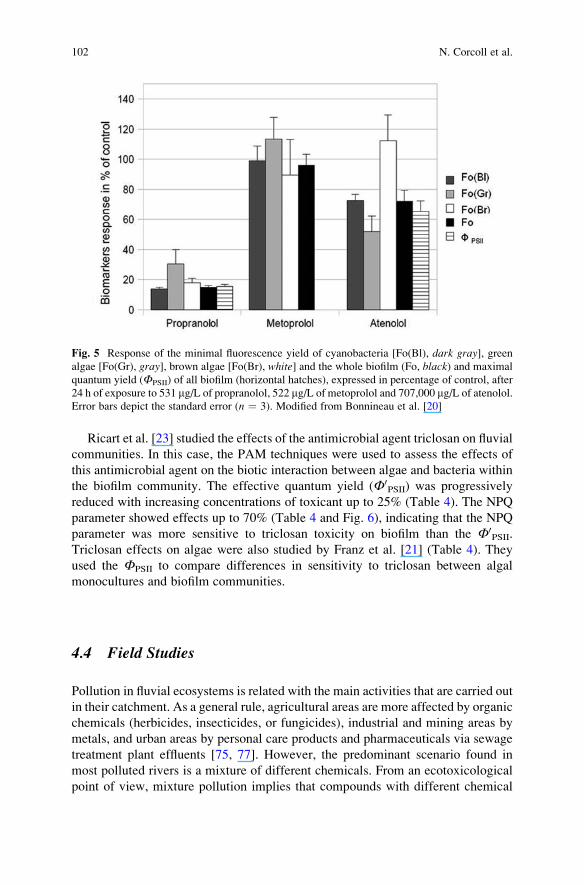
The acute toxicity of three b-blockers: metoprolol, propranolol, and atenolol on
fluvial biofilms was assessed by using several biomarkers, including chl-a fluores-
cence parameters measured with a multiwavelength PAM to evaluate toxic effects
on the autotrophic biofilm compartments (Fig. 5) [20]. They observed that propran-
olol was the most toxic for algae, causing 85% inhibition of Ф0PSII (photosynthetic
efficiency). Metoprolol was particularly toxic for bacteria and atenolol affected
similarly bacterial and algal compartments of the biofilm but to a lesser extent
(Table 4). Moreover, the use of chl-a fluorescence parameters for three algal groups
gave an interesting insight into the algal compartment (Fig. 5). The relative
contribution of the different algal groups was also used to obtain the effective
photosynthetic efficiency for each of them, using the fluorescence signal linked to
green algae, cyanobacteria, and diatoms. This approach allowed the detection of the
earlier sensitivity of cyanobacteria-Fo(Bl) compared to green-Fo(Gr) and brown
algae-Fo(Br) to propranolol. On the other hand, atenolol affected green algae and
cyanobacteria photosynthetic efficiencies while diatoms seemed resistant to this
toxic compound. Consequently, they concluded that the chl-a fluorescence
parameters are powerful tools within a multibiomarker approach to detect effects
on the phototrophic compartment of biofilms indicating potential effects on the
community structure.
The Use of Photosynthetic Fluorescence Parameters 101
Ricart et al. [23] studied the effects of the antimicrobial agent triclosan on fluvial
communities. In this case, the PAM techniques were used to assess the effects of
this antimicrobial agent on the biotic interaction between algae and bacteria within
the biofilm community. The effective quantum yield (Ф0PSII) was progressively
reduced with increasing concentrations of toxicant up to 25% (Table 4). The NPQ
parameter showed effects up to 70% (Table 4 and Fig. 6), indicating that the NPQ
parameter was more sensitive to triclosan toxicity on biofilm than the Ф0PSII.
Triclosan effects on algae were also studied by Franz et al. [21] (Table 4). They
used the ФPSII to compare differences in sensitivity to triclosan between algal
monocultures and biofilm communities.
4.4 Field Studies
Pollution in fluvial ecosystems is related with the main activities that are carried out
in their catchment. As a general rule, agricultural areas are more affected by organic
chemicals (herbicides, insecticides, or fungicides), industrial and mining areas by
metals, and urban areas by personal care products and pharmaceuticals via sewage
treatment plant effluents [75, 77]. However, the predominant scenario found in
most polluted rivers is a mixture of different chemicals. From an ecotoxicological
point of view, mixture pollution implies that compounds with different chemical
Fig. 5 Response of the minimal fluorescence yield of cyanobacteria [Fo(Bl), dark gray], greenalgae [Fo(Gr), gray], brown algae [Fo(Br), white] and the whole biofilm (Fo, black) and maximal
quantum yield (ФPSII) of all biofilm (horizontal hatches), expressed in percentage of control, after
24 h of exposure to 531 mg/L of propranolol, 522 mg/L of metoprolol and 707,000 mg/L of atenolol.
Error bars depict the standard error (n ¼ 3). Modified from Bonnineau et al. [20]
102 N. Corcoll et al.

Table
4Summaryofstudiesapplyingchl-afluorescence
techniques
toassess
thetoxicityoftoxicantswithan
unknownmodeofactiononfluvialbiofilm
communities
Toxicant
Biofilm
community
Exposure
(h)
Conc.
ФPSII
Ф0 PSII
NPQ
Fo
Ф0 PSIIFo
(Bl)
Ф0 PSIIFo
(Gr)
Ф0 PSIIFo
(Br)
Reference
Atenolol
Experim
ental
channels
24
707mg/L
��
��
�n.s.
Bonnineauet
al.
[20]
Propranolol
24
531mg
/L�
� ��
� ��
��
��
��
�
Metoprolol
24
522mg
/Ln.s.
n.s.
n.s.
n.s.
Triclosan
Aquaria
24
270–17,300mg
/
L
�� �
Franzet
al.[21]
Triclosan
Experim
ental
channels
48h
0.05–500mg
/L�
�� �
Ricartet
al.[23]
Thesignificantresponsesobserved
areindicated
by“�
”forinhibitionorby“+
”forincrease
anditsapproxim
atemagnitudeby“�
”or“+
”ifitwas
slight
(10–30%
ofcontrol),by“�
�”or“+
+”ifitwas
moderate(30–50%
ofcontrol)andby“�
��”
or“+
++”ifitwas
high(>
50%
ofcontrol)
n.s.notsignificant(p>0.05)
The Use of Photosynthetic Fluorescence Parameters 103

properties, MoA, and concentrations will coexist. Moreover, environmental factors
such as light, nutrients, or flow regime may also influence the fate and effects of
chemicals on fluvial communities. Due to its complexity, the effects of toxicants on
biofilm communities have been addressed by different methodological approaches
including periodic monitoring sampling, translocation experiments, or PICT
approaches. In addition, different biofilm targeting endpoints have been used,
including, in many cases, chl-a fluorescence parameters.
Ricart et al. [30] examined the presence of pesticides in the Llobregat river
basin (Barcelona, Spain) and their effects on benthic communities (invertebrates
and natural biofilms) (Table 5). Several biofilm metrics, including PAM
parameters, were used as response variables to identify possible cause–effect
relationships between pesticide pollution and biotic responses. Certain effects
of organophosphates and phenylureas in both structural (chl-a content and ФPSII)
and functional aspects (Ф0PSII) of the biofilm community were suggested. The
authors concluded that complemented with laboratory experiments, which are
needed to confirm causality, this approach could be successfully incorporated into
environmental risk assessments to better summarize biotic integrity and improve
the ecological management. In the Morcille River, located in a vineyard area of
France, several studies have been performed to evaluate pesticide effects on
biofilms [78–80] (Table 5). Morin et al. [78] studied the structural changes in
biofilm assemblages induced by the transfer of biofilm communities from two
contaminated sites to a reference site, expecting a recovery of the translocated
communities, either in structure or in diversity. The proportions of the different
algal groups in biofilms were estimated by in vivo chl-a fluorescence mea-
surements, observing that biofilm was mainly composed by diatoms before and
after translocation (Table 5). In the same river Pesce et al. [79] used the FPSII to
evaluate individual and mixture effects of diuron and its main metabolites
Fig. 6 Effects of triclosan on (a) effective quantum yield (Ф0PSII) and (b) non-photochemical
quenching (NPQ) of biofilms. Modified from Ricart et al. [23]
104 N. Corcoll et al.

Table5
Reviewoffieldstudieswherechl-afluorescence
techniques
havebeenapplied
toassesstheeffectsoftoxicantsonphotosynthesisperform
ance
offluvial
biofilm
communities
Toxicant
Modeof
action
River
Growth
substrate
Experim
entalconditions
ФPSII
Ф0 PSII
NPQ
Fo
Fo
(Bl)
Fo
(Gr)
Fo
(Br)
References
Cu
bTer
River,
Spain
Artificial
substrata
Biofilm
from
differentpollutedsites
(springandsummer)was
transported
tothelaboratory
for
Cuandatrazineshort-term
toxicity
tests
�� �
Navarro
etal.[26]
Atrazine
a�
� �
22pesticides
(mixture)
aandc
Llobregat
River,
Spain
Natural
biofilm
Field
monitoringofbiofilm
from
differentpollutedsitesduring
2years—
naturalexposure
��
Ricartet
al.
[30]
Atrazine
aSeven
stream
sfrom
Catalonia
Area,
Spain
Artificial
substrata
Biofilm
from
differentpollutedsites
andduringdifferentseasonswas
transported
tothelaboratory
for
atrazineandZnshort-term
toxicitytests
�� �
Guasch
etal.[15]
Zinc
b�
�
Atrazine
aOzanneRiver,
France
Artificial
substrata
Biofilm
from
differentpollutedsites
andduringdifferentseasonswas
transported
tothelaboratory
for
atrazineandisoproturontoxicity
tests—
PICTconcept
�Dorigoand
Leboulanger
[65]
Isoproturon
a�
Zn,Cd,Ni,
Fe(m
etal
pollution)
bMortRiver,
France
Natural
biofilm
Biofilm
from
differentpollutedsites
was
evaluated—naturalexposure
�Bonnineau
etal.[83]
Diuron,
DCPMU
and3,4-
DCA
aMorcille
River,
France
Artificial
substrata
Biofilm
from
differentpollutedsites,
presentinganaturalexposure,
weresampled
��
�Pesce
etal.
[79,80]
Biofilm
from
differentpollutedsites
was
transported
tothelaboratory
forshort-term
toxicitytests—
PICT
concept
��
�
(continued)
The Use of Photosynthetic Fluorescence Parameters 105

Table
5(continued)
Toxicant
Modeof
action
River
Growth
substrate
Experim
entalconditions
ФPSII
Ф0 PSII
NPQ
Fo
Fo
(Bl)
Fo
(Gr)
Fo
(Br)
References
Pesticides
aandb
Morcille
River,
France
Artificial
substrata
Biofilm
from
each
samplingsite
was
sampledbefore
translocation
tobestructurallycharacterized—
naturalexposure
n.s.
n.s.
n.s.
Morinet
al.
[78]
Prometryn
aElbeRiver,
Germany
Artificial
substrata
Translocationexperim
ent.Local
andtranslocatedbiofilm
was
transported
tothelaboratory
for
short-term
prometryntoxicity
tests—
PICTconcept,structural
characterization
��
�+
+�
�Rotter etal.[81]
Thesignificantresponsesobserved
areindicated
by“�
”forinhibitionorby“+
”forincrease
anditsapproxim
atemagnitudeby“�
”or“+
”ifitwas
slight
(10–30%
ofcontrol),by“�
�”or“+
+”ifitwas
moderate(30–50%
ofcontrol)andby“�
��”
or“+
++”ifitwas
high(>
50%
ofcontrol).Theterm
inology
usedformentioned
themodeofactionofeach
compoundwas:“a”forPSIIinhibitors,“b”forphotosynthesisinhibitors
notdirectlytargetingPSIIand“c”for
unknownmodeofactiononalgae
n.s.notsignificant(p
>0.05)
106 N. Corcoll et al.

(DCPMU and 3,4-DCA) on biofilms. They observed that diuron was the most
toxic of the evaluated compounds and that biofilms from contaminated sites
presented a higher tolerance to diuron and DCPMU than biofilms from a reference
site. In another study, it was investigated how closely diuron tolerance acquisi-
tion by photoautrophic biofilm communities could reflect their previous in situ
exposure to this herbicide. For this propose, the use of PICT (using the FPSII
as endpoint) together with multivariate statistical analyses was combined.
A spatiotemporal variation in diuron tolerance capacities of photoautotrophic
communities was observed, the biofilm from the most polluted site being the
most tolerant [80] (Table 5). Similar tolerance results were found by Rotter et al.
[81] in a study in the Elbe River where prometryn toxicity on biofilm was
evaluated by combining a translocation experiment and the PICT approach
(Table 5). They observed that biofilms from a polluted site presented a higher
EC50 (based on F0PSII measures) than biofilms from a reference site, suggesting a
prometryn induction tolerance. The proportion of each group (cyanobacteria,
green algae, and diatoms) in transferred and control biofilms was also measured
by PAM fluorometry. In other studies [65, 82]) also used the PICT approach to
investigate the toxicity of atrazine and isoproturon on biofilm from an herbicide
polluted river (Ozanne River, France) (Table 5). Sampling was performed at
different polluted sites and at different moments during the year. Using FPSII as
endpoint in short-term toxicity tests, differences in the EC50 between biofilms
naturally exposed to different levels of atrazine and isoproturon could be
observed.
Other field studies presenting organic and inorganic pollution were based on
short-term toxicity tests to evaluate biofilms’ sensitivity to toxic exposure [26] in
the Ter River (NE, Spain) (Table 5). It was concluded that the short-term toxicity
tests using the F0PSII as a physiological endpoint may provide an early pros-
pective quantification of the transient effects of a toxic compound on separate
communities, predict which of these effects are not reversible, and determine
their intensity. Guasch et al. [15] investigated the ecological and the structural
parameters influencing Zn and atrazine toxicity on biofilm communities by
testing the validity of the use of a short-term physiological method (based on
the F0PSII as microalgae endpoint) (Table 5). They concluded that short-term
toxicity tests seem to be pertinent to assess atrazine toxicity on biofilms. In
contrast, to assess Zn toxicity on biofilm the use of longer term toxicity tests
was proposed to overcome the influence that biofilm thickness exerts on Zn
diffusion and toxicity. Bonnineau et al. [83] assessed in situ the effects of metal
pollution on F0PSII in natural communities from the Riou-Mort river (France) by
comparing reference and polluted sites. Slight effects were observed based on
F0PSII and marked effects were observed based on antioxidant enzymatic acti-
vities, supporting the low sensitivity of F0PSII for the assessment in situ of the
chronic effects of metals.
Based on the field studies reported here, it can be concluded that in field studies
the responses of the chl-a fluorescence parameter could serve as an early warning
signal of biological effects after acute exposure to photosystem II inhibitors, but in
The Use of Photosynthetic Fluorescence Parameters 107

regular monitoring PAM fluorometry may show low sensitivity or give
false-negative signals [84] if the community is already adapted to the prevailing
toxic exposure conditions. Tolerance induction evaluations and multibiomarker
approaches, together with the use of appropriate multivariate statistical analyses,
may partially overcome this limitation [85].
5 General Discussion and Perspectives
The main aim of this chapter was to analyze the pros and cons of the use of chl-afluorescence techniques for water quality monitoring programs, based on biofilm
communities, in the context of the WFD.
The use chl-a fluorescence parameters as biomarkers of toxicity on biofilm
communities has increased in the last few years, illustrating their applicability to
show early and long-term effects of toxicants at community level using functional
and structural descriptors.
Differences in sensitivity are reported between chl-a fluorescence parameters.
Focusing on functional parameters, the effective quantum yield (F0PSII) seems to
detect the effects on algae of toxic compounds targeting the PSII. Its use is well
reported in both laboratory and field studies (Tables 2 and 5), supporting its use for
these types of compounds. On the other hand, its sensitivity to chemicals with a
mode of action different to the PSII is highly influenced by the time of exposure of
the toxicant (short-term vs. long-term exposure) (Tables 3–5). In short-term studies,
the F0PSII seems to be a sensitive endpoint of toxicity but in long-term studies its
sensitivity is often less obvious (Tables 3 and 5). This lack of sensitivity during
long-term exposures could be related with a development of biofilm tolerance.
Therefore, in long-term studies both in field and in laboratory conditions, supple-
mentary methodological approaches, such as PICT tests based on F0PSII may be
used to show community adaptation.
The maximal photosynthetic capacity of biofilms (FPSII) showed a similar
sensitivity to chemicals as the F0PSII. This parameter has been used more in
ecotoxicological studies than the F0PSII, probably due to its simplicity for being
measured. The FPSII, which is measured on dark-adapted samples, is independent
of the light conditions prevailing during the incubation period. Therefore, it is more
suitable than F0PSII for comparing results of experiments using different light
conditions [69]. The use of both photosynthetic parameters, F0PSII and FPSII,
provides more information than only using one of these parameters, since both
functional and structural alterations are evaluated.
The use of the NPQ parameter to assess chemical toxicity on biofilm is less
documented than those reported above and applied only in microcosm studies.
However, its use is promising due to its sensitivity to different types of toxicants,
and also due to its complementarity to the more classical photosynthetic related
parameters (F0PSII and FPSII) [23, 31, 69]. However, as the activation of the NPQ
processes is restricted to a very specific period of time (from minutes to few hours
108 N. Corcoll et al.

after the stress started), its use seems to be restricted to evaluate short-term toxicity.
On the other hand, its sensitivity has also been observed in long-term studies. In
these cases, it was linked to structural damage in the photosynthetic apparatus,
specifically a NPQ reduction as a result of a modification of accessory pigments
where NPQ processes occur [23, 31].
Finally, the use of the fast fluorescence techniques by PEA to assess chemical
toxicity on biofilms is also recommended, indeed not yet applied. As this tech-
nique gives information about the kinetics of OJIP transients (Fig. 2), its applica-
tion on biofilm could contribute to detect toxic effect of the PSII energy trapping
or PSII antenna size and by this way complement the information obtained by
PAM fluorometry. Its application on future ecotoxicological biofilm studies could
be of special interest in studies focusing on the confirmation of the MoA of
a determinate chemical on the photosynthetic processes of species composing
biofilm community.
Concerning more structural chl-a fluorescence parameters, the minimal fluores-
cence parameter (Fo) has been applied for monitoring algal biomass (Tables 2–5)
and biofilm growth rate [28, 31] in microcosms and field studies. It can be
considered as a global indicator, which integrates effects of chemicals on different
cellular metabolisms causing pigment damage and cell death. It has been success-
fully applied in ecotoxicological studies focusing on compounds that damage
photosynthetic processes without targeting the PSII (Table 3). Since Fo is
influenced by measuring conditions: gain, distance between sensor and the biofilm
sample, or the measuring light intensity, absolute values are difficult to compare
between different studies without using the same calibration. However, toxic
effects on Fo, in ecotoxicological studies, are usually reported in comparison
to a non-exposed community (in relative terms) to avoid this limitation. The
measurements of Fo may present other limitations not related to the algal biomass
or biofilm thickness. Fo may increase if the addition of a herbicide causes a transfer
of the electron on PQB to the primary quinine acceptor (PQA) and displacement of
PQB by the herbicide (Fig. 1); the reduced PQA leads to a higher Fo [86]. Conse-
quently an overestimation of Fo could occur. Also, it is known that some chemicals
emit fluorescence under excitation light (e.g., DCMU) that could not be distin-
guished from the fluorescence emitted from excited chl-a (Fo measure). In these
cases, the use of Fo to assess algal biomass is not recommended. In field
applications, this phenomenon could play an important role, since pollution is
often due to a mixture of compounds of unknown origin. On the other hand, the
greening effects could also contribute to limit the use of Fo for measuring algal
biomass or algal growth. This phenomenon may occur due to an increase in the
number of chl-a molecules per unit of cell, without increasing the number of cells
[29, 87]. This situation could produce an increase of Fo values with no increase in
the number of cells.
A significant portion of the ecotoxicological studies included in this chapter has
incorporated the deconvolution of the chl-a fluorescence signal into the contribu-
tion of the main autotrophic groups (Tables 2–5). These measurements allow
the main autotrophic groups of biofilms (structural approach) to be characterized.
The Use of Photosynthetic Fluorescence Parameters 109

Nowadays, PAM fluorometers which incorporate a four-wavelength excitation
method to deconvolute these photosynthetic parameters of microalgal communities
[Fo(Bl), Fo(Gr), and Fo(Br)] by incorporating spectral groups based on a single
species pigment spectra. This calibration could be improved in the future if spectra
used for calibrating the fluorometer are based on a mix of species from each group,
based on the key species of each autotrophic group. This procedure could probably
help to decrease uncertainty in these measurements.
6 Conclusions
Biofilms or periphyton communities are recognized for the Water Framework
Directive (WFD, Directive 2000/60/EC) as a BQE. The use of chl-a fluorescence
parameters as biofilm biomarkers allows to obtain a community approach which is
much closer to the processes of an ecosystem than the use of single species tests. In
fluvial ecosystems, the use of chl-a fluorescence parameters as a complementary set
of biofilm biomarkers to the more traditional diatom indices applied so far is
recommended due to its capacity to provide different warning signals of early
and late toxicity effects. Its application is of special interest in the context of the
WFD, where the development of new structural and functional parameters from the
BQEs is required [88].
Acknowledgments The authors would like to thank the authors of publications [20, 23, 29] to
give us the permission to use some of their figures to illustrate PAM applications on biofilms. Also
we thank Ulrich Schreiber to give us the permission to use a figure of his publication [89] to
illustrate the typical chl-a fluorescence kinetics. This study was financed by the European project
KEYBIOEFFECTS (MRTN-CT-2006-035695) and the Spanish project FLUVIALMUL-
TISTRESS (CTM2009-14111-CO2-01).
References
1. Taiz L, Zeiger E (eds) (1999) Physiologie der Pflanzen. Spektrum Akad. Vlg., Heidelberg
2. Juneau P, Dewez D, Matsui S, Kim SG, Popovic R (2001) Evaluation of different algal species
sensitivity to mercury and metolachlor by PAM-fluorometry. Chemosphere 45:589–598
3. Krause GH,Weis E (1991) Chlorophyll fluorescence and photosynthesis: the basics. Annu Rev
Plant Physiol 42:313–349
4. Schreiber U, Bilger W, Neubaurer C (1994) Chlorophyll fluorescence as a non-invasive
indicator for rapid assessment of in vivo photosynthesis. In: Schulze ED, Calswell MM
(eds) Ecophysiology of photosynthesis. Springer, Berlin, pp 49–70
5. Kautsky H, Franck U (1943) Chlorophyll fluoreszenz und Kohlens€aureassimilation. Biochem-
istry 315:139–232
6. Kautsky H, Appel W, Amann H (1960) Die Fluoreszenzkurve und die Photochemie der
Pflanze. Biochemistry 332:277–292
7. Sabater S, Admiraal W (2005) Periphyton as Biological Indicators in Managed Aquatic
Ecosystems. Periphyton: Ecology, Exploitation and Management. Cambridge, Massachusetts:
Azim ME, Verdegem MCJ, AA van Dam, MCM Beveridge (eds.), pp. 159–177
110 N. Corcoll et al.

8. Clements WH, Newman MC (2002) Community ecotoxicology. Wiley, West Sussex, p 336
9. Guasch H, Serra A, Corcoll N, Bonet B, Leira M (2010) Metal ecotoxicology in fluvial
biofilms: potential influence of water scarcity. In: Sabater S, Barcelo D (eds) Water scarcity
in the Mediterranean. Perspecives under global change. Springer, Berlin, pp 41–54
10. Freeman C, Lock MA (1995) The biofilm polysaccharide matrix—a buffer against changing
organic substrate supply. Limnol Oceanogr 40:273–278
11. Gray BR, Hill WR (1995) Nickel sorption by periphyton exposed to different light intensities.
North Am Benthol Soc 14:29–305
12. Guasch H, Paulsson M, Sabater S (2002) Effect of copper on algal communities from
oligotrophic calcareous streams. J Phycol 38:241–248
13. Ivorra N, Barranguet C, Jonker M, Kraak MHS, Admiraal W (2002) Metal-induced tolerance
in the freshwater microbenthic diatom Gomphonema parvulum. Environ Pollut 16:147–157
14. Pinto J, Sigaud-Kutner TCS, Leitao MAS, Okamoto OK, Morse D, Colepicolo P (2003) Heavy
metal-induced oxidative stress in algae. J Phycol 39:1008–1018
15. Guasch H, Admiraal W, Sabater S (2003) Contrasting effects of organic and inorganic
toxicants on freshwater periphyton. Aquat Toxicol 64:165–175
16. Leboulanger C, Rimet F, Heme de Lacotte M, Berard A (2001) Effects of atrazine and
nicosulfuron on freshwater microalgae. Environ Int 26:131–135
17. Pesce S, Fajon C, Bardot C, Bonnemoy F, Portelli C, Bohatier J (2006) Effect of the
phenylurea herbicide diuron on natural riverine microbial communities in an experimental
study. Aquat Toxicol 78:303–314
18. Schmitt-Jansen M, Altenburger R (2005) Toxic effects of isoproturon on periphyton
communities—a microcosm study. Estuar Coast Shelf Sci 62:539–545
19. Schmitt-Jansen M, Altenburger R (2005) Predicting and observing responses of algal
communities to photosystem II-herbicide exposure using pollution-induced community toler-
ance and species-sensitivity distributions. Environ Toxicol Chem 24:304–312
20. Bonnineau C, Guasch H, Proia L, Ricart M, Geiszinger A, Romanı A, Sabater S (2010) Fluvial
biofilms: a pertinent tool to assess b-blockers toxicity. Aquat Toxicol 96:225–23321. Franz S, Altenburger R, Heilmeier H, Schmitt-Jansen M (2008) What contributes to the
sensitivity of microalgae to triclosan? Aquat Toxicol 90:102–108
22. Lawrence JR, Swerhone GDW, Wassenaar LI, Neu TR (2005) Effects of selected
pharmaceuticals on riverine biofilm communities. Can J Microbiol 51:655–669
23. Ricart M, Guasch H, Alberch M, Barcelo D, Bonnineau C, Farre M, Ferrer J, Geiszinger A,
Morin S, Proia L, Ricciardi F, Romanı AM, Sala L, Sureda D, Sabater S (2010) Triclosan
persistence through wastewater treatment plants and its potential toxic effects on river
biofilms. Aquat Toxicol 100:346–353
24. Sabater S, Guasch H, Ricart M, Romanı A, Vidal G, Kl€under C, Schmitt-Jansen M (2007)
Monitoring the effect of chemicals on biological communities. The biofilm as an interface.
Anal Bioanal Chem 387:1425–1434
25. Barranguet C, Charantoni E, Pland M, Admiraal W (2000) Short-term response of monospe-
cific and natural algal biofilms to copper exposure. Eur J Phycol 35:397–406
26. Navarro E, Guasch H, Sabater S (2002) Use of microbenthic algal communities in ecotoxico-
logical tests for the assessment of water quality: the Ter river case study. J Appl Phycol 14:41–48
27. Guasch H, Navarro E, Serra A, Sabater S (2004) Phosphate limitation influences the sensitivity
to copper in periphytic algae. Freshw Biol 49:463–473
28. Serra A, Corcoll N, Guasch H (2009) Copper accumulation and toxicity in fluvial periphyton.
Chemosphere 5:633–641
29. Ricart M, Guasch H, Barcelo D, Geiszinger A, Lopez De Alda M, Romanı AM, Vidal G,
Villagrasa M, Sabater S (2009) Effects of low concentrations of the phenylurea herbicide
diuron on biofilm algae and bacteria. Chemosphere 76:1392–1401
30. Ricart M, Guasch H, Barcelo D, Brix R, Conceicao MH, Geiszinger A, Lopez De Alda MJ,
Lopez-Doval JC, Munoz I, Romanı AM, Villagrasa M, Sabater S (2010) Primary and complex
stressors in polluted Mediterranean rivers: pesticide effects on biological communities.
J Hydrol 383:52–61
The Use of Photosynthetic Fluorescence Parameters 111

31. Corcoll N, Bonet B, Leira M, Guasch H (2011) Chl-a fluorescence parameters as biomarkers of
metal toxicity in fluvial periphyton: an experimental study. Hydrobiologia 673:119–136
32. Strasser BJ (1997) Donor side capacity of photosystem II probed by chlorophyll a fluorescence
transients. Photosynth Res 52:147–155
33. Schmitt-Jansen M, Altenburger R (2007) The use of pulse-amplitude modulated (PAM)
fluorescence-based methods to evaluate effects of herbicides in microalgal systems of different
complexity. Toxicol Environ Chem 89:665–681
34. McClellan K, Altenburger R, Schmitt-Jansen M (2008) Pollution-induced community
tolerance as a measure of species interaction in toxicity assessment. J Appl Ecol 45:1514–1522
35. Schreiber U, Quayle P, Schmidt S, Escher I, Mueller JF (2007) Methodology and evaluation of
a highly sensitive algae toxicity test based on multiwall chlorophyll fluorescence imaging.
Biosens Bioelectron 22:2554–2563
36. Schreiber U, M€uller JF, Haugg A, Gademann R (2002) New type of dual-channel PAM
chlorophyll fluorometer for highly sensitive water toxicity biotests. Photosynth Res 74:317–330
37. Coquery M, Morin A, Becue A, Lepot B (2005) Priority substances of the European Water
Framework Directive: analytical challenges in monitoring water quality. Trac-Trends Anal
Chem 24:2
38. Farre M, Petrovica M, Gros M, Kosjekc T, Martinez H, Osvald P, Loos R, Le Menach K,
Budzinski H, De Alencastrog F, M€uller J, Knepper T, Finki G, Ternes TA, Zuccato E, Kormali
P, Gans O, Rodil R, Quintana JB, Pastori F, Gentili A, Barcelo D (2008) First interlaboratory
exercise on non-steroidal anti-inflammatory drugs analysis in environmental samples. Talanta
76:580–590
39. Furse MT, Hering D, Brabec K, Buffagui A, Sandin L, Verdouschot PFM (eds) (2006) The
Ecological status of European Rivers: evaluating and intercalibration of assessment methods.
Hydrobiologia 566: 3–29
40. Samson G, Morisette JC, Popovic R (1988) Copper quenching of the variable fluorescence in
Dunaliella tertiolecta. New evidence for a copper inhibition effect on PSII photoinhibitory.
Photochem Photobiol 48:329–332
41. Singh DP, Khare P, Bisen PS (1989) Effects of Ni2+, Hg2+ and Cu2+ on growth, oxygen
evolution and photosynthetic electron transport in Cylindrospermum IU 942. Plant Physiol
134:406–412
42. Ralph PJ, Smith RA, Macinnis-Ng CMO, Seery CR (2007) Use of fluorescence-based ecotox-
icological bioassays in monitoring toxicants and pollution in aquatic systems: review. Toxicol
Environ Chem 89:589–607
43. Schreiber U (1998) Chlorophyll fluorescence: new instruments for special applications.
In: Garab G (ed) Photosynthesis: mechanisms and effects, vol V. Kluwer, Dordrecht,
pp 4253–4258
44. Govindjee R (1995) Sixty-three years since Kautsky: chlorophyll a fluorescence. Aust J Plant
Physiol 22:131–160
45. Melis A, Homann PH (1975) Kinetic analysis of the fluorescence in 3-(3,4-dichlorophyenyl)-1,1
dimethylurea poisoned chloroplasts. Photochem Photobiol 21:431–437
46. Melis A, Schreiber U (1979) The kinetic relationship between the absorbance change, the
reduction of Q (DA320) and the variable fluorescence yield change in chloroplasts at room
temperature. Acta Biochim Biophys 547:47–57
47. Lu CM, Chau CW, Zhang JH (2000) Acute toxicity of excess mercury on the photosynthetic
performance of cyanobacterium, S. platensis—assessment by chlorophyll fluorescence analy-
sis. Chemosphere 41:191–196
48. Havaux M, Strasser RJ, Greppin H (1991) A theoretical and experimental analysis of the qP
and qN coefficients of chlorophyll fluorescence quenching and their relation to photochemical
and nonphotochemical events. Photosynth Res 27:41–55
49. Schreiber U, Schliwa U, Bilger W (1986) Continuous recording of photochemical and non-
photochemical chlorophyll fluorescence quenching with a new type of modulation fluorome-
ter. Photosynth Res 10:51–62
112 N. Corcoll et al.

50. Srivastava A, Greppin H, Strasser R (1995) The steady state chlorophyll a fluorescence
exhibits in vivo an optimum as function of light intensity which reflects the physiological
state of the plant. Plant Cell Physiol 36:839–848
51. Rysgaard S, Kuhl M, Glud RN, Hansen JW (2001) Biomass, production and horizontal
patchiness of sea ice algae in a high-Arctic fjord (Young Sound, NE Greenland). Mar Ecol
Prog Ser 223:15–26
52. Serodio J, Silva JM, Catarino F (1997) Nondestructive tracing of migratory rhythms of
intertidal benthic microalgae using in vivo chlorophyll a fluorescence. J Phycol 33:542–553
53. Schmitt-Jansen M, Altenburger R (2008) Community-level microalgal toxicity assessment by
multiwavelength-excitation PAM fluorometry. Aquat Toxicol 86:49–58
54. Genty B, Briantais JM, Baker NR (1989) The relationship between the quantum yield of
photosynthetic electron transport and quenching of chlorophyll fluorescence. Acta Biochim
Biophys 99:87–92
55. Garcıa-Meza C, Barranguet C, Admiraal W (2005) Biofilm formation by algae as a mechanism
for surviving on mine tailing. Environ Toxicol Chem 3:575–581
56. Barranguet C, Van den Ende FP, Rutgers M, Breure AM, Greijdanus M, Sinke JJ, Admiraal W
(2003) Copper-induced modifications of the trophic relations in riverine algal-bacterial
biofilms. Environ Toxicol Chem 22:1340–1349
57. Horton P, Ruban AV, Young AJ (1999) Regulation of the structure and function of the light
harvesting complexes of photosytem II by the xanthophyll cycle. In: Frank HA, Young AJ,
Cogdell RJ (eds) The photochemistry of carotenoids. Kluwer, Dordrecht, pp 271–291
58. Buschmann C (1995) Variation of the quenching of chlorophyll fluorescence under different
intensities of the actinic light in wild-type plants of tabacco and in a Aurea mutant deficient of
light-harvesting-complex. Plant Physiol 145:245–252
59. Pospısil P (1997) Mechanisms of non-photochemical chlorophyll fluorescence quenching in
higher plants. Photosynthetica 34:343–355
60. Juneau P, Green BR, Harrison PJ (2005) Simulation of Pulse-Amplitude-Modulated (PAM)
fluorescence: limitations of some PAM-parameters in studying environmental stress effects.
Photosynthetica 43:75–83
61. Mallick N, Mohn FH (2003) Use of chlorophyll fluorescence in metalstress research: a case
study with the green microalga Scenedesmus. Ecotoxicol Environ Saf 55:64–69
62. Kolbowski J, Schreiber U (1995) Computer-controlled phytoplankton analyzer based on a
4-wavelengths PAM chlorophyll fluorometer. In: Mathis P (ed) Photosynthesis: from light to
biosphere, vol 5. Kluwer, Dordrecht, pp 825–828
63. Beutler M, Wiltshire KH, Meyer B, Moldaenke C, L€uring C, Meyerh€ofer M, Hansen UP, Dau
H (2002) A fluorometric method for the differentiation of algal populations in vivo and in situ.
Photosynth Res 72:39–53
64. Conrad R, Buchel C, Wilhelm C, Arsalane W, Berkaloff C, Duval JC (1993) Changes in yield
in-vivo fluorescence of chlorophyll a as a tool for selective herbicide monitoring. J Appl
Phycol 5:505–516
65. Dorigo U, Leboulanger C (2001) A PAM fluorescence-based method for assessing the effects
of photosystem II herbicides on freshwater periphyton. J Appl Phycol 13:509–515
66. Trapmann S, Etxebarria N, Schnabl H, Grobecker K (1998) Progress in herbicide determina-
tion with the thylakoid bioassay. Environ Sci Pollut Res Int 5:17–20
67. Dewez D, Marchand M, Eullaffroy P, Popovic R (2002) Evaluation of the effects of diuron and
its derivatives on Lemna gibba using a fluorescence toxicity index. Environ Toxicol
17:493–501
68. Dewez D, Geoffroy L, Vernet G, Popovic R (2005) Determination of photosynthetic and
enzymatic biomarkers sensitivity used to evaluate toxic effects of copper and fludioxonil in
alga Scenedesmus obliquus. Aquat Toxicol 74:150–15969. Laviale M, Prygiel J, Creach A (2010) Light modulated toxicity of isoproturon toward natural
stream periphyton photosynthesis: a comparison between constant and dynamic light
conditions. Aquat Toxicol 97:334–342
The Use of Photosynthetic Fluorescence Parameters 113

70. Tlili A, Berard A, Roulier JL, Volat B, Montuelle B (2010) PO43� dependence of the tolerance
of autotrophic and heterotrophic biofilm communities to copper and diuron. Aquat Toxicol
98:165–177
71. Lopez-Doval JC, Ricart M, Guasch H, Romanı AM, Sabater S, Munoz I (2010) Does grazing
pressure modify diuron toxicity in a biofilm community? Arch Environ Contam Toxicol
58:955–962
72. Blanck H, W€ankberg SA, Molander S (1988) Pollution-induced community tolerance—a new
ecotoxicological tool. In: Cairs J Jr, Pratt JR (eds) Functional testing of aquatic biota for
estimating hazards of chemicals, 988. ASTM STP, Philadelphia, PA, pp 219–230
73. Teisseire H, Guy V (2000) Copper-induced changes in antioxidant enzymes activities in fronds
of duckweed (Leman minor). Plant Sci 153:65–72
74. Nalewajko C, Olaveson MM (1994) Differential responses of growth, photosynthesis, respira-
tion, and phosphate uptake to copper in copper-tolerant and copper-intolerant strains of
Scenedesmus acutus (Chlorophyceae). Can J Bot 73:1295–1303
75. Halling-Sørensen B, Nors Nielsen S, Lanzky PF, Ingerslev F, Holten L€utzhoff HC, JorgensenSE (1998) Occurrence, fate, and effects of pharmaceutical substances in the environment—A
review. Chemosphere 36:357–393
76. Marwood CA, Solomon KR, Greenberg BM (2001) Chlorophyll fluorescence as a bioindicator
of effects on growth in aquatic macrophytes from mixtures of polycyclic aromatic
hydrocarbons. Environ Toxicol Chem 20:890–898
77. Metcalfe CD, Koenig BG, Bennie DT, Servos M, Ternes TA (2003) Occurrence of neutral and
acidic drugs in the effluents of Canadian seawater treatment plants. Environ Toxicol Chem
22:2872–2880
78. Morin S, Pesce S, Tlili A, Coste A, Montuelle B (2010) Recovery potential of periphytic
communities in ariver impacted by a vineyard watershed. Ecol Indic 10:419–426
79. Pesce S, Lissalde S, Lavieille D, Margoum C, Mazzella N, Roubeix V, Montuelle B (2010)
Evaluation of single and joint toxic effects of diuron and its main metabolites on natural
phototrophic biofilms using a pollution-induced community tolerance (PICT) approach. Aquat
Toxicol 99:492–499
80. Pesce S, Margoum C, Montuelle B (2010) In situ relationship between spatio-temporal
variations in diuron concentrations and phtotrophic biofilm tolerance in a contaminated
river. Water Res 44:1941–1949
81. Rotter S, Sans-Piche F, Streck G, Altenburger R, Schmitt-Jansen M (2011) Active bio-
monitoring of contamination in aquatic systems—an in situ translocation experiment applying
the PICT concept. Aquat Toxicol 101:228–236
82. Dorigo U, Bourrain X, Berard A, Leboulanger C (2004) Seasonal changes in the sensitivity of
river microalgae to atrazine and isoproturon along a contamination gradient. Sci Total Environ
318:101–114
83. Bonnineau C, Bonet B, Corcoll N, Guasch H (2011) Catalase in fluvial biofilms: a comparison
between different extraction methods and example of application in a metal-polluted river.
Ecotoxicology 20(1):293–303
84. Guasch H, Bonet B, Bonnineau C, Corcoll N, Lopez-Doval JC, Munoz I, Ricart M, Serra A,
Clements W (2012) How to link field observations with causality? Field and experimental
approaches linking chemical pollution with ecological alterations. In: Guasch H, Ginebreda A,
Geiszinger A (eds) Emerging and priority pollutants in rivers, vol 19, The handbook of
environmental chemistry. Springer, Heidelberg
85. Munoz I, Sabater S, Barata C (2012) Evaluating ecological integrity in multi-stressed rivers:
from the currently used biotic indices to newly developed approaches using biofilms and
invertebrates. In: Guasch H, Ginebreda A, Geiszinger A (eds) Emerging and priority pollutants
in rivers, vol 19, The handbook of environmental chemistry. Springer, Heidelberg
86. Hiraki M, van Rensen JJ, Vredenberg WJ, Wakabayashi K (2003) Characterization of the
alterations of the chlorophyll a fluorescence induction curve after addition of Photosystem II
inhibiting herbicides font. Photosynth Res 78:35–46
114 N. Corcoll et al.

87. Guasch H, Munoz I, Roses N, Sabater S (1997) Changes in atrazine toxicity throughout
succession of stream periphyton communities. J Appl Phycol 9:137–146
88. Johnson RK, Hering D, Furse MT, Verdouschot PFM (2006) Indicators of ecological change:
comparison of the early response of four organism groups to stress gradients. Hydrobiologia
566:139–152
89. Schreiber U (2004) Pulse-amplitude-modulation (PAM) fluorometry and saturation pulse
method: an overview. In: Papageorgiou GC, Govindjee R (eds) Chlorophyll fluorescence: a
signature of photosynthesis. Springer, The Netherlands, pp 279–319
90. M€uller P, Li XP, Niyogi KK (2001) Non-photochemical quenching. A response to excess light
energy. Plant Physiol 125:1558–1566
91. Bilger W, Bj€orkman O (1990) Role of the xanthophyll cycle in photoprotection elucidated by
measurements of light-induced absorbance changes, fluorescence and photosynthesis in leaves
of Hedera canariensis. Photosynth Res 25:173–185
92. Bolhar-Nordenkampt HR, Oquist G (1993) Chlorophyll fluorescence as a tool in photosynthe-
sis research. In: Hall DO, Scurlock JMO, Bolhar-Nordenkampf HR, Leegood RC, Long SP
(eds) Photosynthesis and production in a changing environment: a field and laboratory manual.
Chapman & Hall, London, pp 193–206
93. Kriedemann PF, Graham RD, Wiskich JT (1985) Photosynthetic dysfunction and in vivo
chlorophyll a fluorescence from manganese-deficient wheat leaves. Aust J Agric Res
36:157–169
94. Horton P, Ruban AV, Walters RG (1996) Regulation of light harvesting in green algae. Annu.
Rev. Plant Physiol. Plant Mol. Biol. 47:655–684
95. Schreiber U (1998) Chlorophyll fluorescence: new instruments for special applications. In
Grab, G. [Ed] Photosynthesis: Mechanisms and Effects. Vol V. Kluwer Academic Publishers,
Dordrecht, pp 4258–8
The Use of Photosynthetic Fluorescence Parameters 115