The Effective Temperatures of Mid‐O Stars
16
THE EFFECTIVE TEMPERATURES OF MID-O STARS 1 Luciana Bianchi 2 and Miriam Garcia 2,3 Received 2002 June 6; accepted 2002 August 12 ABSTRACT We derived photospheric parameters, mass-loss rates, and wind velocities of Galactic O6–O7 stars by ana- lyzing high-resolution spectra in the far-UV and UV ranges with line-blanketed, hydrodynamic, non-LTE spherical models. We combined spectra from the Far Ultraviolet Spectroscopic Explorer (FUSE ) in the range 905–1187 A ˚ and International Ultraviolet Explorer (IUE ) archival spectra (1150–3250 A ˚ ) and used the WM- BASIC code of Pauldrach et al. to compute model spectra. Lines in the FUSE range include high ionization stages (e.g., O vi) and lower abundance non-CNO elements (e.g., P v). Analyzed in addition to the N iv,N v, Si iv, and C iv lines in the IUE range, these features play a crucial role in uniquely constraining the stellar parameters, assessing the presence of shocks in the wind, and quantifying the effects of the resulting soft X-rays on the wind ionization. The effective temperatures derived from the consistent analysis of the far-UV and UV spectra are significantly (6000 K or 15% on average, or between 4000 and 8000 K) lower than most values previously derived for some of our targets and lower than typical values assigned to their spectral types from different compilations. This result has great implications for our understanding of the evolution of massive stars and the characterization of young stellar populations, as well as for energy balance calculations of H ii regions. Subject headings: stars: early-type — stars: fundamental parameters — stars: mass loss — stars: winds, outflows — ultraviolet: stars On-line material: color figures 1. INTRODUCTION Hot massive stars play a primary role in the chemical evo- lution of the universe, because of the rapid and effective pro- duction of heavy elements during their fast life cycles. They also play a crucial role in the ionization of H ii regions and in the dynamics of the interstellar medium (ISM), by sculpt- ing vast bubbles through their highly supersonic stellar winds and intense UV radiation, thus influencing the physi- cal conditions of the ISM and star formation. Compared to the more easily characterized lower mass portions of the H-R diagram, accurate measurements of the high-mass end of the initial mass function (IMF) in stellar populations and of the stellar parameters of massive stars are elusive for sev- eral reasons: massive stars are rare, they evolve rapidly, and photometric data at optical wavelengths are rather insensi- tive to their hot temperatures (e.g., Bianchi et al. 2001; Massey 1998 for a review), making their global character- ization uncertain without detailed spectroscopy. Even when adequate spectroscopic data are available, modeling is com- plicated by the non-LTE conditions and by the wind hydro- dynamics (mass loss and acceleration) and sphericity effects, all nonnegligible. The supersonic winds of hot stars are revealed by conspicuous P Cygni profiles of transitions that are found, for the most abundant ionic species in the wind, below 2000 A ˚ . The wavelength region accessible to Interna- tional Ultraviolet Explorer (IUE ) and Hubble Space Tele- scope (HST; longward of 1150 A ˚ ) contains strong resonance lines of C iv,N v, and Si iv. These lines give useful informa- tion on the wind terminal velocity but are often saturated and alone are not sufficient to determine the mass-loss rate and the ionization structure of the wind. The 905–1187 A ˚ range covered by the Far Ultraviolet Spectroscopic Explorer (FUSE ) satellite (Moos et al. 2000) includes a greater spread of species and ionization states, and non-CNO elements (e.g., Bianchi et al. 2000; Pellerin et al. 2002; Walborn et al. 2002). These transitions allow for the first time since Coper- nicus a consistent analysis of several ionic species sampling different depths in the envelope, to solve the wind ionization structure and therefore to measure mass-loss rates and physical conditions in the expanding envelopes. An alterna- tive reliable method to determine mass-loss rates has been the analysis of the H profile, since the hydrogen ionization does not suffer from uncertainties (e.g., Bianchi et al. 1994; Scuderi & Panagia 1992; Puls et al. 1996); however, this line samples only the conditions in the deepest layers and gives limited information on the outer envelope. We present first results from a comprehensive program aimed to analyze (by consistent modeling) high-resolution spectra from the optical regime to the far-UV of hot stars covering different spectral types and luminosity classes. This paper explores the properties of mid-O Galactic stars of dif- ferent luminosity classes. In x 2 details about the observa- tions used and about the program stars are given. Section 3 contains a comparative analysis of the spectral morphology among the sample, and x 4 describes the derivation of stellar parameters via synthetic spectral modeling. In x 5 the impli- cations of our findings are discussed. 1 Based on observations with the NASA-CNES-CSA Far Ultraviolet Spectroscopic Explorer, which is operated by The Johns Hopkins Univer- sity under NASA contract NAS5-32985, and on IUE observations from the MAST and INES archives. 2 Center for Astrophysical Sciences, The Johns Hopkins University, Department of Physics and Astronomy, 239 Bloomberg Center for Physics and Astronomy, 3400 North Charles Street, Baltimore, MD 21218; [email protected], [email protected]. 3 University of La Laguna, Department of Astrophysics, Tenerife, Spain. The Astrophysical Journal, 581:610–625, 2002 December 10 # 2002. The American Astronomical Society. All rights reserved. Printed in U.S.A. E 610
-
Upload
independent -
Category
Documents
-
view
1 -
download
0
Transcript of The Effective Temperatures of Mid‐O Stars
THE EFFECTIVE TEMPERATURES OF MID-O STARS1
Luciana Bianchi2and Miriam Garcia
2,3
Received 2002 June 6; accepted 2002 August 12
ABSTRACT
We derived photospheric parameters, mass-loss rates, and wind velocities of Galactic O6–O7 stars by ana-lyzing high-resolution spectra in the far-UV and UV ranges with line-blanketed, hydrodynamic, non-LTEspherical models. We combined spectra from the Far Ultraviolet Spectroscopic Explorer (FUSE) in the range905–1187 A and International Ultraviolet Explorer (IUE) archival spectra (1150–3250 A) and used the WM-BASIC code of Pauldrach et al. to compute model spectra. Lines in the FUSE range include high ionizationstages (e.g., O vi) and lower abundance non-CNO elements (e.g., P v). Analyzed in addition to the N iv, N v,Si iv, and C iv lines in the IUE range, these features play a crucial role in uniquely constraining the stellarparameters, assessing the presence of shocks in the wind, and quantifying the effects of the resulting softX-rays on the wind ionization. The effective temperatures derived from the consistent analysis of the far-UVand UV spectra are significantly (�6000 K or 15% on average, or between 4000 and 8000 K) lower than mostvalues previously derived for some of our targets and lower than typical values assigned to their spectral typesfrom different compilations. This result has great implications for our understanding of the evolution ofmassive stars and the characterization of young stellar populations, as well as for energy balance calculationsof H ii regions.
Subject headings: stars: early-type — stars: fundamental parameters — stars: mass loss —stars: winds, outflows — ultraviolet: stars
On-line material: color figures
1. INTRODUCTION
Hot massive stars play a primary role in the chemical evo-lution of the universe, because of the rapid and effective pro-duction of heavy elements during their fast life cycles. Theyalso play a crucial role in the ionization of H ii regions andin the dynamics of the interstellar medium (ISM), by sculpt-ing vast bubbles through their highly supersonic stellarwinds and intense UV radiation, thus influencing the physi-cal conditions of the ISM and star formation. Compared tothe more easily characterized lower mass portions of theH-R diagram, accurate measurements of the high-mass endof the initial mass function (IMF) in stellar populations andof the stellar parameters of massive stars are elusive for sev-eral reasons: massive stars are rare, they evolve rapidly, andphotometric data at optical wavelengths are rather insensi-tive to their hot temperatures (e.g., Bianchi et al. 2001;Massey 1998 for a review), making their global character-ization uncertain without detailed spectroscopy. Even whenadequate spectroscopic data are available, modeling is com-plicated by the non-LTE conditions and by the wind hydro-dynamics (mass loss and acceleration) and sphericity effects,all nonnegligible. The supersonic winds of hot stars arerevealed by conspicuous P Cygni profiles of transitions that
are found, for the most abundant ionic species in the wind,below 2000 A. The wavelength region accessible to Interna-tional Ultraviolet Explorer (IUE) and Hubble Space Tele-scope (HST; longward of 1150 A) contains strong resonancelines of C iv, N v, and Si iv. These lines give useful informa-tion on the wind terminal velocity but are often saturatedand alone are not sufficient to determine the mass-loss rateand the ionization structure of the wind. The 905–1187 Arange covered by the Far Ultraviolet Spectroscopic Explorer(FUSE) satellite (Moos et al. 2000) includes a greater spreadof species and ionization states, and non-CNO elements(e.g., Bianchi et al. 2000; Pellerin et al. 2002; Walborn et al.2002). These transitions allow for the first time since Coper-nicus a consistent analysis of several ionic species samplingdifferent depths in the envelope, to solve the wind ionizationstructure and therefore to measure mass-loss rates andphysical conditions in the expanding envelopes. An alterna-tive reliable method to determine mass-loss rates has beenthe analysis of the H� profile, since the hydrogen ionizationdoes not suffer from uncertainties (e.g., Bianchi et al. 1994;Scuderi & Panagia 1992; Puls et al. 1996); however, this linesamples only the conditions in the deepest layers and giveslimited information on the outer envelope.
We present first results from a comprehensive programaimed to analyze (by consistent modeling) high-resolutionspectra from the optical regime to the far-UV of hot starscovering different spectral types and luminosity classes. Thispaper explores the properties of mid-O Galactic stars of dif-ferent luminosity classes. In x 2 details about the observa-tions used and about the program stars are given. Section 3contains a comparative analysis of the spectral morphologyamong the sample, and x 4 describes the derivation of stellarparameters via synthetic spectral modeling. In x 5 the impli-cations of our findings are discussed.
1 Based on observations with the NASA-CNES-CSA Far UltravioletSpectroscopic Explorer, which is operated by The Johns Hopkins Univer-sity under NASA contract NAS5-32985, and on IUE observations from theMAST and INES archives.
2 Center for Astrophysical Sciences, The Johns Hopkins University,Department of Physics and Astronomy, 239 Bloomberg Center for Physicsand Astronomy, 3400 North Charles Street, Baltimore, MD 21218;[email protected], [email protected].
3 University of La Laguna, Department of Astrophysics, Tenerife,Spain.
The Astrophysical Journal, 581:610–625, 2002 December 10
# 2002. The American Astronomical Society. All rights reserved. Printed in U.S.A.
E
610
2. THE PROGRAM STARS AND THE OBSERVATIONS
2.1. Data and Reduction
Table 1 lists relevant information on the program starscompiled from the literature and the data used in our analy-sis. The FUSE data were taken in the 3000 � 3000 (LWRS)aperture. The data were reprocessed with the pipeline Cal-FUSE, version 2.0.5, which provides a major improvementin the spectral extraction, background subtraction, andwavelength calibration.4 Individual segments from all SiCand LiF channels were examined in the two-dimensionalreconstructed spectra, to check against data defects such asevent bursts or the ‘‘ worm ’’ (Sahnow et al. 2000) and to ver-ify optimum centering of the extraction windows. The seg-ments of the extracted spectra were then checked to verifyconsistency of flux level and wavelength scale among the dif-ferent channels, and finally, the good portions from all seg-ments were combined to achieve the maximum possiblesignal-to-noise ratio. The FUSE spectral resolution(R � 20; 000) exceeds the requirement for the analysis ofbroad stellar wind lines; however, it is essential to assess thepresence of interstellar absorptions (mainly H i and H2 tran-sitions) that affect large parts of many stellar line profiles(see Fig. 1). For clarity, we rebinned the FUSE spectra with0.25 A bins in our figures. The FUSE data used in this analy-sis were taken by various GT FUSE Science Team programsfor different science goals (studies of the ISM): P101 for HD163758, P116 for HD 210839 and HD 192639, and P102 forHD 93843, HD 101298, andHD 157857.
In the UV range, we used IUE high-resolution (�0.2 A)data taken from the Multimission Archive at the SpaceTelescope Science Institute (MAST) and the IUE NewlyExtracted Spectra (INES) archive (Wamsteker et al. 2000).We used MAST for a quick detailed examination andcomparison of the available data, to chose the best datasets. Two slightly different processings for the IUE high-resolution data are used by MAST and INES. The orderoverlap correction in the echelle IUE spectra affects severelythe depth of the N v absorption (see Bianchi & Bohlin1984), and we eventually used the reprocessed spectra from
INES, which provide a better background correction forour cases.
2.2. The Program Stars
Spectral classification of hot stars is somewhat complex,because of wind and metallicity effects; variability and pecu-liarities are not uncommon. Therefore, we took great care inselecting as ‘‘ bona fide ’’ as possible objects representativeof mid-O spectral types, covering different luminosityclasses. In Table 1 and in the comments below we summa-rize relevant information from an exhaustive literaturesearch, for the objects studied. Mason et al. (1998) per-formed speckle interferometry of a number of Galactic starsto check for binary systems. All of our program stars areincluded in their study, and none was found to be doublewith this technique.
HD 163758 was classified as O7 If by Leep (1978) andas O6.5 Iaf by Walborn (1973). Gomez & Niemela (1987)confirm, from optical spectroscopy, that the star is not abinary and that it has normal CNO abundances, althoughit appears an ‘‘ Of ’’ star. There is only one IUE high-dispersion spectrum in the short-wavelength region: a fewpixels are saturated but not in the regions of interest.
For HD 210839 we chose the only IUE SWP high resolu-tion spectrum that is not saturated. Optical spectral classifi-cations concur to type O6 I(n)fp (Walborn 1973), O6 If(Mathys 1989), and O6ef (Conti & Leep 1974).
HD 157857 was classified as O6.5 III(f) by Walborn(1972) and by Mathys (1988) from its optical spectrum,and its UV (IUE) spectrum was found consistent withthis type (O6.5 III; Penny, Gies, & Bagnuolo 1996).Of two high-resolution SWP spectra available in the IUEarchive, we chose SWP10026, which has slightly betterquality.
HD 93843 was found to be slightly variable in spectralsubclass, between O6 and O5, but not in luminosity class, byWalborn (1973). Like most O-type stars, wind line profilesexhibit slight short-term variability, because of (unstable)inhomogeneities in the wind. A series of IUE spectrashowed short-term line profile variability at 10% of the con-tinuum level at most (Prinja & Crowther 1998), but theoverall average line profiles repeat very well over the years(e.g., from 1980 to 1996, when IUE observing campaignswere repeated).We used a well-exposed IUE spectrum taken
TABLE 1
Program Stars and Data Sets
Star Sp. Typea [Ref.] V
LSRVelocity [Ref.]
(km s�1)
logLX
(ergs s�1)
FUSE
Data Sets
IUE
Data Sets
HD 163758.................. O6.5 Iaf [1, 2]; O6f [3]; O7 If [4] 7.32 �48 [5] . . . P1015901 SWP02892
HD 192639.................. O7 Ib(f) [6]; O7.5 IIIf [7] 7.11 �6 [8] . . . P1162401 SWP09493
HD 210839 (�Cep) ..... O6f II [9]; O6 I(n)fp [10]; O6ef [7] 5.1 �75.9 [11] 32.19� 0.32,b,c 31.81c,d P1163101 SWP52623
HD 157857.................. O6.5 III(f) [6]; O7(f) [7] 7.78 +59 [8] <32.76b P1027501 SWP10026
HD 93843 ................... O5–6 III(f) [10]; O6 III(f) [6] 7.33 �9.9 [11] 33.07� 0.30b P1024001 SWP07723
HD 101298.................. O6V [10]; O6 V((f)) [1] 8.16 �0.7 [11] 32.58� 0.30b P1025201 SWP06939
a The spectral types adopted in this work are given in boldface.b Measurements fromEinstein satellite in the 0.2–3.5 KeV range (Chlebowski, Harnden, & Sciortino 1989).c For HD 210839, LX has been rescaled to theHipparcos distance of 0.5 kpc (Perryman et al. 1997), since the distance used by Chlebowski
et al. 1989 and Berghoefer, Schmidtt, & Cassinelli 1996 (0.8 kpc in both papers) is very different.d Measurements from theROSAT satellite in the 0.1–2.4 keV energy band (Berghoefer et al. 1996).References.—(1)Walborn& Panek 1984; (2) Garrison, Hiltner, & Schild 1977; (3)McConnell & Bidelman 1976; (4) Leep 1978; (5) Thack-
eray, Tritton, &Walker 1973; (6) Walborn 1972; (7) Conti & Leep 1974; (8) Evans 1967; (9) this paper; (10) Walborn 1973; (11) Conti, Leep,& Lorre 1977.
4 See V. Dixon, J. Kruk, & E. Murphy (2002), The CalFUSE PipelineReference Guide, available at http://fuse.pha.jhu.edu/analysis/pipeline_reference.html.
EFFECTIVE TEMPERATURES OF MID-O STARS 611

Fig.1.—
Sequence
ofspectrain
theFUSErange(black
line).Toguidetheeyeto
recognizethebonafidestellarfeatures,weshowmodelsofH
2plusH
iabsorptions(dotted
line),calculatedwithcolumnden-
sities
appropriateforeach
star’sEðB
�VÞ.TheH
2plusH
imodelshelpidentify
whichpartsofthestellarfeaturesare
notaffectedbytheISM
absorptionsandtherefore
weregiven
weightin
themodelfits.T
heH
2
plusH
imodelswerealsonecessary
toperform
anaccuratenorm
alizationofthefluxto
thecontinuum
level.V
eryfewregionsin
thespectracanbeusedforthispurpose,andthesecanbeidentified
onlybyexam-
iningthespectraandtheISM
modelsconcurrently.N
otetheOviem
issioncommonto
allstarsandthedependence
ofCiii�1175(plusCiv�1169becomingseparatedatlowluminosity
classes)andPvonlumi-
nosity.Asshownbyourmodel
analysis,thesefeaturesstrongly
dependonmass-loss
rate.TheredcomponentoftheSivdoublet(theshorter
wavelength
componentisaffectedbyastronginterstellarH
2
absorptionband)varies
from
afullydeveloped
PCygnip
rofilein
thesupergiantsto
anarrowabsorptionin
thedwarfstar.[See
theelectroniceditionoftheJournalforacolorversionofthisfigure.]

through the small (200) aperture, which gives the maximumresolution. The absolute flux is lower than in spectra takenthrough the large (1000 � 2000) aperture, since the IUE smallaperture transmits only about 50% of the flux; however, inthe normalized spectra the line profiles are consistent amongsmall and large aperture data.
HD 192639 was classified as O7 Ib(f) by Walborn (1972)from its optical spectrum, and the UV spectrum was foundto be consistent with this type (Penny et al. 1996). There isonly one IUE SWP high-resolution spectrum, of good qual-ity except for some saturated pixels in the Si iv emission andlongward of the region of interest.
HD 101298 was classified as O6 V type based on its opti-cal spectrum by Walborn (1973). This classification wasconfirmed based on the morphology of its UV (IUE) spec-trum by Walborn & Panek (1984). There is only one IUESWP high-resolution spectrum available, of good quality.
3. ANALYSIS OF THE SPECTRAL MORPHOLOGY
The general trends of UV and far-UV line variations withspectral types have been discussed in several atlases, notablyby Walborn, Nichols-Bohlin, & Panek (1985) and Walborn& Nichols-Bohlin (1987) in the IUE range and recently byPellerin et al. (2002) in the FUSE range, for Milky Waystars, and by Walborn et al. (2002) for Magellanic Cloudstars. We begin our analysis with a detailed discussion ofline variations among the luminosity classes spanned by oursample, in more depth and including also less prominentfeatures than those described in the atlases. This discussionsupports the following sections, where we explain theobserved variations in terms of physical parameter changes,by quantitative modeling of the spectra.
The FUSE and IUE spectra of our program stars areshown in Figures 1 and 2, respectively, arranged in asequence that produces a continuous variation of the linemorphology across the sample and that will be confirmedby our modeling (x 4) to be a sequence of decreasing stellarradii and luminosities. In the FUSE range (Fig. 1) we showalso models of interstellar H2 plus H i absorptions (gray dot-ted line), calculated with column densities inferred fromeach star’s EðB�VÞ using the relationships of Bohlin, Sav-age, & Drake (1978), except for HD 210839 and HD192639, where we used accurate column densities derived byRachford et al. (2002) from the analysis of FUSE spectra.We did not attempt to fit precisely the interstellar lines(which is beyond our purpose and is pursued by otherauthors): the H2 plus H i models are shown only to identifywhich parts of the stellar features are not affected by theinterstellar absorptions and therefore were given weight inthe stellar model fits. This is relevant to the analysis in thefollowing sections. The H2 plus H i models were also neces-sary to perform an accurate normalization of the flux to thecontinuum. Very few regions in the spectra can be used forthis purpose, and these can be identified only by examiningthe spectra and the ISM models concurrently. With adetailed examination, one can note (Fig. 1) that some spec-tral regions where there are no stellar lines are still absorbedby several hydrogen lines, and thus the actual continuum islower than 1.0 (in the normalized spectra) and matches ourISM model. Thus, we believe we achieved the highest possi-ble accuracy by performing the spectrum normalizationconcurrently with modeling of the ISM absorptions.
3.1. The Supergiant Stars
For HD 192639 and HD 163758, the FUSE spectra arebasically identical except for S iv, which is significantlystronger in HD 163758 (both emission and absorption). C iii
�1175 is also slightly stronger in HD 163758, although theeffect is marginal because of uncertainty in the normaliza-tion, since this multiplet falls at the edge of the range in boththe FUSE and IUE spectra. In the IUE range, Si iv and N v
are stronger in HD 163758, while N iv, C iv, and severalweaker lines (e.g., He ii) are similar. The strength of Si ivincreases with increasing mass-loss rate and decreasing tem-perature (as does S iv). Our consistent spectral modeling(next section) will confirm that the difference in line strengthcan be ascribed to these effects. The N v doublet dependsstrongly on Teff (increasing with temperature), which, how-ever, does not vary significantly within our sample, andheavily on the X-ray ionization caused by shocks. This line,together with O vi, primarily constrains the amount ofshock-produced X-rays in the wind. The sensitivity of indi-vidual lines to other parameters will be discussed in moredetail in x 4.
HD 210839, although classified of the same luminosityclass as the two previous objects from its optical lines, exhib-its a far-UV to UV spectrum different from the other twosupergiants: C iii �1175 is significantly weaker, and Si ivand S iv are weaker in HD 210839. C iv �1550 appears tohave a slightly stronger emission. All these differences indi-cate a higher ionization, whichmay be ascribed to the earliersubtype of HD 210839 (O6, while the two supergiants dis-cussed previously have types O6.5–O7). However, P v, C iii,and Si iv also indicate lower mass-loss rates.
The high-ionization O vi doublet is strong in all threesupergiants, although its emission slightly decreases fromHD 192639 to HD 163758 to HD 210839. The P v doubletin HD 210839 has a stronger emission but a weaker absorp-tion compared to both the other supergiants. The appar-ently stronger P v emission is probably due to a differentrelative strength of the nearby Si iv doublet. The lines of thisdoublet hardly affect the P Cygni profiles of the P v doubletin HD 210839, while they may be absorbing the red compo-nent, and the emission of the blue component of P v, in theother stars.
A few less conspicuous features are also worthy of discus-sion. Note in all three supergiants the absorption line near1099 A, of slightly decreasing strength from HD 192639 toHD 163758 to HD 210839. This line was also reported (asan unidentified feature) in late-O supergiants by Walborn &Bohlin (1996) in their Copernicus atlas of Galactic stars. Byexamining our extensive grid of theoretical models (x 4), wefind a very small absorption, due to an O iv �1099.2 line,plus several lines of Fe iii, Fe iv, Fe v, Ni iv, and Si iii. Itsstrength is rather insensitive to the stellar parameters in ourrange, because the relative ratios of O iv to Si iii (and of theother ions contributing to this small feature) vary with tem-perature within the blend. Additionally, we suspect it ispartly of interstellar origin.
Another interesting feature that exhibits large variationsamong the three supergiants is the absorption at 1200 A,very strong in HD 163758 and much weaker in the others.This feature is identified as a blend of primarily Si iii withS iii and S v (see x 4.5) and is partly interstellar. There isanother S v line in the IUE range (�1501.8), which isobserved as a small absorption and predicted by the models;
EFFECTIVE TEMPERATURES OF MID-O STARS 613
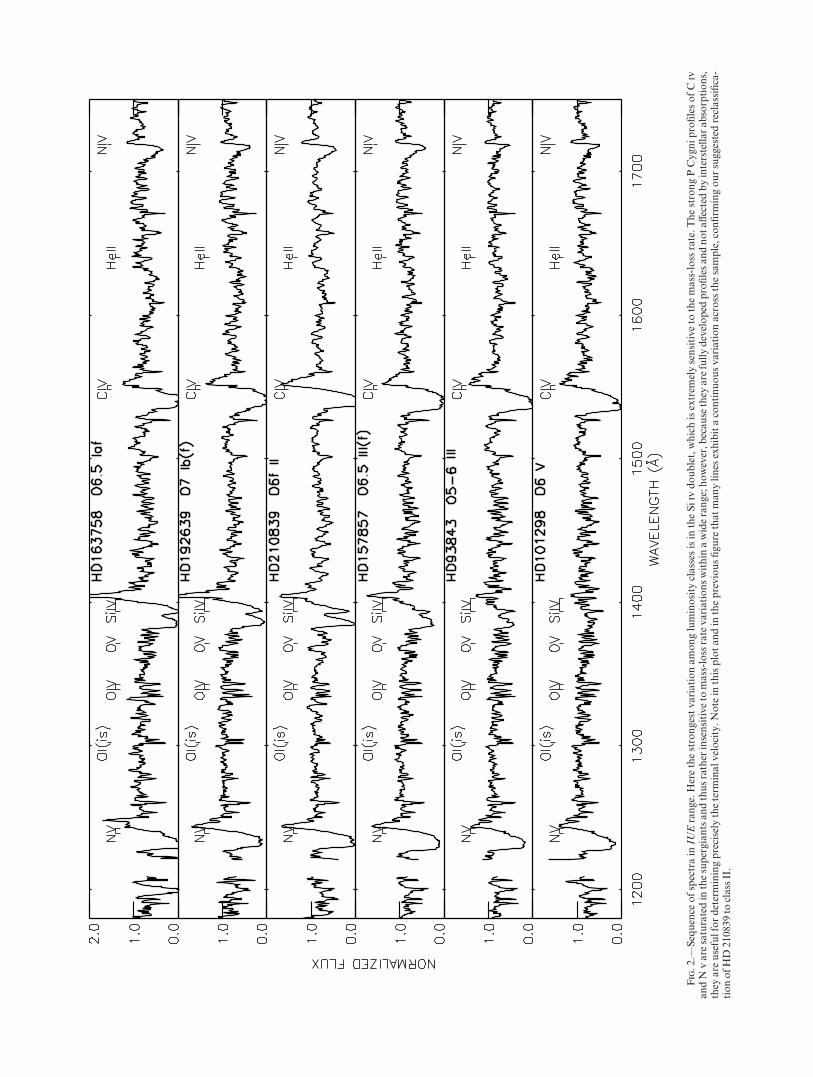
Fig.2.—
Sequence
ofspectrain
IUErange.Herethestrongestvariationamongluminosity
classes
isin
theSiivdoublet,whichisextrem
elysensitiveto
themass-loss
rate.ThestrongPCygniprofilesofCiv
andN
vare
saturatedin
thesupergiantsandthusrather
insensitiveto
mass-lossratevariationswithin
awiderange;however,b
ecause
they
are
fullydeveloped
profilesandnotaffectedbyinterstellarabsorptions,
they
are
usefulfordeterminingprecisely
theterm
inalvelocity.Note
inthisplotandin
thepreviousfigure
thatmanylines
exhibitacontinuousvariationacrossthesample,confirm
ingoursuggestedreclassifica-
tionofHD
210839to
classII.
however, it does not change among our sample. Consis-tently, from our model grid the line does not vary within theacceptable range of stellar parameters. These lines will bediscussed again in x 4.5.
The resonance line of He ii �1640 is very weak at theselater types and lies near a broad depression of the contin-uum due to blends of Fe ii and Fe iii (conspicuous at highluminosity classes), and no variations among the sample areappreciable.
3.2. The Giant Stars
The two giants of our sample exhibit very similar spectrain all features, with the exception of Si iv (stronger P Cygniin HD 157857) and O vi (weaker emission in HD 157857).One of the parameters affecting these lines in opposite waysis the amount of shocks: fewer shocks imply lower X-rayflux, thus lower ionization, which favors Si iv and decreasesO vi. Our analysis (see later) will instead indicate that theeffect is likely due to different mass-loss rates in this case. Theeffect is reported here to stress the importance of a consistentanalysis of several lines for a unique interpretation and solu-tion of the physical parameters. A less conspicuous differ-ence is seen in the lines of N v �1240 andN iv �1720, slightlystronger inHD157857, whichwe found to be possibly due toa nitrogen abundance lower than solar inHD93843 (x 4).
When we compare the giants to the supergiant stars dis-cussed previously, the largest differences are the muchweaker Si iv and S iv features, which almost disappear asP Cygni signatures at luminosity class III.
Another very conspicuous change is a weaker C iii �1175+C iv �1169: in the giants the absorption from this complexblend reaches a depth of about 40% of the continuum level,while in the two top supergiants the absorption is almostsaturated. From this comparison, the differences betweenHD 210839 and the other supergiants appears to have aplausible explanation that HD 210839 is of intermediateluminosity class between supergiants and giants. In fact,C iii �1175 + C iv �1169, as well as S iv and Si iv, are inter-mediate between the rest of the supergiant sample and ourgiant sample. Therefore, we revise the classification of itsluminosity class to II. The only feature inconsistent with thispicture is the C iv emission, which is stronger in HD 210839than in any other star of the sample and may support its‘‘ f ’’ designation. Underhill (1995) also suspected that HD210839 could be of a luminosity class intermediate betweensupergiant and giant, based on the amount of Stark broad-ening of the He ii lines in the optical spectra. Independentlyof the morphological classification, we do find from themodel analysis that the star has a smaller radius than theother supergiants (Table 2) and a slightly higher Teff , consis-tent with its earlier subtype, than the other supergiants.
O vi is again a strong P Cygni profile in the giant stars,not appreciably different from in the supergiants.
3.3. The O6 Dwarf
For all the lines discussed above, we note a continuoustrend from the top to the bottom of our plots. Notably, theN iv, Si iv, C iii, P v, and S iv decrease drastically in thespectra of HD 101298, which has the lowest luminosity inour sample. As shown by our model analysis in the follow-ing sections, these changes are not just due to differences inluminosity (or temperature) but to variations of mass-lossrates and shocks across the luminosity classes.
Overall, the lines vary smoothly in the comparative plots(Figs. 1 and 2) given the sequence in which the stars havebeen arranged, supporting the suggestion that HD 210839has a luminosity intermediate between the supergiants andthe giants.
4. QUANTITATIVE SPECTRAL MODELING
In order to derive the stellar parameters from a consis-tent, quantitative analysis of the spectral features, we com-puted synthetic model spectra with mass loss in the UV andfar-UV range using the WM-BASIC code, version 1.22(Pauldrach, Hoffmann, & Lennon 2001). The code com-putes the underlying atmosphere and the synthetic spectrumby solving the wind hydrodynamics with non-LTE line-blanketing treatment and includes the effects of sphericityand expansion. By modeling transitions in the whole 905–2000 A range, we were able to obtain a unique solution forTeff , log g, logðLbol=L�Þ,V1, _MM, and shocks and a check onthe stellar abundances. Soft-X rays produced by shocks inthe wind affect the ionization of the main observed stages(to different extents) and were taken into account in the ion-ization calculations, since this was proven necessary toreproduce all the observed lines consistently. In particular,O vi ��1032, 1037 is entirely produced by X-ray ionization,in the range of parameters explored in this work. X-raysalso significantly affect the relative strength of N v (andC iv) versus Si iv in the IUE range and—to a lesser extent—the strength of P v ��1118, 1128, which is one of the fewnonsaturated lines and thus very sensitive to all windparameters. The effect of soft X-ray ionization is parameter-ized by the quantity logðLX=LbolÞ, whose values are foundby varying this quantity as an additional free parameter infitting the observed spectra (Table 2). Soft X-rays contributeto the ionization both by photoionization and by Auger ion-ization. The version of WM-BASIC that we used includesboth processes (Pauldrach et al. 2001). Existing X-ray fluxmeasurements for our objects are reported in Table 1 for
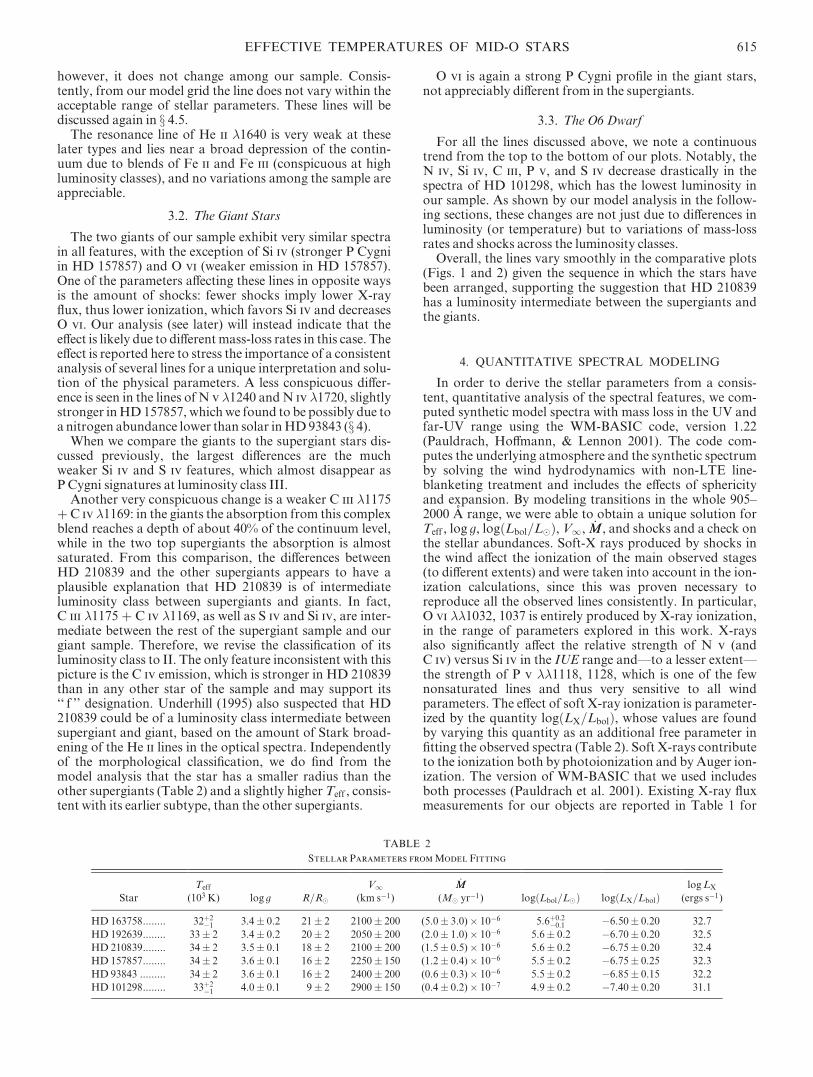
TABLE 2
Stellar Parameters fromModel Fitting
Star
Teff
(103 K) log g R=R�
V1(km s�1)
_MM(M� yr�1) logðLbol=L�Þ logðLX=LbolÞ
logLX
(ergs s�1)
HD 163758........ 32þ2�1 3.4� 0.2 21� 2 2100� 200 (5.0� 3.0)� 10�6 5:6þ0:2
�0:1 �6.50� 0.20 32.7
HD 192639........ 33� 2 3.4� 0.2 20� 2 2050� 200 (2.0� 1.0)� 10�6 5.6� 0.2 �6.70� 0.20 32.5
HD 210839........ 34� 2 3.5� 0.1 18� 2 2100� 200 (1.5� 0.5)� 10�6 5.6� 0.2 �6.75� 0.20 32.4
HD 157857........ 34� 2 3.6� 0.1 16� 2 2250� 150 (1.2� 0.4)� 10�6 5.5� 0.2 �6.75� 0.25 32.3
HD 93843 ......... 34� 2 3.6� 0.1 16� 2 2400� 200 (0.6� 0.3)� 10�6 5.5� 0.2 �6.85� 0.15 32.2
HD 101298........ 33þ2�1 4.0� 0.1 9� 2 2900� 150 (0.4� 0.2)� 10�7 4.9� 0.2 �7.40� 0.20 31.1
EFFECTIVE TEMPERATURES OF MID-O STARS 615

comparison with our value of logðLX=LbolÞ determined bythe spectral fit (Table 2). While the measured LX in Table 1is the radiation escaping the star, logðLX=LbolÞ determinedby the spectral fit reflects the (soft) X-rays absorbed withinthe stellar envelope. The comparison gives some insight intothe geometry of the shock region (x 5).
From a vast set of model calculations, we determined thebest fit to the observed spectra and constrained the uncer-tainty range of each parameter. This procedure required amuch larger set of models than just varying the effective tem-perature and adopting reasonable values for the otherparameters, but provided a check for the validity and theuniqueness of our solutions as well. In fact, variations of dif-ferent parameters can compensate each other’s effect on theline profiles, but when all lines are taken into account, aunique solution can be determined. Results from model fitsare given in Table 2. Below we comment on the major effectsof various parameters on the synthetic model spectra andthe criteria that led to the adopted solutions for the individ-ual stars. The discussion is somewhat lengthy; however, thisis the first attempt to actually fit all observed far-UV andUV features, and we think our process provides some inter-esting insights.
4.1. HD 210839
We begin with HD 210839 because it has been extensivelyanalyzed in the optical range. Herrero, Puls, & Villamariz(2000) derived Teff ¼ 41; 500 K from plane-parallel, hydro-static model analysis of optical spectra and Teff ¼ 37; 000 K[log g ¼ 3:55, _MM ¼ 6� 10�6 M� yr�1, logðLbol=L�Þ ¼ 5:78]by analyzing the same data with spherical models includingmass loss. Puls et al. (1996) derived for the same starTeff ¼ 38; 000 K, _MM ¼ 5� 10�6 M� yr�1, log g ¼ 3:65,logðLbol=L�Þ ¼ 5:83, from the analysis of the H� and H�lines.
Therefore, we started our analysis with a grid of modelsaround these values and varied other parameters maintain-ing these temperatures.
Figure 3 shows that a model computed with the parame-ters from Herrero et al. (2000; models with sphericity) canreproduce only a few features (notably C iv in the IUErange, which is, however, saturated and thus less sensitive tothe main parameters, as will be shown again later) but failsto reproduce the Si iv profile. Additionally, N v is too weakin the model and O vi is absent, while P v and C iii �1175 arealmost saturated in the model. One parameter to which theoptical line analysis is insensitive is the amount of X-rays(from shocks) contributing to the ionization, which essen-tially affects the higher ionization species, seen most notablyin the UV and far-UV. Thus, we varied this parameter first,maintaining the high mass-loss rate and the temperaturefrom the Herrero et al. analysis. The fits of the P v, C iii
�1175, and N v �1240 transitions are improved by addingthe effect of shocks in the model, with logðLX=LbolÞ ¼ �7:0,but Si iv almost disappears in the model spectra withshocks. Also, decreasing the mass-loss rate further improvesthe match to P v and N v but worsens the match to Si iv andC iv. These effects are shown in the upper panel in Figure 3.We similarly tested other parameter changes and theirextensive combinations, but no solution could be found thatcould match all the observed lines at Teff ¼ 37; 000 K orhigher.
We proceeded by lowering the temperature in small steps(500–1000 K) and varying all possible wind parameters [pri-marily mass-loss rate, V1, logðLX=LbolÞ, as well as secon-dary parameters such as the velocity law] at each Teff value.Different values of gravity and luminosity were also investi-gated for all combinations.
At Teff ¼ 36; 000 K, again the Si iv feature is producedonly for very high mass-loss rates (a few� 106 M� yr�1), fora sensible range of gravity values (log g ¼ 3:2–3.6), inabsence of X-ray ionization. But for reasonable values ofshocks [logðLX=LbolÞ � �7:0], which improve the match toother lines in the FUSE range, the Si iv line can be repro-duced only with mass-loss rates of the order of 105M� yr�1.However, no combination of parameters can provide anacceptable fit to the other lines in the FUSE range (in partic-ular, O vi and P v) for such high _MM values. The best com-promise match to all the features at Teff ¼ 36; 000 Kis reached for _MM � 4� 10�6 and logðLX=LbolÞ between�6.7 and �7.0, the first yielding a better fit to P v and thesecond to O vi. In all models, Si iv and C iii are not wellreproduced.
A better match to all lines is achieved for a model atTeff ¼ 35; 000 K, with _MM ¼ 1:5� 10�6 M� yr�1,logðLX=LbolÞ ¼ �6:7, logðLbol=L�Þ ¼ 5:53, and log g ¼ 3:6.Therefore, we adopt Teff ¼ 35; 000 K as an upper limit to arange of acceptable fits.
At Teff ¼ 34; 000 K, we find the best fit, shown in Figure 3(middle plot, lower panels), for _MM ¼ 1:7� 10�6 M� yr�1,logðLX=LbolÞ ¼ �6:75, logðLbol=L�Þ ¼ 5:6, R ¼ 18� 2 R�,and log g ¼ 3:5� 0:1. Si iv is slightly underestimated in thismodel, and it is best reproduced with _MM ¼ 2� 10�6 M�yr�1 and/or with a lower radius (R ¼ 16R�), whereas otherlines are slightly overestimated in the models with these lat-ter parameters. These comparisons define the adopteduncertainties.
For lower temperatures, at Teff ¼ 33; 000 K, the influenceof the parameters on most features is similar to what seen inthe grid of models at Teff ¼ 34; 000 K; however, for similarparameter combinations, cooler lines such as C iii and Si iv(and to a lesser extent P v) are enhanced relative to the hot-ter lines of N v and C iv. The relative line strengths can bematched at the lower Teff values by increasing the amountof shocks, which favors higher ions. Two interesting factsemerged. First, the dependence of the spectral lines on stel-lar luminosity and radius is the same at Teff ¼ 34; 000 K andTeff ¼ 33; 000 K, confirming that these parameters can bewell constrained independently of other factors. Second, forgiven values of logðLX=LbolÞ, the strength of O vi at bothTeff ¼ 34; 000 K and Teff ¼ 33; 000 K varies drastically inthe same way, with stellar luminosity and with the mass-lossrate. In particular, once we fix the amount of shocks tologðLX=LbolÞ ¼ �6:75 and _MM ¼ a few� 10�6 M� yr�1
from other line ratios as explained above, O vi is almostabsent in models with logðLbol=L�Þ � 5:5 and R ¼ 16 R�and becomes saturated at logðLbol=L�Þ ¼ 5:8 and R ¼ 22R�. For _MM � 4� 10�6 M� yr�1, the effect disappears, andO vi cannot be reproduced as a P Cygni profile. Therefore,once other parameters are constrained by the relative ratiosof several other features, with their combination slightlyvarying with temperatures, O vi additionally constrains thestellar luminosity and mass-loss rate rather independentlyof temperature (between 34,000 K and 33,000 K). This lineseems to have a ‘‘ hard threshold ’’ within these narrowranges of stellar parameters. It requires a certain amount of
616 BIANCHI & GARCIA

Fig.3.—
ModelfitsforHD
210839(FUSEandIU
Eranges
inleftandrightpanels,respectively;b
lack
lines
are
theobserved
spectra).Upper
panels:WM-BASIC
model(graythickline)calculatedwithparame-
ters
from
arecentstudyin
theopticalrangebyHerrero
etal.(2000):Teff¼
37;000K,logg¼
3:55,_ MM¼
6�10�6M
�yr�
1,andlogðLbol=L�Þ¼
5:78.Theopticalanalysisneglectstheshocksin
thewind,thus
underestimatinghighionizationstages,especiallyOvi(FUSErange)andN
v(IUErange).F
orthesamereason,low-ionizationspeciessuch
asCiiiandPvare
severelyoverestimatedbythemodel.T
hemiddle
plotin
thestack
wascomputedwiththesamestellarparametersasderived
byHerrero
etal.,butaddingtheeffectofshocks[logðLX=LbolÞ¼
�7:0],whichim
proves
thematchto
thelines
ofN
vandO
vi;the
modellacksSiivandCiiithough,w
hilePvisstillinexcess.D
ecreasing
_ MMto
4�10�6M
�yr�
1(upper
plot)reducesthestrength
ofPvbutalsoofSiiv,thusnotsolvingthemismatch.N
ogoodfitcould
befound
atTeff¼
37;000K
orhigher.L
ower
panels:Best-fitmodel[T
eff¼
34;000K,logg¼
3:5,_ MM¼
1:7�10�6M
�yr�
1,logðL
bol=L�Þ¼
5:6,andlogðL
X=LbolÞ¼
�6:75]isshownover
thespectrum
(middleplot).T
he
other
twomodelsdiffer
only
ingravity
andluminosity,havinglogg¼
3:4,logðLbol=L�Þ¼
5:8
(lower
plot)andlogg¼
3:6,logðL
bol=L�Þ¼
5:5
(uppermostplot).Theseare
shownto
illustrate
howsensitivethe
process
isto
thecombinationofmultipleparametersandasanexampleofthefinegridofmodelsthatwascomputedaroundthebest-fitparametersto
determineuncertainties.[See
theelectroniceditionofthe
Journalfor
acolorversionofthisfigure.]

X-rays to be produced at all, but then it also constrainslogðLbol=L�Þ and _MM. A hard threshold for the onset of O vi
as a P Cygni profile was also noted by Walborn et al. (2002)in a comparative FUSE spectral atlas.
At Teff ¼ 32; 000 K, the parameters of the best fits foundat higher temperatures produce models with much weakerN v, slightly weaker C iv, and much stronger C iii. To main-tain relative line strengths that match the observed spec-trum, higher logðLX=LbolÞ values are required at the lowertemperature. However, the C iiimultiplet remains saturatedin the models even at logðLX=LbolÞ ¼ �6:3 for _MM largerthan �10�6 M� yr�1. The C iii observed strength requires_MM � 6� 10�7 M� yr�1 in the Teff ¼ 32; 000 K models,which, however, causes other lines, most notably Si iv andN iv, to be too weak. In summary, it becomes impossible toreproduce consistently the lines, especially because of thestrong change (decrease) of N v in the models when Teff
decreases below 33,000 K. Therefore, this value can be con-sidered a conservative lower limit to the range of acceptabletemperatures.
The best-fit model for HD 210839 is shown in Figure 3with other models to illustrate the sensitivity to the parame-ters described above.
Although the requirement to match all far-UV and UVlines constrains the Teff values between 33,000 and 35,000K, we adopted in Table 2 an error twice as large, to allowfor possible (and unquantifiable at this stage) limitations ofthe model calculations, although other works have foundbasically consistent results between WM-BASIC calcula-tions and calculations with, e.g., CMFGEN (Hillier &Miller 1998). We will return to this point in the last section(x 5). We adopt this criterion in estimating the errors for allstars analyzed.
4.2. HD 163758 and HD 192639
For these two supergiants we followed the same proce-dure as above. As noted in x 3, the main differences withrespect to HD 210839 are the much stronger P Cygni pro-files of C iii �1175 and Si iv, which suggest lower Teff valuesand/or higher mass-loss rates. In fact, we find that the bestoverall fits to all spectral features can be achieved for a tem-perature of Teff ¼ 32; 000 K for HD 163758 (and a mass-loss rate of _MM ¼ 5� 10�6 M� yr�1, a factor of 2 higher thanfor HD 210839) and Teff ¼ 33; 000 K for HD 192639. In thefit of HD 163758, a small mismatch remains in the O vi
doublet (underestimated) and the P v doublet (overesti-mated). These features are perfectly matched by modelswith _MM ¼ 2� 10�6 M� yr�1 and an even higherlogðLX=LbolÞ ¼ �6:3. This change of parameters, however,degrades the fit to other lines. Therefore, we adopt theseranges as the uncertainties in our parameter determinations.The Teff values slightly lower than our value for HD 210839are consistent with their later spectral subtypes.
One criterion to choose between Teff ¼ 32; 000 K andTeff ¼ 33; 000 K, additional to the overall relative linestrengths, which are easier to reproduce in one case or theother, was the shape of the N v emission (Fig. 4). A weak,photospheric absorption of C iii �1247 appears at Teff ¼32; 000 K, causing a small dip in the N v emission andincreasingly suppressing it at lower temperatures. This dipis seen in the spectrum of HD 163758 but not in the N v pro-file of HD 192639. The difference is also seen in their respec-tive best-fit models (Fig. 4).
We show an additional model besides the best-fit modelto HD 192639, to illustrate the effect of changing the nitro-gen abundance: lowering the abundance by a factor of 10with respect to solar, the N iv lines vary significantly, whilethe saturated N v absorption shows no effect. Thus, the var-iations seen in the N v strength among these two stars arenot due to abundance variations but to the small tempera-ture difference.
4.3. HD 93843 and HD 157857
For HD 93843 we again tried a very extensive number ofparameter combinations, for Teff varying in small steps. Forthis object, we show (Fig. 5) a model that provides an excel-lent fit to all lines except the O vi doublet, especially to thelines in the IUE range. This model, with Teff ¼ 34; 000 Kand very low X-rays, is included in the figure as an exampleof the unique information provided by the FUSE range toconstrain all stellar parameters consistently: this modelmatches perfectly the IUE spectrum and could have beenadopted as a solution if the information from the FUSEspectrum were not available, further constraining theparameters. The O vi P Cygni profile can be reproducedonly with a higher X-ray contribution to the ionization, asshown in the top plots of Figure 5. However, all models thatcan match both O vi and the cooler lines predict a N v fea-ture stronger than the observed one. An overall good fit wasachieved by lowering the nitrogen abundance by a factor of10 with respect to solar values (Fig. 5, top model). Again,the uncertainties were estimated by computing a large setof models with parameters varying about the adoptedsolution.
Acceptable fits are again obtained for Teff values between36,000 and 32,000 K. At Teff ¼ 37; 000 K, the strong lines inthe IUE range (C iv and N v) can still somehow be repro-duced for certain values of mass loss (between 10�6 and10�7 M� yr�1) and a low logðLX=LbolÞ (�8.3), but theobserved Si iv, P v, and O vi lines cannot be matched withthe same parameters.
The other giant star of our sample, HD 157857, has astronger Si iv doublet, which can be explained with a lowertemperature and/or a higher mass-loss rate. We find that alower temperature does not produce good fits to the otherfeatures, while a higher (by a factor of 2) mass-loss rateyields the best fit, for models in a temperature range betweenTeff ¼ 34; 000 and 35,000 K (Fig. 5).
4.4. HD 101298
After calculating numerous models varying Teff , log g,logðLbol=L�Þ, _MM, R, V1, and logðLX=LbolÞ, similar to theprevious cases, we obtained an excellent fit of all features inthe whole FUSE+IUE range (Fig. 6). The match to all thefar-UV andUV lines by the model spectrum in this case is ofunprecedented quality, as far as we know. Again, this resultrequired a much wider grid of models and parameter combi-nations than is usually calculated in similar works. Weinvested such an enormous effort in this case in order toassess whether the code used is adequate for treating the dif-ferent layers of the stellar envelope probed by our widerange of transitions, or whether the approximate or partialfits usually achieved in previous and similar works are anintrinsic limitation of the model assumptions. Althoughsuch a lengthy analysis would be impractical for a largenumber of stars, it is encouraging that in this case all lines
618 BIANCHI & GARCIA

Fig.4.—
Model
fits
fortheother
twosupergiantstars
ofoursample.Upper
panels:HD
163758.FUSEandIU
Espectra(black
line)
andbest-fitmodel
(graythickline)
withTeff¼
32;000K,logg¼
3:4,
_ MM¼
5�10�6M
�yr�
1,logðL
bol=L�Þ¼
5:6,andlogðLX=LbolÞ¼
�6:5.Bottom
panels:
HD
192639.Thebest-fitmodel
isoverplotted
[Teff¼
33;000K,logg¼
3:4,R¼
20R
�,
_ MM¼
2�10�6M
�yr�
1,
logðL
bol=L�Þ¼
5:6,andlogðL
X=LbolÞ¼
�6:7].Thesamemodelbutwithanitrogen
abundance
of0.1
solarisplotted
withanoffset.N
visnotaffected(because
saturated),buttheN
ivlinealm
ostdisap
pears.
[See
theelectroniceditionoftheJournalforacolorversionofthisfigure.]

Fig.5.—
Modelfitsforthegiantstars(symbolsasin
previousfigures).Upper
panels:HD
93843.Themodeloverplotted
tothespectrum
hasTeff¼
34;000K,logg¼
3:6,R¼
16R
�,_ MM¼
6�10�7M
�yr�
1,
logðL
bol=L�Þ¼
5:5,andlogðLX=LbolÞ¼
�7:5.It
provides
anexcellentfitto
alllines
exceptforunderestimatingtheO
viline;
thislineisreproducedbyhigher
shocks[m
iddle
plot;logðLX=LbolÞ¼
�6:85],
althoughthelineofN
visnowtoostrong.T
hemismatchissolved
byloweringtheabundance
ofnitrogen
to0.1thesolarvalue(upper
plot).L
ower
panels:HD
157857.T
womodelsare
shown,w
ithTeff¼
34;000
K(lower
plot)andTeff¼
35;000K
(upper
plot).Both
havelogg¼
3:6
andlogðL
bol=L�Þ¼
5:5.However,thelower
modelhas
_ MM¼
8:5�10�7M
�yr�
1andlogðLX=LbolÞ¼
�7:0
(theO
vilineisunderesti-
mated),andtheupper
modelhas
_ MM¼
1:6�10�6M
�yr�
1andlogðLX=LbolÞ¼
�6:5,whichprovidethebestmatchto
theOvidoubletbutslightlyoverestimateN
v.Theseprovideanother
exampleofhowthe
uncertainties
have
beendetermined.[See
theelectroniceditionoftheJournalforacolorversionofthisfigure.]
620
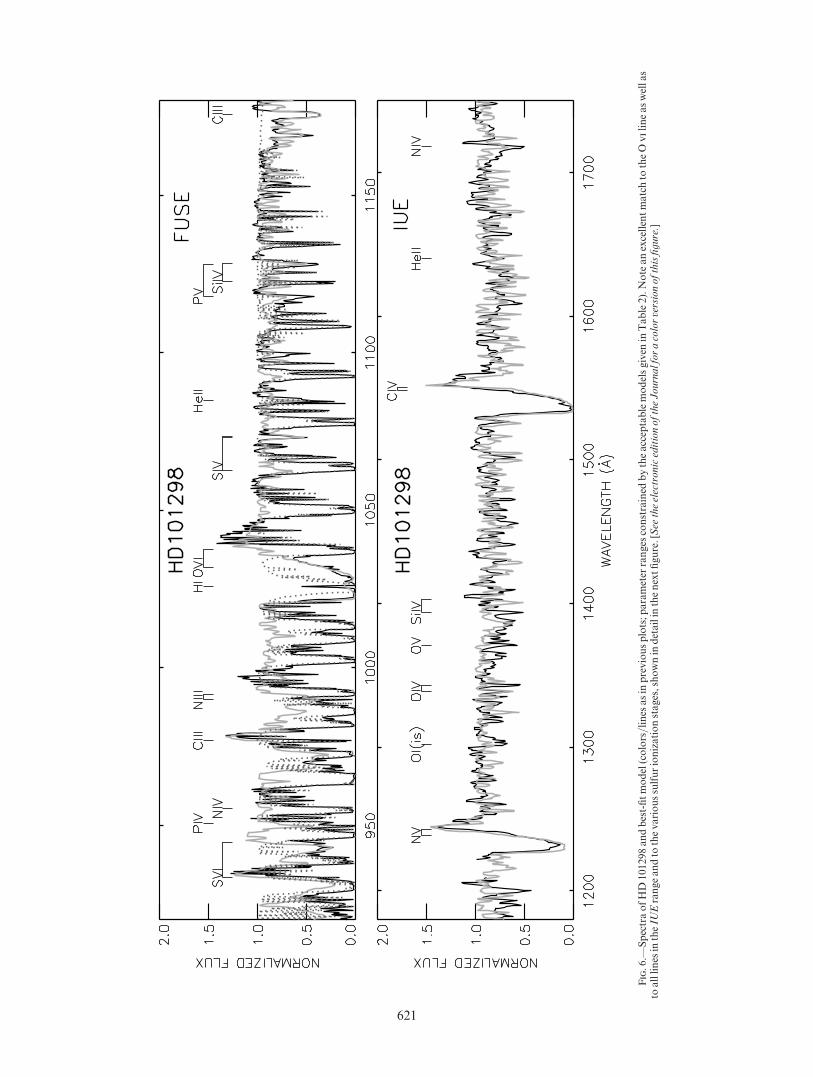
Fig.6.—
SpectraofHD
101298andbest-fitmodel(colors/lines
asin
previousplots;p
arameter
ranges
constrained
bytheacceptablemodelsgiven
inTable2).Noteanexcellentmatchto
theOvilineaswellas
toalllines
intheIU
Erangeandto
thevarioussulfurionizationstages,shownin
detailin
thenextfigure.[See
theelectroniceditionoftheJournalforacolorversionofthisfigure.]
621
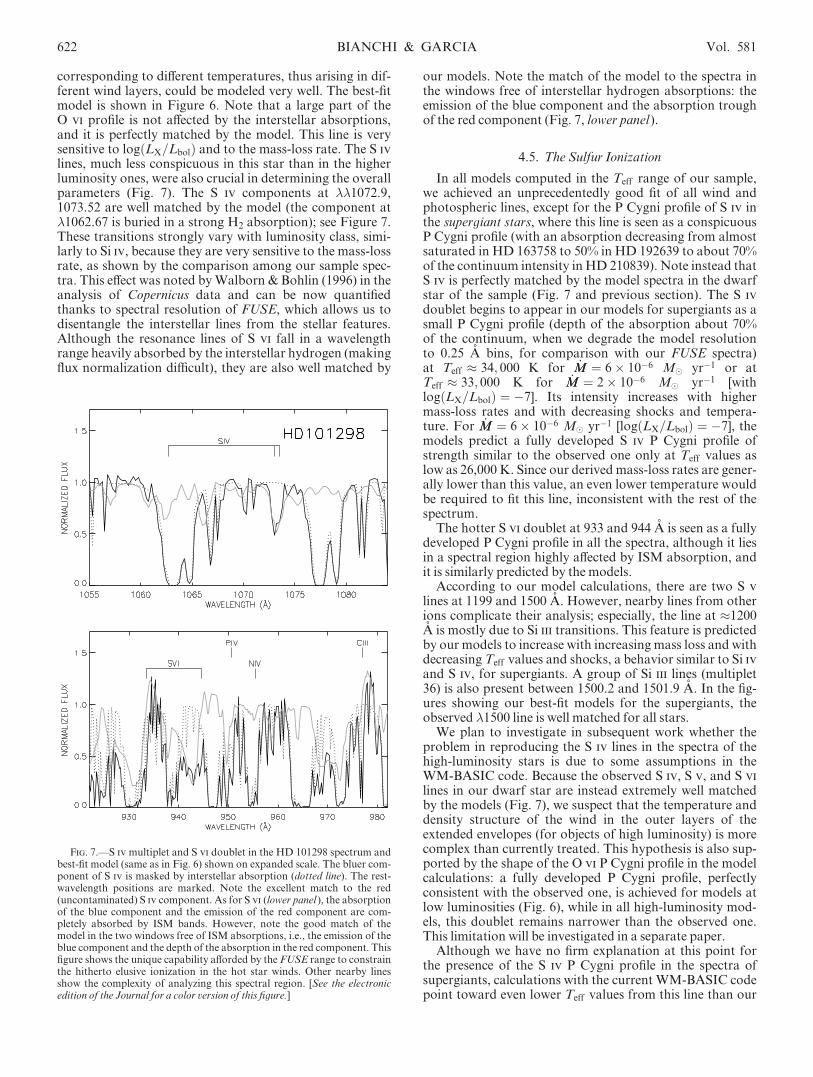
corresponding to different temperatures, thus arising in dif-ferent wind layers, could be modeled very well. The best-fitmodel is shown in Figure 6. Note that a large part of theO vi profile is not affected by the interstellar absorptions,and it is perfectly matched by the model. This line is verysensitive to logðLX=LbolÞ and to the mass-loss rate. The S iv
lines, much less conspicuous in this star than in the higherluminosity ones, were also crucial in determining the overallparameters (Fig. 7). The S iv components at ��1072.9,1073.52 are well matched by the model (the component at�1062.67 is buried in a strong H2 absorption); see Figure 7.These transitions strongly vary with luminosity class, simi-larly to Si iv, because they are very sensitive to the mass-lossrate, as shown by the comparison among our sample spec-tra. This effect was noted byWalborn & Bohlin (1996) in theanalysis of Copernicus data and can be now quantifiedthanks to spectral resolution of FUSE, which allows us todisentangle the interstellar lines from the stellar features.Although the resonance lines of S vi fall in a wavelengthrange heavily absorbed by the interstellar hydrogen (makingflux normalization difficult), they are also well matched by
our models. Note the match of the model to the spectra inthe windows free of interstellar hydrogen absorptions: theemission of the blue component and the absorption troughof the red component (Fig. 7, lower panel).
4.5. The Sulfur Ionization
In all models computed in the Teff range of our sample,we achieved an unprecedentedly good fit of all wind andphotospheric lines, except for the P Cygni profile of S iv inthe supergiant stars, where this line is seen as a conspicuousP Cygni profile (with an absorption decreasing from almostsaturated in HD 163758 to 50% in HD 192639 to about 70%of the continuum intensity in HD 210839). Note instead thatS iv is perfectly matched by the model spectra in the dwarfstar of the sample (Fig. 7 and previous section). The S iv
doublet begins to appear in our models for supergiants as asmall P Cygni profile (depth of the absorption about 70%of the continuum, when we degrade the model resolutionto 0.25 A bins, for comparison with our FUSE spectra)at Teff � 34; 000 K for _MM ¼ 6� 10�6 M� yr�1 or atTeff � 33; 000 K for _MM ¼ 2� 10�6 M� yr�1 [withlogðLX=LbolÞ ¼ �7]. Its intensity increases with highermass-loss rates and with decreasing shocks and tempera-ture. For _MM ¼ 6� 10�6 M� yr�1 [logðLX=LbolÞ ¼ �7], themodels predict a fully developed S iv P Cygni profile ofstrength similar to the observed one only at Teff values aslow as 26,000 K. Since our derived mass-loss rates are gener-ally lower than this value, an even lower temperature wouldbe required to fit this line, inconsistent with the rest of thespectrum.
The hotter S vi doublet at 933 and 944 A is seen as a fullydeveloped P Cygni profile in all the spectra, although it liesin a spectral region highly affected by ISM absorption, andit is similarly predicted by the models.
According to our model calculations, there are two S v
lines at 1199 and 1500 A. However, nearby lines from otherions complicate their analysis; especially, the line at �1200A is mostly due to Si iii transitions. This feature is predictedby our models to increase with increasing mass loss and withdecreasing Teff values and shocks, a behavior similar to Si ivand S iv, for supergiants. A group of Si iii lines (multiplet36) is also present between 1500.2 and 1501.9 A. In the fig-ures showing our best-fit models for the supergiants, theobserved �1500 line is well matched for all stars.
We plan to investigate in subsequent work whether theproblem in reproducing the S iv lines in the spectra of thehigh-luminosity stars is due to some assumptions in theWM-BASIC code. Because the observed S iv, S v, and S vi
lines in our dwarf star are instead extremely well matchedby the models (Fig. 7), we suspect that the temperature anddensity structure of the wind in the outer layers of theextended envelopes (for objects of high luminosity) is morecomplex than currently treated. This hypothesis is also sup-ported by the shape of the O vi P Cygni profile in the modelcalculations: a fully developed P Cygni profile, perfectlyconsistent with the observed one, is achieved for models atlow luminosities (Fig. 6), while in all high-luminosity mod-els, this doublet remains narrower than the observed one.This limitation will be investigated in a separate paper.
Although we have no firm explanation at this point forthe presence of the S iv P Cygni profile in the spectra ofsupergiants, calculations with the current WM-BASIC codepoint toward even lower Teff values from this line than our
Fig. 7.—S ivmultiplet and S vi doublet in the HD 101298 spectrum andbest-fit model (same as in Fig. 6) shown on expanded scale. The bluer com-ponent of S iv is masked by interstellar absorption (dotted line). The rest-wavelength positions are marked. Note the excellent match to the red(uncontaminated) S iv component. As for S vi (lower panel ), the absorptionof the blue component and the emission of the red component are com-pletely absorbed by ISM bands. However, note the good match of themodel in the two windows free of ISM absorptions, i.e., the emission of theblue component and the depth of the absorption in the red component. Thisfigure shows the unique capability afforded by the FUSE range to constrainthe hitherto elusive ionization in the hot star winds. Other nearby linesshow the complexity of analyzing this spectral region. [See the electronicedition of the Journal for a color version of this figure.]
622 BIANCHI & GARCIA Vol. 581

adopted solutions. The main result of the present analysis issignificantly lower Teff values than previously assumed forthese spectral types; thus, the mismatch of the S iv line in thesupergiants does not contradict this general finding.
5. DISCUSSION AND CONCLUSIONS
In this paper we have derived wind and photosphericparameters for a sample of mid-O stars covering a range ofluminosity classes, by modeling their observed UV and far-UV spectra with the WM-BASIC code. We achieved modelfits to the observed spectra of all wind and photosphericlines with better accuracy than previous partial analyses,thanks to a thorough investigation of the effects of allparameters. There are twomain results.
First, the inclusion of certain ions observed only in theFUSE wavelength range (e.g., high-ionization species, suchas O vi, and nonsaturated, non-CNO lines such as P v) inthe analysis allows us for the first time to constrain allparameters consistently and therefore to dismiss solutionsthat would be acceptable based on the saturated CNO linesin the IUE/HST range alone (e.g., x 4.3) or in the opticalrange. A main advantage is the presence of the O vi doublet.Its ratio to other lines can uniquely be explained by theinclusion of soft X-rays in the wind ionization calculations.The main wind lines observed in the IUE range (N v, Si iv,and C iv) are mostly saturated, thus quite insensitive to alarge range of parameters. Their relative strengths are alsoaffected by the amount of soft X-rays; however, they can bereproduced by models neglecting X-rays in some cases byadjusting temperature andmass-loss rate.When the amountof X-rays is instead constrained by the inclusion of hotterlines in the FUSE range, a higher ionization is producedthan in models without X-rays; therefore, the solution isuniquely constrained and yields lower temperatures.
Second, the effective temperatures derived for all stars inour sample are significantly lower than values previouslybelieved typical for O6–O7 types and than most determina-tions from previous analyses of the same stars (see below).This finding has many important implications. The temper-ature ranges that we derived by modeling the UV and far-UV spectra of the O6 stars, Teff ¼ 32; 000–34,000 K, are sig-nificantly lower than canonical values attributed to theirspectral type by empirical calibrations over the last decades.Vacca, Garmany, & Shull (1996) derived a Teff calibrationof O-type stars compiling determinations based on plane-parallel, non-LTE, pure H and He hydrostatic models.Their calibration gives Teff ¼ 41; 710, 42,640, and 43,560 Kfor O6 Ia, III, and V types, respectively. De Jager & Nieu-wenhuijzen’s (1987) calibration gives Teff ¼ 38; 200–39,500K and 36,060–35,700 K from O6 and O7 supergiants (Ia+)to dwarfs—less discrepant, but still significantly higher thanour findings. The comparison between our resulting Teff val-ues and these previous compilations is shown in Figure 8.Considering the uncertainties, the difference is rather inde-pendent of luminosity class. The luminosities derived fromour analysis are also lower than the previous calibrations,and the comparison is given in the lower panel of Figure 8.We will separately analyze optical spectra for our programstars, to further investigate the cause of the discrepancy.While it is currently being recognized that the use of modelswith full line-blanketing treatment and sphericity in theoptical range yields Teff values lower than found by simpli-fied (pure H and He) treatments, we also find in some cases
that the values of Teff and log g derived in previous workscan still somehow reproduce the lines in the IUE range (byneglecting X-ray ionization and other effects) but cannotreproduce all the lines observed in the FUSE range with thesame combination of parameters. Crowther et al. (2002)analyze optical spectra of Magellanic Cloud O-type super-giants and extrapolate the results to the far-UV and UV, totest the robustness of the optical-line–based analysis. Signif-icant discrepancies between their models and the observedspectra are seen in the far-UV to UV range.
The question remains open whether an accurate modelingof the optical spectra alone could provide similar results.Martins, Schaerer, & Hillier (2002) show that the inclusion
Fig. 8.—Effective temperatures and luminosities derived in this paper forthe program stars (different symbols for spectral type subclasses) are com-pared to previous calibrations of Teff and logðLbol=L�Þ vs. luminosity classfor spectral types O 6 (thick lines) and O 7 (thin lines). The calibrations arefrom Vacca et al. (1996; dashed lines) and from de Jager & Nieuwenhuijzen(1987; solid lines). The differences from our results are rather independentof luminosity class, considering the uncertainties.
No. 1, 2002 EFFECTIVE TEMPERATURES OF MID-O STARS 623
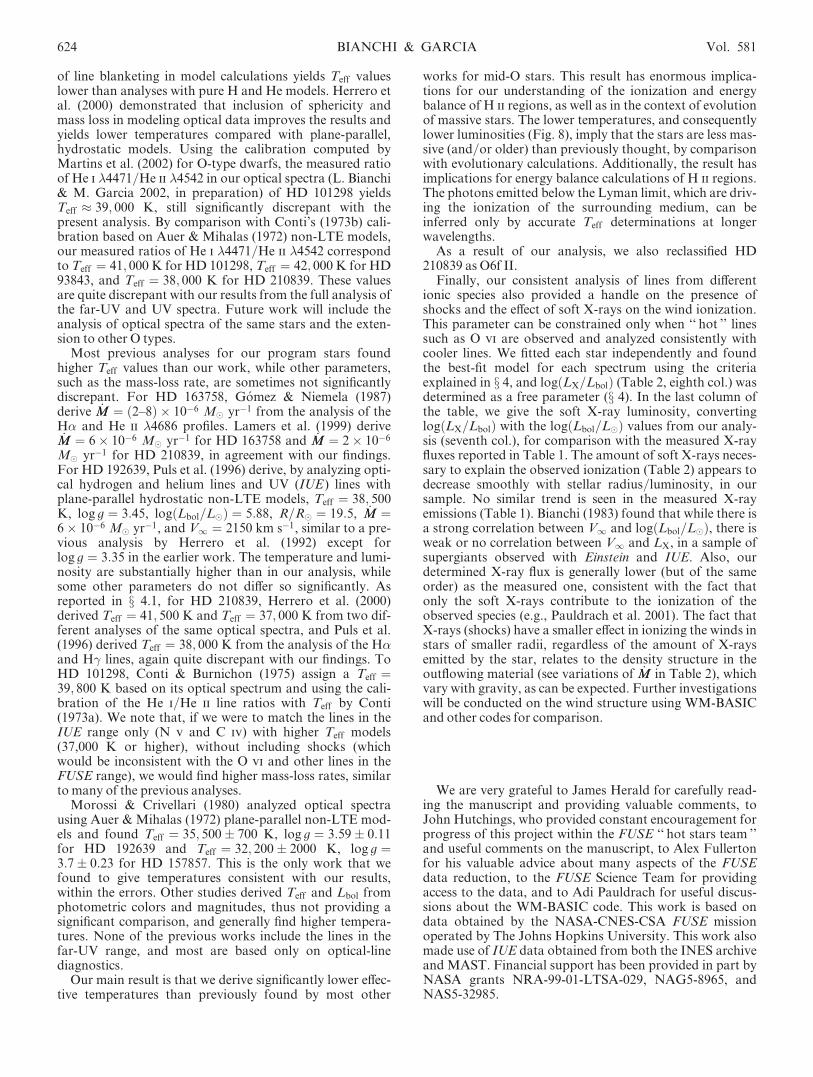
of line blanketing in model calculations yields Teff valueslower than analyses with pure H and He models. Herrero etal. (2000) demonstrated that inclusion of sphericity andmass loss in modeling optical data improves the results andyields lower temperatures compared with plane-parallel,hydrostatic models. Using the calibration computed byMartins et al. (2002) for O-type dwarfs, the measured ratioof He i �4471/He ii �4542 in our optical spectra (L. Bianchi& M. Garcia 2002, in preparation) of HD 101298 yieldsTeff � 39; 000 K, still significantly discrepant with thepresent analysis. By comparison with Conti’s (1973b) cali-bration based on Auer & Mihalas (1972) non-LTE models,our measured ratios of He i �4471/He ii �4542 correspondto Teff ¼ 41; 000 K for HD 101298, Teff ¼ 42; 000 K for HD93843, and Teff ¼ 38; 000 K for HD 210839. These valuesare quite discrepant with our results from the full analysis ofthe far-UV and UV spectra. Future work will include theanalysis of optical spectra of the same stars and the exten-sion to other O types.
Most previous analyses for our program stars foundhigher Teff values than our work, while other parameters,such as the mass-loss rate, are sometimes not significantlydiscrepant. For HD 163758, Gomez & Niemela (1987)derive _MM ¼ ð2 8Þ � 10�6 M� yr�1 from the analysis of theH� and He ii �4686 profiles. Lamers et al. (1999) derive_MM ¼ 6� 10�6 M� yr�1 for HD 163758 and _MM ¼ 2� 10�6
M� yr�1 for HD 210839, in agreement with our findings.For HD 192639, Puls et al. (1996) derive, by analyzing opti-cal hydrogen and helium lines and UV (IUE) lines withplane-parallel hydrostatic non-LTE models, Teff ¼ 38; 500K, log g ¼ 3:45, logðLbol=L�Þ ¼ 5:88, R=R� ¼ 19:5, _MM ¼6� 10�6 M� yr�1, and V1 ¼ 2150 km s�1, similar to a pre-vious analysis by Herrero et al. (1992) except forlog g ¼ 3:35 in the earlier work. The temperature and lumi-nosity are substantially higher than in our analysis, whilesome other parameters do not differ so significantly. Asreported in x 4.1, for HD 210839, Herrero et al. (2000)derived Teff ¼ 41; 500 K and Teff ¼ 37; 000 K from two dif-ferent analyses of the same optical spectra, and Puls et al.(1996) derived Teff ¼ 38; 000 K from the analysis of the H�and H� lines, again quite discrepant with our findings. ToHD 101298, Conti & Burnichon (1975) assign a Teff ¼39; 800 K based on its optical spectrum and using the cali-bration of the He i/He ii line ratios with Teff by Conti(1973a). We note that, if we were to match the lines in theIUE range only (N v and C iv) with higher Teff models(37,000 K or higher), without including shocks (whichwould be inconsistent with the O vi and other lines in theFUSE range), we would find higher mass-loss rates, similarto many of the previous analyses.
Morossi & Crivellari (1980) analyzed optical spectrausing Auer & Mihalas (1972) plane-parallel non-LTE mod-els and found Teff ¼ 35; 500� 700 K, log g ¼ 3:59� 0:11for HD 192639 and Teff ¼ 32; 200� 2000 K, log g ¼3:7� 0:23 for HD 157857. This is the only work that wefound to give temperatures consistent with our results,within the errors. Other studies derived Teff and Lbol fromphotometric colors and magnitudes, thus not providing asignificant comparison, and generally find higher tempera-tures. None of the previous works include the lines in thefar-UV range, and most are based only on optical-linediagnostics.
Our main result is that we derive significantly lower effec-tive temperatures than previously found by most other
works for mid-O stars. This result has enormous implica-tions for our understanding of the ionization and energybalance of H ii regions, as well as in the context of evolutionof massive stars. The lower temperatures, and consequentlylower luminosities (Fig. 8), imply that the stars are less mas-sive (and/or older) than previously thought, by comparisonwith evolutionary calculations. Additionally, the result hasimplications for energy balance calculations of H ii regions.The photons emitted below the Lyman limit, which are driv-ing the ionization of the surrounding medium, can beinferred only by accurate Teff determinations at longerwavelengths.
As a result of our analysis, we also reclassified HD210839 as O6f II.
Finally, our consistent analysis of lines from differentionic species also provided a handle on the presence ofshocks and the effect of soft X-rays on the wind ionization.This parameter can be constrained only when ‘‘ hot ’’ linessuch as O vi are observed and analyzed consistently withcooler lines. We fitted each star independently and foundthe best-fit model for each spectrum using the criteriaexplained in x 4, and logðLX=LbolÞ (Table 2, eighth col.) wasdetermined as a free parameter (x 4). In the last column ofthe table, we give the soft X-ray luminosity, convertinglogðLX=LbolÞ with the logðLbol=L�Þ values from our analy-sis (seventh col.), for comparison with the measured X-rayfluxes reported in Table 1. The amount of soft X-rays neces-sary to explain the observed ionization (Table 2) appears todecrease smoothly with stellar radius/luminosity, in oursample. No similar trend is seen in the measured X-rayemissions (Table 1). Bianchi (1983) found that while there isa strong correlation between V1 and logðLbol=L�Þ, there isweak or no correlation between V1 and LX, in a sample ofsupergiants observed with Einstein and IUE. Also, ourdetermined X-ray flux is generally lower (but of the sameorder) as the measured one, consistent with the fact thatonly the soft X-rays contribute to the ionization of theobserved species (e.g., Pauldrach et al. 2001). The fact thatX-rays (shocks) have a smaller effect in ionizing the winds instars of smaller radii, regardless of the amount of X-raysemitted by the star, relates to the density structure in theoutflowing material (see variations of _MM in Table 2), whichvary with gravity, as can be expected. Further investigationswill be conducted on the wind structure using WM-BASICand other codes for comparison.
We are very grateful to James Herald for carefully read-ing the manuscript and providing valuable comments, toJohn Hutchings, who provided constant encouragement forprogress of this project within the FUSE ‘‘ hot stars team ’’and useful comments on the manuscript, to Alex Fullertonfor his valuable advice about many aspects of the FUSEdata reduction, to the FUSE Science Team for providingaccess to the data, and to Adi Pauldrach for useful discus-sions about the WM-BASIC code. This work is based ondata obtained by the NASA-CNES-CSA FUSE missionoperated by The Johns Hopkins University. This work alsomade use of IUE data obtained from both the INES archiveand MAST. Financial support has been provided in part byNASA grants NRA-99-01-LTSA-029, NAG5-8965, andNAS5-32985.
624 BIANCHI & GARCIA Vol. 581
REFERENCES
Auer, L., &Mihalas, D. 1972, ApJS, 24, 193Berghoefer, T. W., Schmidtt, J. H. M. M., & Cassinelli, J. P. 1996, A&AS,118, 481
Bianchi, L. 1983, Adv. Space Res., 2(9), 293Bianchi, L., & Bohlin, R. C. 1984, A&A, 134, 31Bianchi, L., Lamers, H. J. G. L. M., Hutchings, J. B., Massey, P.,Kudritzki, R., Herrero, A., & Lennon, D. J. 1994, A&A, 292, 213
Bianchi, L., Scuderi, S., Massey, P., &Romaniello,M. 2001, AJ, 121, 2020Bianchi, L., et al. 2000, ApJ, 538, L57Bohlin, R. C., Savage, B. D., &Drake, J. F. 1978, ApJ, 224, 132Chlebowski, T., Harnden, F. R., Jr., & Sciortino, S. 1989, ApJ, 341, 427Conti, P. S. 1973a, ApJ, 179, 161———. 1973b, ApJ, 179, 181Conti, P. S., & Burnichon,M. L. 1975, A&A, 38, 467Conti, P. S., & Leep, E.M. 1974, ApJ, 193, 113Conti, P. S., Leep, E.M., & Lorre, J. J. 1977, ApJ, 214, 759Crowther, P. A., Hillier, D. J., Evans, C. J., Fullerton, A.W., deMarco, O.,Pellerin, A., &Willis, A. J. 2002, ApJ, 579, 774
de Jager, C., &Nieuwenhuijzen, H. 1987, A&A, 177, 217Evans, D. S. 1967, in IAU Symp. 30, Determination of Radial Velocitiesand Their Applications, ed. A. H. Batten & J. F. Heard (New York:Academic Press), 57
Garrison, R. F., Hiltner,W. A., & Schild, R. E. 1977, ApJS, 35, 111Gomez, D. O., & Niemela, V. S. 1987, Rev. Mexicana Astron. Astrofis., 14,293
Herrero, A., Kudritzki, R. P., Vilchez, J. M., Kunze, D., Butler, K., &Haser, S. 1992, A&A, 261, 209
Herrero, A., Puls, J., & Villamariz, M. R. 2000, A&A, 354, 193Hillier, D. J., &Miller, D. L. 1998, ApJ, 496, 407Lamers, H. J. G. L. M., Haser, S., de Koter, A., & Leitherer, C. 1999, ApJ,516, 872
Leep, E.M. 1978, ApJ, 225, 165Martins, F., Schaerer, D., &Hillier, J. 2002, A&A, 382, 999Mason, B. D., Gies, D. R., Hartkopf, W. I., Bagnuolo, W. G., Jr.,Brummelaar, T. T., &McAlister, H. A. 1998, AJ, 115, 821
Massey, P. 1998, in Stellar Astrophysics for the Local Group, ed.A. Aparicio, A. Herrero, & F. Sanchez (Cambridge: Cambridge Univ.Press), 95
Mathys, G. 1988, A&AS, 76, 427———. 1989, A&AS, 81, 237McConnell, D. J., & Bidelman,W. P. 1976, AJ, 81, 225Moos, H.W., et al. 2000, ApJ, 538, L1Morossi, C., & Crivellari, L. 1980, A&AS, 41, 299Pauldrach, A.W. A., Hoffmann, T. L., & Lennon,M. 2001, A&A, 375, 161Pellerin, A., et al. 2002, ApJS, 143, 159Penny, L. R., Gies, D. R., & Bagnuolo,W. G., Jr. 1996, ApJ, 460, 906Perryman,M. A. C., et al. 1997, A&A, 323, L49Prinja, R., & Crowther, P. A. 1998,MNRAS, 300, 828Puls, J., et al. 1996, A&A, 305, 171Rachford, B. L., et al. 2002, ApJ, 577, 221Sahnow,D., et al. 2000, ApJ, 538, L7Scuderi, S., & Panagia, N. 1992, ApJ, 392, 201Thackeray, A. D., Tritton, S. B., &Walker, E. N. 1973,MmRAS, 77, 199Underhill, A. B. 1995, ApJS, 100, 461Vacca,W. D., Garmany, C. D., & Shull, J.M. 1996, ApJ, 460, 914Walborn, N. R. 1972, AJ, 77, 312———. 1973, AJ, 78, 1067Walborn, N. R., & Bohlin, R. C. 1996, PASP, 108, 477Walborn, N. R., Fullerton, A.W., Crowther, P. A., Bianchi, L., Hutchings,J. B., Pellerin, A., Sonneborn, G., &Willis, A. J. 2002, ApJS, 141, 443
Walborn, N. R., &Nichols-Bohlin, J. 1987, PASP, 99, 40Walborn, N. R., Nichols-Bohlin, J., & Panek, R. J. 1985, InternationalUltraviolet Explorer Atlas of O-Type Spectra from 1200 to 1900 A(NASARP-1155)
Walborn, N. R., & Panek, R. J. 1984, ApJ, 286, 718Wamsteker, W., Skillen, I., Ponz, J. D., de la Fuente, A., Barylak, M., &Yurrita, I. 2000, Ap&SS, 273, 155
No. 1, 2002 EFFECTIVE TEMPERATURES OF MID-O STARS 625