Kinetics of sunflower oil methanolysis at low temperatures
10
Kinetics of sunflower oil methanolysis at low temperatures Olivera S. Stamenkovic ´ a , Zoran B. Todorovic ´ a , Miodrag L. Lazic ´ a , Vlada B. Veljkovic ´ a, * , Dejan U. Skala b,1 a Faculty of Technology, University of Nis ˇ, 16000 Leskovac, Bulevar oslobodjenja 124, Serbia b Faculty of Technology and Metallurgy, University of Belgrade, 11000 Belgrade, Karnegijeva 4, Serbia Received 5 October 2006; received in revised form 17 February 2007; accepted 19 February 2007 Available online 16 April 2007 Abstract The kinetics of the sunflower oil methanolysis process was studied at lower temperatures (10–30 °C). The sigmoidal kinetics of the process was explained by the mass transfer controlled region in the initial heterogenous regime, followed by the chemical reaction con- trolled region in the pseudo-homogenous regime. A simple kinetic model, which did not require complex computation of the kinetic con- stants, was used for simulation of the TG conversion and the FAME formation in the latter regime: the fast irreversible second-order reaction was followed by the slow reversible second-order reaction close to the completion of the methanolysis reaction. The mass trans- fer was related to the drop size of the dispersed (methanol) phase, which reduced rapidly with the progress of the methanolysis reaction. This was attributed to the formation of the emulsifying agents stabilizing the emulsion of methanol drops into the oil. Ó 2007 Elsevier Ltd. All rights reserved. Keywords: Biodiesel; Kinetics; Mass transfer; Methanolysis; Sunflower oil 1. Introduction The diesel fuel consumption has been increasing contin- uously over the past decades and will continue in the future. Due to depleting crude oil reserves and the environ- mental consequences of exhaust gases, alternative fuels for diesel engines are becoming significantly important. The alternatives to diesel fuel must be technically and environ- mentally acceptable, economically competitive and readily available (Srivastava and Prasad, 2000). One possible alter- native to fossil fuels is the use of biodiesel, which has sev- eral advantages over diesel fuel. Firstly, it is made from renewable sources such as vegetable oils and animal fats. Secondly, it is biodegradable and non-toxic, with higher oxygen and without sulfur content. Finally, the use of bio- diesel has many environmental benefits: less greenhouse effect, less pollution of air, water and soil and less health risk, compared to the use of fossil fuels. Biodiesel consists of methyl or ethyl esters of long chain fatty acids derived from triglycerides (TG) by alcoholysis with low molecular weight alcohols. Methanol is used most frequently because of its suitable physical and chemical properties and low cost. The methanolysis reaction requires a presence of a catalyst. The most important variables that influence the methanolysis reaction are the type and the amount of catalyst, the molar ratio of methanol to vegeta- ble oil, the reaction temperature, the agitation intensity and purity of reactants. Because of its wide industrial use, the reaction kinetics of methanolysis, being fundamental to reactor design, is the subject of several studies. A survey on the mechanism and kinetics of alkali-catalyzed alcoholysis reaction is given in Table 1. Independently of the type of oil (rapeseed, sun- flower, soybean, palm and Brassica carinata oils), the reaction temperature (from 20 to 70 °C) and the molar ratio of methanol to oil (up to 6:1), the alkali-catalyzed 0960-8524/$ - see front matter Ó 2007 Elsevier Ltd. All rights reserved. doi:10.1016/j.biortech.2007.02.028 * Corresponding author. Tel.: +381 16 247 203; fax: +381 16 242 859. E-mail address: [email protected] (V.B. Veljkovic ´). 1 Present address: Texas A&M at Qatar, Qatar Support Office, College Station, TX, USA. Available online at www.sciencedirect.com Bioresource Technology 99 (2008) 1131–1140
Transcript of Kinetics of sunflower oil methanolysis at low temperatures

Available online at www.sciencedirect.com
Bioresource Technology 99 (2008) 1131–1140
Kinetics of sunflower oil methanolysis at low temperatures
Olivera S. Stamenkovic a, Zoran B. Todorovic a, Miodrag L. Lazic a,Vlada B. Veljkovic a,*, Dejan U. Skala b,1
a Faculty of Technology, University of Nis, 16000 Leskovac, Bulevar oslobodjenja 124, Serbiab Faculty of Technology and Metallurgy, University of Belgrade, 11000 Belgrade, Karnegijeva 4, Serbia
Received 5 October 2006; received in revised form 17 February 2007; accepted 19 February 2007Available online 16 April 2007
Abstract
The kinetics of the sunflower oil methanolysis process was studied at lower temperatures (10–30 �C). The sigmoidal kinetics of theprocess was explained by the mass transfer controlled region in the initial heterogenous regime, followed by the chemical reaction con-trolled region in the pseudo-homogenous regime. A simple kinetic model, which did not require complex computation of the kinetic con-stants, was used for simulation of the TG conversion and the FAME formation in the latter regime: the fast irreversible second-orderreaction was followed by the slow reversible second-order reaction close to the completion of the methanolysis reaction. The mass trans-fer was related to the drop size of the dispersed (methanol) phase, which reduced rapidly with the progress of the methanolysis reaction.This was attributed to the formation of the emulsifying agents stabilizing the emulsion of methanol drops into the oil.� 2007 Elsevier Ltd. All rights reserved.
Keywords: Biodiesel; Kinetics; Mass transfer; Methanolysis; Sunflower oil
1. Introduction
The diesel fuel consumption has been increasing contin-uously over the past decades and will continue in thefuture. Due to depleting crude oil reserves and the environ-mental consequences of exhaust gases, alternative fuels fordiesel engines are becoming significantly important. Thealternatives to diesel fuel must be technically and environ-mentally acceptable, economically competitive and readilyavailable (Srivastava and Prasad, 2000). One possible alter-native to fossil fuels is the use of biodiesel, which has sev-eral advantages over diesel fuel. Firstly, it is made fromrenewable sources such as vegetable oils and animal fats.Secondly, it is biodegradable and non-toxic, with higheroxygen and without sulfur content. Finally, the use of bio-
0960-8524/$ - see front matter � 2007 Elsevier Ltd. All rights reserved.
doi:10.1016/j.biortech.2007.02.028
* Corresponding author. Tel.: +381 16 247 203; fax: +381 16 242 859.E-mail address: [email protected] (V.B. Veljkovic).
1 Present address: Texas A&M at Qatar, Qatar Support Office, CollegeStation, TX, USA.
diesel has many environmental benefits: less greenhouseeffect, less pollution of air, water and soil and less healthrisk, compared to the use of fossil fuels.
Biodiesel consists of methyl or ethyl esters of long chainfatty acids derived from triglycerides (TG) by alcoholysiswith low molecular weight alcohols. Methanol is used mostfrequently because of its suitable physical and chemicalproperties and low cost. The methanolysis reaction requiresa presence of a catalyst. The most important variables thatinfluence the methanolysis reaction are the type and theamount of catalyst, the molar ratio of methanol to vegeta-ble oil, the reaction temperature, the agitation intensity andpurity of reactants.
Because of its wide industrial use, the reaction kineticsof methanolysis, being fundamental to reactor design, isthe subject of several studies. A survey on the mechanismand kinetics of alkali-catalyzed alcoholysis reaction is givenin Table 1. Independently of the type of oil (rapeseed, sun-flower, soybean, palm and Brassica carinata oils), thereaction temperature (from 20 to 70 �C) and the molarratio of methanol to oil (up to 6:1), the alkali-catalyzed

Nomenclature
a specific interfacial area, m2/m3
A pre-exponential factor, Eq. (20), min�1
cA concentration of TG in the oil phase, mol/dm3
cAo initial concentration of TG, mol/dm3
cA,s concentration of TG on the interfacial area,mol/dm3
cB concentration of methanol, mol/dm3
cBo initial concentration of methanol, mol/dm3
cR concentration of FAME, mol/dm3
cS concentration of glycerol, mol/dm3
C1, C2 integration constants, 1di drop diameter, md32 Sauter-mean drop diameter, mEa activation energy of the reaction, kJ/kmolkc TG mass transfer coefficient, m/mink2 reaction rate constant for the irreversible pseu-
do-second-order reaction, dm3/(mol min)~k2 reaction rate constant for the forward second-
order reaction, dm3/(mol min)k
2 reaction rate constant for the reverse second-or-der reaction, dm3/(mol min)
kca overall volumetric TG mass transfer coefficient,min�1
K reciprocal value of the equilibrium constant forthe overall methanolysis reaction ð¼ k
2=~k2Þ, 1
M initial molar ratio of TG to methanol (=cAo/cBo) = 1/6, 1
ni number of drops with diameter di
(�rA) rate of TG disappearance, mol/(dm3 min)R gas constant, kJ/(kmol K)t time, mint1 duration time of the heterogeneous regime, mint2 duration time of irreversible pseudo-second-or-
der reaction, minT temperature, KTG content of TG in the FAME/oil fraction of the
reaction mixture, %xA degree of TG conversion, 1xAe equilibrium degree of TG conversion, 1
Greek symbols
D parameter in Eq. (14) (=4 Æ 3M(1 � K) � (1 +3M)2 < 0), 1
u holdup of dispersed (alcoholic) phase, 1
Abbreviation
TG triglyceridesDG diglyceridesMG monoglyceridesFAME fatty acid methyl esters
1132 O.S. Stamenkovic et al. / Bioresource Technology 99 (2008) 1131–1140
methanolysis reaction was supposed to occur via threereversible consecutive reactions. The shunt reaction (Freed-man et al., 1986; Noureddini and Zhu, 1997) or the sidesaponification reactions (Komers et al., 2002) were alsoincluded into the reaction mechanism making the kineticmodel more complex. In the kinetic studies of methanoly-sis, both forward and reverse methanolysis reactions fol-lowed the second-order kinetics. Exceptionally, Freedmanet al. (1986) reported that a combination of second-orderconsecutive and fourth-order shunt reactions bestdescribed the kinetics of methanolysis. Darnoko and Cher-yan (2000) suggested a pseudo-second-order kinetic for theinitial stages of the reaction, but they only considered theforward reactions.
Methanolysis reaction is heterogeneous during thewhole course, so combinations of different chemical andphysical processes will affect its kinetics. In the studies ofmethanolysis reaction kinetics, three regimes are well-rec-ognized: an initial mass transfer controlled regime (slow)followed by a chemically controlled regime (fast), and afinal regime close to equilibrium (slow) (Noureddini andZhu, 1997; Stamenkovic et al., 2006; Vicente et al., 2005;Vicente et al., 2006). As a result, the shape of curvesdescribing the variation of fatty acid methyl esters (FAME)with the progress of methanolysis reaction is sigmoidal.
The initial slow regime is attributed to the formation ofa two-phase reaction mixture caused by the immiscibility of
methanol and the oil. The mass transfer of TG from the oilphase towards the methanol/oil interface limits the rate ofmethanolysis reaction and controls the kinetics at thebeginning of the reaction. The rapid increase of the reac-tion rate during the chemically controlled regime wasexplained by increasing the concentration of oil in themethanol phase (Darnoko and Cheryan, 2000). Accordingto Noureddini and Zhu (1997), as FAME are formed theyact as a mutual solvent (cosolvent) for the reactants, so thereaction mixture becomes homogeneous. Vicente et al.(2005) accept that the reaction mixture is pseudo-homoge-neous as well. Showing the heterogeneous nature of thereaction mixture during the whole reaction course, we haverecently attributed it to a ‘‘self-enhancement’’ of the inter-facial area, due to the intensive drop breakage process dur-ing the fast reaction regime (Stamenkovic et al., 2006). Webelieve the formation of some surface active compoundssuch as monoglycerides (MG), diglycerides (DG) and soapswill inhibit the drop coalescence and favor formation of astable emulsion of small drops. In other words, due tothe increase of the interfacial area between the two immis-cible phases, the TG mass transfer rate limits no longer theoverall methanolysis rate. The stable emulsion of smalldrops could be considered as a pseudo-homogeneous sys-tem. Finally, both depletion of the reactants and formationof the products result in more dominant reverse reactionsand equilibrium is approached. The reduction of catalyst
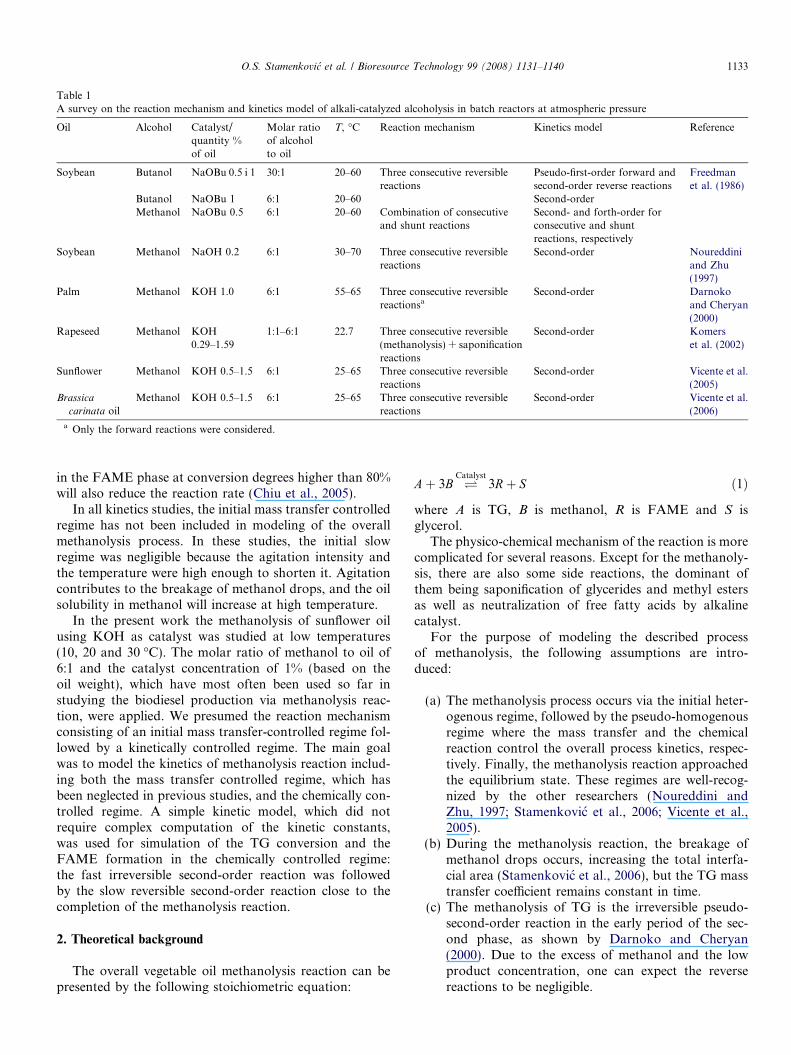
Table 1A survey on the reaction mechanism and kinetics model of alkali-catalyzed alcoholysis in batch reactors at atmospheric pressure
Oil Alcohol Catalyst/quantity %of oil
Molar ratioof alcoholto oil
T, �C Reaction mechanism Kinetics model Reference
Soybean Butanol NaOBu 0.5 i 1 30:1 20–60 Three consecutive reversiblereactions
Pseudo-first-order forward andsecond-order reverse reactions
Freedmanet al. (1986)
Butanol NaOBu 1 6:1 20–60 Second-orderMethanol NaOBu 0.5 6:1 20–60 Combination of consecutive
and shunt reactionsSecond- and forth-order forconsecutive and shuntreactions, respectively
Soybean Methanol NaOH 0.2 6:1 30–70 Three consecutive reversiblereactions
Second-order Noureddiniand Zhu(1997)
Palm Methanol KOH 1.0 6:1 55–65 Three consecutive reversiblereactionsa
Second-order Darnokoand Cheryan(2000)
Rapeseed Methanol KOH0.29–1.59
1:1–6:1 22.7 Three consecutive reversible(methanolysis) + saponificationreactions
Second-order Komerset al. (2002)
Sunflower Methanol KOH 0.5–1.5 6:1 25–65 Three consecutive reversiblereactions
Second-order Vicente et al.(2005)
Brassica
carinata oilMethanol KOH 0.5–1.5 6:1 25–65 Three consecutive reversible
reactionsSecond-order Vicente et al.
(2006)
a Only the forward reactions were considered.
O.S. Stamenkovic et al. / Bioresource Technology 99 (2008) 1131–1140 1133
in the FAME phase at conversion degrees higher than 80%will also reduce the reaction rate (Chiu et al., 2005).
In all kinetics studies, the initial mass transfer controlledregime has not been included in modeling of the overallmethanolysis process. In these studies, the initial slowregime was negligible because the agitation intensity andthe temperature were high enough to shorten it. Agitationcontributes to the breakage of methanol drops, and the oilsolubility in methanol will increase at high temperature.
In the present work the methanolysis of sunflower oilusing KOH as catalyst was studied at low temperatures(10, 20 and 30 �C). The molar ratio of methanol to oil of6:1 and the catalyst concentration of 1% (based on theoil weight), which have most often been used so far instudying the biodiesel production via methanolysis reac-tion, were applied. We presumed the reaction mechanismconsisting of an initial mass transfer-controlled regime fol-lowed by a kinetically controlled regime. The main goalwas to model the kinetics of methanolysis reaction includ-ing both the mass transfer controlled regime, which hasbeen neglected in previous studies, and the chemically con-trolled regime. A simple kinetic model, which did notrequire complex computation of the kinetic constants,was used for simulation of the TG conversion and theFAME formation in the chemically controlled regime:the fast irreversible second-order reaction was followedby the slow reversible second-order reaction close to thecompletion of the methanolysis reaction.
2. Theoretical background
The overall vegetable oil methanolysis reaction can bepresented by the following stoichiometric equation:
Aþ 3B �Catalyst
3Rþ S ð1Þ
where A is TG, B is methanol, R is FAME and S isglycerol.
The physico-chemical mechanism of the reaction is morecomplicated for several reasons. Except for the methanoly-sis, there are also some side reactions, the dominant ofthem being saponification of glycerides and methyl estersas well as neutralization of free fatty acids by alkalinecatalyst.
For the purpose of modeling the described processof methanolysis, the following assumptions are intro-duced:
(a) The methanolysis process occurs via the initial heter-ogenous regime, followed by the pseudo-homogenousregime where the mass transfer and the chemicalreaction control the overall process kinetics, respec-tively. Finally, the methanolysis reaction approachedthe equilibrium state. These regimes are well-recog-nized by the other researchers (Noureddini andZhu, 1997; Stamenkovic et al., 2006; Vicente et al.,2005).
(b) During the methanolysis reaction, the breakage ofmethanol drops occurs, increasing the total interfa-cial area (Stamenkovic et al., 2006), but the TG masstransfer coefficient remains constant in time.
(c) The methanolysis of TG is the irreversible pseudo-second-order reaction in the early period of the sec-ond phase, as shown by Darnoko and Cheryan(2000). Due to the excess of methanol and the lowproduct concentration, one can expect the reversereactions to be negligible.

1134 O.S. Stamenkovic et al. / Bioresource Technology 99 (2008) 1131–1140
(d) Near to the equilibrium, the forward and reversereactions follow second-order overall kinetics. Thesecond-order mechanism for the forward and reversereactions has been previously demonstrated (Vicenteet al., 2005, 2006).
(e) Each of the two liquid phases (oil and alcohol) is per-fectly mixed, so the uniform composition could beassumed for both.
(f) The content of free fatty acid in the oil is negligible,so the free fatty acid neutralization can be ignored.Also, MG and DG are present in the oil in minorconcentrations.
(g) The saponification reaction is negligible at low reac-tion temperatures applied. Vicente et al. (2004)showed that the saponification reactions were insig-nificant because it accounted for a FAME yield lossof no more than 3 mol% when the sunflower oil meth-anolysis was carried out at 65 �C, using 1% of potas-sium hydroxide and a 6:1 sunflower oil:methanolmolar ratio. We expected that the FAME yieldloss be even lower for reactions carried out at lowertemperatures. Since the saponification reactionsthat consume the catalyst were supposed to be negli-gible, the catalyst concentration remains almost con-stant.
I phase
According to the assumption (a), the rate of TG disap-pearance must be equal to the rate of TG mass transferfrom the oil phase into the drop of methanol:
ð�rAÞ ¼ �dcA
dt¼ kcaðcA � cA;sÞ ð2Þ
where kc is the TG mass transfer coefficient; a is the specificinterfacial area; cA and cA,s are the TG concentrations inthe oil phase and on the interfacial area, respectively, andt is time.
The chemical reaction is faster than the mass transfer, socA,s! 0 and
� dcA
dt¼ kcacA ð3Þ
Since the TG concentration is related to the conversiondegree of TG, xA, as follows:
cA ¼ cAoð1� xAÞ ð4ÞEq. (3) can be transformed into
dxA
dt¼ kcað1� xAÞ ð5Þ
where cA and cAo are the actual and initial TGconcentrations.
The TG mass transfer coefficient for the mass transfercontrolled regime can be estimated from Eq. (5) in twoways. Firstly, the instantaneous values of the TG masstransfer coefficient are determined
kc ¼1
að1� xAÞdxA
dtð6Þ
The average value of the TG mass transfer coefficient isthen calculated. Secondly, the average value of the TGmass transfer coefficient can be calculated as the slope ofthe following linear relation:Z xA
0
dxA
að1� xAÞ¼ kc � t ð7Þ
The gradient and the integral in Eqs. (6) and (7), respec-tively are numerically calculated.
II phase
In the pseudo-homogeneous reaction regime, the masstransfer rate is faster than the chemical reaction rate dueto the increased interfacial area. According to the assump-tion (c), the reaction rate for TG in the first part of thisreaction regime is as follows:
ð�rAÞ ¼ �dcA
dt¼ k2c2
A ð8Þ
that is
� dxA
dt¼ k2cAoð1� xAÞ2 ð9Þ
where k2 is the reaction rate constant for the irreversiblepseudo-second-order reaction. Integration of Eq. (9) yields:
1
1� xA
¼ k2cAot þ C1 ð10Þ
where C1 is the integration constant. The reaction rate andintegration constants can be estimated from the slope andintercept of the linear dependence of 1/(1�xA) versus time,respectively.
According to the assumption (d), the methanolysis reac-tion rate close to the equilibrium is
ð�rAÞ ¼ �dcA
dt¼~k2cAcB � k
2cRcS ð11Þ
where~k2 and k
2 are the reaction rate constants for the for-ward and reverse reactions, respectively and cB, cR and cS
are the actual concentrations of methanol, FAME andglycerol, respectively. The initial concentrations of FAMEand glycerol are zero and the initial concentration of meth-anol is cBo. Since cB = cBo � 3cAoxA, cR = 3cAoxA andcS = cAoxA, it follows that:
dxA
dt¼~k2ð1� xAÞðcBo � 3cAoxAÞ � 3 k
2cAox2
A ð12Þ
and
dxA
3Mð1� KÞx2A � ð1þ 3MÞxA þ 1
¼~k2cBo dt ð13Þ
where K ¼ k
2=~k2 is the reciprocal value of the equilibriumconstant for the overall methanolysis reaction, and

O.S. Stamenkovic et al. / Bioresource Technology 99 (2008) 1131–1140 1135
M = cAo/cBo is the initial molar ratio of TG to methanol(=1/6).
Upon integration, the following equation is obtained:
ln½6Mð1� KÞxA � ð1þ 3MÞ �
ffiffiffiffiffiffiffi�Dp
�½6Mð1� KÞxA � ð1þ 3MÞ þ
ffiffiffiffiffiffiffi�Dp
�¼ f ðxAÞ ¼~k2cBot
ffiffiffiffiffiffiffi�Dp
þ C2 ð14Þ
where D = 4 Æ 3M(1 � K) � (1 + 3M)2 < 0 and C2 is theintegration constant. The reaction rate constant ~k2 can beestimated from the slope of Eq. (14).
The equilibrium constant can be calculated from theequilibrium degree of TG conversion, xAe, which can beexperimentally determined, since it is
dxA
dt¼~k2cBo½ð1� xAeÞð1� 3MxAeÞ � 3KMx2
Ae� ¼ 0 ð15Þ
or
K ¼ 3Mx2Ae � ð1þ 3MÞxAe þ 1
3Mx2Ae
ð16Þ
3. Experimental
3.1. Materials
Refined and edible sunflower oil (Sunce, Sombor, Ser-bia) was used. The acid, saponification and iodine valuesof the oil were 0.24 mg KOH/g, 190 mg KOH/g and129 g J2/100 g, respectively, determined according to theAOCS official methods (AOCS, 1980). Certified methanolof 99.8% purity was purchased from Lachema (Neratovice,Czech Republic). KOH pellets of 85% purity were pur-chased from Merck-Alkaloid (Skopje, FYR of Macedo-nia). Methanol, 2-propanol and n-hexane, all of HPLCgrade, were obtained from LAB-SCAN (Dublin, Ireland).The HPLC standards for FAME containing methyl estersof palmitic, stearic, oleic, linolenic and linoleic acids (20%of each ester), triolein, diolein and monoolein were pur-chased from Sigma Co.
3.2. Equipment
The reaction was carried out in a 1-L glass reactorequipped with a two flat-blade paddle agitator. The impel-ler diameter and blade width were 75 and 25 mm, respec-tively. The impeller was placed concentricly at 36 mmfrom the bottom. The reactor was immersed in a glasschamber filled with water circulating from a thermostatedbath by means of a pump. The reactor was filled with820 mL of the emulsion (the emulsion height: 108 mm).
3.3. Reaction conditions
The 6:1 molar ratio of methanol to sunflower oil wasused in all experiments. KOH (1.0 g per 100 g of oil) wasdissolved into methanol before use. The experiments were
carried out at 10, 20 or 30 �C and atmospheric pressure.The impeller speed of 200 rpm was applied to produce auniform dispersion of methanol into the oil (Stamenkovicet al., 2006).
3.4. Experimental procedure
The reactor was initially charged with 600 g of oil,placed in the constant-temperature chamber and thermo-stated to the desired temperature. Methanol (132 g) withdissolved potassium hydroxide (6 g), which was thermo-stated separately, was added to the reactor. As soon asthe mechanical stirrer was turned on, the reaction wastimed. For studying the kinetics, the samples (5 ml) wereremoved from the reaction mixture during the progress ofthe reaction, immediately quenched by adding a aqueoushydrochloric acid solution (1:4; 0.1 ml) and centrifuged(5000 rpm for 5 min). The upper layer was withdrawn, dis-solved in 2-propanol/n-hexane (5:4 v/v) in an appropriateratio and filtered through a 0.45 lm Millipore filter. Theresulting filtrate was used for HPLC analysis.
3.5. Analytical methods
3.5.1. Composition of reaction mixture
The composition of samples of the reaction mixture wasdetermined by HPLC, as described elsewhere (Stamenkovicet al., 2006). The conversion degree of TG was calculatedfrom the content of TG in the FAME/oil fraction of thereaction mixture, TG (in %), by the following equation:
xA ¼ 1� TG=100 ð17Þ
3.5.2. Drop size measurements
The same technique and procedure were used for a dropsize measurement as before (Stamenkovic et al., 2006).From 200 to 700 drops were measured photographicallywith the progress of the methanolysis reaction for eachoperational condition. The Sauter-mean drop diameter,d32, was calculated by Eq. (18):
d32 ¼P
nid3iP
nid2i
ð18Þ
where di is the drop diameter and ni is the number of dropswith diameter di.
The specific interfacial area, a, was calculated from theSauter-mean drop diameter, d32, and the holdup of dis-persed (alcoholic) phase, u:
a ¼ 6ud32
ð19Þ
The holdup of dispersed phase was estimated as the ratio ofits volume and the total emulsion volume. Both the alco-holic phase volume and the total emulsion volume werecalculated from the initial volumes of methanol and oilas well as the changes of the reaction volume due to the

1136 O.S. Stamenkovic et al. / Bioresource Technology 99 (2008) 1131–1140
glycerol and FAME formation and the methanol and oildepletion at different conversion degrees of TG.
4. Results and discussion
4.1. Methanolysis reaction analysis
Fig. 1 shows the variations of the reaction mixture com-position and the Sauter-mean drop diameter with the pro-
Fig. 1. Variations of the reaction mixture composition and the Sauter-mean drop diameter with the progress of the base-catalyzed methanolysisof sunflower oil at (a) 10 �C, (b) 20 �C and (c) 30 �C (FAME – s; MG –n; DG – h; TG – �; and d32 – d).
gress of the sunflower oil methanolysis reaction at threereaction temperatures. The shape of the curve representingthe variations of FAME concentration in time was sigmoi-dal at 10 and 20 �C, indicating three periods of the reac-tion. In the initial stage of the process the formation ofFAME was slow, then it increased in the medium stageand became slower and slower as the reaction approachedthe completion. This type of kinetics has already beenobserved for the methanolysis reaction (Noureddini andZhu, 1997; Stamenkovic et al., 2006; Vicente et al., 2005).As the reaction occurred at 30 �C the sigmoidal shape dis-appeared: the formation of FAME accelerated from thebeginning of the reaction and started to slow down as itapproached the equilibrium. At all temperatures thedecrease of the TG concentration followed the increase ofFAME concentration. The concentrations of intermediateproducts, MG and DG, increased in the first few minutesof the reaction achieving the maximum, then decreasedand finally stayed nearly constant. The reaction ratedecreased in the final stage of the methanolysis processdue to the depletion of the reactants and the formationof the products resulting in more dominant reverse reac-tions, so that equilibrium was approached.
The slow reaction in the initial period of the reaction atlower temperatures was due to poor mass transfer betweenthe reactants because of the low interfacial area. As Fig. 1shows, the initial drop size of the dispersed phase (metha-nol) reduced up to 10 times as the reaction proceeded.Also, with increasing the reaction temperature the rate ofdrop size reduction increased, while the duration of theslow and fast reaction regions decreased. The drop sizereduction might be related to the formation of MG, DGand soaps, which was faster at higher temperatures, too.As emulsifying agents (Gutsche, 1997), these productsfavored formation of a stable emulsion of small drops thusresulting in enhancement of the total interfacial area (Sta-menkovic et al., 2006) and consequently the TG masstransfer rate towards the interface of the two liquid phases.
The three observed periods of the overall methanolysisprocess differ kinetically from each other. Therefore, itseems appropriate to consider the reaction kinetics in everyperiod separately and in more details, as suggested in thetheoretical analysis.
4.1.1. Heterogeneous regime
During this regime, the reactants formed a two-phaseliquid system with a poor mass transfer of TG from thebulk of oil towards the interface. It was proposed thatthe mass transfer limited the overall process rate and theTG mass transfer coefficient was assumed to be constant.These assumptions were confirmed by estimating the aver-age value of the TG mass transfer coefficient in the initialstage of the methanolysis reaction according to Eq. (7),as shown in Fig. 2. The sigmoidal fit of the experimentaldata on the TG conversion degree was first produced bythe Boltzman function, and then the integral on the left sideof Eq. (7) was calculated. The model, represented by Eq.
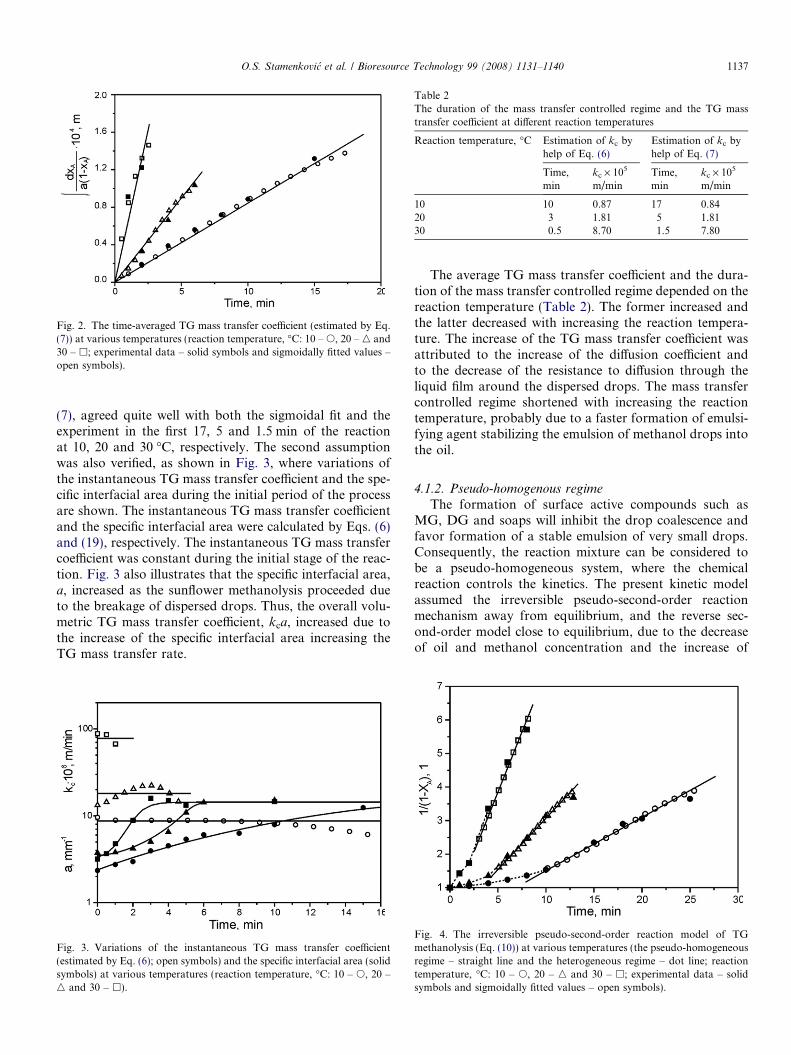
Fig. 2. The time-averaged TG mass transfer coefficient (estimated by Eq.(7)) at various temperatures (reaction temperature, �C: 10 – s, 20 – n and30 – h; experimental data – solid symbols and sigmoidally fitted values –open symbols).
Table 2The duration of the mass transfer controlled regime and the TG masstransfer coefficient at different reaction temperatures
Reaction temperature, �C Estimation of kc byhelp of Eq. (6)
Estimation of kc byhelp of Eq. (7)
Time,min
kc · 105
m/minTime,min
kc · 105
m/min
10 10 0.87 17 0.8420 3 1.81 5 1.8130 0.5 8.70 1.5 7.80
O.S. Stamenkovic et al. / Bioresource Technology 99 (2008) 1131–1140 1137
(7), agreed quite well with both the sigmoidal fit and theexperiment in the first 17, 5 and 1.5 min of the reactionat 10, 20 and 30 �C, respectively. The second assumptionwas also verified, as shown in Fig. 3, where variations ofthe instantaneous TG mass transfer coefficient and the spe-cific interfacial area during the initial period of the processare shown. The instantaneous TG mass transfer coefficientand the specific interfacial area were calculated by Eqs. (6)and (19), respectively. The instantaneous TG mass transfercoefficient was constant during the initial stage of the reac-tion. Fig. 3 also illustrates that the specific interfacial area,a, increased as the sunflower methanolysis proceeded dueto the breakage of dispersed drops. Thus, the overall volu-metric TG mass transfer coefficient, kca, increased due tothe increase of the specific interfacial area increasing theTG mass transfer rate.
Fig. 3. Variations of the instantaneous TG mass transfer coefficient(estimated by Eq. (6); open symbols) and the specific interfacial area (solidsymbols) at various temperatures (reaction temperature, �C: 10 – s, 20 –n and 30 – h).
The average TG mass transfer coefficient and the dura-tion of the mass transfer controlled regime depended on thereaction temperature (Table 2). The former increased andthe latter decreased with increasing the reaction tempera-ture. The increase of the TG mass transfer coefficient wasattributed to the increase of the diffusion coefficient andto the decrease of the resistance to diffusion through theliquid film around the dispersed drops. The mass transfercontrolled regime shortened with increasing the reactiontemperature, probably due to a faster formation of emulsi-fying agent stabilizing the emulsion of methanol drops intothe oil.
4.1.2. Pseudo-homogenous regime
The formation of surface active compounds such asMG, DG and soaps will inhibit the drop coalescence andfavor formation of a stable emulsion of very small drops.Consequently, the reaction mixture can be considered tobe a pseudo-homogeneous system, where the chemicalreaction controls the kinetics. The present kinetic modelassumed the irreversible pseudo-second-order reactionmechanism away from equilibrium, and the reverse sec-ond-order model close to equilibrium, due to the decreaseof oil and methanol concentration and the increase of
Fig. 4. The irreversible pseudo-second-order reaction model of TGmethanolysis (Eq. (10)) at various temperatures (the pseudo-homogeneousregime – straight line and the heterogeneous regime – dot line; reactiontemperature, �C: 10 – s, 20 – n and 30 – h; experimental data – solidsymbols and sigmoidally fitted values – open symbols).

Fig. 5. The reverse second-order reaction model of TG methanolysis (Eq.(14)) at various temperatures (the pseudo-homogeneous regime close toequilibrium – straight line; the heterogeneous regime and the pseudo-homogeneous regime with the irreversible reaction – dot line; reactiontemperature, �C: 10 – s, 20 – n and 30 – h; experimental data – solidsymbols and sigmoidally fitted values – open symbols).
Fig. 6. Arrhenius plot of reaction rate versus temperature (k2 – d,~k2 – m
and k
2 – j).
1138 O.S. Stamenkovic et al. / Bioresource Technology 99 (2008) 1131–1140
glycerol and FAME concentrations. Figs. 4 and 5 showthat Eqs. (10) and (14), corresponding to the irreversiblepseudo-second-order and reverse second-order reactions,respectively were valid thus confirming the proposed reac-tion mechanisms in the pseudo-homogeneous regime. Thereaction rate constants were calculated from the slopes ofthe linear curves (Table 3). As expected, all the rate con-stants increased by increasing the reaction temperature.
Fig. 6 shows the dependence of ln(k2), lnð~k2Þ and lnð k
2Þon 1/T, confirming that the Arrhenius equation could beapplied for determining the activation energies for themethanolysis reactions:
k ¼ A � expð�Ea=RT Þ ð20Þwhere A is the pre-exponential factor, Ea is the activationenergy, and R is the gas constant. The activation energieswere calculated to be 53.5, 33.2 and 34.2 kJ/mol for theirreversible second-order reaction, the forward second-or-der reaction and the reverse second-order reaction, respec-tively. The calculated activation energies are of the sameorder as those for the three step reactions obtained in otherstudies (Freedman et al., 1986; Noureddini and Zhu, 1997;Darnoko and Cheryan, 2000; Vicente et al., 2005, 2006).
Table 3The rate constants for the pseudo-homogeneous regime at differenttemperatures
Reactiontemperature,�C
k2~k2 k
2
dm3
mol mindm3
mol mindm3
mol min
10 0.188 0.036 0.01620 0.359 0.065 0.02830 0.854 0.092 0.043
4.2. Simulation of methanolysis process
The changes of the FAME concentration with reactiontime were satisfactorily described by both the sigmoidalfit and the proposed kinetic model. The relative deviationsof calculated (based on the sigmoidal fit) and experimentalTG conversion degree were ±1.7%, ±3.9% and ±2.7% at10, 20 and 30 �C, respectively. The TG conversion degreebased on the proposed kinetic model was calculated fromthe following equations:
– for 0 < t 6 t1 (the heterogeneous regime)Z xA
0
dxA
að1� xAÞ¼ kct ð21Þ
– for t1 6 t 6 t2 (the pseudo-homogeneous regime with theirreversible pseudo-second-order reaction)
xA ¼ 1� 1
k2cAot þ C1
ð22Þ
– for t P t2 (the pseudo-homogeneous regime with thereversible pseudo-second-order reaction)
xA ¼½�ð1þ 3MÞ �
ffiffiffiffiffiffiffi�Dp
� � expð~k2cBo
ffiffiffiffiffiffiffi�Dp
þ C2Þ½6Mð1� KÞ�½1� expð~k2cBo
ffiffiffiffiffiffiffi�Dp
þ C2Þ�ð23Þ
In the case of Eq. (21), the TG conversion degree wasnumerically calculated. Fig. 7 shows a good agreement be-tween the proposed kinetic model for the TG depletion andthe experiment at different temperature. The relative devia-tions of the calculated (based on the kinetic model) and theexperimental TG conversion degree were ±2.8%, ±4.6%and ±2.7% at 10, 20 and 30 �C, respectively.
The kinetic model was also compared with the experi-ment based on the variations of the molar concentrationsof TG and FAME. The molar TG concentration was calcu-lated by Eq. (4). The molar FAME concentration was cal-

Fig. 7. Comparison of the proposed kinetic model, the sigmoidal fit andthe experiment during methanolysis at (a) 10 �C, (b) 20 �C and (c) 30 �C(mass transfer controlled region: (- - - -); irreversible pseudo-second-orderreaction: (�ÆÆ�ÆÆ�ÆÆ); reversible second-order reaction: (—–); and experi-mental data: (d)).
Fig. 8. Comparison of the TG and FAME concentrations calculated bythe kinetic model (straight lines) with the experimental data (TG – d andFAME – m) at (a) 10 �C, (b) 20 �C, and (c) 30 �C.
O.S. Stamenkovic et al. / Bioresource Technology 99 (2008) 1131–1140 1139
culated using the TG conversion degree corrected for theMG and DG formation. Fig. 8 shows that the kinetic
model agrees quite well with the experimental data, espe-cially at higher temperatures.
5. Conclusions
The kinetics of the sunflower oil methanolysis processwas studied at lower temperatures (30 �C and lower) inorder to confirm the existence of mass transfer limitationsin the initial stage of the process and to explain its sigmoi-dal shape of the kinetic curves. The sigmoidal kinetics ofthe process was explained by the mass transfer controlled

1140 O.S. Stamenkovic et al. / Bioresource Technology 99 (2008) 1131–1140
region in the initial heterogeneous regime, followed by thechemical reaction controlled region in the pseudo-homoge-nous regime. In the latter regime, the fast irreversible sec-ond-order reaction was followed by the slow reversiblesecond-order reaction close to the completion of the meth-anolysis reaction.
The effect of the mass transfer in the initial period of theprocess was followed by measuring the drop size of the dis-persed (methanol) phase. The drop size reduced rapidlywith the progress of the methanolysis reaction and the rateof drop size reduction increased as the reaction tempera-ture increased, despite the agitation rate being constant.It might be related to the formation of the emulsifyingagents stabilizing the emulsion of methanol drops intothe oil, which were formed faster at higher temperature,too. Thus, the mass transfer limitation was important atlower temperatures (10 and 20 �C) while it disappeared atthe highest reaction temperature applied (30 �C). The emul-sifying agent(s) inhibited the drop coalescence and stabi-lized the emulsion of methanol drops into the oil thuscausing the increase in the specific interfacial area andthe TG mass transfer rate. This also explained why the agi-tation was no longer needed once the two immisciblephases were mixed and the reaction was started (Maet al., 1999), as well as why the mass transfer limitationwas not observed at higher reaction temperatures (Noured-dini and Zhu, 1997; Vicente et al., 2005, 2006).
Acknowledgements
This work has been funded by the Ministry of Scienceand Environmental Protection of the Republic of Serbia
(Project TR6742B). The authors are thankful to Mr. Nov-ica Petrovic (Photoshop Lik, Leskovac, Serbia) for makingall the photographs.
References
AOCS, 1980. Official and Tentative Methods. American Oil Chemists’Society, Chicago.
Chiu, C.-W., Goff, M.J., Suppes, G.J., 2005. Distribution of methanol andcatalysts between biodiesel and glycerin phases. AIChE J. 51, 1274–1278.
Darnoko, D., Cheryan, M., 2000. Kinetics of palm oil transesterificationin a batch reactor. J. Am. Oil Chem. Soc. 77 (12), 1263–1267.
Freedman, B., Buttefield, R.O., Pryde, E.H., 1986. Transesterificationkinetics of soybean oil. J. Am. Oil Chem. Soc. 63 (10), 1375–1380.
Gutsche, B., 1997. Technologie der methylesterherstellung – anwendungfur die biodieselproduktion. Fett/Lipid. 99, 418–427.
Komers, K., Skopal, F., Stloukal, R., Machek, J., 2002. Kinetics andmechanism of the KOH-catalyzed methanolysis of rapeseed oil forbiodiesel production. Eur. J. Lipid Sci. Technol. 104, 728–737.
Ma, F., Clements, L.D., Hanna, M.A., 1999. The effect of mixing ontransesterification of beef tallow. Bioresour. Technol. 69, 289–293.
Noureddini, H., Zhu, D., 1997. Kinetics of transesterification of soybeanoil. J. Am. Oil Chem. Soc. 74 (11), 1457–1463.
Srivastava, A., Prasad, R., 2000. Triglycerides-based diesel fuels. Renew.Sustain. Energy Rev. 4, 111–133.
Stamenkovic, O.S., Lazic, M.L., Todorovic, Z.B., Veljkovic, V.B., Skala,D.U. 2006. The effect of agitation intensity on alkali-catalyzedmethanolysis of sunflower oil. Biores. Technol., in press,doi:10.1016/j.biortech.2006.09.024.
Vicente, G., Martinez, M., Aracil, J., 2004. Integrated biodiesel produc-tion: a comparison of different homogeneous catalysts systems. Biores.Technol. 92, 297–305.
Vicente, G., Martinez, M., Aracil, J., Esteban, A., 2005. Kinetics ofsunflower oil methanolysis. Ind. Eng. Chem. Res. 44, 5447–5454.
Vicente, G., Martinez, M., Aracil, J., 2006. Kinetics of Brassica carinata
oil methanolysis. Energy Fuels 20, 1722–1726.