Early generation selection strategy for yield and yield components in white oat
Upload
khangminh22Category
view
4download
0
2018 AARS, All rights reserved.* Corresponding author: [email protected]
Yield Forecasting and Spatial Analysis of Sunflower Productivity Using Geographic Information System
Muhammad Naveed Arshad*1,2, Syed Aftab Wajid1, Ashfaq Ahmad1, Fahd Rasul1, 5,Hamaad Raza Ahmad4, Muhammad Awais6, Muhammad Habib ur Rahman1,3
1 Agro-Climatology Laboratory, Department of Agronomy, University of Agriculture, 38040 Faisalabad, Pakistan2 John Muir Institute of Environment, University of California, 95616 Davis, CA, United States of America
3 Department of Agronomy, Muhammad Nawaz Sharif University of Agriculture, 60000, Multan Pakistan 4 Institute of Soil and Environmental Sciences, University of Agriculture, 38040 Faisalabad, Pakistan
5 AgWeatherNet, Washington StateUniversity, IAREC, Prosser, WA99350, United States of America6 Department of Agronomy, Islamia University, 63100 Bahawalpur, Pakistan
*Corresponding author: [email protected]
Abstract
Under changing climatic scenarios, precision agricultural practices are necessary that requires spatial relationship between land attributes and crop yield. To identify the spatial distribution of growth and achene yield of sunflower using GIS map overlay techniques, a field study was conducted at Agronomic Research Area, University of Agriculture, Faisalabad-Pakistan. Experiment was laid out in Randomized Complete Block design with split plot arrangement having irrigation levels in main plots (1, 3 and 5 irrigations) and nitrogen in sub plots (90, 120 and 150 Kg N ha-1) replicated three times. GPS data of 27 data points were marked using GARMIN eTrex30. Sunflower growth and yield parameters such as total dry matter, oil contents (%), oil yield and achene yield were included in the analysis. The map overlay analysis indicated that irrigation and nitrogen levels established the cause-effect relationships and GIS technique proves helpful in identifying the crop parameters that affects sunflower yield and can be managed with the help of precision agricultural practices.
Key words: sunflower, GIS, map overlay, precision agriculture, achene yield
1 Introduction
Edible oil production in Pakistan is very low as compared to other oil producing countries (Munir et al., 2007). With the passage of time, the situation is more severe under higher population growth rate which demands efficient utilization of land and water resources (Iqbal et al., 2008; Ali et al., 2011). Sunflower is important non-conventional oilseed crop that can only shortens the existing gaps among domestic productions and demands (Hu et al., 2008; Nasim et al., 2011). Koutroubas et al., 2008. Several scientists have reported that topography, climatic conditions, management practices and spatial variability effects within the field are considered as the main factors affecting sunflower
productivity. Although spatial variability is a natural phenomenon, however, efforts are underway to manage this factor by studying spatial relationships among the landscape attributes and the yield patterns (Bakhsh et al., 2000; Abbas et al., 2005; Ayoubi et al., 2007; Marques and Silva, 2008; Begue et al., 2010). The spatial variability effects in the field may be an outcome of interaction of many complex factors such as soil properties, climatic conditions and management practices (Jung et al., 2006; Piotrowska et al., 2011).
Bakhsh and Kanwar (2005) reported that soil characteristics vary from point to point within a field and therefore, have varying nutrients potential in the field. Several studies have concluded that variations in the yield pattern are basically the result of spatial variability which are controlled by soil properties and management practices (Piotrowska et al., 2011). Understanding the cause-effect relationship of the sunflower yield patterns and the underlying spatial variability
Yield Forecasting and Spatial Analysis of Sunflower productivity using Geographic Information System
2
effects can help improve crop productivity. There is a need to treat the soils according to their productivity potential. One such strategy has been recognized as precision farming.
Precision farming practices are used to identify, analyze and manage spatial variability effects within the field in order to optimize profitability, sustainability and environmental protection (Duffera et al., 2007). To make precision farming a viable practice, there is a need to have better understanding of the functional relationships between soil properties, topography and crop yields. Geographic Information System (GIS) have been used to identify influence of the landscape attributes on crop yield patterns (Behera & Panda, 2009; Bernard & Yakubu, 2010; Noori et al., 2011). GIS has also been used to overlay data layers of landscape attributes to establish the spatial relationships. To understand spatial variability effects on crop yield, many researchers have used GIS as a management tool to address these repercussions. A study was conducted by Yang et al. (1998) using GIS found that topographic attributes have an influence on the crop yield variability in the Palouse region. Moreover, the effect of soil and topographic attributes on yield variability can be explained well when data layers of these soil attributes are overlaid on the yield data layers. Many researchers have used map overlay analysis to determine the integrated effects of various factors (Hashmi et al., 1995; Diaz et al., 1998). GIS software has ability to generate and overlay various data layers in order to investigate their interaction with each other over space and time domain (Bakhsh et al., 2007). Keeping in view the above referred research work, no study has been conducted so far to identify the influencing parameters affecting sunflower yield using GIS approach and then overlay these parameters to investigate their spatial relationships. Therefore, this study has been designed with
the following specific objectives:
• To identify the irrigation levels and nitrogen rates affecting sunflower yield.
• To investigate the spatial relationships of resources with crop growth and yield patterns using ArcGIS software.
2. Material and Methods
The experiment was conducted at Agronomic Research Area, University of Agriculture, Faisalabad (31o.26” N, 73o.06” E and Altitude 184.4m) during spring season of 2014 to study the spatial variability of sunflower productivity as influenced by irrigation levels and nitrogen rates.
2.1 Crop Husbandry
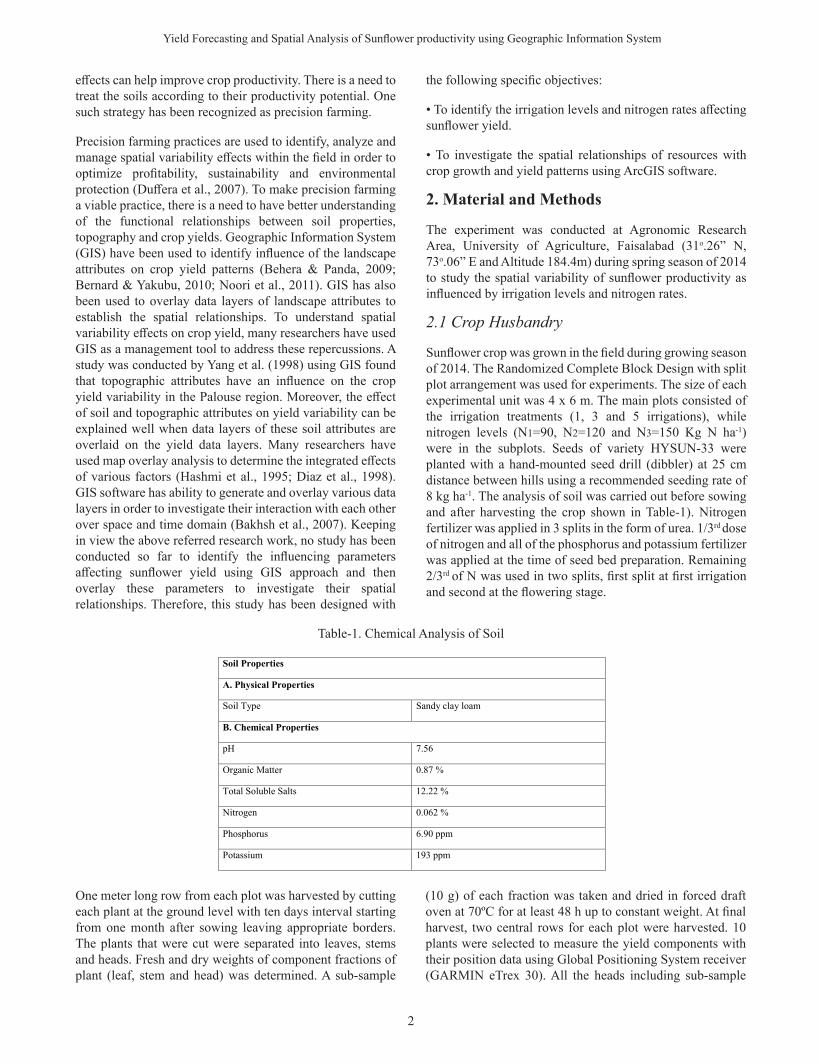
Sunflower crop was grown in the field during growing season of 2014. The Randomized Complete Block Design with split plot arrangement was used for experiments. The size of each experimental unit was 4 x 6 m. The main plots consisted of the irrigation treatments (1, 3 and 5 irrigations), while nitrogen levels (N1=90, N2=120 and N3=150 Kg N ha-1) were in the subplots. Seeds of variety HYSUN-33 were planted with a hand-mounted seed drill (dibbler) at 25 cm distance between hills using a recommended seeding rate of 8 kg ha-1. The analysis of soil was carried out before sowing and after harvesting the crop shown in Table-1). Nitrogen fertilizer was applied in 3 splits in the form of urea. 1/3rd dose of nitrogen and all of the phosphorus and potassium fertilizer was applied at the time of seed bed preparation. Remaining 2/3rd of N was used in two splits, first split at first irrigation and second at the flowering stage.
(10 g) of each fraction was taken and dried in forced draft oven at 70ºC for at least 48 h up to constant weight. At final harvest, two central rows for each plot were harvested. 10 plants were selected to measure the yield components with their position data using Global Positioning System receiver (GARMIN eTrex 30). All the heads including sub-sample
One meter long row from each plot was harvested by cutting each plant at the ground level with ten days interval starting from one month after sowing leaving appropriate borders. The plants that were cut were separated into leaves, stems and heads. Fresh and dry weights of component fractions of plant (leaf, stem and head) was determined. A sub-sample
4
Table-1 Chemical Analysis of Soil
Soil Properties
A. Physical Properties
Soil Type Sandy clay loam
B. Chemical Properties
pH 7.56
Organic Matter 0.87 %
Total Soluble Salts 12.22 %
Nitrogen 0.062 %
Phosphorus 6.90 ppm
Potassium 193 ppm
One meter long row from each plot was harvested by cutting each plant at the ground
level with ten days interval starting from one month after sowing leaving appropriate borders.
The plants that were cut were separated into leaves, stems and heads. Fresh and dry weights of
component fractions of plant (leaf, stem and head) was determined. A sub-sample (10 g) of each
fraction was taken and dried in forced draft oven at 70ºC for at least 48 h up to constant weight.
At final harvest, two central rows for each plot were harvested. 10 plants were selected to
measure the yield components with their position data using Global Positioning System receiver
(GARMIN eTrex 30). All the heads including sub-sample were threshed manually to estimate
achene yield of entire plot and converted into kg ha-1. Oil contents were measured with the
Soxhlet fat extraction method as described by Miner et al. (1995) and Saleem (2004).
Wt. of flask + oil – wt. of flask
% Oil = --------------------------------------- × 100
Wt. of flask + seed – wt. of flask
Table-1. Chemical Analysis of Soil
Asian Journal of Geoinformatics, Vol.18,No.1 (2018)
%Oil =𝑊𝑊𝑊𝑊𝑊𝑊𝑊𝑊. 𝑜𝑜𝑜𝑜𝑜𝑜𝑜𝑜 𝑜𝑜𝑜𝑜𝑓𝑓𝑓𝑓𝑓𝑓𝑓𝑓𝑓𝑓𝑓𝑓𝑓𝑓𝑓𝑓 + 𝑜𝑜𝑜𝑜𝑜𝑜𝑜𝑜𝑓𝑓𝑓𝑓 −𝑊𝑊𝑊𝑊𝑊𝑊𝑊𝑊. 𝑜𝑜𝑜𝑜𝑜𝑜𝑜𝑜 𝑜𝑜𝑜𝑜𝑓𝑓𝑓𝑓𝑓𝑓𝑓𝑓𝑓𝑓𝑓𝑓𝑓𝑓𝑓𝑓𝑊𝑊𝑊𝑊𝑊𝑊𝑊𝑊. 𝑜𝑜𝑜𝑜𝑜𝑜𝑜𝑜 𝑜𝑜𝑜𝑜𝑓𝑓𝑓𝑓𝑓𝑓𝑓𝑓𝑓𝑓𝑓𝑓𝑓𝑓𝑓𝑓 + 𝑓𝑓𝑓𝑓𝑠𝑠𝑠𝑠𝑠𝑠𝑠𝑠𝑠𝑠𝑠𝑠 −𝑊𝑊𝑊𝑊𝑊𝑊𝑊𝑊. 𝑜𝑜𝑜𝑜𝑜𝑜𝑜𝑜 𝑜𝑜𝑜𝑜𝑓𝑓𝑓𝑓𝑓𝑓𝑓𝑓𝑓𝑓𝑓𝑓𝑓𝑓𝑓𝑓
3
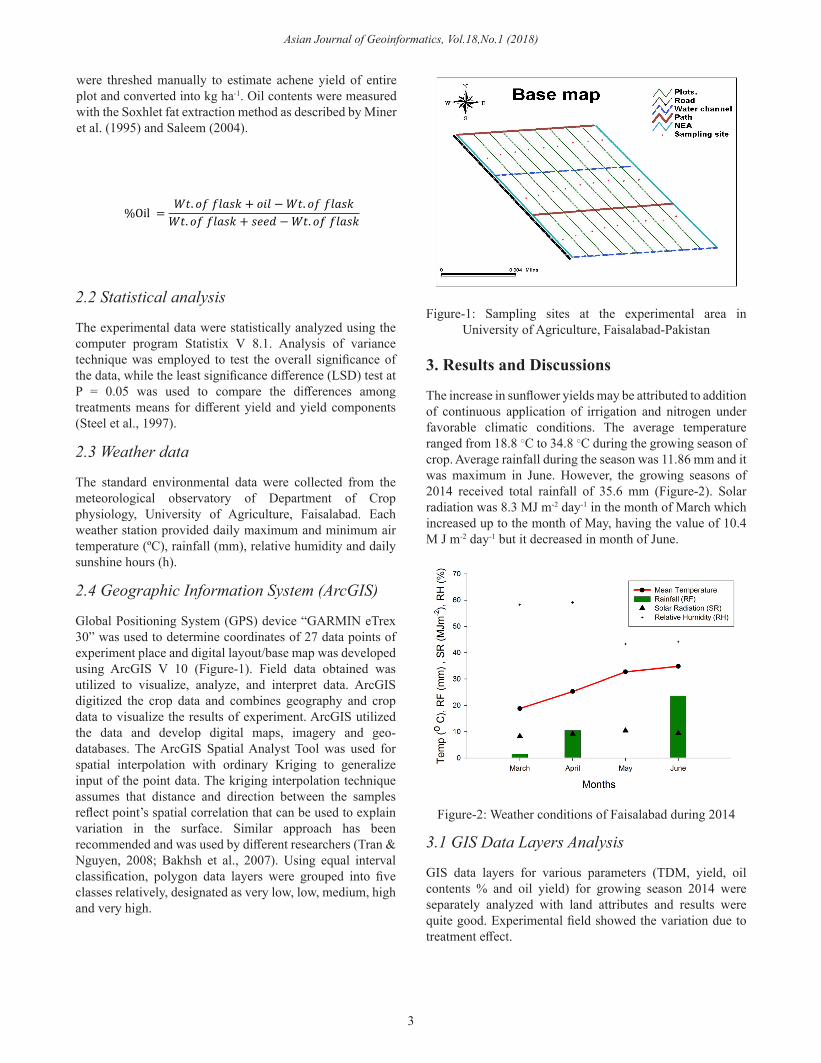
Figure-1: Sampling sites at the experimental area in University of Agriculture, Faisalabad-Pakistan
Figure-2: Weather conditions of Faisalabad during 2014
were threshed manually to estimate achene yield of entire plot and converted into kg ha-1. Oil contents were measured with the Soxhlet fat extraction method as described by Miner et al. (1995) and Saleem (2004).
2.2 Statistical analysis
The experimental data were statistically analyzed using the computer program Statistix V 8.1. Analysis of variance technique was employed to test the overall significance of the data, while the least significance difference (LSD) test at P = 0.05 was used to compare the differences among treatments means for different yield and yield components (Steel et al., 1997).
2.3 Weather data
The standard environmental data were collected from the meteorological observatory of Department of Crop physiology, University of Agriculture, Faisalabad. Each weather station provided daily maximum and minimum air temperature (ºC), rainfall (mm), relative humidity and daily sunshine hours (h).
2.4 Geographic Information System (ArcGIS)
Global Positioning System (GPS) device “GARMIN eTrex 30” was used to determine coordinates of 27 data points of experiment place and digital layout/base map was developed using ArcGIS V 10 (Figure-1). Field data obtained was utilized to visualize, analyze, and interpret data. ArcGIS digitized the crop data and combines geography and crop data to visualize the results of experiment. ArcGIS utilized the data and develop digital maps, imagery and geo-databases. The ArcGIS Spatial Analyst Tool was used for spatial interpolation with ordinary Kriging to generalize input of the point data. The kriging interpolation technique assumes that distance and direction between the samples reflect point’s spatial correlation that can be used to explain variation in the surface. Similar approach has been recommended and was used by different researchers (Tran & Nguyen, 2008; Bakhsh et al., 2007). Using equal interval classification, polygon data layers were grouped into five classes relatively, designated as very low, low, medium, high and very high.
Figure-1. Sampling sites at the experimental area in University of Agriculture, Faisalabad-
Pakistan
RESULTS AND DISCUSSIONS
The increase in sunflower yields may be attributed to addition of continuous application
of irrigation and nitrogen under favorable climatic conditions. The average temperature ranged
from 18.8 ○C to 34.8 ○C during the growing season of crop. Average rainfall during the season
was 11.86 mm and it was maximum in June. However, the growing seasons of 2014 received
total rainfall of 35.6 mm (Figure-2). Solar radiation was 8.3 MJ m-2 day-1 in the month of March
which increased up to the month of May, having the value of 10.4 M J m-2 day-1 but it decreased
in month of June.
6
3. Results and Discussions
The increase in sunflower yields may be attributed to addition of continuous application of irrigation and nitrogen under favorable climatic conditions. The average temperature ranged from 18.8 ○C to 34.8 ○C during the growing season of crop. Average rainfall during the season was 11.86 mm and it was maximum in June. However, the growing seasons of 2014 received total rainfall of 35.6 mm (Figure-2). Solar radiation was 8.3 MJ m-2 day-1 in the month of March which increased up to the month of May, having the value of 10.4 M J m-2 day-1 but it decreased in month of June.
Figure-2: Weather conditions of Faisalabad during 2014
GIS Data Layers Analysis
GIS data layers for various parameters (TDM, yield, oil contents % and oil yield) for
growing season 2014 were separately analyzed with land attributes and results were quite good.
Experimental field showed the variation due to treatment effect.
Total Dry Matter (Kg ha-1):
Total dry matter (TDM) is the total biomass produced by a plant on dry matter
accumulation basis, as a result of environmental conditions and soil nutrients uptake by the plant.
In general, the effect of nitrogen fertilizer was promotive and linear in the production of TDM.
Different nitrogen increments significantly affected TDM. Maximum TDM (8962.7 Kg ha-1) was
observed at nitrogen level of 150 kg ha-1 while minimum TDM (8184.2 Kg ha-1) was recorded at
nitrogen level of 90 kg ha-1. The enhancement in TDM with increasing rate of nitrogen was due
to better crop growth rate, which gave maximum photosynthates, LAI and ultimately produced
7
3.1 GIS Data Layers Analysis
GIS data layers for various parameters (TDM, yield, oil contents % and oil yield) for growing season 2014 were separately analyzed with land attributes and results were quite good. Experimental field showed the variation due to treatment effect.

Yield Forecasting and Spatial Analysis of Sunflower productivity using Geographic Information System
4
3.2 Total Dry Matter (Kg ha-1):
Total dry matter (TDM) is the total biomass produced by a plant on dry matter accumulation basis, as a result of environmental conditions and soil nutrients uptake by the plant. In general, the effect of nitrogen fertilizer was promotive and linear in the production of TDM. Different nitrogen increments significantly affected TDM. Maximum TDM (8962.7 Kg ha-1) was observed at nitrogen level of 150 kg ha-1 while minimum TDM (8184.2 Kg ha-1) was recorded at nitrogen level of 90 kg ha-1. The enhancement in TDM with increasing rate of nitrogen was due to better crop growth rate, which gave maximum photosynthates, LAI and ultimately produced more biological yield. Irrigation effect on TDM accumulation of sunflower was significant. Depending upon the irrigation levels, I1 (five irrigations)
more biological yield. Irrigation effect on TDM accumulation of sunflower was significant.
Depending upon the irrigation levels, I1 (five irrigations) gave the higher TDM (9120.8 g m-2) as
compared to I2 (3 irrigations). Lowest TDM (7544.8 Kg ha-1) was produced where only 1-
irrigation was applied. The interactive effect was positive and linear between irrigation levels
and nitrogen rates.
Similarly, under GIS map analysis, figure-3 showed that high value of total dry matter
observed in south western and north eastern parts of the field having nitrogen status of 150 kg ha-
1 which is actually treatment effect discussed earlier. Very low dry matter accumulation was
obtained in the zone of 90 kg ha-1 nitrogen dose in the south eastern part of the field and some
patches of low value in the center and north western part of the field. Similar trend shows by the
irrigation treatments in which five irrigations treatment show higher total dry matter than plots in
which only 1-irrigation was applied.
Figure-3: Map Overlay Analysis-Total Dry Matter of Sunflower
Oil Contents (%):
8
gave the higher TDM (9120.8 g m-2) as compared to I2 (3 irrigations). Lowest TDM (7544.8 Kg ha-1) was produced where only 1-irrigation was applied. The interactive effect was positive and linear between irrigation levels and nitrogen rates.
Similarly, under GIS map analysis, figure-3 showed that high value of total dry matter observed in south western and north eastern parts of the field having nitrogen status of 150 kg ha-1 which is actually treatment effect discussed earlier. Very low dry matter accumulation was obtained in the zone of 90 kg ha-1 nitrogen dose in the south eastern part of the field and some patches of low value in the center and north western part of the field. Similar trend shows by the irrigation treatments in which five irrigations treatment show higher total dry matter than plots in which only 1-irrigation was applied.
Figure-3: Map Overlay Analysis-Total Dry Matter of Sunflower
3.3 Oil Contents (%):
Treatment effects on achene oil content of sunflower were highly significant (Table-2). The oil contents were higher (40.5%) at 5-irrigations treatment followed by 3-irrigations (39.6 %) and the minimum oil content were observed in the plots where 1-irrigation was applied (38.5 %) as same reported by Hussain et al. (2000). The favorable climatic conditions (lower temperature and higher relative humidity) during growing season especially at achene filling stage might be the reason of higher oil content.
The data regarding achene oil content significantly affected by different nitrogen doses. The response of oil contents was decreasing with increasing application of nitrogen fertilizer. Maximum oil content (40.2%) were produced under treatment of 90 kg N ha-1 which was statistically higher than the plots having benefit of 30 Kg ha-1 more nitrogen that gained oil content of 39.7%. The minimum oil content (38.7%) observed by the treatment where there was maximum application of nitrogen fertilizer (150 kg N ha-1). This shows that with increasing nitrogen fertilizer, it increased the achene yield but reduced oil content. Such

Asian Journal of Geoinformatics, Vol.18,No.1 (2018)
5
Figure-5: Map Overlay Analysis-Oil Contents of Sunflower
3.4 Achene Oil Yield (Kg ha-1):
The achene oil yield of sunflower was highly significant for irrigation levels. Higher achene oil yield was recorded from irrigation at five growth stages of crop (1025 kg ha-1) followed by 3-irrigations (961 kg ha-1) and minimum oil yield (698 kg ha-1) was observed in treatment where 1-irrigation was applied.
Anzoua et al. (2010) also found a greater yield response for sunflower with N application under adequate soil moisture conditions. The response of nitrogen fertilizer rates was significant with application of more nitrogen fertilizer. Maximum oil yield (948 kg ha-1) was observed in N2 (120 kg N ha-1) treatment. In the similar way, N3 (150 kg N ha-1) treatment produced oil yield (936 kg ha-1) that was statistically higher than N1 (90 kg N ha-1) producing minimum value of oil yield (801 kg ha-1). Many researchers (Ahmad and Fayyaz-ul-Hassan, 2000; Abelardo and Hall, 2002) also noted a greater yield response for sunflower with N application.
The interactive effect of irrigation and nitrogen level was non-significant (Table-2). Relationship between achene yield and achene oil yield was linearly associated and value of R2
was 0.96 (Figure-7).
findings in response to N fertilization have also been reported by Dreher et al. (1983).
The interactive effect of irrigation and nitrogen level was non-significant (Table-2). Furthermore, the relationship between achene yield and achene oil content was linearly associated and value of R2 was 0.95 (Figure-4).
Figures-5 and 6 showed high values of achene oil content (%) and achene oil yield estimated in south western and north eastern parts of the field having nitrogen status of 150 kg ha-1 and a very low value was obtained in the zone of 90 kg ha-1 nitrogen dose in the south eastern part of the field and some patches of low value in the center and north western part of the field. Similar trend shows by the irrigation treatments.
Figure-4: Relationship between achene yield (Kg ha-1) and achene oil content (%)
Figure-5: Map Overlay Analysis-Oil Contents of Sunflower
10
Figure-4: Relationship between achene yield (Kg ha-1) and achene oil content (%)
Figure-5: Map Overlay Analysis-Oil Contents of Sunflower
10
Figure-4: Relationship between Achene Yield (Kg ha-1) and Achene Oil Content (%)
Figure-6: Map Overlay Analysis-Achene Oil Yield of Sunflower
Achene Oil Yield (Kg ha-1):
The achene oil yield of sunflower was highly significant for irrigation levels. Higher
achene oil yield was recorded from irrigation at five growth stages of crop (1025 kg ha-1)
followed by 3-irrigations (961 kg ha-1) and minimum oil yield (698 kg ha-1) was observed in
treatment where 1-irrigation was applied.
Anzoua et al. (2010) also found a greater yield response for sunflower with N application
under adequate soil moisture conditions. The response of nitrogen fertilizer rates was significant
with application of more nitrogen fertilizer. Maximum oil yield (948 kg ha-1) was observed in N2
(120 kg N ha-1) treatment. In the similar way, N3 (150 kg N ha-1) treatment produced oil yield
(936 kg ha-1) that was statistically higher than N1 (90 kg N ha-1) producing minimum value of oil
yield (801 kg ha-1). Many researchers (Ahmad and Fayyaz-ul-Hassan, 2000; Abelardo and Hall,
2002) also noted a greater yield response for sunflower with N application.
11
Figure-6: Map Overlay Analysis-Achene Oil Yield of Sunflower
The interactive effect of irrigation and nitrogen level was non-significant (Table-
2). Relationship between achene yield and achene oil yield was linearly associated and value of
R2 was 0.96 (Figure-7).
Figure-7: Relationship between achene yield (Kg ha-1) and achene oil yield (Kg ha-1)
Achene/grain Yield (Kg ha-1):
The effect of treatments on achene yield (AY) was highly significant during spring 2014. The
favorable climatic conditions (lower temperature and higher relative humidity) during growing
season especially at achene filling stage might be the reason of higher AY (Table-2). The data
regarding AY showed that, it was significantly affected by different irrigation levels. Higher AY
was recorded from plot having 5-irrigations (2532 kg ha-1) followed by 3-irrigations (2430 kg ha-
1). Lower achene yield was recorded from 1-irrigation treatment (1813 kg ha-1) and it was also
reported by Ghani et al. (2000); Erdem et al. (2001); Kakar and Soomro (2001).
The response of nitrogen fertilizer rates on AY was significant, increasing with
application of more nitrogen fertilizer. Ghani et al. (2000) also described a greater yield response
for sunflower with N application under adequate soil water conditions. The maximum AY (2409
12

Yield Forecasting and Spatial Analysis of Sunflower productivity using Geographic Information System
6
Figure-7: Relationship between Achene Yield (Kg ha-1) and Achene Oil Yield (Kg ha-1)
3.5 Achene/grain Yield (Kg ha-1):
The effect of treatments on achene yield (AY) was highly significant during spring 2014. The favorable climatic conditions (lower temperature and higher relative humidity) during growing season especially at achene filling stage might be the reason of higher AY (Table-2). The data regarding AY showed that, it was significantly affected by different irrigation levels. Higher AY was recorded from plot having 5-irrigations (2532 kg ha-1) followed by 3-irrigations (2430 kg ha-1). Lower achene yield was recorded from 1-irrigation treatment (1813 kg ha-1) and it was also reported by Ghani et al. (2000); Erdem et al. (2001); Kakar and Soomro (2001).
The response of nitrogen fertilizer rates on AY was significant, increasing with application of more nitrogen fertilizer. Ghani et al. (2000) also described a greater yield response for sunflower with N application under adequate soil water conditions. The maximum AY (2409 kg ha-1) was produced in N3 treatment (150 kg N ha-1). The standard treatment N2 (120 kg N ha-1) produced 2381 kg ha-1 AY, that was significantly higher than N1 (90 kg N ha-1) which produced minimum AY (1985 kg ha-1). An increase in AY of sunflower in response to N fertilization has also been reported by Munir et al. (2007) and Ozer et al. (2004).
The interactive effect of different irrigation levels and nitrogen level was non-significant (Table-2). The relationship of AY and TDM was linearly associated and the values of regression accounted for 0.95 variability in data (figure-9).
Figures-8 of GIS Map showed high values of achene yield estimated in south western and north eastern parts of the field having nitrogen status of 150 kg ha-1 and a very low value was obtained in the zone of 90 kg ha-1 nitrogen dose in the south eastern part of the field and some patches of low value in the center and north western part of the field. Similar trend shows by the irrigation treatments.
kg ha-1) was produced in N3 treatment (150 kg N ha-1). The standard treatment N2 (120 kg N ha-
1) produced 2381 kg ha-1 AY, that was significantly higher than N1 (90 kg N ha-1) which
produced minimum AY (1985 kg ha-1). An increase in AY of sunflower in response to N
fertilization has also been reported by Munir et al. (2007) and Ozer et al. (2004).
The interactive effect of different irrigation levels and nitrogen level was non-significant
(Table-2). The relationship of AY and TDM was linearly associated and the values of regression
accounted for 0.95 variability in data (figure-9).
Figures-8 of GIS Map showed high values of achene yield estimated in south western and north
eastern parts of the field having nitrogen status of 150 kg ha-1 and a very low value was obtained
in the zone of 90 kg ha-1 nitrogen dose in the south eastern part of the field and some patches of
low value in the center and north western part of the field. Similar trend shows by the irrigation
treatments.
Figure-8: Map Overlay Analysis-Achene Yield of Sunflower
13
Figure-8: Map Overlay Analysis-Achene Yield of Sunflower
Figure-9: Relationship between Achene yield (Kg ha-1) and Total dry matter (Kg ha-1)
Conclusions
Based on statistical analysis and map overlay analysis of the yield data and landscape attributes,
following conclusions are drawn: The statistical analysis identified the fertilizer treatments as the
most influencing parameter on growth, oil contents, achene and oil yield of sunflower.
Moreover, map overlay analysis showed that areas having higher yields, however, were
influenced by the integrated effects of higher soil nitrogen contents and higher number of
irrigations. These results indicate that the analysis carried out statistically and GIS approaches,
proved to be a useful approach to find the most influencing parameters affecting sunflower yield.
The map overlay analysis, however, helped in understanding the spatial distribution of the yield
pattern. This approach can be used to establish cause-effect relationships for adopting precision
agriculture.
14
Figure-9: Relationship between Achene Yield (Kg ha-1) and Total Dry Matter (Kg ha-1)
4. Conclusions
Based on statistical analysis and map overlay analysis of the yield data and landscape attributes, following conclusions are drawn: The statistical analysis identified the fertilizer treatments as the most influencing parameter on growth, oil contents, achene and oil yield of sunflower. Moreover, map overlay analysis showed that areas having higher yields, however, were influenced by the integrated effects of higher soil nitrogen contents and higher number of irrigations. These results indicate that the analysis carried out statistically and GIS approaches, proved to be a useful approach to find the most influencing parameters affecting sunflower yield. The map overlay analysis, however, helped in understanding the spatial distribution of the yield pattern. This approach can be used to establish cause-effect relationships for adopting precision agriculture.
Table-2. Effect of Irrigation and nitrogen levels on achene yield, TDM, oil contents and oil
yield.
TreatmentsAchene yield
(Kg ha-1)
TDM
(Kg ha-1)
Oil Contents
(%)
Oil Yield
(Kg ha-1)
Irrigation Levels
I1= 5-Irrigations 2532.2 a 9120.8 a 40.544 a 1025.6 a
I2=3-Irrigations 2430.2 a 9012.3 b 39.644 a 961.9 b
I3=1-Irrigation 1813.5 b 7544.8 c 38.533 b 698.2 c
LSD 5% 143.36 2.57 0.90 43.46
Significance ** ** * *
Nitrogen levels
N1=90 kg ha-1 1985.0 b 8184.2 c 40.289 a 801.44 b
N2=120 kg ha-1 2381.0 a 8550.8 b 39.711 a 948.10 a
N3=150 kg ha-1 2409.9 a 8962.7 a 38.722 b 936.09 a
LSD 5% 100.53 1.68 0.59 44.36
Significance ** ** * *
Interaction NS NS NS NS
Mean 2558.63 8562.6 1.66 0.448
Means having different letters differ significantly from each other by LSD (p=0.05)
Acknowledgments
Special thanks to Robert Hijman (Associate Professor, UCDAVIS, USA) for their support in
development of GIS Maps and other analysis.
15
Table-2. Effect of Irrigation and Nitrogen Levels on Achene Yield, TDM, Oil Contents and Oil Yield

Asian Journal of Geoinformatics, Vol.18,No.1 (2018)
7
References
Abbas M., Sheikh A.D., Sabir H. M. and Nighat S. (2005). Factors responsible for low wheat productivity in Central Punjab. Pakistan Journal Agricultural Sciences, 42, 3-4.
Abelardo J.V. and Hall A.J. (2002). Effects of planting date, genotype, and their interactions on sunflower yield: I. Determinants of oil-corrected grain yield. Crop Sci., 42, 1191-1201.
Ahmad S. and Fayyaz-ul-Hassan (2000). Oil yield and fatty acid composition of spring sunflower. Pak. J. Bio. Sci., 3, 2063-2064.
Ali A., Rehman F., Nasir M. and Ranjha M.Z. (2011). Agricultural policy and wheat production: a case study of Pakistan. Sarhad Journal of Agriculture, 27(3), 201-211.
Anzoua K.G., Junichi K., Toshihiro H., Kazuto I., Yutaka J. (2019). Genetic improvements for high yield and low soil nitrogen tolerance in rice (Oryza sativa L.) under a cold environment. Field Crops Res., 116, 38-45.
Ayoubi S., Zamani S.M. and Khormali F. (2007). Spatial variability of some soil properties for site specific farming in northern Iran. International Journal of Plant Production, 1(2), 1735-6814.
Bakhsh A. and Kanwar R.S. (2005). Spatial clusters of subsurface drainage water NO3-N Leaching losses. Journal of the American Water Resources Association, JAWRA, 41(2), 333-341.
Bakhsh A., Kanwar R.S. and Malone R.W. (2007). Role of landscape and hydrologic attributes in developing and interpreting yield clusters. Geroderma, 140(3), 235-246.
Begue A., Lebourgeois V., Bappe E., Todoroff P., Pellegrino A., Baillarin F. and Siegmund, B. (2010). Spatio-temporal variability of sugarcane fields and recommendations for yield forecast using NDVI. International Journal of Remote Sensing, 31(20), 5391–5407.
Behera S. and Pamda R. (2009). Effect of fertilization and irrigation schedule on water and fertilizer solute transport for wheat crop in a sub-humid sub-tropical region. Agric. Ecosyst. Environ., 130, 141-155.
Bernard K.B. and Yakubu I. (2010). Predicting the yield of crops using GIS/GPS integration-a case study at Benso oil palm plantation limited. European Journal of Scientific Research, 42(2), 314-325.
Acknowledgments:
Special thanks to Robert J. Hijmans(Associate Professor, UCDAVIS, USA) for his support in development of GIS Maps and other analysis.
Diaz D.R., Hernandez J.E.G. and Loague K. (1998). Leaching potentials of four pesticides used for bananas in the canary islands. Journal of Environmental Quality, 27(3), 562-572.
Dreher M.L., Roath W.W., Holm E.T. and Dappolonia B. (1983). Yield, characteristics and composition of oil-type hybrid sunflower seed grown in North Dakota. JAOCS, 60, 1876-1877.
Duffera M., White J.G. and Weisz R. (2007). Spatial variability of Southeastern U.S. Coastal Plain soil physical properties: Implications for site-specific management. Geoderma, 137, 327-339.
Erdem T., Delba L. and Orta A.H. (2001). Water-use characteristics of sunflower (Helianthus annuus L.) under deficit irrigation. Pak. J. Biol. Sci., 4(7),766-769.
Ghani A., Hussain M. and Anwar M.I. (2000). Effect of different levels of N fertilizer on yield and quality of sunflower. Int. J. Agric. Bio., 4, 400-401.
Hashmi M.A., Garcia L.A. and Fontane D.G. (1995). Spatial estimation of regional crop evapotranspiration. Transactions of the ASAE, 38(5), 1345-1351.
Hu J., Yue B., Yuan W. and Vick B.A. (2008). Growing sunflower plants from seed to seed in small pots in greenhouse. Helia, 48, 119-126.
Hussain M.K., Rasul E. and Ali S.K. (2000). Growth analysis of sunflower (Helianthus annuus L.) under drought conditions. Int. J. Agri. Biol., 2(1-2), 136-140.
Iqbal J., Hussain B., Saleem M.F., Munir M.A. and Aslam M. (2008). Bio-economics of autumn planted sunflower (Helianthus annuus L.) hybrids under different NPK applications. Pak. J. Agric. Sci., 45, 19-24.
Jung W.K., Kitchen N.R., Sudduth K.A. and Anderson S.H. (2006). Spatial characteristics of claypan soil properties in an agricultural field. Soil Sciences Society of America Journal, 70, 1387-1397.
Kakar A.A. and Soomro A.G. (2001). Effect of water stress on the growth, yield and oil content of sunflower. Pak. J. of Agri. Sci., 38(1-2), 73-74.
Koutroubas S.D., Papakosta D.K. and Doitsinis A. (2008). Nitrogen utilization efficiency of safflower hybrids and open-pollinated varieties under Mediterranean conditions. Field Crops Res., 107, 56-61.
Noori S.S.A., Ebrahimi M., Khazaei J. and khalaj H. (2011). Predicting yield of wheat genotypes at different salinity by artificial neural network. African Journal of Agricultural Research, 6(12), 2660-2675.

Yield Forecasting and Spatial Analysis of Sunflower productivity using Geographic Information System
8
Marques D.S.J.R. and Silva L.L. (2008). Evaluation of maize yield spatial variability based on field flow density. Biosystems Engineering, 101(2), 183-190.
Munir M.A., Malik M.A. and Saleem M.F. (2007). Impact of integration of crop manuring and nitrogen application on growth, yield and quality of spring planted sunflower (Helianthus annuus L.). Pak. J. Bot., 39, 441-449.
Nasim W., Ahmad A., Wajid A., Akhtar J. and Muhammad D. (2011). Nitrogen effects on growth and development of sunflower hybrids under agro-climatic conditions of Multan. Pakistan Journal of botany, 43(4), 2083-2092.
Ozer H., Polat T. and Ozturk E. (2004). Response of irrigated sunflower hybrids to nitrogen fertilization, growth, yield and yield components. Plant Soil Env., 50, 205-211.
Piotrowska A., Dlugosz J., Wilczynsk B.N. and Zamorski R. (2011). Field-scale variability of topsoil dehydrogenase and cellulase activities as affected by variability of some
physico-chemical properties. Biology and Fertility of Soils, 47, 101-109.
Saleem M.F. (2004). Agro-physiological response of autumn planted sunflower to management practices. PhD thesis, Department of Agronomy, University of Agriculture, Faisalabad-Pakistan.
Steel R.G.D. Torrie J.H. and Deekey D.A. (1997). Principles and procedures of statistics. A biometrical approach. 3nd Ed., McGraw Hill Book, Int. Co., New York, pp. 400-428.
Tran B.Q. and Nguyen T.T. (2008). Assessment of the influence of interpolation techniques on the accuracy of digital elevation model. VNU Journal of Science, Earth Sciences, 24, 176-183.
Yang C., Peterson C.L., Shropshire G.J. and Otawa T. (1998). Spatial variability of field topography and wheat yield in the palouse region of the Pacific Northwest. Transactions of the ASAE, 41(1), 17-27.
Copyright © 2022 FDOKUMEN