sunflower traits response to elevated co - doiSerbia
14
HELIA , 36 , Nr. 59, p.p. 85-98, (2013) UDC 633.854.78:631.547:631.559:632.11 DOI: 10.2298/HEL1359085V SUNFLOWER TRAITS RESPONSE TO ELEVATED CO 2 LEVELS UNDER COOL AND WARM SEASON CONDITIONS Vanaja, M. * , Maruthi Sankar, G.R., Maheswari, M., Raghuram Reddy, P., Jyothi Lakshmi, N., Yadav, S.K. , Archana, G. and Venkateswarlu, B. Central Research Institute for Dryland Agriculture, Santoshnagar, Hyderabad–500059, Andhra Pradesh, India Received: September 05, 2013 Accepted: December 05, 2013 SUMMARY A study was conducted in the Open Top Chambers (OTCs) to assess the influence of cool and warm season conditions on the response of sunflower (KBSH-1) to two elevated CO 2 levels (550 and 700 ppm) and compare them with the response to an ambient level (390 ppm). The effect of elevated CO 2 lev- els on biomass accumulation, seed yield and yield components were quantified in two seasons. Apart from the main effects of CO 2 and different seasons, a sig- nificant interaction effect between CO 2 levels and seasons was also observed. The CO 2 levels differed significantly in influencing biomass accumulation, seed yield and number of seeds. Four Principal Components (PC) based on PC anal- ysis explained about 85% of the variability in the response of traits influenced by CO 2 levels in winter and summer seasons. In order to predict total dry weight, seed yield and harvest index obtained in winter and summer seasons, regression models of these variables were also calibrated and used through PC scores of different components. The analysis indicated that significant predic- tions could be made at ambient level with 550 ppm, compared to 700 ppm of CO 2 level. The plant traits with a significantly higher loading of more than ± 0.70 on PCs were identified and have been recommended for future research in genetic improvement of sunflower, taking into account the change of climate due to elevated CO 2 and temperature levels. Key words: elevated CO 2 , correlation, principal components, regression, pre- diction, climate change INTRODUCTION The climate change is expected to result in hotter and drier environments in many parts of the world due to rising CO 2 and temperature. Global concentration of CO 2 in the atmosphere has been rising continuously and at present it is about 35% * Corresponding author: e-mail: [email protected]; [email protected]
-
Upload
khangminh22 -
Category
Documents
-
view
2 -
download
0
Transcript of sunflower traits response to elevated co - doiSerbia

HELIA, 36, Nr. 59, p.p. 85-98, (2013) UDC 633.854.78:631.547:631.559:632.11DOI: 10.2298/HEL1359085V
SUNFLOWER TRAITS RESPONSE TO ELEVATED CO2 LEVELS UNDER COOL AND WARM SEASON
CONDITIONS
Vanaja, M.*, Maruthi Sankar, G.R., Maheswari, M., Raghuram Reddy, P.,Jyothi Lakshmi, N., Yadav, S.K. , Archana, G. and Venkateswarlu, B.
Central Research Institute for Dryland Agriculture, Santoshnagar, Hyderabad–500059, Andhra Pradesh, India
Received: September 05, 2013Accepted: December 05, 2013
SUMMARY
A study was conducted in the Open Top Chambers (OTCs) to assess theinfluence of cool and warm season conditions on the response of sunflower(KBSH-1) to two elevated CO2 levels (550 and 700 ppm) and compare themwith the response to an ambient level (390 ppm). The effect of elevated CO2 lev-els on biomass accumulation, seed yield and yield components were quantifiedin two seasons. Apart from the main effects of CO2 and different seasons, a sig-nificant interaction effect between CO2 levels and seasons was also observed.The CO2 levels differed significantly in influencing biomass accumulation, seedyield and number of seeds. Four Principal Components (PC) based on PC anal-ysis explained about 85% of the variability in the response of traits influencedby CO2 levels in winter and summer seasons. In order to predict total dryweight, seed yield and harvest index obtained in winter and summer seasons,regression models of these variables were also calibrated and used through PCscores of different components. The analysis indicated that significant predic-tions could be made at ambient level with 550 ppm, compared to 700 ppm ofCO2 level. The plant traits with a significantly higher loading of more than ±0.70 on PCs were identified and have been recommended for future researchin genetic improvement of sunflower, taking into account the change of climatedue to elevated CO2 and temperature levels.
Key words: elevated CO2, correlation, principal components, regression, pre-diction, climate change
INTRODUCTION
The climate change is expected to result in hotter and drier environments inmany parts of the world due to rising CO2 and temperature. Global concentration ofCO2 in the atmosphere has been rising continuously and at present it is about 35%
* Corresponding author: e-mail: [email protected]; [email protected]

86 HELIA, 36, Nr. 59, p.p. 85-98, (2013)
higher than before the industrial revolution. The present mean CO2 level of 390ppm is expected to reach the levels of 650 to 970 ppm by the end of the 21st century(IPCC, 2007). The mean global temperature increased by 0.6°C in the 20th century(Folland et al., 2001) and is expected to increase between 1.7°C and 4.9°C by 2100(Cubasch et al., 2001). Changes in the CO2 concentration and associated changesin the global temperature would cause significant changes in the crop production.The increasing temperature is expected to have a significant effect on the yield ofannual crops (Alexandrov and Hoogenboom, 2000).
Sunflower is one of four most important oil seed crop and globally it is culti-vated in the area of 25,225 thousand ha with the annual production of 35,568 MTand productivity of 1.41 MT ha-1 (www.sunflowernsa.com) in 2012-13. In India,sunflower is grown in the area of 1.88 million ha with the production of 620 MTand productivity of 694 kg ha-1. The optimum growth temperature for sunflower is20 to 35°C. Tubiello and Ewert (2002) reported that increasing CO2 levels in atmos-phere would raise the optimum growth temperature of the crop significantly.
The important objective of any plant scientist is to identify an optimum numberof plant traits which are sufficient to explain the maximum variability in the cropgrowth, from sowing to harvest. Based on the principal component analysis, we canidentify important plant traits for explaining the maximum variability in the cropgrowth (Dunteman et al., 1989). McMurtrie et al. (1992) examined forest growthmodels and explored mathematical models to assess the response of tree stands tothe elevated CO2 levels and increased temperature. Similarly, the impact of climatechange on wheat yields was modeled by Ozdogon (2011). The changes in sunflowercrop growth were modeled based on the observations recorded on plant traits usingregression models (Maruthi Sankar et al., 1999) and principal component models(Maruthi Sankar et al., 2003 and 2004). The elevated CO2 and temperature wouldinteract to impact plant growth and productivity, which is the vital issue for anycrop to fit into the changing climatic conditions. The present study was carried outto (i) assess the growth and yield of sunflower at elevated CO2 levels in winter andsummer season; and (ii) identify suitable plant traits for explaining the maximumvariability in crop responses.
MATERIALS AND METHODS
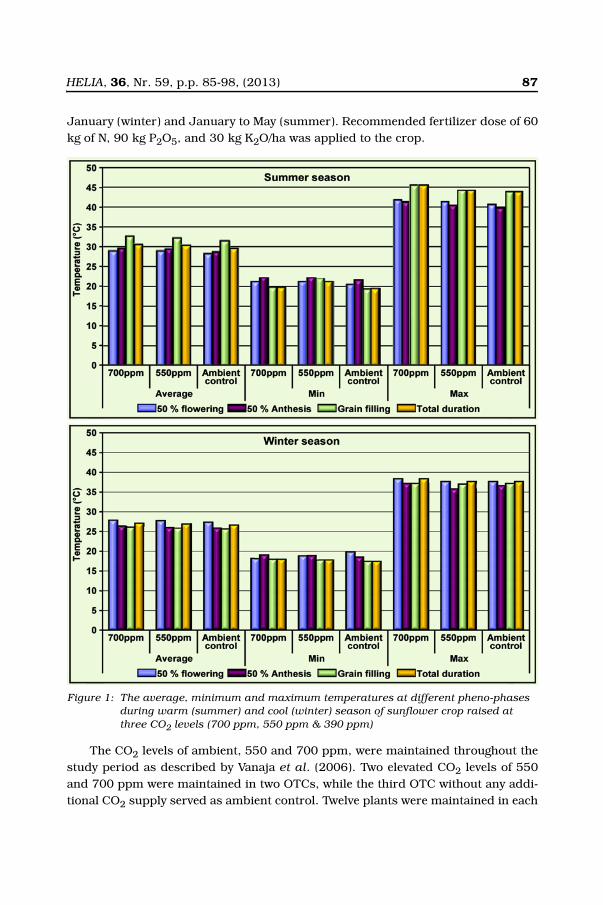
Experiments were conducted in the Open Top Chambers (OTCs) at two elevatedCO2 levels of 550 and 700 ppm to assess the response of sunflower (Helianthusannuus L.) hybrid KBSH-1 during winter and summer seasons, having the temper-ature difference of 5-6°C at anthesis and grain filling stages and compared with theambient (390 ppm) chamber control conditions. The maximum temperature of thewinter crop was below 35°C, whereas the summer crop experienced more than40°C at anthesis and grain filling stages (Figure 1). Sunflower plants were raised inplastic pots filled with 18 kg of red loamy soil (Alfisol) in OTCs from October to
HELIA, 36, Nr. 59, p.p. 85-98, (2013) 87
January (winter) and January to May (summer). Recommended fertilizer dose of 60kg of N, 90 kg P2O5, and 30 kg K2O/ha was applied to the crop.
The CO2 levels of ambient, 550 and 700 ppm, were maintained throughout thestudy period as described by Vanaja et al. (2006). Two elevated CO2 levels of 550and 700 ppm were maintained in two OTCs, while the third OTC without any addi-tional CO2 supply served as ambient control. Twelve plants were maintained in each
Figure 1: The average, minimum and maximum temperatures at different pheno-phases during warm (summer) and cool (winter) season of sunflower crop raised at three CO2 levels (700 ppm, 550 ppm & 390 ppm)

88 HELIA, 36, Nr. 59, p.p. 85-98, (2013)
OTC (one plant per pot). At the time of the harvest, representative samples of 6 rep-licates were randomly chosen to determine the biomass and yield characters. Dur-ing harvest, plants were separated into roots, stem, leaves and capitulum. Theheads (capitula) were dried in the sun light and seeds were separated. The har-vested plant parts viz., leaves, stems, roots and de-seeded heads were dried in traydrier at 60°C till constant weights were attained to determine the dry weights.Observations were recorded on 12 plant traits viz., (i) leaf dry weight (LDW, g pl-1);(ii) stem dry weight (SDW, g pl-1); (iii) root dry weight (RDW, g pl-1); (iv) head dryweight (HDW, g pl-1); (v) fodder dry weight (FDW, g pl-1); (vi) total dry weight (bio-mass) (TDW, g pl-1); (vii) harvest index (HI, %); (viii) head diameter (HD, cm); (ix)seed yield (SY, g pl-1); (x) total seed number (TSN); (xi) filled seed number (FSN);and (xii) unfilled seed number (UFSN, g pl-1) at the level of CO2 in winter and sum-mer seasons. The total dry weight (TDW) was calculated as the sum of stem, leaf,root and head biomass; fodder dry weight (FDW) by subtracting the seed weightfrom total biomass and harvest index (HI, %), while the % of seed weight wasobtained from total biomass produced.
The main effects of CO2 levels and seasons, and their interaction were testedbased on the Analysis of Variance (ANOVA) procedure. Based on the Least Signifi-cant Difference (LSD) criteria, the main effects of CO2 levels and seasons and theirinteraction effects were compared in order to identify a superior level of CO2 atwhich significantly higher response of traits has occurred in a given season. Anassessment of correlation between plant traits at different CO2 levels in summerand winter seasons could be made in order to develop suitable regression modelsfor predicting total biomass, seed yield and harvest index. We can identify signifi-cant plant traits contributing to total biomass, seed yield and harvest index in win-ter and summer seasons based on the principal component (PC) analysis (Jolliffe,1986; Dunteman, 1994). The significant PCs which have the value of more than“one” are identified and the variance (%) captured by each PC could be determined.The loadings of plant traits on leading principal components could be determinedand important plant traits could be identified based on the standard computationalprocedure. The plant traits with loadings of more than ±0.70 on PCs could be iden-tified. A principal component regression model of total biomass, seed yield and har-vest index could be developed through PC scores of different components to assessthe effects of CO2 on the response of plant traits, apart from predicting total bio-mass, seed yield and harvest index in winter and summer seasons.
The principal component regression models calibrated at different levels of CO2in winter and summer seasons could be evaluated for superiority based on the coef-ficient of determination (R2) and prediction error statistics and used for predictionof seed yield, total biomass and harvest index that could be attained in winter orsummer season.

HELIA, 36, Nr. 59, p.p. 85-98, (2013) 89
RESULTS AND DISCUSSION
The mean value and coefficient of variation of plant traits at ambient, 550 and700 ppm levels in summer and winter seasons are given in Table 1.
In winter season, all traits except HI and unfilled seed number had the maxi-mum value at 700 ppm; while HI had its maximum at 550 ppm and the unfilledseed number had the maximum at ambient conditions. In summer season, stem
Table 1: Mean and coefficient of variation of plant traits of sunflower at different levels of CO2in winter and summer seasons
Seasons Winter Summer
CO2 (ppm) Ambient 550 700 Ambient 550 700
Traits Mean CV (%) Mean CV (%) Mean CV (%) Mean CV (%) Mean CV (%) Mean CV (%)
LDW 9.3 9.8 9.9 9.2 11.5 14.3 16.9 15.7 14.8 14.2 15.5 14.8
SDW 22 7.4 27.4 13.1 31.2 7.1 23.4 7.7 21.7 21.5 24.6 19.3
RDW 5.1 21.3 6.6 18.3 8.5 33 12.8 47.4 10.1 69.2 7 27.2
HDW 33.1 7.4 38.5 10.7 47.4 7.6 37.3 5.4 42.1 9.2 40.3 10
SY 23.3 7.8 28.2 11.4 34 6.6 23.8 10.8 25.9 3.2 24.6 18.5
TDW 69.6 8 82.6 11 101 10 90.3 6.9 88.7 13.3 87.4 9.1
FDW 46.3 9.7 54.4 11.2 67 12.6 126.5 9.7 120.6 17.6 113 17
HD 98.2 3.1 106.6 5.7 117.5 5.4 90.5 6.4 93.8 8 100 7.1
TSN 733 16 701 17.2 872 14.3 478 11.3 514 10.2 540 3.4
FSN 561 21.9 568 11.5 709 11 414 14.7 439 9.3 443 13.6
UFSN 172 28 133 62.4 163 41.2 64 89.5 75 35.7 97 47.1
HI 33.5 6.2 34.2 3 34 5.4 26.4 12.3 29.6 13.9 28.1 16
Table 2: Improvement (%) of sunflower plant traits at 550 and 700 ppm levels of CO2 overambient control in winter and summer and decrease (%) due to increasedtemperature during summer sunflower
Plant trait Increase (%) over ambient -winter
Increase (%) over ambient -summer
Decrease (%) with increased summer temperature
CO2 (ppm) 700 550 700 550 700 550 Ambient
LDW 22.9 6.2 -8.4 -12.2 -25.9 -33.2 -44.8
SDW 42.0 24.9 5.2 -7.1 26.9 26.4 -6.0
RDW 110.7 29.9 -44.8 -20.7 56.1 -33.0 -59.1
HDW 43.3 16.3 7.9 12.8 17.6 -8.7 -11.5
SY 46.1 20.9 3.2 8.7 38.6 8.8 -2.1
TDW 45.2 18.7 -3.3 -1.8 15.6 -7.0 -23.0
FDW 44.7 17.6 -10.6 -4.7 -40.8 -54.9 -63.4
HD 9.8 5.3 10.5 3.7 12.0 14.5 12.7
TSN 19.0 -4.3 12.9 7.5 61.5 36.4 53.2
FSN 26.5 1.4 7.0 6.1 60.1 29.4 35.4
UFSN -5.3 -22.9 51.4 16.6 67.6 77.3 168.1
HI 1.9 2.1 6.4 12.0 21.3 15.6 26.7
90 HELIA, 36, Nr. 59, p.p. 85-98, (2013)
biomass, head diameter, total, filled and unfilled seed number had their maximumat 700 ppm; while head weight, HI and seed yield had the maximum at 550 ppm;and leaf, root, fodder and total biomass had the maximum at the ambient level.Fritsch et al. (1999) reported a response of total biomass production in foragecrops due to interaction of CO2 and temperature.
At 700 ppm level of CO2, the increase in plant traits in winter in comparison tothe ambient conditions ranged from 1.9% (HI) to 110.7% (RDW); 1.4% (FSN) to29.9% (RDW) at 550 ppm (Table 2). In summer, the increase (%) in plant traits overambient conditions ranged from 3.2% (SY) to 51.4% (UFSN) at 700 ppm and 3.7%(HD) to 16.6% (UFSN) at 550 ppm. Based on the comparison of the mean responseof plant traits during winter and summer seasons and with the increased tempera-ture in summer, the decrease was in the range of 12.0% (HD) to 67.6% (UFSN) at700 ppm; 8.8% (SY) to 77.3% (UFSN) at 550 ppm; 12.7% (HD) to 168.1% (UFSN)at ambient conditions.
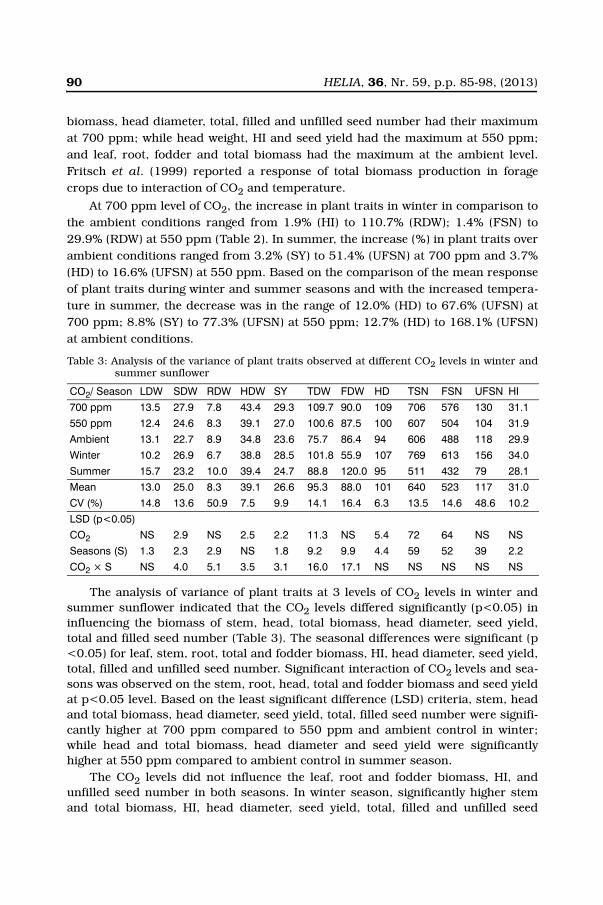
The analysis of variance of plant traits at 3 levels of CO2 levels in winter andsummer sunflower indicated that the CO2 levels differed significantly (p<0.05) ininfluencing the biomass of stem, head, total biomass, head diameter, seed yield,total and filled seed number (Table 3). The seasonal differences were significant (p<0.05) for leaf, stem, root, total and fodder biomass, HI, head diameter, seed yield,total, filled and unfilled seed number. Significant interaction of CO2 levels and sea-sons was observed on the stem, root, head, total and fodder biomass and seed yieldat p<0.05 level. Based on the least significant difference (LSD) criteria, stem, headand total biomass, head diameter, seed yield, total, filled seed number were signifi-cantly higher at 700 ppm compared to 550 ppm and ambient control in winter;while head and total biomass, head diameter and seed yield were significantlyhigher at 550 ppm compared to ambient control in summer season.
The CO2 levels did not influence the leaf, root and fodder biomass, HI, andunfilled seed number in both seasons. In winter season, significantly higher stemand total biomass, HI, head diameter, seed yield, total, filled and unfilled seed
Table 3: Analysis of the variance of plant traits observed at different CO2 levels in winter andsummer sunflower
CO2/ Season LDW SDW RDW HDW SY TDW FDW HD TSN FSN UFSN HI
700 ppm 13.5 27.9 7.8 43.4 29.3 109.7 90.0 109 706 576 130 31.1
550 ppm 12.4 24.6 8.3 39.1 27.0 100.6 87.5 100 607 504 104 31.9
Ambient 13.1 22.7 8.9 34.8 23.6 75.7 86.4 94 606 488 118 29.9
Winter 10.2 26.9 6.7 38.8 28.5 101.8 55.9 107 769 613 156 34.0
Summer 15.7 23.2 10.0 39.4 24.7 88.8 120.0 95 511 432 79 28.1
Mean 13.0 25.0 8.3 39.1 26.6 95.3 88.0 101 640 523 117 31.0
CV (%) 14.8 13.6 50.9 7.5 9.9 14.1 16.4 6.3 13.5 14.6 48.6 10.2
LSD (p<0.05)
CO2 NS 2.9 NS 2.5 2.2 11.3 NS 5.4 72 64 NS NS
Seasons (S) 1.3 2.3 2.9 NS 1.8 9.2 9.9 4.4 59 52 39 2.2
CO2 × S NS 4.0 5.1 3.5 3.1 16.0 17.1 NS NS NS NS NS

HELIA, 36, Nr. 59, p.p. 85-98, (2013) 91
number were observed compared to summer, while in the summer season signifi-cantly higher leaf, root and fodder biomass were observed compared to winter. Thebiomass of head did not differ between the two seasons. Cowling and Sage (1998)observed an enhanced plant biomass of barley and wheat with 200 ppm increase inatmospheric CO2 concentration and higher temperatures. With the increase of tem-perature by 3°C and 700 ppm CO2 the spring wheat biomass was improved by 23%compared to ambient conditions (Hakala, 1998). Wurr et al. (2000) observed theincrease of 50% in yield of French bean to elevated CO2 and 4°C increase in temper-ature compared to no response at ambient temperature. Studies with rhizoma pea-nut (Fritschi et al., 1999) revealed that the elevated CO2 did not significantlyinteract with an increase in the ambient temperature (4.5°C) to impact the growth.The interactive effect of elevated CO2 and temperature was observed to be specificto the crop and the range of temperature. In our study, a better performance of sun-flower was observed under cooler temperature in winter compared to warmer tem-perature in summer as indicated by the superiority of 8 traits in winter comparedto 3 traits in summer.
Relationship between different traits
The total biomass was correlated significantly and positively with fodder bio-mass during both winter and summer seasons and with only head weight in winterseason at all three levels of CO2 (Table 4).
Table 4: Estimates of correlation between total biomass, seed yield and HI and other traits ofsunflower during winter and summer at three levels of CO2
Winter season Summer seasonAmbient 550 ppm 700 ppm Ambient 550 ppm 700 ppm
Total biomassLDW 0.871* - - - - -SDW 0.909* 0.928** - - - 0.896*
RDW 0.853* - - 0.868* - -HDW 0.918** 0.974** 0.912** - - -SY - 0.953** - - - -FDW 0.957** 0.987** 0.987** 0.947** 0.978** 0.822*
TSN - 0.906* - - - -FSN - 0.861* - - - -HI - - - - -0.974** -
Seed yieldHDW 0.866* 0.990** 0.954** - - 0.850*
TDW - 0.953** - - - -FDW - 0.894* - - - -FSN - 0.927** 0.906* - - -HI - - - 0.834* - 0.880*
HISY - - - 0.834* 0.880*
TDW - - - - -0.974** -FDW - - -0.879* - -0.935** -FSN - - - - - 0.840*
UFSN -0.821* -0.842* - - - -

92 HELIA, 36, Nr. 59, p.p. 85-98, (2013)
Stem biomass, seed yield, filled and total seed number also registered signifi-cant and positive correlation with total biomass in winter and negative correlationof HI during summer at 550 ppm only. It is interesting to record that during sum-mer total biomass significantly correlated with root biomass at ambient and stembiomass at 700 ppm level and none of the yield components registered any signifi-cant correlation with total biomass.
Seed yield correlated positively and significantly with head weight at all threelevels of CO2 during winter and only at 700 ppm during summer season. At 550ppm, total biomass, fodder biomass, filled seed number registered significant andpositive correlation with seed yield in winter, while none of the traits recorded a sig-nificant correlation in summer.
Significant and positive correlation of HI with seed yield was observed at 700ppm and ambient CO2 level during summer season. Fodder biomass was negativelyand significantly correlated with HI at 700 ppm during winter and 550 ppm duringsummer season. HI correlated negatively and significantly with unfilled seednumber (UFSN) at 550 ppm and ambient conditions during winter, whereas it cor-related positively and significantly with filled seed number (FSN) at 700 ppm duringsummer season. These results clearly indicate the seasonal variation in response ofdifferent traits to enhanced CO2 levels and their contribution to the improvement ofbiomass and seed yield as well as partitioning of biomass. With the increased tem-perature during summer the majority of traits lost their importance.
Principal component analysis
Based on the correlation coefficients between different plant traits, principalcomponents (PCs) were determined to (i) explain maximum variability of the planttraits and (ii) identify significant plant traits which contributed to sunflower growthat different CO2 levels maintained in winter and summer seasons. The eigenvaluesand the variance explained by PCs are given in the Table 5.
Table 5: Eigenvalues and percent of variance explained by principal components of plant traitsat different levels of CO2 in winter and summer sunflower
Principal component
Winter season Summer season
Ambient 550 ppm 700 ppm Ambient 550 ppm 700 ppm
Eigenvalues
P1 4.59 6.31 5.91 2.83 4.43 5.42
P2 1.91 1.09 1.17 2.19 2.21 2.06
P3 1.43 1.03 1.99 1.41
P4 1.32
Variance (%)
P1 51.1 70.2 65.7 31.5 49.2 60.3
P2 21.2 12.2 13.0 24.4 24.6 22.9
P3 15.9 11.5 22.2 15.7
P4 14.7
Total variance 88.2 82.4 90.2 92.8 89.5 83.2

HELIA, 36, Nr. 59, p.p. 85-98, (2013) 93
The eigenvalues of PCs were higher at 700 ppm, followed by 550 ppm and theambient control indicating the superiority of elevated CO2 for attaining a higherresponse in the growth of plant traits. Taking the winter sunflower into account, 3PCs explained the maximum variance of 90.9% in the plant traits recorded at 700ppm. Using this variance, the 1st PC P1 explained 66.1%, while the 2nd and 3rd PCsP2 and P3 explained variance of 14.3 and 10.5%, respectively. In summer, 4 PCsexplained the maximum variance of 97.9% at 700 ppm, out of which P1 explained50.4%, while P2 explained 27.4%. At 550 ppm, 3 PCs explained 92.9% of the vari-ance in winter, out of which 66% was explained by P1; 15.5% by P2 and 11.4% by P3components, whereas in summer, 4 PCs explained 97.8% of the variance at 550ppm, out of which 48.5% was explained by P1, compared to 19.9, 19.3 and 10.1%variance by P2, P3 and P4 components, respectively. At ambient conditions, 3 PCsexplained 91.2% of the variance in winter, out of which P1 explained 51.2%, whileP2 and P3 explained 24.6 and 15.4% of variance, respectively. In summer 4 PCsexplained the variance of 93.4% at ambient conditions, this comprised of 36.8% byP1; 26.8% by P2; 16.8% by P3 and 12.9% by P4. Thus variance in traits was betterexplained by less number of PCs in winter compared to more number of PCs insummer season.
The variance explained by PCs was almost the same at all levels of CO2 in win-ter, while it was relatively higher at 700 and 550 ppm compared to ambient controlin summer. There was a better performance of sunflower in winter compared tosummer season which is evident based on the variance explained by the 1st PC at alllevels of CO2. In fact, 700 ppm was superior to 550 ppm and ambient levels basedon the first two PCs.
The importance of plant traits was assessed based on the magnitudes of load-ings on PCs determined at different CO2 levels in winter and summer seasons(Table 6). In winter sunflower, all traits except HI (SDW) and unfilled seed numberwere significantly loaded on P1 at 700 ppm, while no trait was loaded on P2. At 550ppm, all traits except root biomass, head diameter and HI had a significant loadingon P1, while only HI had a significant loading on P2. The biomass of leaf, stem, root,head, fodder and total biomass had a significant loading on P1; while HI, seed yieldand unfilled seed number had a significant loading on P2 at ambient conditions forexplaining the variance in plant traits.
In summer sunflower, traits such as leaf and fodder biomass, head diameter,filled, unfilled and total seed number had a significant loading on P1; while onlyhead biomass, seed yield and total seed number had a significant loading on P2 at700 ppm (Table 6). At 550 ppm, all traits except leaf, root and head biomass, headdiameter, seed yield and filled seed number had a significant loading on P1, whileonly head diameter and filled seed number had a significant loading on P2. At theambient level, root and head biomass, HI and seed yield had a significant loadingon P1; while leaf and total biomass had a significant loading on P2.

94 HELIA, 36, Nr. 59, p.p. 85-98, (2013)
Root biomass had a significantly higher loading on P1 at ambient control insummer indicating that the traits lost their importance under elevated CO2 levels.The unfilled seed number was important at both 550 and 700 ppm since it had ahigher loading on P1 compared to the ambient. This indicated that though the seedset was maintained at 550 ppm, seed filling did not happen due to high tempera-ture, as indicated by the significance of unfilled seed number under elevated CO2condition. Our findings are in conformity with those of Havelka et al. (1984) andIdso et al. (1987).
Regression model of total dry weight, harvest index and seed weight through PC scores of components
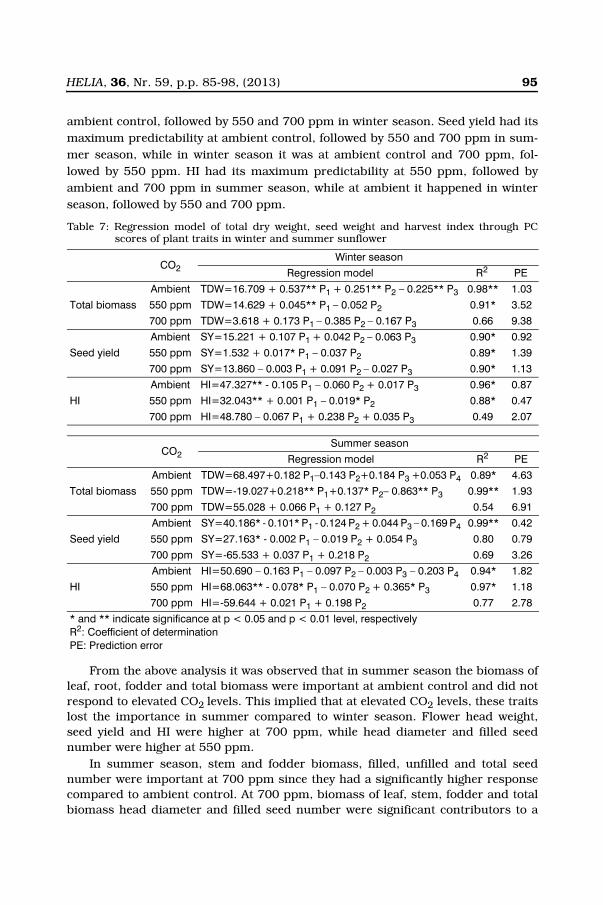
Based on the PC model, principal component scores of each component werederived at each level of CO2 in winter and summer seasons and regression modelsof total biomass, seed yield and HI were derived for each season. The estimates ofregression coefficients, coefficient of determination (R2) and prediction error aregiven in Table 7. The regression models through principal components indicatedthat total biomass had maximum predictability at 550 ppm, followed by ambientand 700 ppm in summer season; while the prediction reached its maximum at
Table 6: Loadings of plant traits on PCs at different levels of CO2 in winter and summersunflower
TraitAmbient 550 ppm 700 ppm
P1 P2 P3 P4 P1 P2 P3 P1 P2 P3
Winter
LDW 0.966* -0.001 0.043 0.668 -0.552 0.969* -0.110 0.139
SDW 0.952* 0.141 0.175 0.973* 0.138 0.678 -0.618 -0.397
RDW 0.809* 0.450 -0.328 0.730* 0.336 0.733* -0.629 0.205
HDW 0.861* -0.078 -0.335 0.907* -0.305 0.784* 0.485 -0.378
FDW 0.935* 0.328 0.022 0.987* -0.054 0.804* 0.177 -0.380
HD -0.014 0.151 0.593 0.634 0.183 0.811* -0.018 -0.207
TSN 0.518 -0.742* 0.410 0.970* 0.143 0.912* 0.212 0.343
FSN 0.451 -0.888* 0.075 0.816* -0.443 0.864* 0.244 0.028
UFSN 0.110 0.461 0.806* 0.764* 0.558 0.690 0.110 0.605
Summer
LDW -0.607 -0.621 0.363 -0.189 0.585 0.536 -0.531 0.831* 0.299
SDW 0.582 0.713* 0.201 0.303 0.891* -0.437 0.012 0.682 -0.341
RDW 0.700* -0.477 0.461 0.225 0.681 0.348 0.079 -0.514 -0.779*
HDW -0.865* 0.305 0.255 0.128 0.042 -0.117 -0.981* 0.553 0.649
FDW 0.590 -0.346 0.637 0.292 0.908* 0.069 -0.176 0.870* 0.385
HD -0.158 0.424 -0.357 0.700* -0.416 0.890* -0.027 0.873* -0.398
TSN 0.471 0.500 0.033 -0.622 0.886* 0.234 0.242 -0.702* 0.677
FSN -0.088 0.626 0.706* -0.317 0.603 0.664 0.259 -0.915* 0.252
UFSN 0.537 -0.191 -0.716* -0.251 0.823* -0.555 0.080 0.921* -0.062
*Traits with significant loadings on PCs (loadings of more than ±0.7)
HELIA, 36, Nr. 59, p.p. 85-98, (2013) 95
ambient control, followed by 550 and 700 ppm in winter season. Seed yield had itsmaximum predictability at ambient control, followed by 550 and 700 ppm in sum-mer season, while in winter season it was at ambient control and 700 ppm, fol-lowed by 550 ppm. HI had its maximum predictability at 550 ppm, followed byambient and 700 ppm in summer season, while at ambient it happened in winterseason, followed by 550 and 700 ppm.
From the above analysis it was observed that in summer season the biomass ofleaf, root, fodder and total biomass were important at ambient control and did notrespond to elevated CO2 levels. This implied that at elevated CO2 levels, these traitslost the importance in summer compared to winter season. Flower head weight,seed yield and HI were higher at 700 ppm, while head diameter and filled seednumber were higher at 550 ppm.
In summer season, stem and fodder biomass, filled, unfilled and total seednumber were important at 700 ppm since they had a significantly higher responsecompared to ambient control. At 700 ppm, biomass of leaf, stem, fodder and totalbiomass head diameter and filled seed number were significant contributors to a
Table 7: Regression model of total dry weight, seed weight and harvest index through PCscores of plant traits in winter and summer sunflower
CO2Winter season
Regression model R2 PE
Total biomass
Ambient TDW=16.709 + 0.537** P1 + 0.251** P2 – 0.225** P3 0.98** 1.03
550 ppm TDW=14.629 + 0.045** P1 – 0.052 P2 0.91* 3.52
700 ppm TDW=3.618 + 0.173 P1 – 0.385 P2 – 0.167 P3 0.66 9.38
Seed yield
Ambient SY=15.221 + 0.107 P1 + 0.042 P2 – 0.063 P3 0.90* 0.92
550 ppm SY=1.532 + 0.017* P1 – 0.037 P2 0.89* 1.39
700 ppm SY=13.860 – 0.003 P1 + 0.091 P2 – 0.027 P3 0.90* 1.13
HI
Ambient HI=47.327** - 0.105 P1 – 0.060 P2 + 0.017 P3 0.96* 0.87
550 ppm HI=32.043** + 0.001 P1 – 0.019* P2 0.88* 0.47
700 ppm HI=48.780 – 0.067 P1 + 0.238 P2 + 0.035 P3 0.49 2.07
CO2Summer season
Regression model R2 PE
Total biomass
Ambient TDW=68.497+0.182 P1–0.143 P2+0.184 P3 +0.053 P4 0.89* 4.63
550 ppm TDW=-19.027+0.218** P1+0.137* P2– 0.863** P3 0.99** 1.93
700 ppm TDW=55.028 + 0.066 P1 + 0.127 P2 0.54 6.91
Seed yield
Ambient SY=40.186* - 0.101* P1 - 0.124 P2 + 0.044 P3 – 0.169 P4 0.99** 0.42
550 ppm SY=27.163* - 0.002 P1 – 0.019 P2 + 0.054 P3 0.80 0.79
700 ppm SY=-65.533 + 0.037 P1 + 0.218 P2 0.69 3.26
HI
Ambient HI=50.690 – 0.163 P1 – 0.097 P2 – 0.003 P3 – 0.203 P4 0.94* 1.82
550 ppm HI=68.063** - 0.078* P1 – 0.070 P2 + 0.365* P3 0.97* 1.18
700 ppm HI=-59.644 + 0.021 P1 + 0.198 P2 0.77 2.78
* and ** indicate significance at p < 0.05 and p < 0.01 level, respectivelyR2: Coefficient of determinationPE: Prediction error

96 HELIA, 36, Nr. 59, p.p. 85-98, (2013)
better response in both seasons. Though filled seed number was positive in winterand negative in summer, indicating that the improved seed yield occurred due toincreased number of seeds in cool season, whereas this trait negatively respondedduring warm season. Similarly, unfilled seed number was significant in summer,while it did not happen in winter.
In winter HI was significantly higher at 550 ppm and ambient control and insummer at 700 ppm with positive loading while it was with significant negativeloading at 550 ppm and ambient. This indicates that 550 ppm or less could be opti-mum in cool environments for maximum HI, whereas in warm environments, 700ppm was beneficial. Similar results were reported by Wheeler et al. (1996).
CONCLUSIONS
The study revealed that the elevated CO2 condition and seasons differed signifi-cantly in influencing different traits of sunflower. A significant interaction of CO2levels and seasons was also observed.
In both winter and summer seasons, total biomass was significantly higher at700 ppm. In summer, root biomass was significant at ambient indicating that thetraits lost importance at elevated CO2 levels. During warm season though the seedset was better at 550 ppm, seed filling was affected and unfilled seed number washigh at both 550 and 700 ppm as compared to ambient. HI was important at 550ppm and ambient in winter and 700 ppm in summer. With significant positive load-ing of HI in summer at 700 ppm and negative at 550 ppm and ambient condition,indicating that 550 ppm or less could be beneficial in winter for maximum HI,whereas in summer it will be negative. Thus sunflower responded better to elevatedCO2 levels in winter compared to summer season with significantly higher responseof traits at elevated CO2 compared to ambient control. The identified superior traitscontributed to sunflower growth in both seasons and are important for furthergenetic improvements under enhanced CO2 and temperature conditions.
REFERENCES
Alexandrov, V.A. and Hoogenboom, G., 2000. The impact of climate variability and change oncrop yield in Bulgaria. Agr. Forest Meteorol. 104: 315-327.
Cowling, S.A. and Sage, R.F., 1998. Interactive effects of low atmospheric CO2 and elevatedtemperature on growth, photosynthesis and respiration in Phaseolus vulgaris. Plant CellEnviron. 21: 427-435.
Cubasch, U., Meehl, G.A., Boer, G.J., Stouffer, R.J., Dix, M., Noda, A., Senior, C.A., Raper, S.and Yap, K.S., 2001. Projections of future climate change. In: J.T. Houghton, Y. Ding,(eds.) Climate change: the scientific basis. Cambridge University Press, Cambridge pp.526-582.
Dunteman, G.H., Lewis-Beck, M.S., 1989. Principal component analysis. Sage Publications Inc.California, USA.
Folland, C.K., Karl, T.R., Christy, J.R., Clarke, RA., Gruza, G.V., Jouzel, J., Mann, M.E.,Oerlemans, J., Salinger, M.J. and Wang S.W., 2001. Observed climate variability andchange. In: J.T. Houghton, Y. Ding, (eds.) Climate change: the scientific basis. CambridgeUniversity Press, Cambridge, pp. 99-181.

HELIA, 36, Nr. 59, p.p. 85-98, (2013) 97
Fritschi, F.B., Boote, K.J., Sollenberger, L.E., Allen, Jr.LH. and Sinclair, T.R., 1999. Carbondioxide and temperature effects on forage establishment: photosynthesis and biomassproduction. Glob. Change Biol. 5: 441-453.
Hakala, K., 1998. Growth and yield potential of spring wheat in a simulated changed climatewith increased CO2 and higher temperature. Euro. J. Agro. 9: 41-52.
Havelka, U.D., Wittenbach, V.A. and Boyle, M.G., 1984. CO2 enrichment effects on wheat yieldand physiology. Crop Sci. 24: 1163-1168.
Idso, S.B., Kimball, B.A., Anderson, M.G. and Mauney, J.R., 1987. Effects of atmospheric CO2enrichment on plant growth: the interactive role of temperature. Agr. Ecosyst. Environ.20: 1-10.
IPCC, 2007. Climate change 2007: Mitigation of Climate Change. Contribution of Working GroupIII to the Fourth Assessment Report of the Intergovernmental Panel on Climate Change.Cambridge University Press.
Jolliffe, I.T., 1986. Principal component analysis. Springer – Velag, New York.Maruthi Sankar, G.R., Venkteswarlu, S., Balasubramanian, V., Vanaja, M. and Raghuram Reddy,
P., 1999. Statistical modeling of physiological parameters for crop growth prediction indryland alfisols. Indian J. Dryland Agric. Res. & Dev. 14(1): 45-51.
Maruthi Sankar, G.R. and Vanaja, M., 2003. Crop growth prediction in sunflower using weathervariables in a rainfed alfisol. Helia 26(39): 125-140.
Maruthi Sankar, G.R., Vanaja, M., Maruthi, V., Raghuram Reddy, P. and Narasimha Murthy, D.,2004. Selection of consistent plant traits for sunflower growth using principal componentanalysis. Helia 27(41): 113-122.
McMurtrie, R.E., Comins, H.N., Kirschbaum, M.U.F. and Wang, Y.P., 1992. Modifying existingforest growth models to take account of effects of elevated CO2. Aus. J. Botany 40: 657-677.
Ozdogan, M., 2011. Modeling the impacts of climate change on wheat yields in North-westernTurkey. Agric. Ecosys. Environ. 141: 1-12.
Tubiello, F.N. and Ewert, F., 2002. Simulating the effects of elevated CO2 on crops: approachesand applications for climate change. Proc. Eur. J. Agron, 18: 57-74.
Vanaja, M., Maheswari, M., Ratna Kumar, P. and Ramakrishna, Y.S., 2006. Monitoring andcontrolling of CO2 concentration in open top chambers for better understanding of plantsresponse to elevated CO2 levels. Indian J. Radio Space 35: 193-197.
Wheeler, T.R., Hong, T.D., Ellis, R.H., Batts, G.R., Morison, J.I.L. and Hadel, P., 1996. Theduration and rate of grain growth, and harvest index, of wheat (Triticum aestivum L.) inresponse to temperature and CO2. J. Exp. Bot. 47: 623-630.
Wurr, D.C.E., Edmondson, R.N. and Fellows, J.R., 2000. Climate change: a response surfacestudy of the effects of CO2 and temperature on the growth of French beans. J. Agric. Sci.135: 379-387.

98 HELIA, 36, Nr. 59, p.p. 85-98, (2013)