Measurement of Gas Viscosity at High Pressures and High Temperatures
13
Copyright 2009, International Petroleum Technology Conference This paper was prepared for presentation at the International Petroleum Technology Conference held in Doha, Qatar, 7–9 December 2009. This paper was selected for presentation by an IPTC Programme Committee following review of information contained in an abstract submitted by the author(s). Contents of the paper, as presented, have not been reviewed by the International Petroleum Technology Conference and are subject to correction by the author(s). The material, as presented, does not necessarily reflect any position of the International Petroleum Technology Conference, its officers, or members. Papers presented at IPTC are subject to publication review by Sponsor Society Committees of IPTC. Electronic reproduction, distribution, or storage of any part of this paper for commercial purposes without the written consent of the International Petroleum Technology Conference is prohibited. Permission to reproduce in print is restricted to an abstract of not more than 300 words; illustrations may not be copied. The abstract must contain conspicuous acknowledgment of where and by whom the paper was presented. Write Librarian, IPTC, P.O. Box 833836, Richardson, TX 75083-3836, U.S.A., fax +1-972-952-9435. Abstract Gas viscosity is an important fluid property in petroleum engineering due to its impact in oil and gas production and transportation where it contributes to the resistance to the flow of a fluid both in porous media and pipes. Although the property has been studied thoroughly at low to intermediate pressures and temperatures, there is lack of detailed knowledge of gas viscosity behavior at high pressures and high temperatures (HPHT) in the oil and gas industry. The need to understand and be able to predict gas viscosity at HPHT has become increasingly important as exploration and production has moved to ever deeper formations where HPHT conditions are more likely to be encountered. Knowledge of gas viscosity is required for fundamental petroleum engineering calculations that allow one to optimize the overall management of a HPHT gas field and to better estimate reserves. Existing gas viscosity correlations are derived using measured data at low to moderate pressures and temperatures, i.e. less than 10,000 psia and 300 o F, and then extrapolated to HPHT conditions. No measured gas viscosities at HPHT are currently available, and so the validity of this extrapolation approach is doubtful due to the lack of experimental calibration. The falling body viscometer is selected to measure gas viscosity for a pressure range of 3,000 to 24,500 psia and temperature range of 100 to 415 o F. Nitrogen was used to calibrate the instrument and to account for the fact that the concentrations of non-hydrocarbons are observed to increase dramatically in HPHT reservoirs. Then methane viscosity is measured to reflect the fact that, at HPHT conditions, the reservoir fluids will be very lean gases, typically methane with some degree of impurity. The experiments showed that while the correlation of Lee et al. accurately estimates gas viscosity at low to moderate pressure and temperature, it does not provide a good match to gas viscosity at HPHT conditions. Introduction HPHT gas reservoirs are defined as having pressures greater than 10,000 psia and temperatures over 300ºF. Modeling the performance of these unconventional reservoirs requires the understanding of gas behavior at elevated pressure and temperature. An important fluid property is gas viscosity, as it is used to model the gas mobility in the reservoir that can have a significant impact on reserves estimation during field development planning. Accurate measurements of gas viscosity at HPHT conditions are both extremely difficult and expensive. Thus, this fluid property is typically estimated from published correlations that are based on laboratory data. Unfortunately, the correlations available today do not have a sufficiently broad range of applicability in terms of pressure and temperature, and so their accuracy may be doubtful for the prediction of gas viscosity at HPHT conditions. Gas viscosity can be measured using the following three types of experimental apparatus: Capillary viscometers Falling body viscometers Vibrating viscometers IPTC 13528 Measurement of Gas Viscosity at High Pressures and High Temperatures Kegang Ling, Catalin Teodoriu, Ehsan Davani, Gioia Falcone, Texas A&M University
Transcript of Measurement of Gas Viscosity at High Pressures and High Temperatures
Copyright 2009, International Petroleum Technology Conference This paper was prepared for presentation at the International Petroleum Technology Conference held in Doha, Qatar, 7–9 December 2009. This paper was selected for presentation by an IPTC Programme Committee following review of information contained in an abstract submitted by the author(s). Contents of the paper, as presented, have not been reviewed by the International Petroleum Technology Conference and are subject to correction by the author(s). The material, as presented, does not necessarily reflect any position of the International Petroleum Technology Conference, its officers, or members. Papers presented at IPTC are subject to publication review by Sponsor Society Committees of IPTC. Electronic reproduction, distribution, or storage of any part of this paper for commercial purposes without the written consent of the International Petroleum Technology Conference is prohibited. Permission to reproduce in print is restricted to an abstract of not more than 300 words; illustrations may not be copied. The abstract must contain conspicuous acknowledgment of where and by whom the paper was presented. Write Librarian, IPTC, P.O. Box 833836, Richardson, TX 75083-3836, U.S.A., fax +1-972-952-9435.
Abstract
Gas viscosity is an important fluid property in petroleum engineering due to its impact in oil and gas production and transportation where it contributes to the resistance to the flow of a fluid both in porous media and pipes. Although the property has been studied thoroughly at low to intermediate pressures and temperatures, there is lack of detailed knowledge of gas viscosity behavior at high pressures and high temperatures (HPHT) in the oil and gas industry.
The need to understand and be able to predict gas viscosity at HPHT has become increasingly important as exploration and production has moved to ever deeper formations where HPHT conditions are more likely to be encountered. Knowledge of gas viscosity is required for fundamental petroleum engineering calculations that allow one to optimize the overall management of a HPHT gas field and to better estimate reserves. Existing gas viscosity correlations are derived using measured data at low to moderate pressures and temperatures, i.e. less than 10,000 psia and 300
oF, and then extrapolated to HPHT conditions. No measured gas viscosities at HPHT
are currently available, and so the validity of this extrapolation approach is doubtful due to the lack of experimental calibration.
The falling body viscometer is selected to measure gas viscosity for a pressure range of 3,000 to 24,500 psia and temperature range of 100 to 415
oF. Nitrogen was used to calibrate the instrument and to account for the fact
that the concentrations of non-hydrocarbons are observed to increase dramatically in HPHT reservoirs. Then methane viscosity is measured to reflect the fact that, at HPHT conditions, the reservoir fluids will be very lean gases, typically methane with some degree of impurity. The experiments showed that while the correlation of Lee et al. accurately estimates gas viscosity at low to moderate pressure and temperature, it does not provide a good match to gas viscosity at HPHT conditions. Introduction
HPHT gas reservoirs are defined as having pressures greater than 10,000 psia and temperatures over 300ºF. Modeling the performance of these unconventional reservoirs requires the understanding of gas behavior at elevated pressure and temperature. An important fluid property is gas viscosity, as it is used to model the gas mobility in the reservoir that can have a significant impact on reserves estimation during field development planning.
Accurate measurements of gas viscosity at HPHT conditions are both extremely difficult and expensive. Thus, this fluid property is typically estimated from published correlations that are based on laboratory data.
Unfortunately, the correlations available today do not have a sufficiently broad range of applicability in terms of pressure and temperature, and so their accuracy may be doubtful for the prediction of gas viscosity at HPHT conditions.
Gas viscosity can be measured using the following three types of experimental apparatus:
Capillary viscometers Falling body viscometers Vibrating viscometers
IPTC 13528
Measurement of Gas Viscosity at High Pressures and High Temperatures Kegang Ling, Catalin Teodoriu, Ehsan Davani, Gioia Falcone, Texas A&M University
2 IPTC 13528
Other viscometers may be used that combine features from two or three of the above apparatus types. In
general, during the measurements, either the fluid remains stationary and a solid object moves through it, or the object is stationary and the fluid moves past it. The drag caused by the relative motion between the fluid and the solid is a measure of the fluid viscosity. Below is a brief description of the different types of viscometers. Capillary Viscometers
In a capillary viscometer, the fluid viscosity is determined by measuring the flow rate of the fluid flowing
through the capillary tube and the pressure differential between both its ends. The inside of the tube must be thoroughly clean and dry prior to each measurement in order obtain accurate fluid viscosities. Temperature control is also essential as the tube is susceptible to thermal expansion or contraction, especially in lower fluid viscosity ranges, which might introduce measurement errors. This system requires in-line density measurements.
Falling Body Viscometers
With this type of apparatus, fluid viscosity is measured by dropping a cylindrical or spherical rigid body of
known dimensions and density into a fluid sample and recording the falling time over a known distance. The Stokes' Law is then used to calculate the fluid viscosity. A variation of this method consists of measuring the travel time of a piston that moves at constant speed through a fluid sample under the influence of an imposed electromagnetic field. When the body movement occurs horizontally, density measurements are not required. The most common type of falling body viscometer is the rolling ball viscometer, which shows good accuracy when measuring liquid viscosity, but must be used with caution for gas viscosity measurements. In the latter case, replacing the ball with a cylinder (piston) leads to better accuracy. Vibrating Viscometers
These viscometers rely on the damping of an oscillating electromechanical resonator immersed in the fluid
whose viscosity is to be determined. There are three technologies based on this principle: the tuning fork, the oscillating sphere, and the vibrating rod or wire. The first method measures the fluid viscosity by determining the bandwidth and frequency of the vibrating fork resonance. The second technique requires that a sphere oscillate about its polar axis with precisely controlled amplitude and the fluid viscosity is calculated from the power required to maintain this predetermined amplitude of oscillation. This second measurement is density dependent, so the density of the test fluid should be determined independently. The third and final technique estimates fluid viscosity from the rod vibration amplitude while it is immersed in the sample.
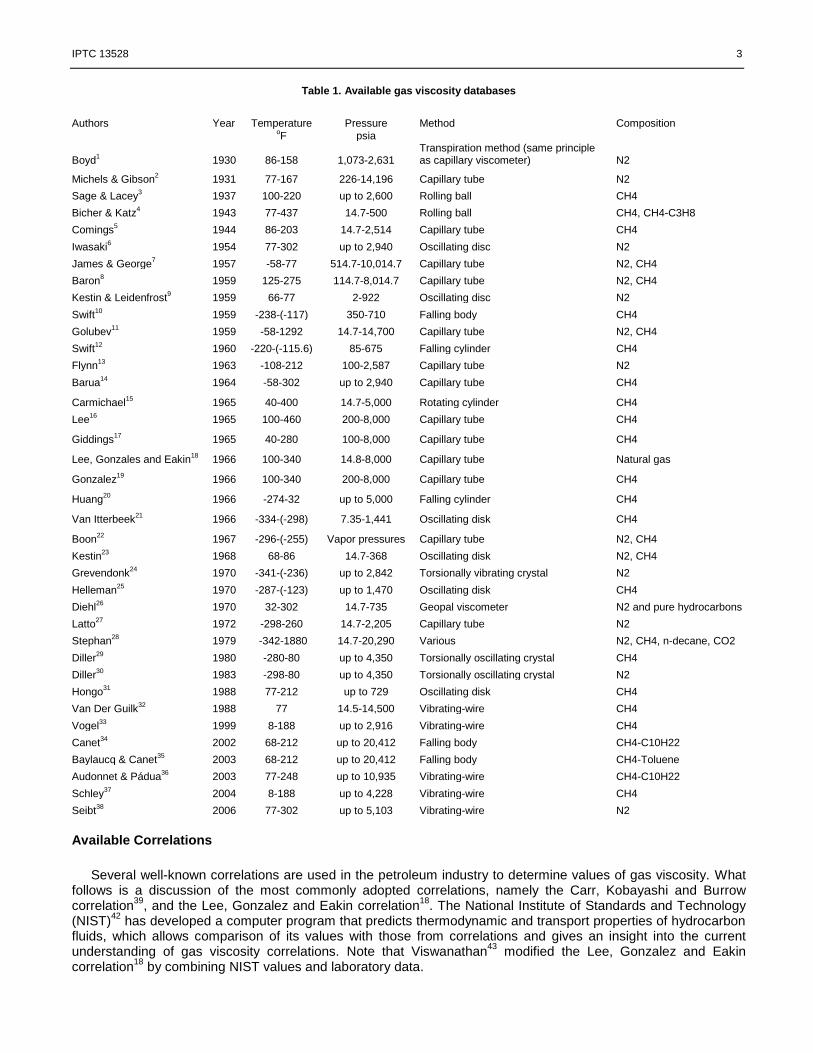
Available Experimental Databases
The first step in ensuring the validity of any gas viscosity correlation at HPHT conditions is to evaluate the
measured data upon which the correlation is based. A large database was reviewed for this research, which revealed that most of the published data on gas
viscosity are extremely limited in terms of both conditions and quantity, and in some cases their accuracy is unknown. All of the currently available viscosity correlations were developed from measured data at low to moderate pressures and temperatures, and their applicability at HPHT conditions is doubtful.
HPHT reservoir fluids tend to be very lean gases, typically methane with some degree of impurity (mainly nitrogen and carbon dioxide). Table 1 presents a summary of the databases that are commonly used in the petroleum industry to develop gas viscosity correlations.
The review shows that very little data are available for methane and nitrogen viscosities at HPHT conditions, which impairs the development of gas viscosity correlations for these extreme conditions.
IPTC 13528 3
Table 1. Available gas viscosity databases
Authors Year Temperature Pressure Method Composition
oF psia
Boyd1 1930 86-158 1,073-2,631
Transpiration method (same principle as capillary viscometer) N2
Michels & Gibson2 1931 77-167 226-14,196 Capillary tube N2
Sage & Lacey3 1937 100-220 up to 2,600 Rolling ball CH4
Bicher & Katz4 1943 77-437 14.7-500 Rolling ball CH4, CH4-C3H8
Comings5 1944 86-203 14.7-2,514 Capillary tube CH4
Iwasaki6 1954 77-302 up to 2,940 Oscillating disc N2
James & George7 1957 -58-77 514.7-10,014.7 Capillary tube N2, CH4
Baron8 1959 125-275 114.7-8,014.7 Capillary tube N2, CH4
Kestin & Leidenfrost9 1959 66-77 2-922 Oscillating disc N2
Swift10
1959 -238-(-117) 350-710 Falling body CH4
Golubev11
1959 -58-1292 14.7-14,700 Capillary tube N2, CH4
Swift12
1960 -220-(-115.6) 85-675 Falling cylinder CH4
Flynn13
1963 -108-212 100-2,587 Capillary tube N2
Barua14
1964 -58-302 up to 2,940 Capillary tube CH4
Carmichael15
1965 40-400 14.7-5,000 Rotating cylinder CH4
Lee16
1965 100-460 200-8,000 Capillary tube CH4
Giddings17
1965 40-280 100-8,000 Capillary tube CH4
Lee, Gonzales and Eakin18
1966 100-340 14.8-8,000 Capillary tube Natural gas
Gonzalez19
1966 100-340 200-8,000 Capillary tube CH4
Huang20
1966 -274-32 up to 5,000 Falling cylinder CH4
Van Itterbeek21
1966 -334-(-298) 7.35-1,441 Oscillating disk CH4
Boon22
1967 -296-(-255) Vapor pressures Capillary tube N2, CH4
Kestin23
1968 68-86 14.7-368 Oscillating disk N2, CH4
Grevendonk24
1970 -341-(-236) up to 2,842 Torsionally vibrating crystal N2
Helleman25
1970 -287-(-123) up to 1,470 Oscillating disk CH4
Diehl26
1970 32-302 14.7-735 Geopal viscometer N2 and pure hydrocarbons
Latto27
1972 -298-260 14.7-2,205 Capillary tube N2
Stephan28
1979 -342-1880 14.7-20,290 Various N2, CH4, n-decane, CO2
Diller29
1980 -280-80 up to 4,350 Torsionally oscillating crystal CH4
Diller30
1983 -298-80 up to 4,350 Torsionally oscillating crystal N2
Hongo31
1988 77-212 up to 729 Oscillating disk CH4
Van Der Guilk32
1988 77 14.5-14,500 Vibrating-wire CH4
Vogel33
1999 8-188 up to 2,916 Vibrating-wire CH4
Canet34
2002 68-212 up to 20,412 Falling body CH4-C10H22
Baylaucq & Canet35
2003 68-212 up to 20,412 Falling body CH4-Toluene
Audonnet & Pádua36
2003 77-248 up to 10,935 Vibrating-wire CH4-C10H22
Schley37
2004 8-188 up to 4,228 Vibrating-wire CH4
Seibt38
2006 77-302 up to 5,103 Vibrating-wire N2
Available Correlations
Several well-known correlations are used in the petroleum industry to determine values of gas viscosity. What
follows is a discussion of the most commonly adopted correlations, namely the Carr, Kobayashi and Burrow correlation
39, and the Lee, Gonzalez and Eakin correlation
18. The National Institute of Standards and Technology
(NIST)42
has developed a computer program that predicts thermodynamic and transport properties of hydrocarbon fluids, which allows comparison of its values with those from correlations and gives an insight into the current understanding of gas viscosity correlations. Note that Viswanathan
43 modified the Lee, Gonzalez and Eakin
correlation18
by combining NIST values and laboratory data.
4 IPTC 13528
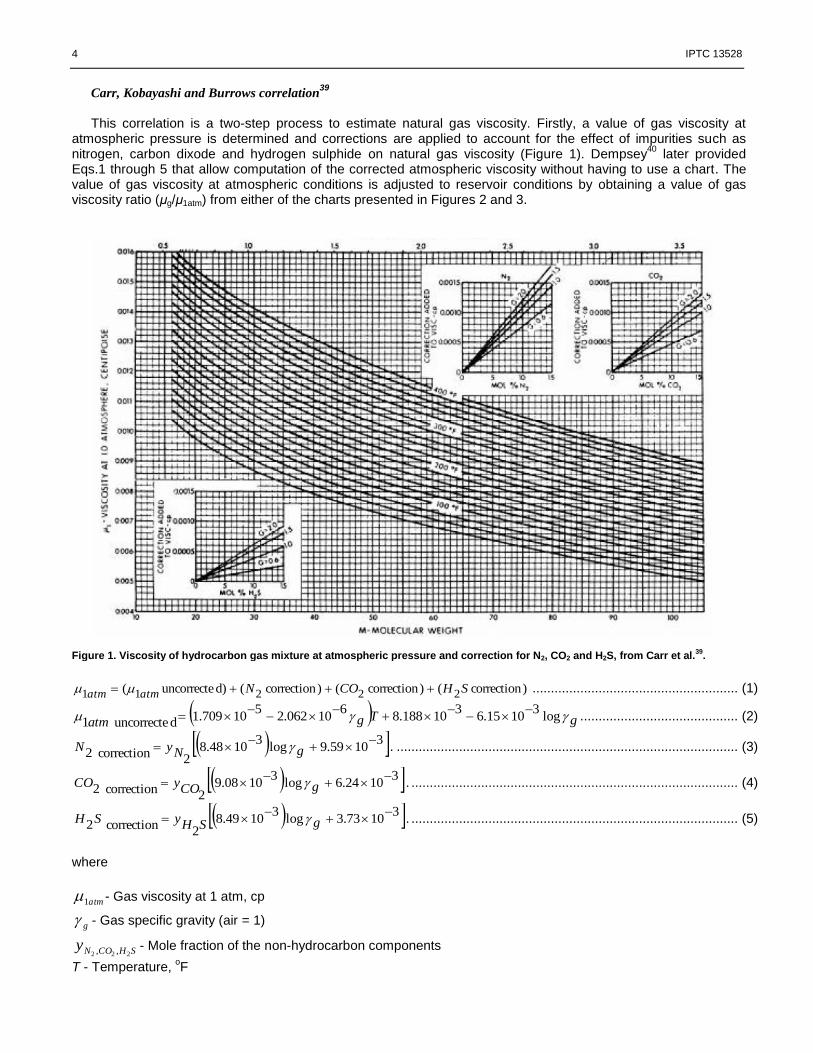
Carr, Kobayashi and Burrows correlation39
This correlation is a two-step process to estimate natural gas viscosity. Firstly, a value of gas viscosity at
atmospheric pressure is determined and corrections are applied to account for the effect of impurities such as nitrogen, carbon dixode and hydrogen sulphide on natural gas viscosity (Figure 1). Dempsey
40 later provided
Eqs.1 through 5 that allow computation of the corrected atmospheric viscosity without having to use a chart. The value of gas viscosity at atmospheric conditions is adjusted to reservoir conditions by obtaining a value of gas viscosity ratio (μg/μ1atm) from either of the charts presented in Figures 2 and 3.
Figure 1. Viscosity of hydrocarbon gas mixture at atmospheric pressure and correction for N2, CO2 and H2S, from Carr et al.
39.
)correction()correction()correction(d)uncorrecte( 22211 SHCONatmatm ........................................................ (1)
gTgatm log3
1015.63
10188.86
10062.25
10709.1duncorrecte1
. .......................................... (2)
31059.9log
31048.8
2correction2
gNyN . ............................................................................................. (3)
31024.6log
31008.9
2correction2
gCOyCO . ......................................................................................... (4)
31073.3log
31049.8
2correction2
gSHySH . ......................................................................................... (5)
where
atm1 - Gas viscosity at 1 atm, cp
g - Gas specific gravity (air = 1)
SHCONy222 ,, - Mole fraction of the non-hydrocarbon components
T - Temperature, oF
IPTC 13528 5
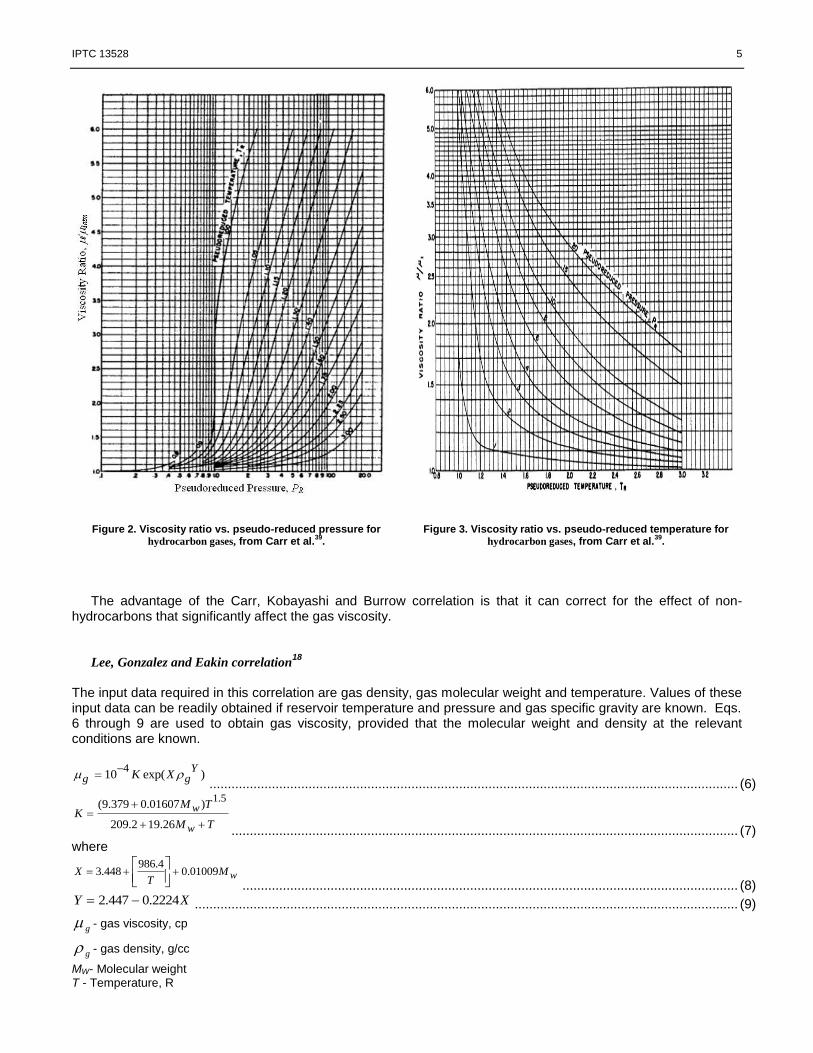
Figure 2. Viscosity ratio vs. pseudo-reduced pressure for hydrocarbon gases, from Carr et al.
39.
Figure 3. Viscosity ratio vs. pseudo-reduced temperature for hydrocarbon gases, from Carr et al.
39.
The advantage of the Carr, Kobayashi and Burrow correlation is that it can correct for the effect of non-
hydrocarbons that significantly affect the gas viscosity.
Lee, Gonzalez and Eakin correlation
18
The input data required in this correlation are gas density, gas molecular weight and temperature. Values of these input data can be readily obtained if reservoir temperature and pressure and gas specific gravity are known. Eqs. 6 through 9 are used to obtain gas viscosity, provided that the molecular weight and density at the relevant conditions are known.
4
10 exp( )Y
g gK X
................................................................................................................................................ (6)
TM
TMK
w
w
26.192.209
)01607.0379.9(5.1
.......................................................................................................................................... (7)
where
wMT
X 01009.04.986
448.3
....................................................................................................................................... (8) XY 2224.0447.2 .................................................................................................................................................... (9)
g - gas viscosity, cp
g - gas density, g/cc
MW- Molecular weight T - Temperature, R
6 IPTC 13528
The correlation by Lee et al., which fits their 234 data points with an average absolute error of 2.0% and 4% at
low and high pressures, respectively, provides better results if the gas specific gravity is less than unity. The correlation can be used to forecast gas viscosities at temperatures from 100 to 340
oF and pressures from 100 to
8,000 psi. However, this correlation does not consider natural gases that contain high quantities of non-hydrocarbon
components. Jeje and Mattar
41 compared the Lee et al. correlation to the Carr et al. correlation for both sweet and sour
gases. They found that both give almost identical results for the former, but there were significant differences for the latter. This suggested that the Lee et al. correlation, which was derived for sweet gases only, should not be applied to sour gases.
NIST Program42
The NIST program, which estimates of thermodynamic and transport properties of hydrocarbons, can provide
viscosities of both pure components and mixtures at pressures up to 44,100 psi and temperatures up to 1,340 oF.
However, the program predicts the fluid properties using correlations developed for low to moderate pressure and temperature. Its applicability to HPHT conditions has not been validated against experimental data.
Viswanathan Correlation43
Viswanathan used a Cambridge Viscosity SPL440 system to measure the viscosity of pure methane at
pressures from 5,000 to 30,000 psi and temperatures from 100 to 400oF. Based on the results from the
measurements, Viswanathan modified the correlation by Lee et al. as follows:
Y
gg XK exp ................................................................................................................................................... (10)
TM
TMK
w
w
9.128.443
)2888.00512.5(*0001.0832.1
................................................................................................................... (11)
where
wMT
X 3938.09437.3084
1166.6
.................................................................................................................... (12)
XY 1563.05893.0 .................................................................................................................................................. (13)
Viswanathan then compared the modified Lee et al. correlation to the NIST values for pure methane. The results showed a very good match with the NIST values compared to the performance of the original correlation by Lee et al. However, Viswanathan’s findings cannot be directly extrapolated to situations where impurities are present in the gas.
The above review of existing gas viscosity correlations reveals that there are no measurements available at
HPHT conditions. Correlations derived from data at low to moderate pressures and temperatures should not be simply extrapolated to HPHT conditions without validation against experimental measurements. Although it would be desirable to have a unique correlation capable of covering both low and high pressure and temperature ranges, it cannot be said for sure if this is possible unless more laboratory data are obtained. Experimental Facility
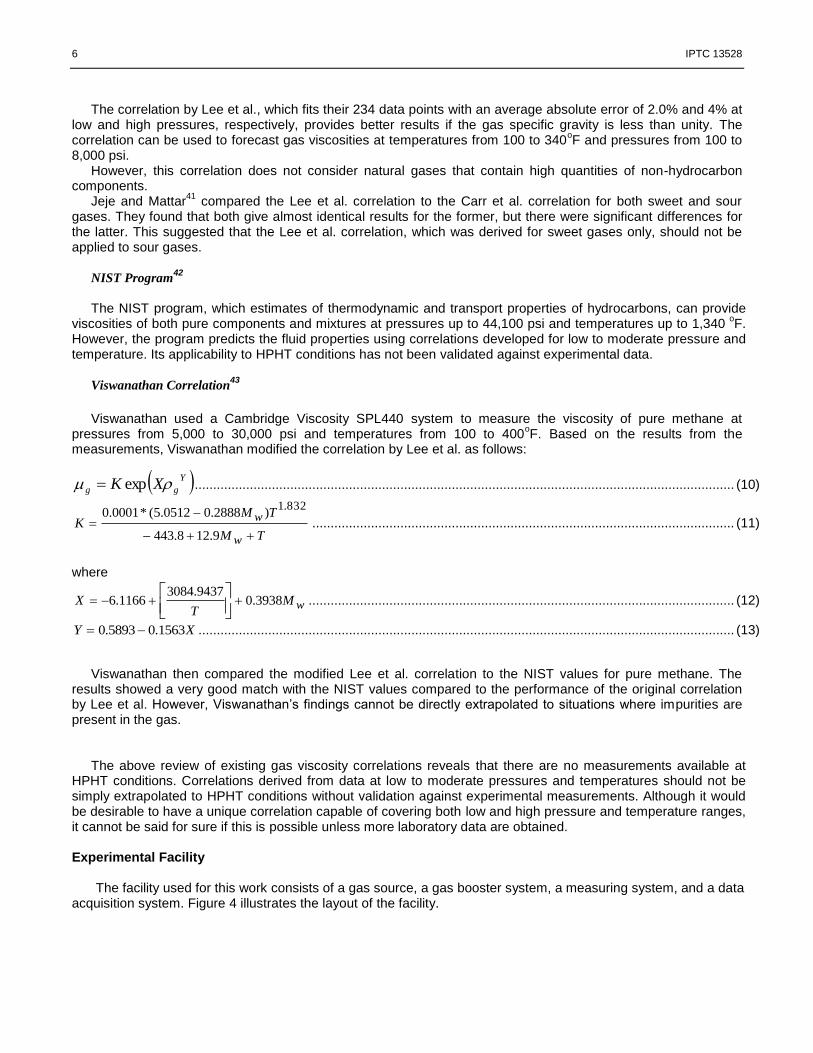
The facility used for this work consists of a gas source, a gas booster system, a measuring system, and a data acquisition system. Figure 4 illustrates the layout of the facility.
IPTC 13528 7
Figure 4. The Experimental Facility at Texas A&M University
Gas Source
Nitrogen and methane have been used in the tests described here. A gas tank, which supplies the gas at low
pressure, is connected to the inlet of the gas booster system where gas is compressed to high pressure.
Gas Booster System
The gas booster system, which consists of a hydraulic pump coupled with a booster cylinder to increase the
pressure of a given gas sample, comresses gas from 1,000 psig to 25,000 psig. The system is rated for use up to 30,000 psig and has a one-to-one ratio. Displacement per stroke is 112 cubic inches.
Measurement System - Cambridge Sensor
In this research, the Cambridge SPL440 High Pressure Research Viscosity Sensor was used to measure gas
viscosities at HPHT conditions. This technology is based on an electromagnetic concept, with two coils moving a piston back and forth magnetically at a constant force. The piston’s two-way travel time is then related to the fluid’s viscosity by a proprietary equation. The viscosity range for the system is 0.02 to 0.2 cp, with a reported accuracy of 1% of full scale. The maximum operating pressure is 20,000 psig.
Data Acquisition System
The SPL440 sensor was integrated with RS-232 serial communication support, allowing synchronization of the measurements with a desktop computer. The Cambridge ViscoLab PVT software was used to record the measurements. Through a data acquisition system, the measured pressure, average temperature, average gas viscosity, current temperature, and current gas viscosity could be output and stored for analysis.
8 IPTC 13528
Data Analysis
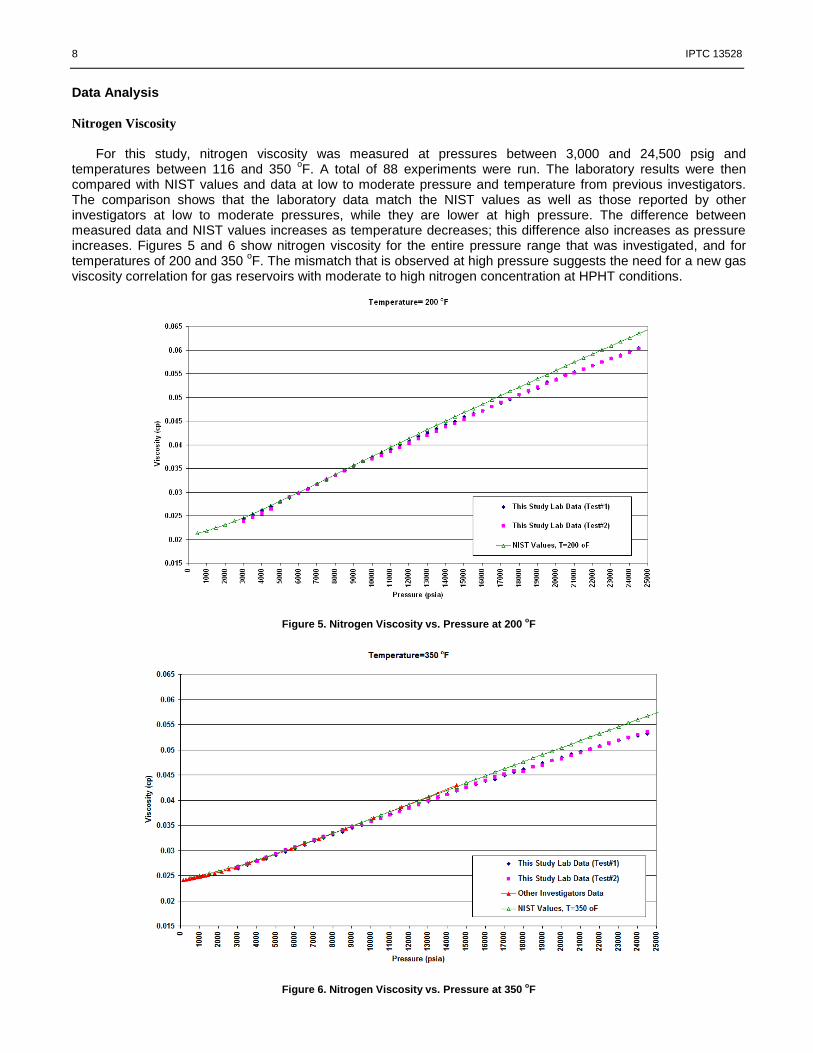
Nitrogen Viscosity
For this study, nitrogen viscosity was measured at pressures between 3,000 and 24,500 psig and temperatures between 116 and 350
oF. A total of 88 experiments were run. The laboratory results were then
compared with NIST values and data at low to moderate pressure and temperature from previous investigators. The comparison shows that the laboratory data match the NIST values as well as those reported by other investigators at low to moderate pressures, while they are lower at high pressure. The difference between measured data and NIST values increases as temperature decreases; this difference also increases as pressure increases. Figures 5 and 6 show nitrogen viscosity for the entire pressure range that was investigated, and for temperatures of 200 and 350
oF. The mismatch that is observed at high pressure suggests the need for a new gas
viscosity correlation for gas reservoirs with moderate to high nitrogen concentration at HPHT conditions.
Figure 5. Nitrogen Viscosity vs. Pressure at 200 oF
Figure 6. Nitrogen Viscosity vs. Pressure at 350 oF
IPTC 13528 9
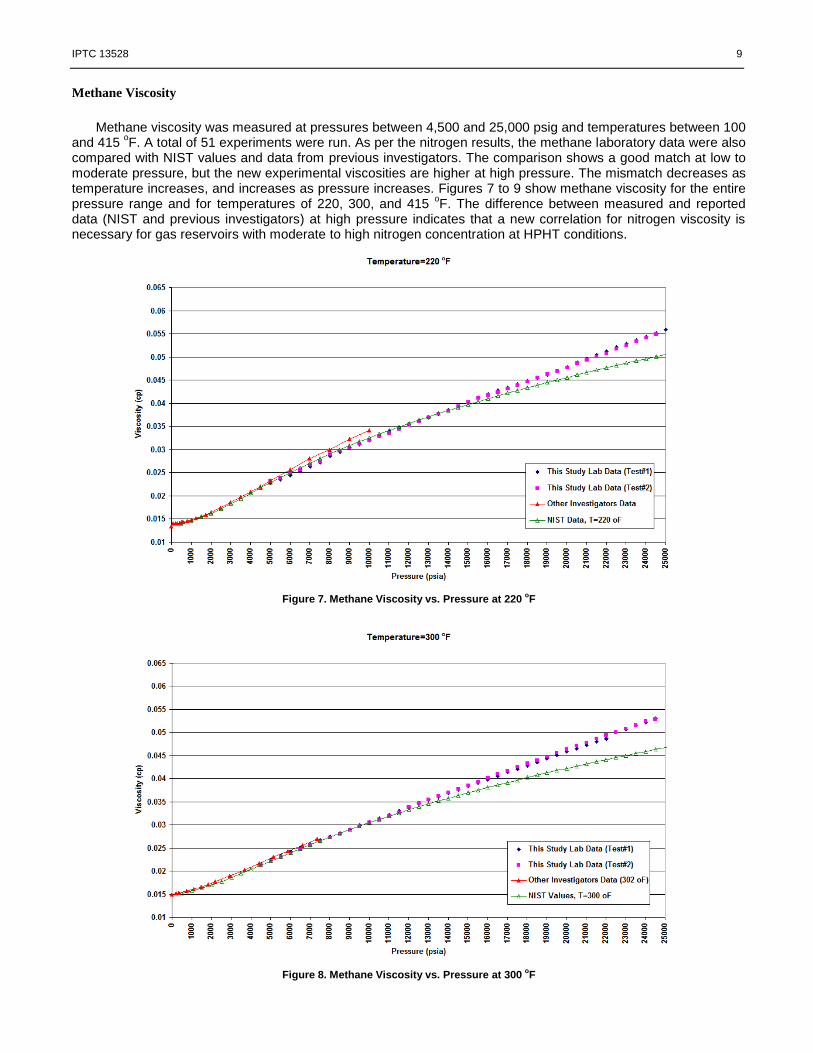
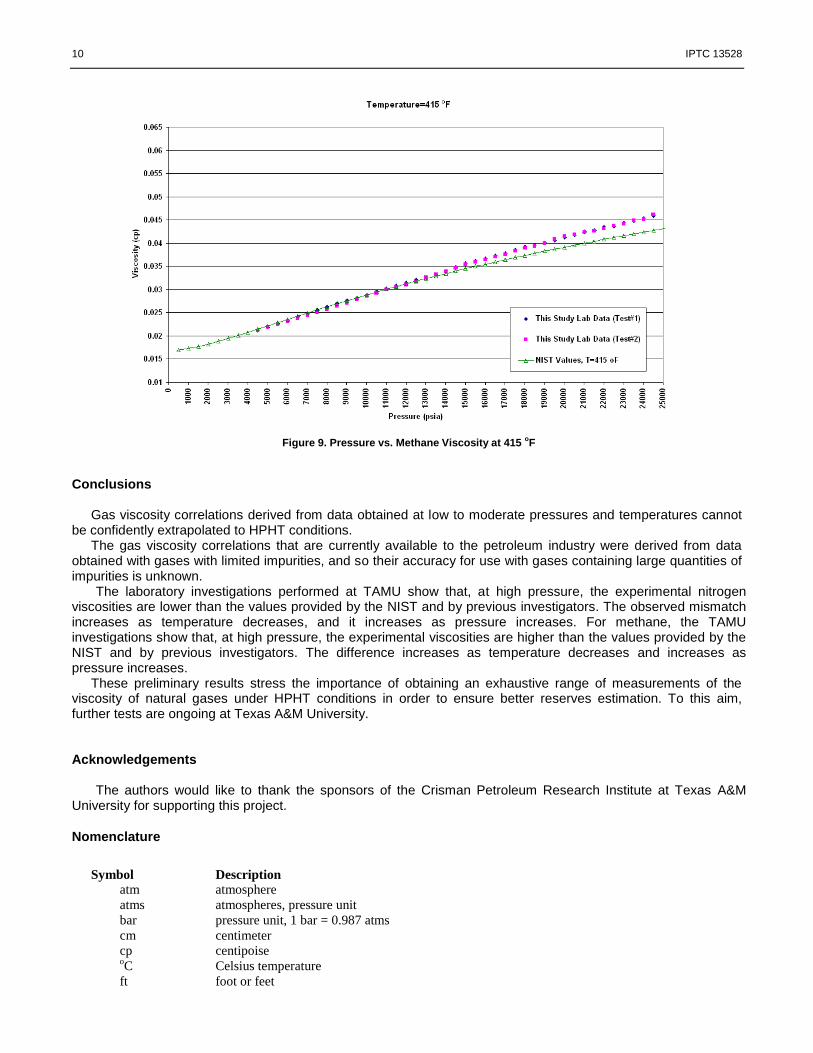
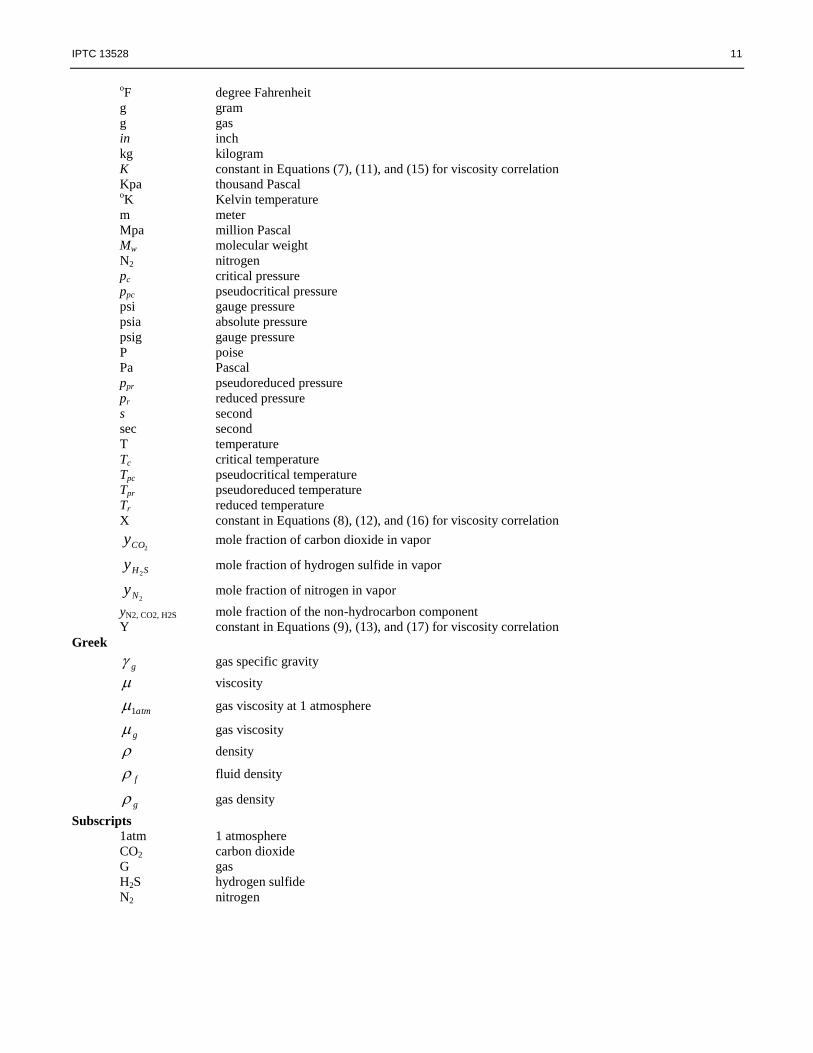
Methane Viscosity
Methane viscosity was measured at pressures between 4,500 and 25,000 psig and temperatures between 100 and 415
oF. A total of 51 experiments were run. As per the nitrogen results, the methane laboratory data were also
compared with NIST values and data from previous investigators. The comparison shows a good match at low to moderate pressure, but the new experimental viscosities are higher at high pressure. The mismatch decreases as temperature increases, and increases as pressure increases. Figures 7 to 9 show methane viscosity for the entire pressure range and for temperatures of 220, 300, and 415
oF. The difference between measured and reported
data (NIST and previous investigators) at high pressure indicates that a new correlation for nitrogen viscosity is necessary for gas reservoirs with moderate to high nitrogen concentration at HPHT conditions.
Figure 7. Methane Viscosity vs. Pressure at 220
oF
Figure 8. Methane Viscosity vs. Pressure at 300
oF
10 IPTC 13528
Figure 9. Pressure vs. Methane Viscosity at 415
oF
Conclusions
Gas viscosity correlations derived from data obtained at low to moderate pressures and temperatures cannot be confidently extrapolated to HPHT conditions.
The gas viscosity correlations that are currently available to the petroleum industry were derived from data obtained with gases with limited impurities, and so their accuracy for use with gases containing large quantities of impurities is unknown.
The laboratory investigations performed at TAMU show that, at high pressure, the experimental nitrogen viscosities are lower than the values provided by the NIST and by previous investigators. The observed mismatch increases as temperature decreases, and it increases as pressure increases. For methane, the TAMU investigations show that, at high pressure, the experimental viscosities are higher than the values provided by the NIST and by previous investigators. The difference increases as temperature decreases and increases as pressure increases.
These preliminary results stress the importance of obtaining an exhaustive range of measurements of the viscosity of natural gases under HPHT conditions in order to ensure better reserves estimation. To this aim, further tests are ongoing at Texas A&M University.
Acknowledgements The authors would like to thank the sponsors of the Crisman Petroleum Research Institute at Texas A&M
University for supporting this project.
Nomenclature
Symbol Description
atm atmosphere
atms atmospheres, pressure unit
bar pressure unit, 1 bar = 0.987 atms
cm centimeter
cp centipoise oC Celsius temperature
ft foot or feet
IPTC 13528 11
oF degree Fahrenheit
g gram
g gas
in inch
kg kilogram
K constant in Equations (7), (11), and (15) for viscosity correlation
Kpa thousand Pascal oK Kelvin temperature
m meter
Mpa million Pascal
Mw molecular weight
N2 nitrogen
pc critical pressure
ppc pseudocritical pressure
psi gauge pressure
psia absolute pressure
psig gauge pressure
P poise
Pa Pascal
ppr pseudoreduced pressure
pr reduced pressure
s second
sec second
T temperature
Tc critical temperature
Tpc pseudocritical temperature
Tpr pseudoreduced temperature
Tr reduced temperature
X constant in Equations (8), (12), and (16) for viscosity correlation
2COy mole fraction of carbon dioxide in vapor
SHy2
mole fraction of hydrogen sulfide in vapor
2Ny mole fraction of nitrogen in vapor
yN2, CO2, H2S mole fraction of the non-hydrocarbon component
Y constant in Equations (9), (13), and (17) for viscosity correlation
Greek
g gas specific gravity
viscosity
atm1 gas viscosity at 1 atmosphere
g gas viscosity
density
f fluid density
g gas density
Subscripts
1atm 1 atmosphere
CO2 carbon dioxide
G gas
H2S hydrogen sulfide
N2 nitrogen
12 IPTC 13528
References 1. Boyd, J. 1930. The Viscosity of Compressed Gases. Physica Review 35: 1284-1297
2. Michels A. and Gibson R. O. 1931. The Measurement of the Viscosity of Gases at High Pressures. The Viscosity of Nitrogen to 1000
Atms. Proc. R. Soc. Lond. A 134: 288-307
3. Sage, B. H. and Lacey, W. N. 1938. Effect of Pressure upon Viscosity of Methane and Two Natural Gases. Trans. Am. Inst. Mining Met.
Engrs. 127: 118-134
4. Bicher, L. B. and Katz, D. L. 1943. Viscosity of Methane-Propane System. Ind. Eng. Chem. 35:754-761
5. Comings, E. W. Mayland, B. J. and Egly, R. S. 1944. The Viscosity of Gases at High Pressures. University of Illinois Engineering
Experiment Station Bulletin Series No. 354
6. Iwasaki, H. 1954. Measurement of Viscosity of Gases at High Pressure. II Viscosities of Nitrogen and Mixture of Nitrogen and
Hydrogen. The Chemical Research Institute of Non-Aqueous Solution. 296-307
7. James, F. R. and George, M. B. 1957. Viscosity of Gases at High Pressures. Ind. Eng. Chem. 49:2026-2033
8. Baron J. D., Roof, J.G. and Well, F.W. 1959. Viscosity of Nitrogen, Methane, Ethane, and Propane at Elevated Temperature. Journal of
Chemical and Engineering Data. 4:283-288
9. Kestin, J. and Leidenfrost, W. 1959. An Absolute Determination of the Viscosity of Eleven Gases over a Range of Pressures. Physica.
25:1033-1062
10. Swift, G. W., Christy, J. A. and Fred, K. 1959. Liquid Viscosities of Methane and Propane. A.I.Ch.E. Journal 5:98-102
11. Golubev, I. F. 1959. Viscosity of Gases and Gas Mixtures, a Handbook. This paper is a translation from Russian by the NTIS (National
Technical Information Service)
12. Swift, G. W., John, L. and Fred, K. 1960. Liquid Viscosities above the Normal Boiling Point for Methane, Ethane, Propane, and n-
Butane. A.I.Ch.E. Journal 6:415-419
13. Flynn, G. P., Hanks, R.V., and Lemaire, N.A. 1963. Viscosities of Nitrogen, Helium, Neon, and Argon from -78.5o to 100 oC below 200
Atmospheres. The Journal of Chemical Physics 38:154-162
14. Barua, A. K., Afzal, M., Flynn, G. P., and Ross, J. 1964. Viscosities of Hydrogen, Deuterium, Methane, and Carbon Monoxide from -
50o to 150 oC below 200 Atmospheres. The Journal of Chemical Physics 41:374-378
15. Carmichael, L. T., Virginia, B., and Sage, B. H. 1965. Viscosities of Hydrocarbons. Methane. Journal of Chemical and Engineering
Data. 10:57-61
16. Lee, A. L.1965. Viscosity of Light Hydrocarbons, American Petroleum Institute, Monograph on API Research Project 65, New York
17. Giddings, J. G., James, T. F., and Riki, K. 1966. Development of a High-Pressure Capillary-Tube Viscometer and Its Application to
Methane, Propane, and Their Mixtures in the Gases and Liquid Regions. The Journal of Chemical Physics. 45:578-586
18. Lee, A.L., Gonzalez, M.H., and Eakin, B.E.1966. The Viscosity of Natural Gases. paper SPE 1340 presented at the 1966 Annual
Technical Conference and Exhibition held in Shreveport, LA, 11-12 November
19. Gonzalez, M.H., Richard, F.B. and Lee, A.L. 1966. The Viscosity of Methane. paper SPE 1483 presented at the Annual Fall Meeting
held in Dallas, Oct. 2-5 1966
20. Huang, E. T. S., Swift, G. W. and Fred, K. 1966. Viscosities of Methane and Propane at Low Temperatures and High Pressure.
A.I.Ch.E. Journal 12:932-936
21. Van Itterbeek, A., Hellemans, J., Zink, H., and Van Cauteren, M. 1966. Viscosity of Liquefied Gases at Pressures between 1 and 100
atmosphere. Physica. 32:2171-2172
22. Boon, J. P., Legros, J. C., and Thomaes, G. 1967. On the Principle of Corresponding State for the Viscosity of Simple Liquids. Physica.
33:547-557
23. Kestin, J. and Yata, J. 1968. Viscosity and Diffusion Coefficient of Six Binary Mixtures. The Journal of Chemical Physics. 49:4780-
4791
IPTC 13528 13
24. Grevendonk, W., Herreman, W., and De Bock, A. 1970. Measurements on the Viscosity of Liquid Nitrogen. Physica. 46:600-604
25. Helleman, J., Zink, H., and Van Paemel, O. 1970. The Viscosity of Liquid Argon and Liquid Methane along Isotherms as a Function of
Pressure. Physica. 46:395-410
26. Diehl, J., Gondouin, M., Houpeurt, A., Neoschil, J., Thelliez, M., Verrien, J.P., and Zurawsky, R.1970. Viscosity and Density of Light
Paraffins, Nitrogen and Carbon Dioxide. CREPS/Geopetrole
27. Latto, B., and Saunders, M.W. 1972. Viscosity of Nitrogen Gas at Low Temperatures Up to High Pressures: A New Appraisal. Physica.
46:600-604
28. Stephan, K., and Lucas, K.1979. Viscosity of Dense Fluids. The Purdue Research Foundation
29. Diller, D. E. 1980. Measurements of the Viscosity of Compressed Gases and Liquid Methane. Physica. 104A:417-426
30. Diller, D. E. 1983. Measurements of the Viscosity of Compressed Gases and Liquid Nitrogen. Physica. 119A:92-100
31. Hongo, M., Yokoyama, C., and Takahashi, D. 1988. Viscosity of Methane-Chlorodifluoromethane (R22) Gaseous Mixtures in the
Temperature Range from 298.15 to 373.15 oK and at pressures up to 5MP. Journal of Chemical Engineering of Japan. 21:632-639
32. Van Der Gulik, P. S., Mostert, R., and Van Den Berg, H. R. 1988. The Viscosity of Methane at 25 oC up to 10 kbar. Physica. 151A:153-
166
33. Vogel, E., Wilhelm, J., Cornelia, K., and Manfred, J.1999. High-Precision Viscosity Measurements on Methane. Presented at the 15th
European Conference on Thermophysical Properties, Wurzburg, Germany, 5-9 September 1999
34. Canet, X., Baylaucq, A., and Boned, C. 2002. High-Pressure (up to 140 MPa) Dynamic Viscosity of the Methane+Decane System.
International Journal of Thermophysics. 23:1469-1486
35. Baylaucq, A., Boned, C., Canet, X., and Mikkelsen Z. 2003. High-Pressure (up to 140 MPa) Dynamic Viscosity of the Methane and
Toluene System: Measurements and Comparative Study of Some representative Models. International Journal of Thermophysics. 24:621-
638
36. Audonnet, F. and Padua, A.A.H. 2004. Viscosity and Density of Mixtures of Methane and n-Decane from 298 to 393 K and up to 75
MPa. Fluid Phase Equil. 235-244
37. Schley, P., Jaeschke, M., Kuchenmeister, C., and Vogel E. 2004. Viscosity Measurements and Predictions for Natural Gas. International
Journal of Thermophysics. 25:1623-1652
38. Seibt, D., Vogel, E., Bich, E., Buttig, D., and Hassel, E. 2006. Viscosity Measurements on Nitrogen. J. Chem. Eng. Data 51:526-533
39. Carr, N.L. Kobayashi, R., and Burrows, D.B.1954. Viscosity of Hydrocarbon Gases under Pressure. Trans., AIME 201:264-272
40. Dempsey, J.R.1965. Computer Routine Treats Gas Viscosity as a Variable. Oil and Gas J. (16 August 1965) 141-143.
41. Jeje, O., and Mattar, L. 2004. Comparison of Correlations for Viscosity of Sour Natural Gas. Paper 2004-2004-214 presented at
Petroleum Society’s 5th Canadian International Petroleum Conference (55th Annual Technical Meeting), Calgary, Alberta, The Canada, 8
– 10. June.
42. National Institute of Science and Technology (NIST). Web-Book of Thermodynamic Properties of Fluids. National Institute of Science
and Technology (NIST). http://webbook.nist.gov,chemisty/fluid. Downloaded in November 2008.
43. Viswanathan. A. 2007. Viscosities of Natural Gases at High Pressures and High Temperatures. MS thesis, Texas A&M University,
College Station, Texas