Factors affecting the viscosity in high concentration solutions of different monoclonal antibodies
18
BIOTECHNOLOGY Factors Affecting the Viscosity in High Concentration Solutions of Different Monoclonal Antibodies SANDEEP YADAV, 1 STEVEN J. SHIRE, 2 DEVENDRA S. KALONIA 1 1 Department of Pharmaceutical Sciences, University of Connecticut, U-3092, Storrs, Connecticut 06269 2 Late Stage Pharmaceutical and Processing Development, Genentech, Inc., 1 DNA way, South San Francisco, California 94080 Received 21 November 2009; revised 10 February 2010; accepted 25 February 2010 Published online 10 May 2010 in Wiley Online Library (wileyonlinelibrary.com). DOI 10.1002/jps.22190 ABSTRACT: The viscosity profiles of four different IgG 1 molecules were studied as a function of concentration at pH 6.0. At high concentrations, MAb-H and -A showed significantly higher viscosities as compared to MAb-G and -E. Zeta Potential (j) measurements showed that all the IgG 1 molecules carried a net positive charge at this pH. MAb-G showed the highest positive zeta potential followed by MAb-E, -H, and -A. A consistent interpretation of the impact of net charge on viscosity for these MAbs is not possible, suggesting that electroviscous effects cannot explain the differences in viscosity. Values of k D (dynamic light scattering) indicated that the inter- molecular interactions were repulsive for MAb-E and -G; and attractive for MAb-H and -A. Solution storage modulus (G 0 ) in high concentration solutions was consistent with attractive intermolecular interactions for MAb-H and -A, and repulsive interactions for MAb-G and -E. Effect of salt addition on solution G 0 and k D indicated that the interactions were primarily electrostatic in nature. The concentration dependent viscosity data were analyzed using a modified Ross and Minton equation. The analysis explicitly differentiates between the effect of molecular shape, size, self-crowding, and electrostatic intermolecular interactions in governing high concentration viscosity behavior. ß 2010 Wiley-Liss, Inc. and the American Pharmacists Associa- tion J Pharm Sci 99:4812–4829, 2010 Keywords: proteins; protein formulation; viscosity; light-scattering; formulation INTRODUCTION Monoclonal antibodies (MAbs) have gained signifi- cant attention in recent years because of their specificity towards a range of targets. 1–3 However, MAbs are usually low potency molecules and require several mg/kg body weight doses. Many of these molecules have been administered intravenously, but more indications requiring home administration are being considered requiring the more convenient subcutaneous (SC) dosing regimen. The SC route of administration poses a volume restriction (approxi- mately <1.5 mL), which necessitates the use of formulations containing high concentration of MAbs. These formulations require understanding of several concentration dependent issues such as high viscosity during formulation and manufacturing, analytical methods for characterizations at high concentration, and long-term aggregation stability. 4–6 High solution viscosity can impact both manufac- turing and injection administration capabilities of the formulation. The solution viscosity can be repre- sented as the virial expansion of a polynomial: 7 h ¼ h 0 ð1 þ k 1 c þ k 2 c 2 þ k 3 c 3 þ :::Þ (1) where, h and h 0 are the solution and solvent viscosity, respectively; c is the concentration in g/mL, and k 1 , k 2 , and k 3 are the first, second, and third order virial coefficients. In dilute solutions the contribution from higher order terms can be neglected so that Eq. (1) becomes linear with c: h red ¼ h=h 0 1 c ¼ k 1 þ k 2 c (2) where, h red is the reduced viscosity which, at infinite dilution gives a measure of k 1 , the intrinsic viscosity of the molecule. At higher solute concentrations, the higher order terms, which are related to pair-wise and correlated higher order interactions among mole- Correspondence to: Devendra S. Kalonia (Telephone: 860-486- 3655; Fax: 860-486-4998; E-mail: [email protected]) Journal of Pharmaceutical Sciences, Vol. 99, 4812–4829 (2010) ß 2010 Wiley-Liss, Inc. and the American Pharmacists Association 4812 JOURNAL OF PHARMACEUTICAL SCIENCES, VOL. 99, NO. 12, DECEMBER 2010
-
Upload
independent -
Category
Documents
-
view
2 -
download
0
Transcript of Factors affecting the viscosity in high concentration solutions of different monoclonal antibodies
BIOTECHNOLOGY
Factors Affecting the Viscosity in High Concentration Solutionsof Different Monoclonal Antibodies
SANDEEP YADAV,1 STEVEN J. SHIRE,2 DEVENDRA S. KALONIA1
1Department of Pharmaceutical Sciences, University of Connecticut, U-3092, Storrs, Connecticut 06269
2Late Stage Pharmaceutical and Processing Development, Genentech, Inc., 1 DNA way, South San Francisco, California 94080
Received 21 November 2009; revised 10 February 2010; accepted 25 February 2010
Published online 10 May 2010 in Wiley Online Library (wileyonlinelibrary.com). DOI 10.1002/jps.22190
Corresponde3655; Fax: 860-
Journal of Pharm
� 2010 Wiley-Liss
4812 JOURN
ABSTRACT: The viscosity profiles of four different IgG1 molecules were studied as a function ofconcentration at pH 6.0. At high concentrations, MAb-H and -A showed significantly higherviscosities as compared to MAb-G and -E. Zeta Potential (j) measurements showed that all theIgG1 molecules carried a net positive charge at this pH. MAb-G showed the highest positive zetapotential followed by MAb-E, -H, and -A. A consistent interpretation of the impact of net chargeon viscosity for these MAbs is not possible, suggesting that electroviscous effects cannot explainthe differences in viscosity. Values of kD (dynamic light scattering) indicated that the inter-molecular interactions were repulsive for MAb-E and -G; and attractive for MAb-H and -A.Solution storage modulus (G0) in high concentration solutions was consistent with attractiveintermolecular interactions for MAb-H and -A, and repulsive interactions for MAb-G and -E.Effect of salt addition on solution G0 and kD indicated that the interactions were primarilyelectrostatic in nature. The concentration dependent viscosity data were analyzed using amodified Ross and Minton equation. The analysis explicitly differentiates between the effect ofmolecular shape, size, self-crowding, and electrostatic intermolecular interactions in governinghigh concentration viscosity behavior. � 2010 Wiley-Liss, Inc. and the American Pharmacists Associa-
tion J Pharm Sci 99:4812–4829, 2010
Keywords: proteins; protein formulation; v
iscosity; light-scattering; formulationINTRODUCTION
Monoclonal antibodies (MAbs) have gained signifi-cant attention in recent years because of theirspecificity towards a range of targets.1–3 However,MAbs are usually low potency molecules and requireseveral mg/kg body weight doses. Many of thesemolecules have been administered intravenously, butmore indications requiring home administration arebeing considered requiring the more convenientsubcutaneous (SC) dosing regimen. The SC route ofadministration poses a volume restriction (approxi-mately <1.5 mL), which necessitates the use offormulations containing high concentration of MAbs.These formulations require understanding of severalconcentration dependent issues such as high viscosityduring formulation and manufacturing, analytical
nce to: Devendra S. Kalonia (Telephone: 860-486-486-4998; E-mail: [email protected])
aceutical Sciences, Vol. 99, 4812–4829 (2010)
, Inc. and the American Pharmacists Association
AL OF PHARMACEUTICAL SCIENCES, VOL. 99, NO. 12, DECEMB
methods for characterizations at high concentration,and long-term aggregation stability.4–6
High solution viscosity can impact both manufac-turing and injection administration capabilities of theformulation. The solution viscosity can be repre-sented as the virial expansion of a polynomial:7
h ¼ h0ð1 þ k1c þ k2c2 þ k3c3 þ :::Þ (1)
where, h and h0 are the solution and solvent viscosity,respectively; c is the concentration in g/mL, and k1, k2,and k3 are the first, second, and third order virialcoefficients. In dilute solutions the contribution fromhigher order terms can be neglected so that Eq. (1)becomes linear with c:
hred ¼ h=h0 � 1
c
� �¼ k1 þ k2c (2)
where, hred is the reduced viscosity which, at infinitedilution gives a measure of k1, the intrinsic viscosityof the molecule. At higher solute concentrations, thehigher order terms, which are related to pair-wise andcorrelated higher order interactions among mole-
ER 2010
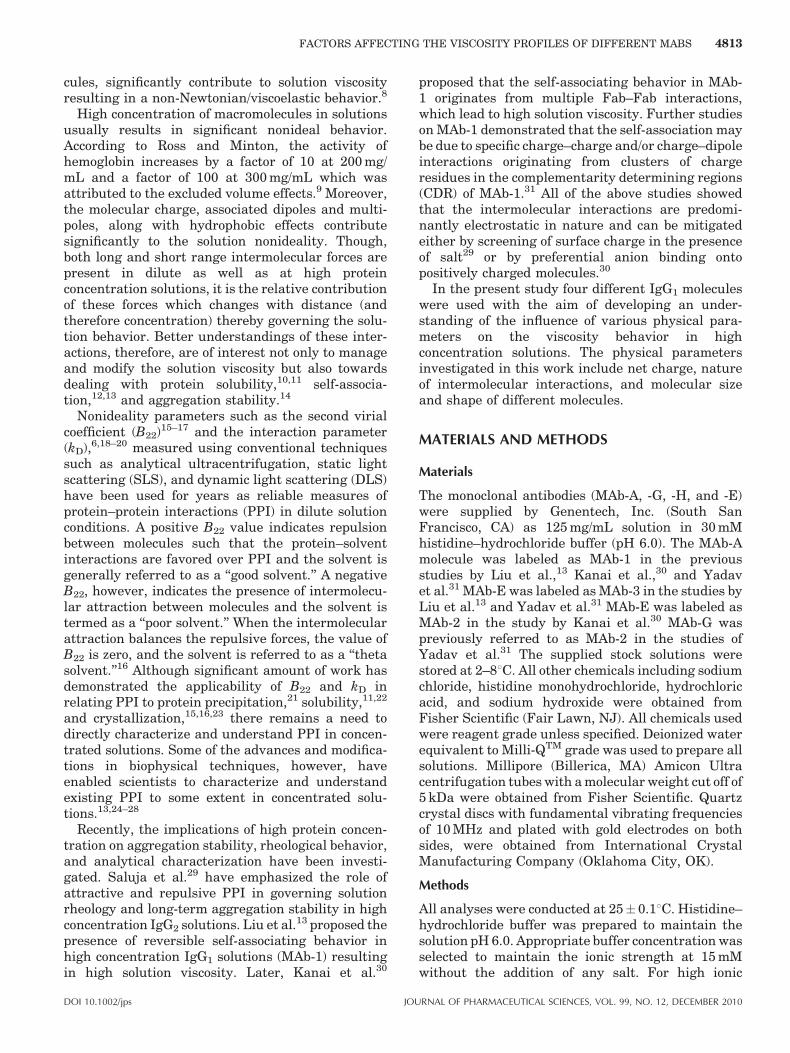
FACTORS AFFECTING THE VISCOSITY PROFILES OF DIFFERENT MABS 4813
cules, significantly contribute to solution viscosityresulting in a non-Newtonian/viscoelastic behavior.8
High concentration of macromolecules in solutionsusually results in significant nonideal behavior.According to Ross and Minton, the activity ofhemoglobin increases by a factor of 10 at 200 mg/mL and a factor of 100 at 300 mg/mL which wasattributed to the excluded volume effects.9 Moreover,the molecular charge, associated dipoles and multi-poles, along with hydrophobic effects contributesignificantly to the solution nonideality. Though,both long and short range intermolecular forces arepresent in dilute as well as at high proteinconcentration solutions, it is the relative contributionof these forces which changes with distance (andtherefore concentration) thereby governing the solu-tion behavior. Better understandings of these inter-actions, therefore, are of interest not only to manageand modify the solution viscosity but also towardsdealing with protein solubility,10,11 self-associa-tion,12,13 and aggregation stability.14
Nonideality parameters such as the second virialcoefficient (B22)15–17 and the interaction parameter(kD),6,18–20 measured using conventional techniquessuch as analytical ultracentrifugation, static lightscattering (SLS), and dynamic light scattering (DLS)have been used for years as reliable measures ofprotein–protein interactions (PPI) in dilute solutionconditions. A positive B22 value indicates repulsionbetween molecules such that the protein–solventinteractions are favored over PPI and the solvent isgenerally referred to as a ‘‘good solvent.’’ A negativeB22, however, indicates the presence of intermolecu-lar attraction between molecules and the solvent istermed as a ‘‘poor solvent.’’ When the intermolecularattraction balances the repulsive forces, the value ofB22 is zero, and the solvent is referred to as a ‘‘thetasolvent.’’16 Although significant amount of work hasdemonstrated the applicability of B22 and kD inrelating PPI to protein precipitation,21 solubility,11,22
and crystallization,15,16,23 there remains a need todirectly characterize and understand PPI in concen-trated solutions. Some of the advances and modifica-tions in biophysical techniques, however, haveenabled scientists to characterize and understandexisting PPI to some extent in concentrated solu-tions.13,24–28
Recently, the implications of high protein concen-tration on aggregation stability, rheological behavior,and analytical characterization have been investi-gated. Saluja et al.29 have emphasized the role ofattractive and repulsive PPI in governing solutionrheology and long-term aggregation stability in highconcentration IgG2 solutions. Liu et al.13 proposed thepresence of reversible self-associating behavior inhigh concentration IgG1 solutions (MAb-1) resultingin high solution viscosity. Later, Kanai et al.30
DOI 10.1002/jps JOU
proposed that the self-associating behavior in MAb-1 originates from multiple Fab–Fab interactions,which lead to high solution viscosity. Further studieson MAb-1 demonstrated that the self-association maybe due to specific charge–charge and/or charge–dipoleinteractions originating from clusters of chargeresidues in the complementarity determining regions(CDR) of MAb-1.31 All of the above studies showedthat the intermolecular interactions are predomi-nantly electrostatic in nature and can be mitigatedeither by screening of surface charge in the presenceof salt29 or by preferential anion binding ontopositively charged molecules.30
In the present study four different IgG1 moleculeswere used with the aim of developing an under-standing of the influence of various physical para-meters on the viscosity behavior in highconcentration solutions. The physical parametersinvestigated in this work include net charge, natureof intermolecular interactions, and molecular sizeand shape of different molecules.
MATERIALS AND METHODS
Materials
The monoclonal antibodies (MAb-A, -G, -H, and -E)were supplied by Genentech, Inc. (South SanFrancisco, CA) as 125 mg/mL solution in 30 mMhistidine–hydrochloride buffer (pH 6.0). The MAb-Amolecule was labeled as MAb-1 in the previousstudies by Liu et al.,13 Kanai et al.,30 and Yadavet al.31 MAb-E was labeled as MAb-3 in the studies byLiu et al.13 and Yadav et al.31 MAb-E was labeled asMAb-2 in the study by Kanai et al.30 MAb-G waspreviously referred to as MAb-2 in the studies ofYadav et al.31 The supplied stock solutions werestored at 2–88C. All other chemicals including sodiumchloride, histidine monohydrochloride, hydrochloricacid, and sodium hydroxide were obtained fromFisher Scientific (Fair Lawn, NJ). All chemicals usedwere reagent grade unless specified. Deionized waterequivalent to Milli-QTM grade was used to prepare allsolutions. Millipore (Billerica, MA) Amicon Ultracentrifugation tubes with a molecular weight cut off of5 kDa were obtained from Fisher Scientific. Quartzcrystal discs with fundamental vibrating frequenciesof 10 MHz and plated with gold electrodes on bothsides, were obtained from International CrystalManufacturing Company (Oklahoma City, OK).
Methods
All analyses were conducted at 25� 0.18C. Histidine–hydrochloride buffer was prepared to maintain thesolution pH 6.0. Appropriate buffer concentration wasselected to maintain the ionic strength at 15 mMwithout the addition of any salt. For high ionic
RNAL OF PHARMACEUTICAL SCIENCES, VOL. 99, NO. 12, DECEMBER 2010
4814 YADAV, SHIRE, AND KALONIA
strength studies, sodium chloride was added to adjustthe ionic strength to 150 mM. Prior to analysis, theantibody solutions were buffer exchanged withhistidine buffer at pH 6.0 using Millipore AmiconUltra centrifugation tubes with a molecular weightcut-off of 5 kDa. After buffer exchange, the concen-trations of the samples were determined using a UVspectrophotometer and an absorptivity of 1.6 mg�1/mL�1 cm�1 for MAb-A and -H, 1.46 mg�1/mL�1 cm�1
for MAb-E, and 1.57 mg�1/mL�1 cm�1 for MAb-G at280 nm for 0.1% (w/v) IgG solutions. The solution pHwas checked for each dialyzed sample. Subsequently,the concentration of all the antibody solutions wasadjusted as per the requirements of experimentsperformed. Lower concentrations were prepared upondilution with the respective buffer.
Zeta Potential
Zeta potential (j) measurements were performed at25� 0.18C using a Malvern Zetasizer Nano Series(Worcestershire, UK). The zeta potential was mea-sured at an antibody concentration of 5 mg/mL usinga DTS1060 clear disposable folded capillary cell. Theunderlying principle in zeta potential measurementsis determining the electrophoretic mobility of themolecules under an applied electric field. Malvern’sZetasizer Nano uses the laser Doppler velocimetrytechnique in combination with Mixed Mode Measure-ment (M3) and phase analysis light scattering(PALS). The M3 utilizes an alternating electric fieldin fast field reversal (FFR) and a slow field reversal(SFR) mode to avoid the interference of electro-osmosis and improve the resolution of measurements,respectively. PALS uses the information in phase ofthe scattered light to determine the frequency shiftdue to the electrophoretic mobility of particles. Theelectrophoretic mobility is then used to determine thezeta potential value using Henry’s equation:
UE ¼ 2�jf1ðkaÞ3h
(3)
where, UE is the electrophoretic mobility under theapplied voltage, � is the dielectric constant of themedium, h is the viscosity of the dispersant, j is thezeta potential in Volts and f1(ka) is the Henry’sfunction. Different solutions exist for f1(ka) dependingupon the ratio of the radius of curvature to thethickness of the electrical double layer around theparticle.32,33 The latter in turn is governed by theionic strength of the medium. For a sphere, the valueof f1(ka) approaches 1.0 for small ka (Huckel approx-imation), and approaches 1.5 for large ka (Smolu-chowski approximation). At 15 mM solution ionicstrength, the f1(ka) value of 1.066 has been used tocalculate the zeta potential. However, it is to be notedthat the Zetasizer applies a constant voltage ratherthan a constant current during measurements. This
JOURNAL OF PHARMACEUTICAL SCIENCES, VOL. 99, NO. 12, DECEMBER 2010
may produce erroneous results especially at highsolution ionic strength. For the data reported, thecurrent was monitored during measurements toensure a constant current. Each measurement wasan average of 20, and five independent measurementswere performed at each pH.
If the zeta potential of a particle is less than kT/e(i.e., 25.7 mV at 258C), the electrophoretic mobilityand zeta potential of the particle can be linearlycorrelated. The linear correlation is based on thelinearized Poisson–Boltzmann equation also referredto as the Debye–Huckel approximation. The netcharge of the particles, z, can be evaluated from thesurface potential, j, as
z ¼ 4p�að1 þ kaÞje
(4)
where e is the electronic charge, a is the particleradius and the inverse Debye length k is given by.34
k ¼ 8pN0e2
1000�kT
� �1=2
I1=2 (5)
where N0 is Avogadro’s number and k is Boltzman’sconstant, I is the solution ionic strength, and T is thetemperature. Note that the radius, a, in the Henry’sand Poisson–Boltzmann equation are different thanthe Stokes radius of the molecule. However, for thepresent charge calculations, the radius ‘‘a’’ has beensubstituted by the hydrodynamic radius, ‘‘Rh.’’ Thehydrodynamic radii, ‘‘Rh’’ for the IgG1 molecules werecalculated using the Stokes–Einstein equation fromthe self-diffusion coefficients, Ds, obtained from DLSmeasurements. The use of Rh in place of ‘‘a’’ results inan increase in charge estimates and brings them inline with calculated values.35
Viscosity Measurements
For dilute solutions (5–35 mg/mL) the viscosity wasmeasured using a Cannon-Manning Semi-micro Size-25 capillary viscometer (Cannon Instrument Com-pany, State College, PA). The size-25 capillaryviscometer is the slowest flowing model commerciallyavailable with a flow time of 467 s for water. All themeasurements were performed using the sameviscometer. The viscometer was mounted preciselyat the same position each time in a water bathmaintained at 25� 0.18C. After each measurement itwas cleaned immediately with hot sulfuric aciddichromate solution, rinsed numerous times toremove all traces of the acid, and dried with filteredair. Flow times were recorded within 1 s by means ofelectric timers. Samples were allowed to come totemperature equilibrium and passed once throughthe capillary before any measurements were made.From three to six flow time measurements were madeon each solution, in triplicate.
DOI 10.1002/jps
FACTORS AFFECTING THE VISCOSITY PROFILES OF DIFFERENT MABS 4815
For high concentration solutions (20–225 mg/mL)the sample viscosities were measured using aVISCOlab 5000 viscometer system (Cambridge Visc-osity, Medford, MA). Approximately 70mL of thesample was loaded into the sample chamber wherethe piston resides. A controlled magnetic field drivesthe piston into oscillatory motion within the samplechamber. Pistons calibrated over viscosity ranges0.5–5.0, 2.5–50, and 5–100 cP were used for viscositymeasurements. Once the sample was at 25� 0.18C(test temperature), the piston was propelled repeat-edly through the liquid. The dynamic viscosity wasdetermined by measuring the average travel timeof the piston. All the samples were analyzed intriplicate. Before each measurement, the samplechamber was thoroughly cleaned with double distilledwater and dried with nitrogen.
The rheological properties of monoclonal antibodieswere evaluated using ultrasonic shear rheometerwith quartz crystals vibrating at a fundamentalfrequency of 10 MHz. The theory and experimentalprocedure have been described previously.36 Theelectrical properties of the quartz crystal that areused to characterize the liquid are the shifts in itsseries resistance (R2), and reactance (X2). Thedifference arising in the electrical properties of thecrystal upon placing a liquid load is than subse-quently used to calculate solution loss (G00) andstorage (G0) moduli, and consequently complexviscosity (h�). For non-Newtonian viscoelastic fluids,the solution storage (G0) and loss (G00) moduli and thecomplex viscosity (h�) are given by the followingrelationship:36–39
G0ðvÞ ¼ R22 � X2
2
A2rLiq
(6)
G00ðvÞ ¼ 2R2X2
A2rLiq
(7)
h� ¼ ððG0Þ2 þ ðG00Þ2Þ1=2
v¼ G�
v(8)
where, A is a crystal constant, rliq is liquid density,and v is the quartz crystal frequency. In this study,35-mL samples of the IgG1 solution were analyzed intriplicate. The temperature of the liquid samples wascontrolled at 25� 0.18C prior to and during measure-ment using a temperature controlled water jacket.
Dynamic Light Scattering
DLS studies were conducted at 25� 0.18C using aMalvern Zetasizer Nano Series. The buffers werefiltered through sterile 0.22mm Millipore’s Duraporemembrane filters before centrifugal ultrafiltration.After buffer exchange, the protein solutions werefiltered through 0.22mm Millipore’s Millex-W syringe
DOI 10.1002/jps JOU
filters. The concentration of IgG1 in the solution wasadjusted to 12 mg/mL and pH was measured to ensureconsistency. Before analysis, the protein solutionswere centrifuged at 6740 g for 5 min using aneppendorf minispin (Hamburg, Germany) centrifuge.The Zetasizer Nano S utilizes a 632.8 nm helium–neon laser and analyzes scattered light at an angle of1738 by utilizing a noninvasive back-scatter techni-que. Back-scatter measurement reduces interferencefrom multiple scattering and also limits the contribu-tion of dust particles to the scattered intensity. A lowvolume glass cuvette, DTS2145 (Malvern Instru-ments, Worcestershire, UK), was used for holding thesample. A total of 15 scans, each with duration of 20 s,were accumulated for each sample. All the sampleswere analyzed in triplicate. DTS software (MalvernInstruments) was used to analyze the acquiredcorrelogram (correlation function vs. time) and obtainthe mutual diffusion coefficient (Dm). The Dm willdecrease with an increase in solute concentration dueto an increase in solution viscosity with concen-tration. To ensure that the change in Dm withconcentration is only due to intermolecular interac-tion and not due to change in viscosity, the obtainedDm was adjusted for solution viscosity for eachconcentration analyzed. The measured Dm can thenbe used in the Stokes–Einstein equation for calcula-tion of the hydrodynamic diameter (dH).
RESULTS AND DISCUSSION
Viscosity Measurements: Low Shear
The viscosity coefficients for macromolecular solu-tions are both a colligative property of the solutionand a constitutive property of the macromolecule. Theviscosity coefficients describing the properties of aprotein solution system are, therefore, a function ofseveral variables. A few among these are: (i) theviscosity coefficient of the solvent, (ii) temperature ofthe solution, (iii) pH of the solution, (iv) ionic strengthof the solution, (v) the velocity gradient under whichviscosity coefficient was measured, (vi) concentrationof the solute, (vii) electric charge on the molecule,(viii) physical interaction between macromolecules,(ix) the solvation of the molecule and (x) the shape ofthe macromolecule.40 The present study focuses onthe effect of factors (v) to (x) on protein solutionviscosity, while maintaining factors (i) to (iv), that is,the solvent, temperature, pH, and ionic strengthconstant.
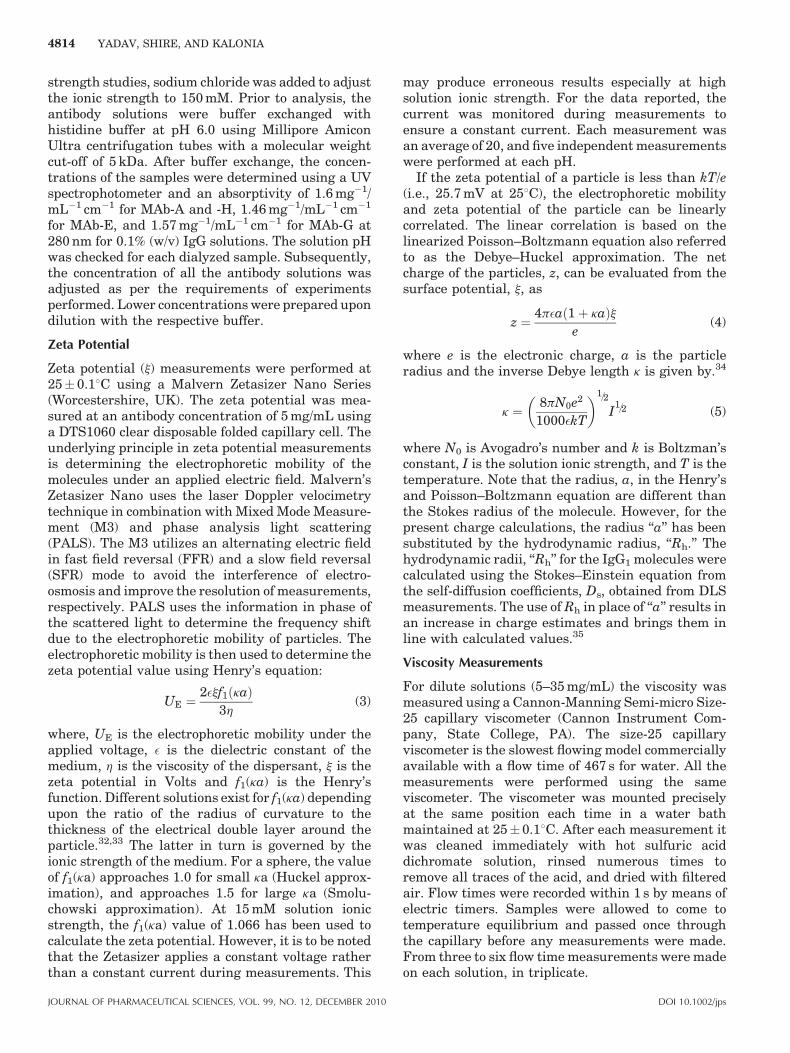
Figure 1 shows the viscosity profiles of fourdifferent IgG1 molecules as a function of concentra-tion at pH 6.0. Among the four IgG1 moleculesstudied, MAb-H showed the highest solution viscositywith a sharp increase with increasing proteinconcentration. MAb-A, -G, and -E follow similar
RNAL OF PHARMACEUTICAL SCIENCES, VOL. 99, NO. 12, DECEMBER 2010
Figure 1. Viscosity profile of IgG1 molecules as a function of concentration. Themeasurements were performed at solution pH 6.0, 15 mM ionic strength. The lineconnects the data points to guide the eye and is not a result of model fitting to the data.
4816 YADAV, SHIRE, AND KALONIA
trends but at relatively higher concentrations. Theviscosity value at a given concentration followsH>A>G>E.
An increase in solute concentration would result inan increase in viscosity, merely due to additionalenergy requirements to translate or rotate thesemolecules in solution. However, at a given concentra-tion the difference in solution viscosity can be affectedby any of the factors from (vii) to (x). To elucidate theeffect of electric charge, physical interaction andsolvation of molecules on the viscosity, firstly, the netcharges on IgG1 molecules were calculated from thezeta potential data.
Zeta Potential Measurements: Correlation of Viscositywith Net Charge
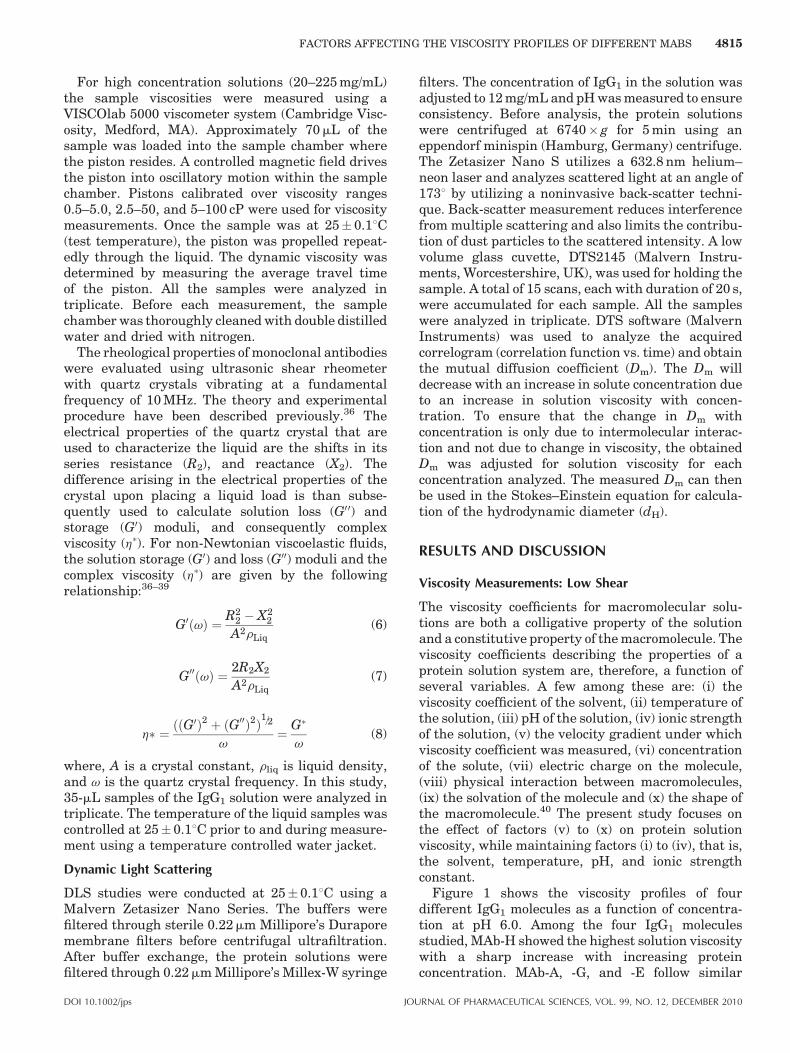
Zeta potential or electrokinetic potential is theelectric potential that exists at the ‘‘shear plane’’ ofa particle/macromolecule. The shear plane (slippingplane) separates a thin layer of liquid bound to thesolid surface and forms the kinetic unit such that theparticle moves along with a certain quantity of thesurrounding liquid and its contained charge. The zetapotential therefore also includes contribution fromthe counterions which serves to screen the surfacecharge and gives a measure of effective molecularcharge in solution. The measured zeta potentialvalues for different IgG1 molecules are plotted inFigure 2. The value in parentheses is the net chargecalculated using Eq. (4). This net charge representsthe time average value of the charge carried by theIgG1 molecule. All IgG1 molecules showed a positive
JOURNAL OF PHARMACEUTICAL SCIENCES, VOL. 99, NO. 12, DECEMBER 2010
zeta potential and net charge at solution pH 6.0. Asthe solution pH and ionic strength are kept constant,the isoelectric point (pI) of the molecule and numberof ionizable side chains would govern the net charge,and therefore, zeta potential of the molecule. At a pHequal to the pI the net charge on the molecule will bezero whereas a net positive charge will exist at pHvalues below the pI, and a net negative charge willexist at a pH above the pI. The measured pI of MAb-Aand -E measured using isoelectric focusing experi-ments are 7.6 and 9.0, respectively. Thetheoretical pIs for MAb-G and -H molecules, calcu-lated from the amino acid sequence, were 9.2 and8.8, respectively. Since the solution pH 6.0 is belowthe pI of all IgG1 molecules studied, zeta potentialresults are consistent with our understandingwherein all molecules showed a net positive potential.Furthermore, among all IgG1 molecules, the j valuewas highest for MAb-G (14.41� 0.79 mV) and lowestfor MAb-A (4.5� 1.0 mV). The j values for MAb-E and-H were 10.86� 1.62 and 6.88� 1.02 mV, respec-tively.
The presence of a charge on protein molecules canaffect the solution viscosity due to one of the followingreasons; (a) the electroviscous effects, (b) a change inthe molecular size, or (c) physical (electrostatic)interaction between molecules. The net charge willresult in a hydration shell of polarized watermolecules associated with ion double layer aroundthe molecule, known as the primary electroviscouseffect. This hydration layer will result in an increasein effective hydrodynamic radius of the molecule,
DOI 10.1002/jps
Figure 2. Zeta potential of IgG1 molecules at solution pH 6.0, 15 mM ionic strength.The measurements are performed at a concentration of 5 mg/mL at 25� 0.18C. Thenumber in parentheses represents the effective charge calculated from linear correlationof j and Z (Eq. 4). An average hydrodynamic radius, Rh¼ 5.5 nm, determined from DLSmeasurements, was used for charge calculation. The result is an average of fivemeasurements.
FACTORS AFFECTING THE VISCOSITY PROFILES OF DIFFERENT MABS 4817
thereby increasing the resistance to flow. Thesecondary electroviscous effect refers to the electro-static interaction between diffuse double layerssurrounding the molecules, as they approach eachother. Both primary and secondary electroviscouseffects will, therefore, result in an increase in thesolution viscosity with a higher charge resulting in ahigher contribution to viscosity. Previous studieshave also shown that the viscosity may well begoverned by electroviscous effects due to higher netcharge on the protein molecule.41–43 Additionally, thepresence of a charge may result in a slight expansionof protein molecules due to intramolecular repulsionbetween like charges thus resulting in highermolecular size or intrinsic viscosity.44
The zeta potential values suggest a difference in netcharge for the different IgG1 molecules in this study.If the determined viscosities are interpreted in termsof physical or electrostatic interactions based on netcharge, at least for the studied molecules, the resultsappear inconsistent throughout. In particular, itappears that the molecules with a relatively lowernet charge showed a higher viscosity (MAb-A and -H)in comparison with the ones carrying a highermolecular charge (MAb-G and -E). However, a closerexamination points towards a discrepancy in the netcharge versus viscosity data even for the lowercharged MAb-A and -H molecules. MAb-A beinglowest charged does not show the highest viscosity,rather MAb-H with a relatively higher charge than
DOI 10.1002/jps JOU
MAb-A is most viscous of all. On the other hand, if ahigher net charge should result in strong electrostaticinteraction that increases viscosity, then MAb-Ghaving the highest positive zeta potential shouldhave had the highest solution viscosity. It is clear thatthe viscosity profile for the studied IgG1 moleculescannot be explained on the basis of electroviscouseffects or the net charge-induced intermolecularrepulsions. At this stage we would like to reserveour conclusion regarding the overall effect of chargeon solution viscosity until we analyze the effect ofother factors on viscosity behavior that may beaffected by molecular charge.
Intrinsic Viscosity Analysis: Correlation of Viscositywith Molecular Size
As mentioned earlier, the viscosity of a proteinsolution is also affected by its molecular size andshape. Therefore, intrinsic viscosity [h] analysis wasperformed to determine the molecular size of differentIgG1 molecules.
The concentration dependence of the reducedviscosity, hred, in Eq. (2), is often expressed in termsof Huggins relation:45
hred ¼hsp
c¼ ½h� þ kH½h�2c (9)
where, c is the concentration in g/mL, kH is a constantknown as the Huggins coefficient, and hsp is the
RNAL OF PHARMACEUTICAL SCIENCES, VOL. 99, NO. 12, DECEMBER 2010
4818 YADAV, SHIRE, AND KALONIA
specific viscosity defined as:
hsp ¼ ðh� h0Þh0
(10)
The [h] can be obtained by extrapolating hsp/c tozero concentration and can be expressed as:
½h�H ¼ limc!0
hsp
c¼ lim
c!0
hr � 1
c(11)
where, the relative viscosity,hr¼ h/h0, is the ratio ofsolution (h) to solvent (h0) viscosity.
Alternatively, [h]K can be obtained by the linearextrapolation to zero concentration of the inherentviscosity, hinh¼ (ln hr)/c, using the Kraemer equa-tion:46
½h�K ¼ limc!0
ln hr
c¼ ½h� þ kk½h�2c (12)
where, kk is the Kraemer coefficient. The kK may havea negative value, but it should be noted that someauthors insert a negative sign in the right hand side of
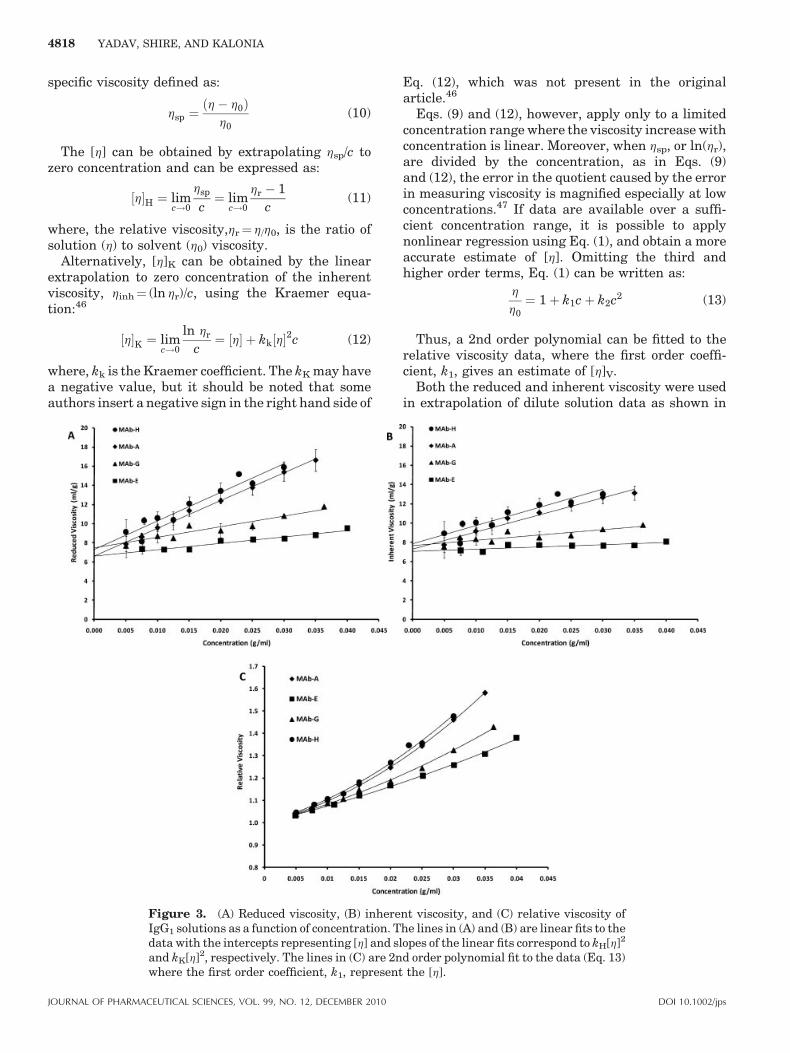
Figure 3. (A) Reduced viscosity, (B) inhereIgG1 solutions as a function of concentration. Tdata with the intercepts representing [h] and sland kK[h]2, respectively. The lines in (C) are 2nwhere the first order coefficient, k1, represent
JOURNAL OF PHARMACEUTICAL SCIENCES, VOL. 99, NO. 12, DECEMBER 2010
Eq. (12), which was not present in the originalarticle.46
Eqs. (9) and (12), however, apply only to a limitedconcentration range where the viscosity increase withconcentration is linear. Moreover, when hsp, or ln(hr),are divided by the concentration, as in Eqs. (9)and (12), the error in the quotient caused by the errorin measuring viscosity is magnified especially at lowconcentrations.47 If data are available over a suffi-cient concentration range, it is possible to applynonlinear regression using Eq. (1), and obtain a moreaccurate estimate of [h]. Omitting the third andhigher order terms, Eq. (1) can be written as:
h
h0
¼ 1 þ k1c þ k2c2 (13)
Thus, a 2nd order polynomial can be fitted to therelative viscosity data, where the first order coeffi-cient, k1, gives an estimate of [h]V.
Both the reduced and inherent viscosity were usedin extrapolation of dilute solution data as shown in
nt viscosity, and (C) relative viscosity ofhe lines in (A) and (B) are linear fits to theopes of the linear fits correspond to kH[h]2
d order polynomial fit to the data (Eq. 13)the [h].
DOI 10.1002/jps
Table 1. Parameters Calculated from Intrinsic Viscosity Analysis of IgG1 Molecules in Solution pH 6.0, 15 mM IonicStrength at 25� 0.18C
Sample [h]Ha (mL/g) [h]K
a (mL/g) [h]Vb (mL/g) [h]avg
c (mL/g) kHd (95% CI) kK
d (95% CI)
MAb-A 6.6�0.4 7.3� 0.5 6.8�0.1 6.9� 0.4 6.6 (6.2;7.1) 3.3 (2.9;3.7)MAb-E 6.6�0.2 7.1� 0.2 6.8�0.2 6.8� 0.3 1.5 (1.3;1.8) 0.5 (0.3;0.6)MAb-G 7.4�0.8 7.7� 0.7 7.1�0.5 7.4� 0.6 1.9 (1.1;2.9) 0.9 (0.3;1.6)MAb-H 7.3�0.7 7.8� 0.7 7.7�0.6 7.6� 0.7 5.6 (4.1;7.1) 3.0 (2.2;4.0)
aFrom the intercept of plots in Figure 3A and B, respectively.bFrom the coefficient of the first order term of the 2nd order polynomial fit in Figure 3C.c[h] calculated after averaging [h]H, [h]k, and [h]v.dFrom the slope of plots in Figure 3A and B, respectively. The value in parenthesis represents 95% confidence intervals.
FACTORS AFFECTING THE VISCOSITY PROFILES OF DIFFERENT MABS 4819
Figure 3A and B, respectively. Figure 3C shows a plotwhere a 2nd order polynomial is fitted to the relativeviscosity data and [h]V was determined from thecoefficient of first order term. The parameterscalculated from all these intrinsic viscosity dataanalyses are shown in Table 1.
The variation in [h] obtained from Huggins andKraemer’s expression points towards the magnifica-tion of errors associated in measurements, especiallyin dilute solution conditions. It was also observedduring measurements that if the viscometer waswashed only with distilled water and not with hotsulfuric acid dichromate solution, the flow time for thesame solution concentration increased by 2–5 s insubsequent runs. The increased flow time pointstowards the possibility of adsorption of the MAbmolecules to the glass capillary surface. Although, atthis point we did not analyze for the presence orabsence of adsorption of MAb molecules to the glasssurface, a decrease in flow time was indeed observedafter washing with hot sulfuric acid dichromatesolution. An error of 1 s in flow time, either subjectiveor due to adsorption, will be reflected as a 10% errorin the calculated reduced viscosity or inherentviscosity values at low concentration.47 This resultsin relatively higher errors during extrapolation ofdata which explains the discrepancy observed in [h]values from Huggins and Kraemer’s expression. Incomparison, the use of virial expansion to estimate [h]showed much less scatter in the data and a good fit.
The [h] values obtained from three differentexpressions have, therefore, been averaged to obtainintrinsic viscosity values. The observed [h] value,within errors, are in close agreement with publishedresults.48–50 Although MAb-G and -H show relativelyhigher intrinsic viscosities in comparison to MAb-Aand -E, considering the error associated at lowconcentrations it would be hard to convincingly statethat the difference is real. Furthermore, MAb-Gshows a higher [h] than MAb-A, but the viscosity ofMAb-A is significantly higher in comparison to MAb-G solutions at pH 6.0. Hence, the differences observedin high concentration viscosity behavior cannot beattributed to the molecular size (or [h]) of themolecules under study.
DOI 10.1002/jps JOU
The Huggins and Kraemer coefficients are non-dimensional and are adequate to evaluate the qualityof the solvent. Huggins coefficient (kH) is accepted as aparameter related to polymer–solvent interactions.51
A lower kH, 0.25–0.5, corresponds to a good solventwhereas poor and theta solvents show higher kH
values of 0.5–1.0 and above. Similarly, a negativevalue of kk indicates a good solvent and a positivevalue indicates poor solvation.52–54
For flexible polymer molecules, the kH values rangefrom 0.2 to 0.8,55 often close to 0.35 in good solvents.56
Whereas for uncharged spheres, theoretical estima-tion,57 as well as experimental results58 give a kH ofabout 2. Hall et al. obtained a value of kH¼ 1.64 forIgG that was not self-associating in 15 mM sodiumphosphate buffer with 150 mM sodium chloride at pH7.4. Whereas, IgG-MIT, in the same solution condi-tions, showed significant self-association and the kH
value ranged from 2.06 at low concentration to 12.0 at70 mg/mL.48 The IgG-MIT, human IgG1 isolated fromthe serum of a patient with hyperviscosity syndrome,has been demonstrated to undergo indefinite self-association under physiologic conditions.59 Although,the kH is concentration independent for a linearvariation in reduced viscosity (hred) with concentra-tion, but for a self-associating systems the hred versusc profile becomes nonlinear at higher concentrationsresulting in a change in slope as well as the kH withincreasing concentration. Hall and Abraham48 didnot restrict their calculation to the linear range butcalculated the kH from the slopes obtained fromdifferent sets of data points in the nonlinear hred
versus c range thereby reporting different kH value athigher concentrations. The kH obtained for MAb-Aand -H were 6.25 and 5.54, respectively. Consideringthe magnitude of kH observed for different IgG1
molecules MAb-A and -H showed poor solvation or theself-associating behavior compared with MAb-G and -E. In addition the positive kk values also indicated apoor solvation of all IgG1 molecules at solution pH 6.0,suggesting that PPI is favored over protein–solventinteraction.
The intrinsic viscosity analysis in addition tosuggesting similar sizes also indicates a differencein the nature of the intermolecular interaction among
RNAL OF PHARMACEUTICAL SCIENCES, VOL. 99, NO. 12, DECEMBER 2010
4820 YADAV, SHIRE, AND KALONIA
IgG1 molecules. This will indeed affect the viscositybehavior of these molecules. Therefore, the nature ofexisting intermolecular interactions was explored indilute and high concentration IgG1 solutions.
Light Scattering Studies: Correlation of Viscositywith Nature of Intermolecular Interactions inDilute Solutions
To understand the nature of these intermolecularinteractions in dilute solutions, the interactionparameter (kD) was obtained using the DLS techni-que.3
DLS measures the collective or mutual diffusioncoefficient, Dm. Figure 4 shows the observed Dm ofIgG1 solutions over a concentration range of 3–12 mg/mL. The solid symbols represent measurements at15 mM and open symbols represent measurements at150 mM ionic strength. The lines in the figurerepresent linear fits to the data using the followingequation:60,61
Dm ¼ Dsð1 þ kDcÞ (14)
where, Ds, is the self-diffusion coefficient (the value ofDm at c¼ 0), kD is the interaction parameter, and c isthe concentration of the protein (g/mL). FromEq. (14), it is evident that Dm is a concentrationdependent parameter whereas Ds is independent ofconcentration and represents the self-diffusion coeffi-cient of the macromolecule. The value of Ds and kD
can be obtained, respectively, from the intercept andslope of a plot of Dm versus c (Eq. 14). A positive kD
Figure 4. Mutual diffusion coefficient (Dm)bols) and 150 mM (open symbols) solutionadjusted to 150 mM with addition of NaCl. Tand intercept representing DskD and Ds (self-
JOURNAL OF PHARMACEUTICAL SCIENCES, VOL. 99, NO. 12, DECEMBER 2010
would result in an increase in Dm over Ds withincreasing concentration whereas a negative kD
would imply decreasing Dm as the solution concen-tration increases. Thus, a positive kD signifiesrepulsive interactions and a negative kD impliesattractive intermolecular interactions. DLS measure-ments at 15 mM ionic strength show that intermole-cular interactions in solutions of MAb-E and -G arerepulsive in nature with a positive kD of 16.03� 0.74and 11.77� 0.6 mL/g, respectively. MAb-A and -Hshow an attractive PPI with MAb-A exhibiting a morenegative kD of �18.54� 0.53 mL/g versus �14.47�0.2 mL/g for MAb-H.
The effect of salt addition (NaCl) on kD valuesfurther substantiated that the intermolecular inter-actions are electrostatic in nature. For MAb-A the kD
value changes from �18.54 mL/g at 15 mM to�12.32 mL/g at 150 mM, which implies a decreasein attractive interactions. All other molecules, that is,MAb-G, -H, and -E showed a decrease in repulsions oran increase in intermolecular attractions on additionof salt. MAb-E showed a transition from repulsive toattractive interactions with a slightly negative kD
value of �3.74 mL/g. MAb-G solutions, however,showed a large change in kD, from 11.77 mL/g at15 mM, to �21.43 mL/g at 150 mM ionic strength,suggesting strong attractive interactions coming intoplay. MAb-G carries a high surface charge densityat pH 6.0, as evident from a high j value. Theneutralization of this surface charge, on increasingsolution ionic strength, results in loss of strong
for IgG1 molecules at 15 mM (solid sym-ionic strength. The ionic strength washe lines are linear best fits with slope
diffusion coefficient), respectively.
DOI 10.1002/jps
FACTORS AFFECTING THE VISCOSITY PROFILES OF DIFFERENT MABS 4821
repulsive interactions, thereby favoring attractionbetween molecules. Interestingly, for MAb-H mole-cules, the addition of NaCl resulted in a highernegative kD of �30.81 mL/g as compared to�14.47 mL/g at 15 mM. Again, this increase inintermolecular attractions was counter intuitivewith a general notion of a decrease in electrostaticinteractions with an increase in ionic strength. Theincrease in negative magnitude of kD implies that theintermolecular attractive interactions became moreattractive with addition of NaCl. The parametersderived from DLS experiments have been compiled inTable 2.
Interaction Parameter (kD): Theoretical Considerations
The parameter kD from Eq. (14) describes interpar-ticle interactions and can be represented as:61,62
kD ¼ 2MB22 � kf � 2n2 (15)
where M is the molecular weight, B22 is the secondvirial coefficient, n2 is the partial specific volume andkf is the first-order concentration coefficient (z0z1> 0)in the virial expansion of the frictional coefficient(z¼ z0 (1þ z1cþ . . .)).61 Therefore, within the ‘‘Hydro-dynamic regime,’’ the kD value, is affected both by athermodynamic contribution (kT) from B22 and thehydrodynamic contribution/drag (kH) from kfþ 2v2.The kD can therefore be represented as:63,64
kD ¼ kT � kH (16)
The relation between the second virial coefficient,B22, and the molecular interactions can be repre-sented as:65
B022 ¼ �2p
Z10
ðe�W=KT � 1Þr212dr12 (17)
where, B022 ¼ B22M2
w, W is the interaction free energy,usually termed as the potential of mean force, and r12
is the intermolecular center–center distance. The
Table 2. Parameters Calculated from DLSMeasurements with IgG1 Molecules at 25� 0.18C
Sample Ds 10�7 (cm2/s)a dH (nm)b kD (mL/g)c
Solution pH 6.0, 15 Mm ionic strengthMAb-A 4.40� 0.01 11.14� 0.04 �18.54� 0.53MAb-E 4.51� 0.03 10.89� 0.09 16.03� 0.74MAb-G 4.46� 0.02 11.00� 0.08 11.77� 0.60MAb-H 4.45� 0.02 11.02� 0.07 �14.47� 0.20
Solution pH 6.0, 150 mM ionic strengthMAb-A 4.48� 0.03 10.96� 0.11 �12.32� 0.48MAb-E 4.53� 0.01 10.83� 0.02 �3.74� 0.27MAb-G 4.37� 0.02 11.22� 0.06 �21.43� 0.19MAb-H 4.39� 0.01 11.16� 0.01 �30.81� 0.21
aFrom the intercept of plots in Figure 4.bTrue hydrodynamic diameter calculated at c! 0.cSlope (plots in Fig. 4)/Ds.
DOI 10.1002/jps JOU
contribution of B22 to kD arises from the role ofchemical potential in driving the diffusion process.The B22 comprises of both an excluded volume term(the region of overlap, i.e., r12< 2a, where W!1),which is always positive, and the interaction freeenergy of particles (r12� 2a), which could be repulsive(positive B22) or attractive (negative B22). Even whenthere are no electrostatic repulsions, the B22 valueswould still be slightly positive with contribution fromthe excluded volume effect. On the contrary with DLSmeasurements, systems with strong intermolecularrepulsions (large B22), 2MB22> (kfþ 2v2) will result ina positive kD, whereas in case of theta solventconditions (no intermolecular interactions),16 thefirst order concentration coefficient is negativebecause B22¼ 0 and therefore kD¼�(kfþ 2v2)< 0.61
These hydrodynamic interactions are a result ofmovement of one particle affecting the diffusion of theother through the flow of solvent, and contribute tothe diffusivity of molecules in the ‘‘hydrodynamicregime.’’63,66 The DLS measurements in the presentwork are in this hydrodynamic regime, which existswhen the measurement time in DLS (tD) are longcompared to the average collision time (tC), and thesolution conditions fall in the long wavelength limitsuch that d� q�1, where d is the mean interparticlespacing and q is the scattering vector. The scatteringvector is related to the wavelength of incident light, l,and the angle of observation,u as:67
q ¼ 4pn
lSin
u
2
� �(18)
For DLS measurements the tc varies from1 10�5 s (at 3 mg/mL) to 3 10�6 s (at 12 mg/mL), calculated using equation:23
tc ¼ ð4pDsdHrnÞ�1 (19)
The tD calculated from the decay of the correlationfunction was4 10�5 s and is therefore long relativeto the mean collision time (tc). The interparticlespacing at the highest concentration used (12 mg/mL), calculated as the inverse cube root of proteinnumber density (r
�1=3n ) was 27 nm whereas q�1 was
39 nm for the experiments performed. Thus, inaddition to the thermodynamic interactions, the DLSmeasurement is also affected by the hydrodynamicinteractions.
However, the contribution of these hydrodynamicinteraction and direct attractive interactions, affect-ing molecular diffusivity to result in a negative kD,can be analyzed separately. Anderson and Reed68
assumed that the direct interaction (kT) and hydro-dynamic forces of diffusing particles are uncorrelatedand derived the following expression for linear
RNAL OF PHARMACEUTICAL SCIENCES, VOL. 99, NO. 12, DECEMBER 2010
4822 YADAV, SHIRE, AND KALONIA
coefficient kD:
kD ¼ 8VhðI � LÞ (20)
where Vh is the hydrodynamic volume, L representsthe hydrodynamic solvent forces, and I accounts forthe long range interaction forces. For the noninter-acting case (I¼ 0) Anderson and Reed68 calculatedL¼ 0.229. The hydrodynamic volume is given by:
Vh ¼ 4
3pR3
� �NA
M(21)
Using, dH, calculated from the average Ds, andmolecular weight from the SLS measurements, theVh for the IgG1 monomer was calculated to be 2.9 cm3/g. Thus, for the noninteracting case (I¼ 0), thekD ¼ �8vhðLÞ¼ � 5:34mL=g. Hence, a kD value ofless negative magnitude than the theoreticallypossible value (�5.34 mL/g) suggests contributionsfrom long range repulsion between moleculeswhereas a higher negative magnitude of kD impliescontribution from attractive intermolecular interac-tion to the diffusivity of molecules. All the negative kD
values, except MAb-E, 150 mM ionic strength(�3.25 mL/g), are more negative in magnitude thanthe theoretically possible value (�5.34 mL/g), indicat-ing the presence of attractive intermolecular inter-actions between molecules in addition to thehydrodynamic interaction (kH). The kD value forMAb-E indicates some effect of long range repulsionseven at 150 mM ionic strength.
Figure 5. Solution complex viscosity (h�) asured using ultrasonic shear rheometer at 10 Mmade at pH 6.0, 15 mM ionic strength in tripsmaller than the symbols used.
JOURNAL OF PHARMACEUTICAL SCIENCES, VOL. 99, NO. 12, DECEMBER 2010
The presence of attractive interactions betweenMAb-A and -H will result in self-association or anincrease in aggregation behavior of these molecules,thereby resulting in higher viscosity. The lightscattering data, however, does not completely explainthe high concentration viscosity behavior. Althoughthe attractive interactions between molecules ofMAb-A are higher (kD¼�18.54 mL/g) as comparedto MAb-H (kD¼�14.47 mL/g), the MAb-H solutionsshowed higher viscosity in comparison to MAb-Asolution. To address this discrepancy between obser-vations at low concentration versus high concentra-tion, rheology studies were performed to elucidate thenature of intermolecular interactions present at highconcentrations.
Ultrasonic Rheology Studies
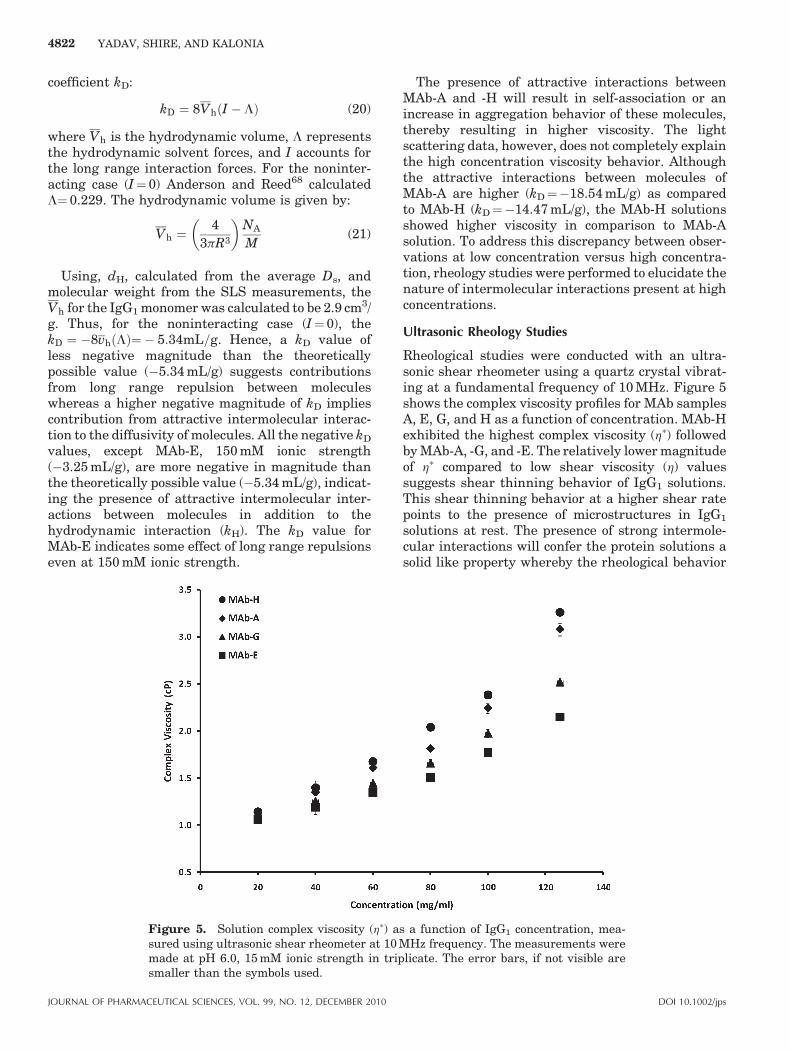
Rheological studies were conducted with an ultra-sonic shear rheometer using a quartz crystal vibrat-ing at a fundamental frequency of 10 MHz. Figure 5shows the complex viscosity profiles for MAb samplesA, E, G, and H as a function of concentration. MAb-Hexhibited the highest complex viscosity (h�) followedby MAb-A, -G, and -E. The relatively lower magnitudeof h� compared to low shear viscosity (h) valuessuggests shear thinning behavior of IgG1 solutions.This shear thinning behavior at a higher shear ratepoints to the presence of microstructures in IgG1
solutions at rest. The presence of strong intermole-cular interactions will confer the protein solutions asolid like property whereby the rheological behavior
s a function of IgG1 concentration, mea-Hz frequency. The measurements were
licate. The error bars, if not visible are
DOI 10.1002/jps
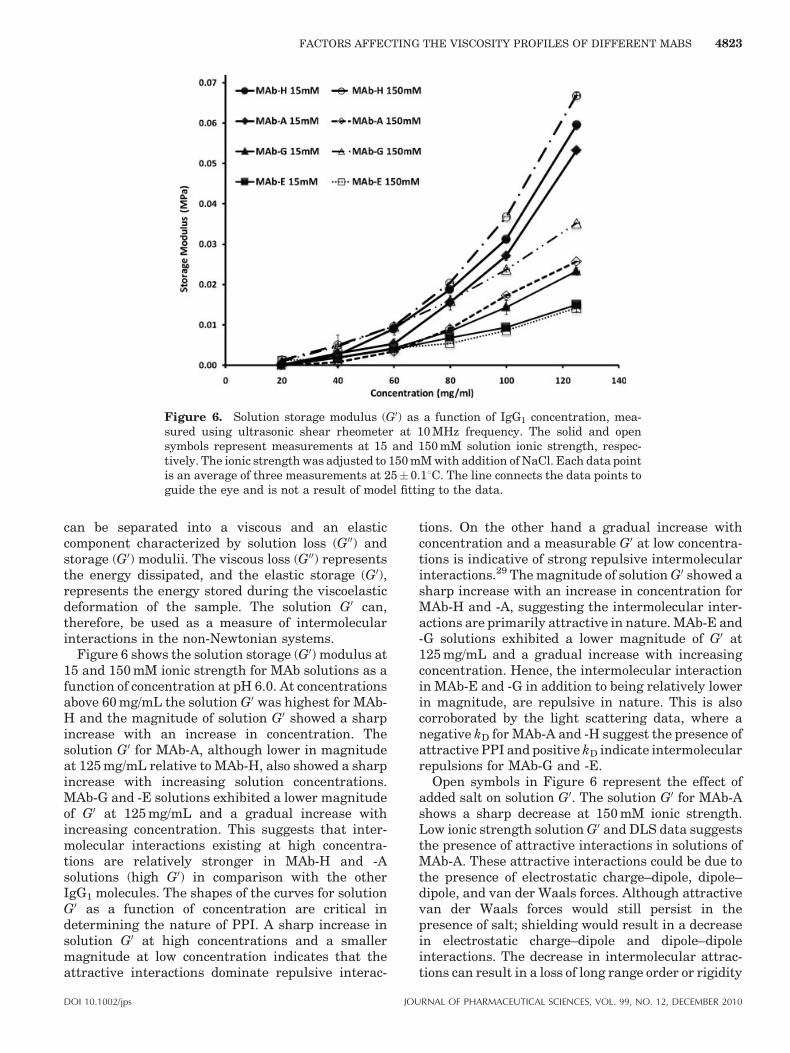
Figure 6. Solution storage modulus (G0) as a function of IgG1 concentration, mea-sured using ultrasonic shear rheometer at 10 MHz frequency. The solid and opensymbols represent measurements at 15 and 150 mM solution ionic strength, respec-tively. The ionic strength was adjusted to 150 mM with addition of NaCl. Each data pointis an average of three measurements at 25� 0.18C. The line connects the data points toguide the eye and is not a result of model fitting to the data.
FACTORS AFFECTING THE VISCOSITY PROFILES OF DIFFERENT MABS 4823
can be separated into a viscous and an elasticcomponent characterized by solution loss (G00) andstorage (G0) modulii. The viscous loss (G00) representsthe energy dissipated, and the elastic storage (G0),represents the energy stored during the viscoelasticdeformation of the sample. The solution G0 can,therefore, be used as a measure of intermolecularinteractions in the non-Newtonian systems.
Figure 6 shows the solution storage (G0) modulus at15 and 150 mM ionic strength for MAb solutions as afunction of concentration at pH 6.0. At concentrationsabove 60 mg/mL the solution G0 was highest for MAb-H and the magnitude of solution G0 showed a sharpincrease with an increase in concentration. Thesolution G0 for MAb-A, although lower in magnitudeat 125 mg/mL relative to MAb-H, also showed a sharpincrease with increasing solution concentrations.MAb-G and -E solutions exhibited a lower magnitudeof G0 at 125 mg/mL and a gradual increase withincreasing concentration. This suggests that inter-molecular interactions existing at high concentra-tions are relatively stronger in MAb-H and -Asolutions (high G0) in comparison with the otherIgG1 molecules. The shapes of the curves for solutionG0 as a function of concentration are critical indetermining the nature of PPI. A sharp increase insolution G0 at high concentrations and a smallermagnitude at low concentration indicates that theattractive interactions dominate repulsive interac-
DOI 10.1002/jps JOU
tions. On the other hand a gradual increase withconcentration and a measurable G0 at low concentra-tions is indicative of strong repulsive intermolecularinteractions.29 The magnitude of solution G0 showed asharp increase with an increase in concentration forMAb-H and -A, suggesting the intermolecular inter-actions are primarily attractive in nature. MAb-E and-G solutions exhibited a lower magnitude of G0 at125 mg/mL and a gradual increase with increasingconcentration. Hence, the intermolecular interactionin MAb-E and -G in addition to being relatively lowerin magnitude, are repulsive in nature. This is alsocorroborated by the light scattering data, where anegative kD for MAb-A and -H suggest the presence ofattractive PPI and positive kD indicate intermolecularrepulsions for MAb-G and -E.
Open symbols in Figure 6 represent the effect ofadded salt on solution G0. The solution G0 for MAb-Ashows a sharp decrease at 150 mM ionic strength.Low ionic strength solution G0 and DLS data suggeststhe presence of attractive interactions in solutions ofMAb-A. These attractive interactions could be due tothe presence of electrostatic charge–dipole, dipole–dipole, and van der Waals forces. Although attractivevan der Waals forces would still persist in thepresence of salt; shielding would result in a decreasein electrostatic charge–dipole and dipole–dipoleinteractions. The decrease in intermolecular attrac-tions can result in a loss of long range order or rigidity
RNAL OF PHARMACEUTICAL SCIENCES, VOL. 99, NO. 12, DECEMBER 2010
4824 YADAV, SHIRE, AND KALONIA
of the solution and, therefore, a decrease in solutionG0. MAb-G and -H show a net increase in solution G0
at 150 mM. The low ionic strength G0 and kD datasuggests the presence of repulsive interaction forMAb-G. The addition of salt results in a decreasein intermolecular repulsions so that the overallinteraction is dominated by attractive interactionsbetween molecules resulting in an increase insolution G0. Moreover, MAb-G solutions at highconcentrations became turbid with an increase insolution ionic strength. A possible reason for theobserved turbidity could be the formation of rever-sible self-associates or loose aggregates due tochanging of overall interactions to attractive uponaddition of salt. MAb-H solutions showed an increasein intermolecular attraction and, therefore, anincrease in solution G0 with the addition of salt.The increase in intermolecular attractions was alsoobserved in DLS measurements as an increase inmagnitude of negative kD on adjusting solution ionicstrength to 150 mM with NaCl. MAb-E does not showany change in solution G0 upon adding salt. Thisindicates that the intermolecular interactions exist-ing in MAb-E solutions are minimal.
Mathematical Models for Viscosity Behavior in HighConcentration Solutions: Correlation with MolecularSize, Shape, and Nature of Intermolecular Interactions
The viscosity behavior of concentrated noninteractingspherical particles, where the primary contribution tosolution viscosity is from the excluded volume, can berepresented by Mooney’s semi-empirical equation:69
h ¼ h0 exp2:5fð Þ
1 � kf
� �(22)
where h and h0 are the solution and solventviscosities, respectively, k denotes the self-crowdingfactor, and f is the volume fraction of suspendedparticles. The volume fraction (f) of a proteinmolecule in solution is affected by the degree ofhydration and solution pH. Therefore, it becomesdifficult to estimate the volume fraction of a protein insolution from its partial specific volume. Ross andMinton70 modified Mooney’s equation to include othershapes of particles by expressing f in terms of soluteconcentration, by assuming nf¼ [h]c, to obtain thefollowing equation:
h ¼ h0 exp½h�c
1 � kv ½h�c
" #(23)
where [h] is the intrinsic viscosity in mL/g and n is theSimha shape parameter.50 Both, Eqs. (22) and (23),take into account only the first order interactionparameter, that is, crowding effect (k) with anincrease in solute concentration. Eq. (23) can befitted to the concentration dependent viscosity data in
JOURNAL OF PHARMACEUTICAL SCIENCES, VOL. 99, NO. 12, DECEMBER 2010
order to estimate the effect of self-crowding, that is, k/v, if the [h] is known beforehand.
Eq. (23) can be further modified by expressingsolution viscosity (h) as relative viscosity (h/h0) asfollows:
hr ¼ exp½h�c
1 � kv ½h�c
!(24)
Taking the natural log on both sides of Eq. (24)yields the following equation:
lnðhrÞ ¼½h�c
1 � kv ½h�c
� (25)
This can be further simplified as:
lnðhrÞ �k
n½h�cflnðhrÞg ¼ ½h�c (26)
After dividing both sides of Eq. (26) by theconcentration c, the following equation is obtained:
hinhr ¼lnðhrÞ
c¼ k
n½h� lnðhrÞ þ ½h� (27)
This equation offers several advantages overprevious equations. First, a plot of hinhr versus ln(hr)provides a linear relationship with an intercept equalto [h] and slope equal to [h]k/v. A visual inspectionwould readily indicate any deviation from linearity,which implies that other mechanisms besides theexcluded volume effect (hard sphere model) arecontributing to the solution viscosity. The value ofthe slope divided by the intercept provides theeffective crowding factor k/v. Second, the equationapplies to all concentrations and is not restricted tolow concentrations only. Therefore, errors associatedwith the calculations of inherent viscosity and specificviscosity at low concentrations can be minimized byusing the whole range of concentrations.
Minton has argued that the potential of mean forcein concentrated solutions is dominated by the ‘‘hard’’or steric–repulsive interactions. In this approxima-tion, the influence of residual soft interactions isreflected in the apparent size of the effective hardparticle taken to represent a protein molecule relativeto the actual size of the molecule (e.g., an effectiveparticle significantly larger than the molecule itrepresents, indicates the presence of nonnegligiblesoft repulsive contribution to the overall PPI).71
Therefore, electrostatic repulsions would add to thesize of the hard sphere, and thus increase theexcluded volume effect.
Figure 7 shows the plots of ln(hr)/c versus ln(hr)calculated from the combined viscosity data inFigures 1 and 3 for MAb-A, -E, -G, and -H, and datafor spherical particles. The hard sphere contributionhas been calculated from the experimental viscosity
DOI 10.1002/jps
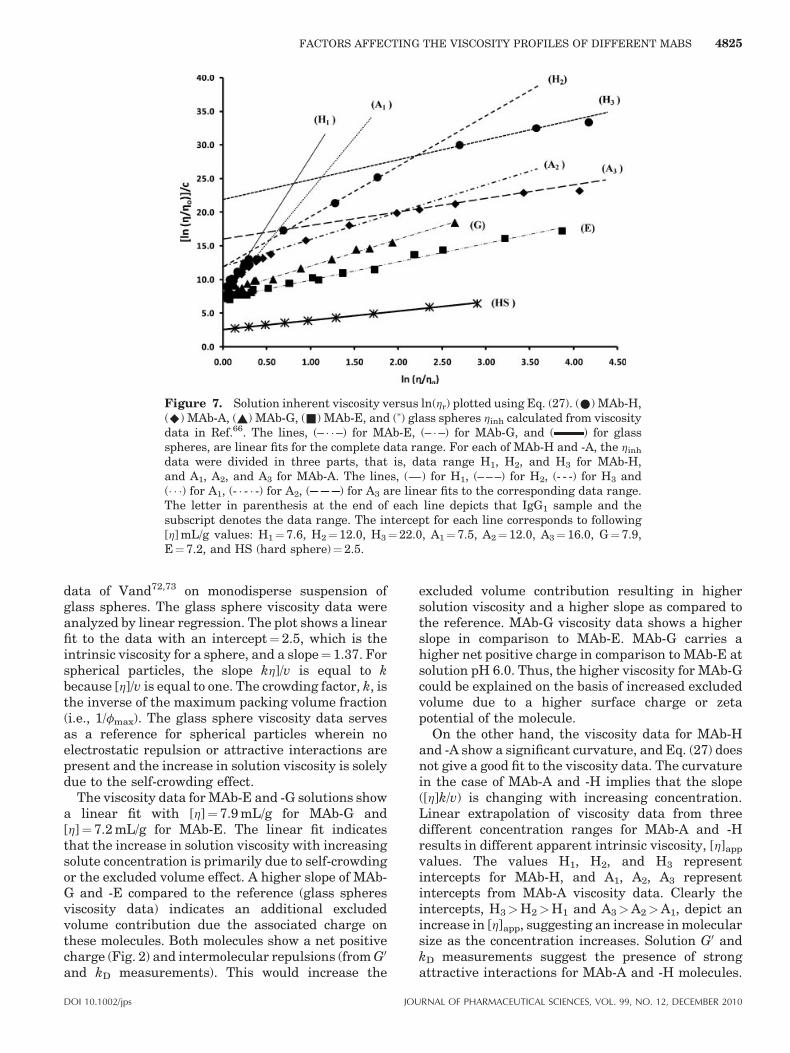
Figure 7. Solution inherent viscosity versus ln(hr) plotted using Eq. (27). (*) MAb-H,(^) MAb-A, (~) MAb-G, (&) MAb-E, and (�) glass spheres hinh calculated from viscositydata in Ref.66. The lines, (– � � –) for MAb-E, (– � –) for MAb-G, and ( ) for glassspheres, are linear fits for the complete data range. For each of MAb-H and -A, the hinh
data were divided in three parts, that is, data range H1, H2, and H3 for MAb-H,and A1, A2, and A3 for MAb-A. The lines, (—) for H1, (– – –) for H2, (- - -) for H3 and(� � �) for A1, (- � - � -) for A2, ( ) for A3 are linear fits to the corresponding data range.The letter in parenthesis at the end of each line depicts that IgG1 sample and thesubscript denotes the data range. The intercept for each line corresponds to following[h] mL/g values: H1¼ 7.6, H2¼ 12.0, H3¼ 22.0, A1¼ 7.5, A2¼ 12.0, A3¼ 16.0, G¼ 7.9,E¼ 7.2, and HS (hard sphere)¼ 2.5.
FACTORS AFFECTING THE VISCOSITY PROFILES OF DIFFERENT MABS 4825
data of Vand72,73 on monodisperse suspension ofglass spheres. The glass sphere viscosity data wereanalyzed by linear regression. The plot shows a linearfit to the data with an intercept¼ 2.5, which is theintrinsic viscosity for a sphere, and a slope¼ 1.37. Forspherical particles, the slope kh]/v is equal to kbecause [h]/v is equal to one. The crowding factor, k, isthe inverse of the maximum packing volume fraction(i.e., 1/fmax). The glass sphere viscosity data servesas a reference for spherical particles wherein noelectrostatic repulsion or attractive interactions arepresent and the increase in solution viscosity is solelydue to the self-crowding effect.
The viscosity data for MAb-E and -G solutions showa linear fit with [h]¼ 7.9 mL/g for MAb-G and[h]¼ 7.2 mL/g for MAb-E. The linear fit indicatesthat the increase in solution viscosity with increasingsolute concentration is primarily due to self-crowdingor the excluded volume effect. A higher slope of MAb-G and -E compared to the reference (glass spheresviscosity data) indicates an additional excludedvolume contribution due the associated charge onthese molecules. Both molecules show a net positivecharge (Fig. 2) and intermolecular repulsions (from G0
and kD measurements). This would increase the
DOI 10.1002/jps JOU
excluded volume contribution resulting in highersolution viscosity and a higher slope as compared tothe reference. MAb-G viscosity data shows a higherslope in comparison to MAb-E. MAb-G carries ahigher net positive charge in comparison to MAb-E atsolution pH 6.0. Thus, the higher viscosity for MAb-Gcould be explained on the basis of increased excludedvolume due to a higher surface charge or zetapotential of the molecule.
On the other hand, the viscosity data for MAb-Hand -A show a significant curvature, and Eq. (27) doesnot give a good fit to the viscosity data. The curvaturein the case of MAb-A and -H implies that the slope([h]k/v) is changing with increasing concentration.Linear extrapolation of viscosity data from threedifferent concentration ranges for MAb-A and -Hresults in different apparent intrinsic viscosity, [h]app
values. The values H1, H2, and H3 representintercepts for MAb-H, and A1, A2, A3 representintercepts from MAb-A viscosity data. Clearly theintercepts, H3>H2>H1 and A3>A2>A1, depict anincrease in [h]app, suggesting an increase in molecularsize as the concentration increases. Solution G0 andkD measurements suggest the presence of strongattractive interactions for MAb-A and -H molecules.
RNAL OF PHARMACEUTICAL SCIENCES, VOL. 99, NO. 12, DECEMBER 2010
4826 YADAV, SHIRE, AND KALONIA
These attractive interactions would result in atransient network of molecules in solution restrictingthe molecular motion such that on the time scale ofmeasurement these would appear to be higher orderstructures. A curvature in viscosity data plotted usingEq. (27) clearly corroborates this behavior.
The [h] values obtained from the intercepts inFigure 7 for different IgG1 molecules are MAb-G¼ 7.9 mL/g, MAb-E¼ 7.2 mL/g, MAb-H (H1)¼7.6 mL/g, and MAb-A (A1)¼ 7.5 mL/g. These [h] valuesshow a relatively higher magnitude when comparedwith the [h] obtained in Figure 3A–C, respectively. Asdiscussed above (intrinsic viscosity analysis fromFig. 3A and B) and in previous literature,47,74 thedivision by concentration term in Eqs. (9), (12), and(27) results in magnification of the error in quotientcaused by the error in measuring viscosity, especiallyat low concentration. Using Huggins or Kremer’sanalysis, McMillan et al. reported an error of 4% inestimating h] due to a 0.2% error in measuring solventor solution flow time. Moreover, all these methods arebased on estimating [h] by linear extrapolation, wherethe choice of data range is quite limited. The presenceof intermolecular interactions, especially attractiveinteractions, will result in a curvature and theapproximation to linearity becomes difficult asevident from the data for MAb-H and -A (Fig. 7).The errors in estimating [h], on linear extrapolation tointercepts are thus inherent with these techniques.
Furthermore, a downward curvature in the visc-osity data for MAb-A and -H implies a decrease in theslope as concentration increases. The self-associationwill affect each of the parameters determining slope,that is, [h], k, v in the following manner. An increasein molecular size would result in an increase in [h],and therefore, does not explain the decreasing trendof the slope. A decrease in the slope would imply thateither the self-crowding (k) is decreasing, or the shapeparameter (v) is increasing so as to result in adecrease in the effective k/v ratio. Previous studieshave also shown that MAb-A undergoes self-associa-tion at higher concentrations, wherein moleculescome together in the Fab regions to form self-
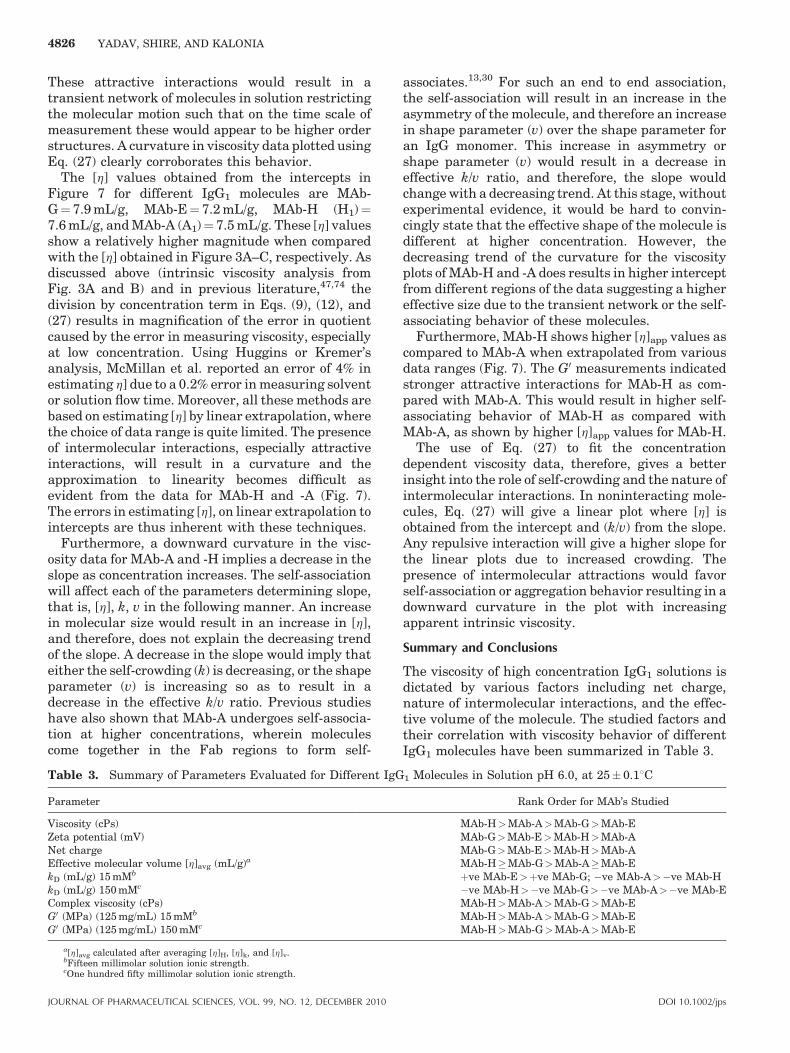
Table 3. Summary of Parameters Evaluated for Different IgG
Parameter
Viscosity (cPs)Zeta potential (mV)Net chargeEffective molecular volume [h]avg (mL/g)a
kD (mL/g) 15 mMb
kD (mL/g) 150 mMc
Complex viscosity (cPs)G0 (MPa) (125 mg/mL) 15 mMb
G0 (MPa) (125 mg/mL) 150 mMc
a[h]avg calculated after averaging [h]H, [h]k, and [h]v.bFifteen millimolar solution ionic strength.cOne hundred fifty millimolar solution ionic strength.
JOURNAL OF PHARMACEUTICAL SCIENCES, VOL. 99, NO. 12, DECEMBER 2010
associates.13,30 For such an end to end association,the self-association will result in an increase in theasymmetry of the molecule, and therefore an increasein shape parameter (v) over the shape parameter foran IgG monomer. This increase in asymmetry orshape parameter (v) would result in a decrease ineffective k/v ratio, and therefore, the slope wouldchange with a decreasing trend. At this stage, withoutexperimental evidence, it would be hard to convin-cingly state that the effective shape of the molecule isdifferent at higher concentration. However, thedecreasing trend of the curvature for the viscosityplots of MAb-H and -A does results in higher interceptfrom different regions of the data suggesting a highereffective size due to the transient network or the self-associating behavior of these molecules.
Furthermore, MAb-H shows higher [h]app values ascompared to MAb-A when extrapolated from variousdata ranges (Fig. 7). The G0 measurements indicatedstronger attractive interactions for MAb-H as com-pared with MAb-A. This would result in higher self-associating behavior of MAb-H as compared withMAb-A, as shown by higher [h]app values for MAb-H.
The use of Eq. (27) to fit the concentrationdependent viscosity data, therefore, gives a betterinsight into the role of self-crowding and the nature ofintermolecular interactions. In noninteracting mole-cules, Eq. (27) will give a linear plot where [h] isobtained from the intercept and (k/v) from the slope.Any repulsive interaction will give a higher slope forthe linear plots due to increased crowding. Thepresence of intermolecular attractions would favorself-association or aggregation behavior resulting in adownward curvature in the plot with increasingapparent intrinsic viscosity.
Summary and Conclusions
The viscosity of high concentration IgG1 solutions isdictated by various factors including net charge,nature of intermolecular interactions, and the effec-tive volume of the molecule. The studied factors andtheir correlation with viscosity behavior of differentIgG1 molecules have been summarized in Table 3.
1 Molecules in Solution pH 6.0, at 25� 0.18C
Rank Order for MAb’s Studied
MAb-H>MAb-A>MAb-G>MAb-EMAb-G>MAb-E>MAb-H>MAb-AMAb-G>MAb-E>MAb-H>MAb-AMAb-H�MAb-G>MAb-A�MAb-Eþve MAb-E>þve MAb-G; �ve MAb-A>�ve MAb-H�ve MAb-H>�ve MAb-G>�ve MAb-A>�ve MAb-EMAb-H>MAb-A>MAb-G>MAb-EMAb-H>MAb-A>MAb-G>MAb-EMAb-H>MAb-G>MAb-A>MAb-E
DOI 10.1002/jps
FACTORS AFFECTING THE VISCOSITY PROFILES OF DIFFERENT MABS 4827
It is evident that the electroviscous effects andmolecular size do not play a dominant role at highconcentrations; rather it is the nature of intermole-cular interaction which in most part regulates theviscosity behavior of IgG1 solutions. The viscositybehavior seems to be affected more by the short rangeattractive potentials. In general a lower net chargewould induce less repulsions or a ‘‘less hard interac-tion’’ thereby favoring the short range attractiveforces. For instance, for a molecule with lower netcharge (MAb-A�þ 4.3 U), calculations based on theLinderstrom–Lang theory would suggest that at anygiven moment, there will be a significant fraction ofthe molecules having a net negative charge. Thefleeting attraction between these molecules and thosewith a positive charge will lead to an increase in self-associating or a transient network behavior, therebyrestricting molecular motion and consequently anincrease in solution viscosity. However, for a highercharged molecule (e.g., MAb-G�þ 13.8 U) the prob-ability of having such oppositely charged memberswould be relatively low thereby not favoring inter-molecular attractions or self-association. This isreflected as a higher viscosity for MAb-A and -H ascompared with MAb-G or -E.
The net molecular charge would be more informa-tive while assessing the viscosity behavior of anindividual molecule at different solution pH condi-tions. However, caution must be exercised whileusing the net molecular charge as a sole parameter toassess the viscosity behavior of different molecules.Different IgG1 molecules may possess significantlydifferent charge distribution resulting in moleculardipoles and multipoles. The associated intermolecu-lar attractions (dipole–dipole, charge–dipole, andothers) may overcome charge-induced repulsions athigh concentrations. This is evident from MAb-A and-H behavior wherein MAb-H is more viscous ascompared with MAb-A despite being more positivelycharged. In fact, the high concentration viscositybehavior of MAb-A and -H cannot be explained evenon the basis of dilute solution measurements (DLSmeasurements). MAb-A in dilute solutions showedrelatively strong attractions as compared with MAb-H molecules (�ve kD for MAb-A>�ve kD for MAb-H)(Fig. 4). However, at high protein concentrationsMAb-H is more viscous than MAb-A, which is more inline with the interpretation from solution G0 results.This points towards the limitation of dilute solutionmeasurements in predicting high concentrationbehavior. The contribution from charge–dipole anddipole–dipole interaction will be more significant athigh concentration due to a higher order inversedependence on the intermolecular distance. At lowconcentration the intermolecular interaction in MAb-H are governed by the net charge wherein the –ve kD
for MAb-H<�ve kD for MAb-A (Fig. 4). However, at
DOI 10.1002/jps JOU
high concentrations the charge–dipole and dipole–dipole interaction overcomes these repulsions result-ing in a higher viscosity for MAb-H. The modifiedRoss and Minton equation can be effectively used tocharacterize the influence of molecular size, self-crowding, repulsive and attractive intermolecularinteractions on the solution viscosity behavior at highprotein concentrations. The analysis demonstratesthat the presence of strong attractive interactionsresults in an increased propensity of transientnetwork or the self-associating behavior leading toa change in the effective molecular size and conse-quently a higher viscosity in high concentration IgG1
solutions.
ACKNOWLEDGMENTS
The authors acknowledge generous material andfinancial support from Genentech, Inc. Gerald J.Jackson Memorial Foundation at University of Con-necticut in the form of student fellowship is alsogreatly acknowledged.
REFERENCES
1. Brekke OH, Sandlie I. 2003. Therapeutic antibodies for humandiseases at the dawn of the twenty-first century. Nat Rev DrugDiscov 2:52–62.
2. Levene AP, Singh G, Palmieri C. 2005. Therapeutic monoclonalantibodies in oncology. J R Soc Med 98:146–152.
3. Morhet J. 2008. Improving therapeutic antibodies. Drug DelivTechnol 8(1):76–79.
4. Daugherty AL, Mrsny RJ. 2006. Formulation and deliveryissues for monoclonal antibody therapeutics. Adv Drug DelivRev 58:686–706.
5. Harris RJ, Shire SJ, Winter C. 2004. Commercial manufactur-ing scale formulation and analytical characterization of ther-apeutic recombinant antibodies. Drug Dev Res 61:137–154.
6. Shire SJ, Shahrokh Z, Liu J. 2004. Challenges in the develop-ment of high protein concentration formulations. J Pharm Sci93:1390–1402.
7. Cantor CR, Schimmel PR. 1980. Techniques for the study ofbiological structure and function. San Francisco: W.H. Free-man & Company.
8. Dickinson E. 1992. An introduction to food colloids. New York:Oxford University Press.
9. Ross PD, Minton AP. 1977. Analysis of non-ideal behavior inconcentrated hemoglobin solutions. J Mol Biol 112:437–452.
10. Ruppert S, Sandler SI, Lenhoff AM. 2001. Correlation betweenthe osmotic second virial coefficient and the solubility of pro-teins. Biotechnol Progr 17:182–187.
11. Valente JJ, Payne RW, Manning MC, Wilson WW, Henry CS.2005. Colloidal behavior of proteins: Effects of the second virialcoefficient on solubility, crystallization and aggregation ofproteins in aqueous solution. Curr Pharm Biotechnol 6:427–436.
12. Minton AP. 2005. Influence of macromolecular crowding uponthe stability and state of association of proteins: Predictionsand observations. J Pharm Sci 94:1668–1675.
RNAL OF PHARMACEUTICAL SCIENCES, VOL. 99, NO. 12, DECEMBER 2010
4828 YADAV, SHIRE, AND KALONIA
13. Liu J, Nguyen MDH, Andya JD, Shire SJ. 2005. Reversible self-association increases the viscosity of a concentrated monoclo-nal antibody in aqueous solution. J Pharm Sci 94:1928–1940.
14. Saluja A, Badkar AV, Zeng DL, Kalonia DS. 2007. Ultrasonicrheology of a monoclonal antibody (IgG2) solution: Implicationsfor physical stability of proteins in high concentration formula-tions. J Pharm Sci 96:3181–3195.
15. George A, Chiang Y, Guo B, Arabshahi A, Cai Z, Wilson WW.1997. Second virial coefficient as predictor in protein crystalgrowth. Methods Enzymol 276:100–110.
16. George A, Wilson WW. 1994. Predicting protein crystallizationfrom a dilute solution property. Acta Crystallogr D Biol Crys-tallogr D50:361–365.
17. Wilson WW. 2003. Light scattering as a diagnostic for proteincrystal growth-A practical approach. J Struct Biol 142:56–65.
18. Narayanan J, Liu XY. 2003. Protein interactions in under-saturated and supersaturated solutions: A study using lightand x-ray scattering. Biophys J 84:523–532.
19. Li S, Xing D, Li J. 2004. Dynamic light scattering application tostudy protein interactions in electrolyte solutions. J Biol Phys30:313–324.
20. Stacey KA. 1956. Light-scattering in physical chemistry. NewYork: Academic Press.
21. Curtis RA, Prausnitz JM, Blanch HW. 1998. Protein-proteinand protein-salt interactions in aqueous protein solutions con-taining concentrated electrolytes. Biotechnol Bioeng 57:11–21.
22. Demoruelle K, Guo B, Kao S, McDonald HM, Nikic DB, HolmanSC, Wilson WW. 2002. Correlation between the osmotic secondvirial coefficient and solubility for equine serum albumin andovalbumin. Acta Crystallogr D Biol Crystallogr 58:1544–1548.
23. Muschol M, Rosenberger F. 1995. Interactions in undersatu-rated and supersaturated lysozyme solutions: Static anddynamic lightscatteringresults.JChemPhys103:10424–10432.
24. Harn N, Allan C, Oliver C, Middaugh CR. 2007. Highly con-centrated monoclonal antibody solutions: Direct analysis ofphysical structure and thermal stability. J Pharm Sci 96:532–546.
25. Matheus S, Friess W, Mahler H-C. 2006. FTIR and nDSC asanalytical tools for high-concentration protein formulations.Pharm Res 23:1350–1363.
26. Minton AP. 1989. Analytical centrifugation with preparativeultracentrifuges. Anal Biochem 176:209–216.
27. Saluja A, Badkar AV, Zeng DL, Nema S, Kalonia DS. 2006.Application of high-frequency rheology measurements for ana-lyzing protein-protein interactions in high protein concentra-tion solutions using a model monoclonal antibody (IgG2).J Pharm Sci 95:1967–1983.
28. Kroe RR, Laue TM. 2009. NUTS and BOLTS: Applications offluorescence-detected sedimentation. Anal Biochem 390:1–13.
29. Saluja A, Badkar AV, Zeng DL, Nema S, Kalonia DS. 2007.Ultrasonic storage modulus as a novel parameter for analyzingprotein-protein interactions in high protein concentration solu-tions: Correlation with static and dynamic light scatteringmeasurements. Biophys J 92:234–244.
30. Kanai S, Liu J, Patapoff TW, Shire SJ. 2008. Reversible self-association of a concentrated monoclonal antibody solutionmediated by Fab-Fab interaction that impacts solution viscos-ity. J Pharm Sci 97:4219–4227.
31. Yadav S, Liu J, Shire SJ, Kalonia DS. 2009. Specific interac-tions in high concentration antibody solutions resulting in highviscosity. J Pharm Sci 99:1152–1168.
32. Hunter RJ. 1981. The calculation of zeta potential. In: OttewillRH, Rowell RL, editors. Zeta potential in colloid science prin-ciples and applications. New York: Academic Press. pp. 59–124.
33. Delgado AV, Gonzalez-Caballero F, Hunter RJ, Koopal LK,Lyklema J. 2007. Measurement and interpretation of electro-kinetic phenomena. J Colloid Interface Sci 309:194–224.
JOURNAL OF PHARMACEUTICAL SCIENCES, VOL. 99, NO. 12, DECEMBER 2010
34. Hunter RJ. 1981. Charge and potential distribution at inter-face. In: Ottewill RH, Rowell RL, editors. Zeta potential incolloid science principles and application. New York: AcademicPress. pp. 11–58.
35. Durant JA, Chen C, Laue TM, Moody TP, Allison SA. 2002. Useof T4 lysozyme charge mutants to examine electrophoreticmodels. Biophys Chem 101–102:593–609.
36. Saluja A, Kalonia DS. 2004. Measurement of fluid viscosity atmicroliter volumes using quartz impedance analysis. AAPSPharmSciTech 5: Article 47.
37. Bund A, Schwitzgebel G. 1998. Viscoelastic properties of low-viscosity liquids studied with thickness-shear mode resonators.Anal Chem 70:2584–2588.
38. McSkimin HJ, Andreatch P, Jr. 1967. Measurement ofdynamic shear impedance of low viscosity liquids at ultrasonicfrequencies. J Acoust Soc Am 42:248–252.
39. Moore RS, McSkimin HJ, Gieniewski C, Andreatch P, Jr. 1967.Dynamic mechanical properties of concentrated polystyrenesolutions at 40 MHz. J Chem Phys 47:3–9.
40. Hess EL, Cobure A. 1950. The intrinsic viscosity of mixedprotein systems, including studies of plasma and serum.J Gen Physiol 33:511–523.
41. Salinas BA, Sathish HA, Bishop SM, Harn N, Carpenter JF,Randolph TW. 2009. Understanding and modulating opales-cence and viscosity in a monoclonal antibody formulation.J Pharm Sci 99:82–93.
42. Buzzell GJ, Tanford C. 1956. The effect of charge and ionicstrength on the viscosity of ribonuclease. J Phys Chem 60:1204–1207.
43. Tanford C, Buzzell JG. 1956. The viscosity of aqueous solutionsof bovine serum albumin between pH 4.3 and 10.5. J PhysChem 60:225–231.
44. Foster JF, Yang JT. 1954. Mode of interaction of surface-activecations with ovalbumin and bovine plasma albumin. J AmChem Soc 76:1015–1019.
45. Huggins ML. 1942. The viscosity of dilute solutions of long-chain molecules. IV. Dependence on concentration. J Am ChemSoc 64:2716–2718.
46. Kraemer EO. 1938. Molecular weights of celluloses and cellu-lose derivatives. J Ind Eng Chem 30:1200–1203.
47. Reilly PM, Van der Hoff BME, Ziogas M. 1979. Statistical studyof the application of the Huggins equation to measure intrinsicviscosity. J Appl Polym Sci 24:2087–2100.
48. Hall CG, Abraham GN. 1984. Size, shape, and hydration of aself-associating human IgG myeloma protein: Axial asymmetryas a contributing factor in serum hyperviscosity. Arch BiochemBiophys 233:330–337.
49. Kilar F, Simon I, Lakatos S. 1985. Conformation of human IgGsubclasses in solution. Small-angle X-ray scattering and hydro-dynamic studies. Eur J Biochem 147:17–25.
50. Mehl JW, Oncley JL, Simha R. 1940. Viscosity and the shape ofprotein molecules. Science 92:132–133.
51. Delpech MC, Oliveira CMF. 2005. Viscometric study ofpoly(methyl methacrylate-g-propylene oxide) and respectivehomopolymers. Polym Test 24:381–386.
52. Delpech MC, Coutinho FMB, Habibe MES. 2002. Viscometrystudy of ethylene-cyclic olefin copolymers. Polym Test 21:411–415.
53. Delpech MC, Coutinho FMB, Habibe MES. 2002. Bisphenol A-based polycarbonates: Characterization of commercial sam-ples. Polym Test 21:155–161.
54. Oliveira CMF, Andrade CT, Delpech MC. 1991. Properties ofpoly(methyl methacrylate-g-propylene oxide) in solution.Polym Bull 26:657–664.
55. Pamies R, Hernandez Cifre JG, del Carmen Lopez Martinez M,Garcia de la Torre J. 2008. Determination of intrinsic viscos-ities of macromolecules and nanoparticles. Comparison of
DOI 10.1002/jps
FACTORS AFFECTING THE VISCOSITY PROFILES OF DIFFERENT MABS 4829
single-point and dilution procedures. Colloid Polym Sci 286:1223–1231.
56. Riseman J, Ullman R. 1951. The concentration dependence ofthe viscosity of solutions of macromolecules. J Chem Phys 19:578–584.
57. Simha R. 1952. A treatment of the viscosity of concentrationsuspensions. J Appl Phys 23:1020–1024.
58. Cheng PY, Schachman HK. 1955. The validity of the Einsteinviscosity law and Stoke’s law of sedimentation. J Polym Sci16:19–30.
59. Hall CG, Abraham GN. 1984. Reversible self-association of ahuman myeloma protein. Thermodynamics and relevance toviscosity effects and solubility. Biochemistry 23:5123–5129.
60. Brown W, Nicolai T. 1993. Dynamic light scattering: Themethod and some applications. New York: Oxford UniversityPress.
61. Teraoka I. 2002. Polymer solutions: An introduction to physicalproperties. New York: Wiley. pp. 168–209.
62. Liu T, Chu B. 2002. Light scattering by proteins. Encyclopediaof surface and colloid science. New York: Wiley. pp. 3023–3043.
63. Bruce JA. 1976. Correlations for interacting Brownian parti-cles. J Chem Phys 64:242–246.
64. Placidi M, Cannistraro S. 1998. A dynamic light scatteringstudy on mutual diffusion coefficient of BSA in concentratedaqueous solutions. Europhys Lett 43(4):476.
65. Neal BL, Asthagiri D, Lenhoff AM. 1998. Molecular originsof osmotic second virial coefficients of proteins. Biophys J75:2469–2477.
DOI 10.1002/jps JOU
66. Pusey PN, Tough RJA. 1985. Particle interactions. In: PecoraR, editor. Application of photon correlation spectroscopy. NewYork: Plenum Press. pp. 85–180.
67. Bruce JA. 1978. Correlations for interacting Brownianparticles. II. J Chem Phys 69:684–690.
68. Anderson JL, Reed CC. 1976. Diffusion of spherical macro-molecules at finite concentration. J Chem Phys 64:3240–3250.
69. Mooney M. 1951. The viscosity of a concentrated suspension ofspherical particles. J Colloid Sci 6:162–170.
70. Ross PD, Minton AP. 1977. Hard quasispherical model for theviscosity of hemoglobin solutions. Biochem Biophys Res Com-mun 76:971–976.
71. Minton AP. 2007. The effective hard particle model provides asimple, robust, and broadly applicable description of nonidealbehavior in concentrated solutions of bovine serum albuminand other nonassociating proteins. J Pharm Sci 96:3466–3469.
72. Vand V. 1948. Viscosity of solutions and suspensions;experimental determination of the viscosity-concentrationfunction of spherical suspensions. J Phys Colloid Chem 52:300–314.
73. Vand V. 1948. Viscosity of solutions and suspensions; theory.J Phys Colloid Chem 52:277–299.
74. McMillan DE. 1974. Comparison of five methods for obtainingthe intrinsic viscosity of bovine serum albumin. Biopolymers13:1367–1376.
RNAL OF PHARMACEUTICAL SCIENCES, VOL. 99, NO. 12, DECEMBER 2010