ANALYSIS OF FORMATION PRESSURES ON TUNNEL AND ...
118
I -, ANALYSIS OF FORMATION PRESSURES ON TUNNEL AND SHAFT LIN1NGS in fulfill'ke "h t o'f requirements Jor ' the of Mastet ,-. Of ' Engineering in G ' eotechnical
-
Upload
khangminh22 -
Category
Documents
-
view
6 -
download
0
Transcript of ANALYSIS OF FORMATION PRESSURES ON TUNNEL AND ...

I
-,
ANALYSIS OF FORMATION PRESSURES ON
TUNNEL AND SHAFT LIN1NGS
Su~i,tted, in -;~it~i;al fulfill'ke"ht o'f tw~ requirements Jor 'the ae'g:r~e of Mastet ,-.Of 'Engineering in
G'eotechnical Erl~1ri~\dng

1.0
2.0
3.0
I
4.0
TABLE OF CONTENTS
SUMMARY
INTRODUCTION
TUNNEL ANALYSIS
3.1 Introduction 3.2 Basic Model and Assumptions 3.3 Mechanistic Development
3.4
3.3.1 Minimum Support Pressure
3.3.1.1 3.3.1.2
Neglecting Gravity Including Gravity
Analytical Development
3.4.1 Material Characterizations 3.4.2 Analysis of Stresses and Deformations
3.4.3 3.4.4
3.4.2.1 3.4.2.2 3.4.2.3
Streses Deformations Gravity Effect - Limit Equilibrium
Minimum Internal Support Pressures Extensions to Analysis
3.4.4.1 3.4.4.2 3.4.4.3
Face Effect Time Dependent Behaviour Non-Hydrostatic Field Stresses
3.4.5 Summary
SHAFT ANALYSIS
4.1 4.2
Introduction Mechanisms of Shaft Behaviour
PAGE
1
2
3
3 3 6
7
8 9
10
11 14
15 22 27
30 31
31 33 33
33
35
35 36
4.2.1 Conditions of Validity for 2-D and 3-D Models 40
4.3 4.4 4.5
Two-Dimensional Analysis Three-Dimensional Analysis Criticisms, Extensions and Comments
4.5.1 Field Stresses 4.5.2 Horizontal and Vertical Plasticity
45 51 58
59 59

5.0
I
TABLE OF CONTENTS (Cont'd)
4.5.3 Material Characteristics 4.5.4 Failure Criteria 4.5.5 Deformations 4.5.6 Face Effect 4.5.7 Thickness of Plastic Zone 4.5.8 Time Dependence 4.5.9 Face Stability
4.6 Case History Analysis
FURTHER WORK
PAGE
60 60 61 62 62 63 63
63
73

Figure 1
Figure 2
Figure 3
Figure 4
Figure 5
Figure 6
Figure 7
Figure 8
Figure 9
Figure 10
Figure 11
Figure 12
Figure 13
Figure 14
Figure 15
Figure 16
LIST OF FIGURES
Basic Tunnel Model: 2-D
Material Characterizations and Stress Analysis Equations for Tunnels - Summary
Material Characterizations and Deformation Analysis Equations for Tunnels - Summary
Example Stress Distributions with Reducing Internal Support
Typical Closure - Support Curve
Limit Equilibrium of Gravity Blocks
Characteristic Lines for Tunnel
Shaft Model
Stresses Around Shaft; Ko > 1
Stresses Around Shaft; Ko < 1/2
Determination of Plastic Zone
Stresses in Zone of Vertical Plasticity Near Shaft
Limit Equilibrium of Gravity Block
Minimum Support Pressures: Shaft in Cohesionless Material
Conical Potential Failure Surface
Characteristic Line for 3,032 ft. level, Mt. Taylor Mine Shaft

1.
1.0 SUMMARY
Initially, this report was intended primarily to review currently
available analytical techniques for the determination or prediction of for
mation pressures on shaft linings. To address this question, it has been
necessary for the author to progress through a detailed mechanistic under
standing of the analyses which have been developed for the prediction of
formation pressures on tunnel linings. This material, presented in Section
3 of the report, provides a necessary basis and framework from which to
proceed into the question of shaft analysis, presented in Section 4. A
comprehensive summary of two-dimensional analyses of stresses and deforma
tions around tunnels in a wide variety of materials has been attempted in
Section 3, and is shown in two key figures (2 and 3) to which frequent ref
erence is thereafter made. The role of gravity in the question of determin
ing minimum required support pressures (synonymous with minimum predicted
formation pressures) is addressed, as this factor is later seen to be of
importance to the analysis of shafts under certain conditions. For shafts,
it is shown in Section 4 that either two-dimensional or three dimensional
analyses may be appropriate depending upon the conditions of the problem,
notably the relationship between the horizontal to vertical field stress
ratio and the formation material properties. Both types of analysis are
presented, with some brief comment on the shortcomings and possible exten
sions to the analyses. The analytical approaches presented are used with
case history data in Section 4.6 to show that reasonable predictions of
formation pressure may be obtained, although the lack of available case
history data for validation under a wide range of conditions is an un
fortunate drawback.
Finally, some brief comments concerning additional research work
which could usefully be undertaken are included in Section 5.

2.
2.0 INTRODUCTION
This project was instigated to look into the problem of shaft lin
ing design or, more precisely, the problem of adequately estimating the
formation pressures for which a shaft lining must be designed. It became
quickly apparent that the heart of the problem could be found in the decep
tively simple question of what is the difference between a shaft and a
tunnel? While the answer is obvious in the physical sense of a shaft being
vertical and a tunnel being horizontal, the means by which this difference
was, or could be, accounted for analytically - and indeed the need for such
an accounting - were a great deal less clear. Analyses of both problems
have a common root in the well known hole-in-plate analogy, and this tends
to lead to a homogeneous view of the two problems as one being simply a
rotation in space of the other. The question of whether or not such a view
is an adequate reflection of reality might be considered as the basic theme
of this report.

3.
3.0 TUNNEL ANALYSIS
3.1 Introduction
Analytical solutions for the determination of stresses and defor
mations around cylindrical openings have been developed primarily for the
two-dimensional plane-strain case of a tunnel cross section. These solu
tions provide the essential bases for all of the analyses reviewed in this
report for both tunnels and shafts, and it is therefore important to derive
a clear understanding of the basic model utilized, the assumptions involv
ed, and limitations to the applicability of the results.
This section will look firstly at the model to be utilized, and
the assumptions which are inherent to the model. Development of the analy
tical solutions for the determination of stresses and deformations will
then be presented for a variety of different material characterizations,
encompassing a broad range of actual materials. The physical or mechanistic
meaning of the analytical results is assessed, and a brief review of areas
of extension to the analyses for various phenomena not accounted for in the
basic model is included.
The development given in this section draws heavily upon work by
Ladanyi, 1974, Coates, 1970 and Hoek and Brown, 1980. Existing work has
been extended to include the case of a purely cohesive (frictionless) mate
rial, such as the short-term response of a saturated clay. As the litera
ture includes a wide variance in notation and in format of equations, all
of the analyses have been cast in a framework which provides consistent
form to the equations and parameters used, enabling ready comparison of the
formulations appropriate to different cases.
3.2 Basic Model and Assumptions
Consider the case of a circular tunnel, to be excavated to initial
radius rio The length of the tunnel is very much greater than its

4.
diameter, with the longitudinal axis lying parallel to one principal field
stress. Thus, a cross-section can be analyzed under conditions of plane
strain provided that such section is remote from the excavation face.
To analyze stress re-distribution and deformations around the tun
nel as it is excavated a model as shown on Figure 1 has been selected, the
essential properties of which are given below.
(1) The cross-section encompasses a region of the ground which
incorporates the tunnel location and which is composed of
material which is weightless.
(2) The external boundaries of the region are remote from the
tunnel (i.e. r-oo ) and are loaded by an in situ stress field
having equal vertical and horizontal principal stresses of
magnitude Po, these stresses being equivalent to the in
situ stress field existing at the tunnel elevation prior to
tunnel excavation. Note that this is only valid for Ko =
ON 10; = 1.0.
(3) The tunnel boundary is defined by a ciru1ar hole of initial
radius ri, initially loaded internally by a radial pres
sure equal to the remotely applied field stresses, Po.
Thus, this situation represents the virgin condition in the
region, prior to any disturbance due to tunnel excavation.
Stresses in the field are everywhere hydrostatic and equal
to Po.
(4) The effect of tunnel excavation is modelled by progressively
reducing the internal pressure from Po to a lower value
Pi, termed the support pressure, and lying in the range
Po > Pi > o. Thus, this model of weightless material
remains radially symmetric throughout the process of tunnel
excavation.

I
5.
(5) No strains perpendicular to the plane of the section are
generated during the process of stress redistribution re
sulting from the progressive reduction in internal (support)
pressure, i.e. conditions of plane-strain apply.
(6) The material within the model region is assumed to behave in
a linearly elastic manner until the peak strength of the ma
terial is reached. Thereafter, the post-peak or post-failure
behaviour of the material is assumed to be perfectly
plastic, with the transition from elastic to plastic
behaviour occurring instantaneously. Any reasonable \
envelopes of peak and post-peak strengths may be utilized to
characterize the material, and a variety of such envelopes
are included in the analyses which follow.
(7) For material in the elastic range, the volumetric strains
are determined by the elastic constants E and V. In the
(8)
plastic range it is assumed that the plastic strain incre-
ments lie normal to the selected yield surface in principal
stress space. That is, the associated flow rule of the
theory of plasticity (Drucker-Prager postulate) is assumed
to be valid.
It is assumed, for the basic analysis, that the material
does not exhibit time-dependent behaviour in either the
elastic or the plastic state.
(9) Ground water pressures are neglected, i.e. all stresses are
effective stresses.
\

6.
3.3 Mechanistic Development
Mechanistically, the model selected behaves as follows:
Initially, stresses everywhere in the region are hydrostatic
and equal to Po.
As the internal (support) pressure is reduced from Po to
Pi, simulating excavation of the tunnel, the stresses
redistribute around the tunnel. Note that, from symmetry
and the plane-strain condition, the principal stresses re
main radial, tangential and parallel to the longitudinal
axis of the tunnel respectively.
At first, as the support pressure is reduced, the stress
differences created are insufficient to cause failure and
the region remains elastic. As a consequence of the stress
redistribution elastic strains and deformations occur. As
indicated by later analysis, the stresses within this com
pletely elastic region are independent of the material pro
perties, being solely a function of the geometry and the
imposed boundary stresses.
As the support pressure is further reduced, stress differ
ences sufficient to cause failure may occur - initially at
the boundary of the tunnel. Hence, a plastic zone is formed.
It is important to note that in this model the onset of pla
sticity is governed by the radial and tangential (principal)
stresses, i.e. by the principal stresses lying in the plane
of the cross-section.
The level of principal stress difference at which the onset
of plasticity occurs is solely a function of the material

7.
strength properties under consideration, and the stresses
within the plastic zone are solely a function of the support
pressure and the material properties.
Upon further reduction of the support pressure, Pi, the
plastic zone will extend outwards to a radius which is a
function of the above parameters and of the level of the
remotely applied stress, po.
Once a plastic zone has formed, the stresses within the sur-
rounding elastic zone are modified, reflecting the fact that
the plastic zone has limited load carrying ability, which
results in shedding of excess stresses to the elastic zone.
This phenomenon has been termed "ring action".
Deformations of the tunnel periphery now reflect both the
strains within the outer elastic region, and the strains
within the inner plastic region. The mode of closure defor-
mation in the plastic zone is analogous to that of a camera
shutter, and later analysis will show that movements occur
along spiral slip lines in the plane of the section.
3.3.1 Minimum Support Pressure
The primary question which we seek to answer through analysis of
this model, is the level to which the support pressure Pi may be re-
duced while maintaining a stable and functional opening; that is, what is
the minimum ground pressure for which the tunnel support system must be
designed? While this question will be addressed in more detail following
development of an analytical approach, the problem may be outlined mechan-
istically as follows:
f
!

8.
3.3.1.1 Neglecting Gravity
As previously noted, the model selected comprises a weightless
material. For this case two bounding conditions for the minimum support
pressure may be postulated.
i) No Plastic Zone Formation
Clearly, the tunnel will remain stable if the peak strength of the
material is not exceeded at any point in the region. Thus, if the support
pressure Pi is maintained at a high enough level such that the stress
differences created around the tunnel are insufficient to cause the onset
of plasticity, then the region will remain everywhere elastic with the
stresses at every point being less than the peak strength of the material.
The criterion of providing sufficient internal support pressure to avoid
any onset of plasticity ("failure") has commonly been invoked in tunnel and
shaft lining design. However, while this criterion is certainly sufficient
to maintain stability, it may not be - and in general is not - a necessary
condition.
ii) Stable Plastic Zone Formation
If the support pressure is reduced below that value indicated by
(i) above, the strength of the material will be exceeded by the imposed
stress difference, initially at the boundary of the tunnel, and a plastic
zone will start to form, growing outwards from the tunnel wall. However,
provided that the extent of the plastic zone which forms remains finite
i.e. re does not go to infinity, a zone of plastic equilibrium will
form. This ~one will in turn be surrounded by an outer zone which remains
in elastic equilibrium, and no further stress redistribution, strain, or

9.
deformation, will occur. Bence the tunnel may be considered stable. The
minimum support pressure for which the condition of the formation of a
finite plastic zone is fulfilled provides a lower bound solution to the
minimum design pressure question. In this case, it is clearly necessary to
maintain the support pressure at or above this level to maintain stability.
However, as discussed under item 3.3.1.2, fulfillment of this condition may
not be sufficient to ensure stability due to the effects of gravity.
The above two minimum support pressure conditions represent, re
spectively, an upper bound which is sufficient but may not be necessary to
maintain stability, and a lower bound which is necessary but may not be
sufficient. Note that the lower bound condition requires only that the
plastic zone remain finite. In fact, if the plastic zone becomes very
large in extent - even though remaining stable - the deformations of the
tunnel wall may become excessive, causing a functional failure of the tun
nel. Thus, between these two bounds lies a spectrum of support pressure
values identified with different degrees of extension of the plastic zone
and hence with different tunnel wall displacements. The relationships be
tween support pressure and tunnel closure will be quantified analytically
in Sec tion 4.
3.3.1.2 Including Gravity
The model proposed above comprises weightless material acted upon
by an external stress system. In reality, the self weight of the material
leads to differing stability conditions between the crown and the floor of
the tunnel. Given that a plastic ("failed") zone forms as the support pres
sure is reduced, it is necessary to assess the limit equilibrium of kine
matically possible failure wedges acted upon by gravity, in order to

10.
realistically match the stabiltity of the weightless model to the stability
of a real material. The lower bound minimum support pressure necessary will
then be that which is necessary to both maintain a stable zone of plastic
equilibrium (re < 00 ) and to maintain the limit equilibrium of postu
lated gravity block failures. While the specific manner in which this may
be accounted for is explored in the next section, it is important to empha
size the need for this limit equilibrium check, as it is primarily in this
factor that the difference between a shaft and a tunnel lies. In the case
of a tunnel, gravity forces act within the plane of the cross-section con
sidered in the model, and the limit equilibrium check may, therefore, be
included in a two-dimensional analysis. In the case of a shaft, however,
gravity forces act in a direction perpendicular to the plane of the cross
section, and a limit equilibrium check therefore invokes the third dimen
sion.
3.4 Analytical Development
In order to quantify the mechanistic behaviour outlined in Section
3, we seek analytical expressions for the stresses within both the elastic
and the plastic zones around the tunnel, and for the tunnel closurewhich
results from the stress redistribution caused by the progressive reduction
of support pressure. Utilizing such expressions, values of minimum support
pressure necessary to ensure stability will be investigated. Development
of the required analytical expressions is based primarily upon work by
Ladanyi (1974) and Hoek (1980), extended to include a wider range of
material characterizations.
The analytical material presented in the following sections is
summarized in Figures 2 and 3.

I
11.
For each case it is necessary to define a peak strength envelope
within which the material behaves elastically, and a post-peak envelope de-
fining the plastic behavior of the material. While the four cases outlined
below have been selected to cover a fairly wide range of combinations of
elastic and plastic material behaviour, any reasonable combination of
elastic and plastic failure envelopes is, of course, perfectly admissible.
3.4.1 Material Characterizations
See Figures 2 and 3 for a summary of the following material.
Case 1: Coulomb
(A) Elastic Behavior
~ = Shear STrCOJ79'ra
tT = Nor.l77,a' / srrC'.5s
Ct!" = Cohes/o/7 ;e/t::7ST/C./
fZ& = AJ7!?/e C7/ /orer-.J7o/ r.r/cT/O/7 //7 e/asT/c rt::7/7.;?e.
The material displays a linear Coulomb failure criterion on a Mohr
envelope (tvstr) plot. For convenience in maintaining a consistent format
between the various cases considered, the following parameters are defin-
ed:
Terzaghi's flow value in the elastic range:
= tdn? (45r~) Z
Intercept on ur axis in elastic range:

12.
An empirical parameter, M, giving a relationship between
field stress Po and material strength:
(B) Plastic Behavior
Cp :: CC7a6's/oo ;;P/O'S//c/
P!/,o = A/79/6' 0/ /nT6'rl7o/ rr/cT/b/7 //7 p/OST/C rp/7:re.
This material also displays a linear Coulomb criterion on a Mohr
envelope plot, with the parameters modified to reflect post-peak behaviour.
Analogous to the elastic behaviour, we define the parameters:
N.ep = £"Q/?2' /45r /ZfoA)
S~ = C,o/~P/;?~ = ~p/(N~'p -/)
This Case 1 model would generally be expected to have applicability
to soils displaying both cohesive and frictional behaviour, and could also
be utilized for a reasonable approximation of rock mass behaviour. Clearly,
the choice of the governing values for the basic cohesion and friction
parameters is of critical importance, as with all such material
characterization models.
Case 2: Fairhurst - Coulomb
Ladanyi (1974) has suggested that a rock mass may be more ade-
quately characterized by a Fairhurst parabolic failure envelope in the
elastic ("intact rock") range, and a linear Coulomb envelope in the plastic
("broken rock") range.
\

13.
(A) Elastic Behaviour
where: /7 = -OC/0-
L = r/7r-/
Once again, we define a parameter M giving the relationship bet-
ween field stress Po and material strength as:
(B) Plastic Behaviour
Identical to Case 1, a linear Coulomb criterion of the form:
z;, = ~ -I- trtg/? PP and for which; Np;o = CO/'? Z/45-1- JZ!o/z)
~p = Cp / ttp/? pp Case 3: Hoek-Brown Parabola
Hoek and Brown (1980) have suggested that a failure envelope for
rock may be appropriately drawn on a principal stress (~vs~) plot. The
equation of the envelope is defined in terms of two empirically derived
constants and the uniaxial compressive strength.
(A) Elastic Behaviour
where: ~ = L//ut2%/a/ &:'ornpress/J/6" sTrengTh.
n7d ... S~ = Ct:J/7sronrs de,P6"nc:Vng q.t7t:J/7 /77e:?r~r/::;'/ prt:Jperr/es //7 The e/dsr~c /'"0'/75e Q/7g de./'l/u/7g ..the s/uzpe &7/ rhe /o/,(",re ~nJ/e/ope (h'tlEK.., /98CJ.J

14.
In this case, the parameter M is defined as:
(B) Plastic Behaviour
An envelope of the same general form as that for the elastic re-
gion is used, but the constants m and s are modified to reflect plastic
behaviour, i.e. mp and sp.
Case 3: Purely Cohesive Material
Whereas the special case of a cohesionless material may be extra-
polated directly from Case 1, the case of a frictionless material (purely
cohesive) is somewhat less evident. The model used is that of an elastic
perfectly plastic material with no post-peak strength reduction. Hence, the
elastic and plastic envelopes are identical and, on a Mohr envelope plot,
are simply a horizontal (~ - 0) line as shown.
C - t-__ --:'Z'=-.-=-c:C'--___ _
3.4.2 Analysis of Stresses and Deformations
Development of the analytical expressions for stresses and dis-
placements are well covered in the literature for Cases 1 and 2 (Ladanyi,

15.
1974) and Case 3 (Hoek and Brown, 1980). Case 4 is a relatively simple ex-
tension, based upon the same steps used for the other cases. As an example,
and for clarity, the expressions for Case 1 are developed in this section,
with the resulting expressions for all four cases summarized in Figure 2.
As the logical sequence of the steps is identical in all four cases, de-
tailed development of each case may be readily undertaken.
3.4.2.1 Stresses
For the case of cylindical symmetry, the differential equation of
equilibrium in polar coordinates is:
:;. 0 (1 )
Assuming linear-elastic response and satisfying Eq. (1) for the boundary
conditions 0;. '"' Pi at r - ri and 0;. = Po at r =00 gives:
(2 )
(3)
These two equations give the radial and tangential stresses within an
elastic medium loaded by a 'stress Po at infinity and containing a cir-
cular hole at the origin of radius ri with an internal pressure of
Pi. If a plastic zone of radius re forms around the central hole,
then the stresses in the surrounding elastic region are found by satisfying
Eq. (1) for the boundary conditions 0;. = ~~ at r 0= r e and 0;. = Po
at r '"' 00 , giving:

16.
(4)
(5 )
It is readily seen that Eq. (4) and (5) are exactly analogous to Eq. (2)
and (3), but with the hole of radius ri replaced by the radius of the
plastic zone, r e , and the internal support pressure, Pi, replaced
by the radial stress at the elastic-plastic interface, ~ • Note that the
stresses within the elastic zone are independent of the material strength
properties.
Within the plastic or "failed" zone, the failure criterion defined
for Case 1 must be satisfied. As noted in Section 4.1, the plastic behav
ior of the material for Case 1 is governed by the Coulomb failure criteri-
on:
which may be rewritten as:
where:
SCp = CP/~(7/7 f3P (Sa)
A/~ = Ct2/72r45r ¢'..o/i') (5b)
as defined under Case 1 in Section 4.1. Recognizing that, for the model
under consideration, 0; = 0; and tJ; = t7;, we may write;
(6)
Substituting the failure criterion from Eq. (6) into Eq. (1), integrating
Eq. (1), and applying the boundary conditions that ~ = Pi at r =
ri gives the radial and tangential stresses in the plastic zone as:

17.
(7 )
(8)
Note that the stresses in the plastic zone are solely a function of the
strength properties of the material and the internal support pressure.
At the boundary between the elastic and plastic zones the failure
criterion for the original material i.e. the elastic material, must also be
satisfied. For Case 1, the elastic behaviour failure criterion may be
written as:
or: (9 )
The principal stress difference within the elastic zone may also be writ-
ten, from Eq. (4) and (5) as:
(~-~)= Z(Po-0) (10)
Substitution of Eq. (10) into Eq. (9) gives:
(11 )
where, as previously defined;
(l1a)
At the transition interface between the elastic and plastic zones,
there must be continuity of the radial stress. Thus, the expression for
radial stress in the plastic zone, Eq. (7), and the expression for radial
stress in the elastic zone, Eq. (4) must both be valid. Solving these two
equations simultaneously, the extent of the plastic zone, r e , may be
determined
(12)

18.
The value of internal support pressure, Pi, at which the onset
of plasticity occurs, and the minimum value of support pressure necessary
to maintain a stable plastic zone around the tunnel may be determined as
follows.
A plastic zone will exist when the radius of the elastic - plastic
interface, r e , is greater than the radius of the tunnel, rio Thus,
the onset of plasticity will occur when re - ri for which, from Eq.
(12), plasticity will occur when:
/j ' ::: ~ - Me q: (13)
Comparing Eq. (13) and (11) shows them to be identical. In other words, for
a condition of plasticity to be generated at the tunnel boundary, the in
ternal support pressure is, of course, identical to the radial stress at
the plastic - elastic interface. It is of some interest to note that the
onset of plasticity for the two bounding cases of purely frictional (cohe
sionless) and purely cohesive (frictionless) materials will occur at:
Cohesionless material; Pt' ::S Z Po/IW¢4' r/)
Cohesive materaial; ~'~ ~o- ~~
In order to maintain a stable plastic zone around the opening, the
radius of the plastic zone must be maintained at less than infinity. From
Eq. (12) it may be seen that re < 00 for any positive value of inter-
nal support pressure, even for a cohesionless material (i.e. ~c~ -0). For
a material displaying some cohesion in the plastic state the plastic zone
will theoretically stabilize even if the support pressure is reduced to
zero, although the zone may be of very large extent and the consequent
deformations may be quite unacceptable.
Finally, the nature of the deformations which will occur within
the plastic zone is governed by the system of sliplines which develop.

I
19.
Jaeger. 1969 (p. 192) shows that the plastic slip lines form a family of
equiangular spirals of the form;
r =: /joe (r ~~) (14)
and the existence of such slip lines give rise to the type of "camera-
shutter" closure movements referred to previously. Analytical expressions
for the amount of closure occurring are included in the next section.
Referring back to the mechanistic discussion of Section 3. the
above analytical development allows determination of the radius of the
plastic zone which forms as the internal support pressure is reduced (Eq.
12); the radial stress at the elastic - plastic boundary (Eq. 11); the
principal stresses within the elastic zone (Eq. 4 and 5) and within the
plastic zone (Eq. 7 and 8). and gives values of the minimum required sup-
port pressure based either on the criterion that no plastic zone is allowed
to form (upper bound; Eq. 13), or that the plastic zone which does form
reaches a stable limit (lower bound; Eq. 12 <00). However. the lower bound
solution. which is really the one of primary interest. is of relatively
little value as it tells us that the support pressure may be reduced to
zero for all but cohesion1ess materials. and even for this case any posi-
tive value of Pi will suffice to stabilize the plastic zone. To obtain
a more realistic assessment of minimum support pressures. it is necessary
to assess the closure deformations. and to assess the effect of gravity.
This is undertaken in following sections.
An example which demonstrates the nature of the change in forma-
tion stresses around a tunnel due to reduction of the internal support
pressure is shown in Figure 4. A material obeying linear Coulomb failure
criteria in both the elastic and plastic states was selected (Case 1) and

20.
the analysis is outlined below. The material properties have been chosen
to emphasize the mechanisms of iD.terest.
Elastic Behavior
Let: ¢e =35-
oc =- o.5~ -0
i.e. uniaxial compressive strength equals 1/2 the remotely applied field stress.
Hence: !Vide =- ~d/7P (45r ~ff) ~6' = .3.6;31
As; 0; = Z C6' cos 4/(/ - ~//7 f2!'c./ j Then C ... = O./3/b Ce = i{ ~ """'fe . ((- 'I~ 1e.) And Me =//r(N¢~ -/)~/o;~(/V~ r(}
~ =- /.36
Plastic Behavior
The strength parameters have been arbitrarily reduced to:
Thus:
~ =300
C,P "-%0 ~ = 0.00
SC;!J = qo/.td/7;;:1p == O. 0/7.tb
/V,.efp = .ta/? Z (45 f- ,@,.o/Z) == 3. 0
Prior to excavation, the internal support pressure, Pi, is
equal to the field stress, Po, and thus the field stresses are given
by o;.=O;=~
as shown by CD on Figure 4.
As the support pressure is progressively reduced, modelling the
excavation process, the material initially behaves elastically, redistribu-
ting the field stresses according to Eq. (2) and (3). From these it may be

21.
seen that the tangential stress near the hole is progressively increased,
with radial stress decreasing as Pi is reduced. Eventually, a suffi-
cient stress difference is generated to cause failure (onset of plasticity)
at the tunnel wall. The value to which Pi may be reduced before plas
ticity is generated is, by Eq. (13), equal to 0.32 Po.
At this point, shown as CD on Figure 4, the tangential stress at
the tunnel wall has increased to a value of 1.68 Po, with the radial
stress being equal to Pi i.e. 0.32 Po.
As the internal support pressure is further reduced, a plastic
zone grows outwards from the tunnel. The maximum extent of the plastic
zone is reached when the support pressure is reduced to zero for which,
from Eq. (12), the plastic zone extends to a distance of 4.45 times the
tunnel radius. Thus, for points located closer to the tunnel than (4.45)
ri, the stresses are given by Eq. (7) and (8), with the radial stress
at the elastic - plastic boundary being given by Eq. (11). For points
beyond the elastic - plastic boundary, the stresses are given by Eq. (4)
and (5). The results are shown as (D on Figure 4.
From this example, the meaning of the upper and lower bound minimum
support pressures discussed in Section 3.1 is indicated. Growth of the
plastic zone first commences at the upper bound value, in this case when
Pi is reduced from its initial value of Po to 0.32 Po' Growth
of the plastic zone ceases, having reached its maximum extent, when the
lower bound support pressure is reached, in this case when Pi is re-
duced to zero. As previously noted, the fact that a stable plastic zone is
achieved even when Pi is reduced to zero is due to the small cohesion
which "was assumed to exist for the material in the plastic state. Once
again it is emphasized that this analysis deals with a weightless material,

22.
and more realistic minimum support pressure assessment requires the inc1u-
sion of gravity effects.
Similar analyses could be undertaken for any of the different ma-
teria1 characterizations represented by Cases 1 to 4. The relevant analy
tical expressions for all four cases, derived using the same framework as
given in this section, are summarized on Figure 2.
3.4.2.2 Deformations
While this report is concerned primarily with the formation pres-
sures developed on tunnel or shaft linings, it is obvious from the fore
going section that the formation pressures which develop are related to the
closure deformations which occur. We have seen that there is no unique
value of internal support pressure - a reduction in support pressure is ac-
companied by a stress redistribution in the elastic material and a growth
in the extent of plastic zone, if such a zone has formed. These changes
will give rise to closure deformations. Conversely, one might state that
as more closure of the tunnel is allowed to occur, the necessary support
pressure is reduced. This section outlines an analytical approach, based
on the work of Ladanyi, 1974, which relates the closure deformations to the
material properties and the internal support pressure. As with the previous
section, only Case 1 (linear Coulomb material) is explicitly considered, as
the derivations for the other three cases follow identical logic. All cases
are summarized on Figure 3.
Consider first the radial displacement, ~ , of the elastic - pla-
stic interface at r - reo The elastic tangential strain at this inter
face,~~, may be written:
Ct9 : ; (L1 OJ - }) (LJ 0;. r LJ 0; ) } (15)

23.
Where ~ is the normal stress parallel to the longitudinal axis of the
tunnel and V is Poisson's Ratio. For the two-dimensional model and load-
ing system selected, it may be readily shown that, in the elastic region,
the change in longitudinal stress is zero for conditions of plane-strain
(or, in fact, plane stress).
Hence; Ct9 = j [Ll 0; - VLJ 0;] As; et9 = tL6'h
Thus; tL~ = j ~o; - VL1o;.) From consideration of Eq. (4) and (5) we may write that;
and Ll 0; == LPo r(/l; - t7;tf?)(&/f)V -~ A 0;. =L~-(~-~)(r~):;-rb
(16)
Substituting the above into Eq.(16) and simplifying gives the Lame equa-
tion:
Substituting Eq. (11) into the above gives;
LL'e = (I;Y) (McOf)/f;1 (17)
which is the radial displacement of the elastic - plastic interface and is
valid under conditions of either plane stress or plane strain.
In addition to the elastic radial displacement above, the radial
displacement of the plastic zone (if any) must be considered. If it is
possible to determine the average plastic dilation (volumetric strain) of
the material within the plastic zone, eav , then for plane strain condi-
tions we may determine the radial closure associated with a given extent
(radius) of plastic zone. Ladanyi, 1974 undertakes this task based upon
the concept of the associated flow rule of the theory of plasticity which

24.
implies that the plastic strain increments are normal to the yield surface
in principal stress space (Drucker-Prager postulate).
For Case 1 (linear Coulomb) the yield function may be written
(18)
As noted, Drucker's postulate states that:
(19)
where ~ is a constant of proportionality, F is the yield function and a(c~'
refers to a plastic strain increment. From (18) and (19), the ratio of the
plastic dilation to the plastic shear strain increment is;
(20)
and, for small increments of strain, we may assume a direct proportionality
between plastic dilation, e , and plastic shear strain, % .
Thus, (21)
The average plastic dilation, eav , is determined by dividing the total
volume change of the plastic zone, dVp, by the original volume of the plas-
tic zone, Vp.
(22)
While the volume of the plastic zone is readily calculated as:
(23)
the total volumetric change must be calculated from
/16-
dtj:; = ZTTe(r)rdr /i'
(24 )
To express the plastic dilation, e, as a function of radius, r, use
is made of approximate relationships (Ladanyi, 1974) which allow the inte-
gration of Eq. (24) and thus the determination of eav from Eq. (22)
as;
(25)

25.
where eav is negative for volume increase.
The parameter Rc (the subscript referring to the Coulomb model
of Case 1) reflects a concern over the range of validity of Druckers postu-
late. Ladanyi argues that the volume change rate can only be assumed to
obey the associated flow rule within a limited portion of post failure
strains and hence, for a thick plastic zone, Eq. (24) should only be inte-
grated over a portion of the zone. Ladanyi suggested that:
For a thin plastic zone, i.e. /'~- < -v3
Then: (26)
For a thick plastic zone, i.e.
Then: --Pc = /.IOC (27)
Having obtained an expression for the average plastic dilation,
the tunnel closure, Ui, may be calculated. Comparing the volume of the
plastic zone before and after its formation;
Simplifying, gives;
d - = r - //-(1- t'a~ )1 7 It tL/ Ii-A --,; .I
(28 )
Where:
(29)
The equations derived from the foregoing development, which may be
followed in similar fashion for Case 2 (Ladanyi, 1974), Case 3 (Hoek and
Brown, 1980) and Case 4, are summarized on Figure 3.
Using the foregoing analysis, displacements may be calculated for
the example presented in the previous section and shown on Figure 4. To

26.
calculate displacement, Poisson's Ratio and Young's Modulus are required.
For illustrative purposes, the following values have been chosen:
J) = (/.30 E = /tJO ,.q,
We wish to calculate the closure associated with progressively de-
creasing values of internal support pressure, Pi. As previously shown,
the material will remain fully elastic until the support pressure is re-
duced to 0.32 Po, at which point a plastic zone is instigated at the
tunnel wall. Thus the tunnel closure to this point is elastic and may be
calculated from Eq. (17) replacing re by ri, which shows a closure
of 0.009 times the original radius, ri. This point is shown on Figure
5 as CD, corresponding to the equivalent stress distribution shown on Fig-
ure 4. As the support pressure is further reduced the radius of the plastic
zone grows according to Eq. (12), and hence the ratio (re/ri) in-
creases. Knowing the values of (Ue/re) from Eq. (17); of Dc from
Eq. (20), and of (re/ri) Eq. (12), the appropriate values of R may
be calculated from Eq. (26) or (27), giving values of eav from Eq.
(25), A from Eq. (29) and hence of radial closure Ui from Eq. (28).
The results are plotted on Figure 5 in the form of a dimensionless closure
versus support pressure curve.
The results show that maintenance of the upper bound support pres-
sure (onse t of plas ticity, point CD) allows a radial closure of 0.009
ri, whereas reduction of the support pressure to its theoretical lower
bound allows closure of 0.28 ri, which would generally be completely
unrealistic. To maintain a more realistic closure, a support pressure
greater than the lower bound (zero in this case) is normally installed. The
analysis of the interaction between support reaction curves and ground

27.
reaction curves is well covered in the literature (Lombardi, 1973; Kaiser,
1980; Hoek and Brown, 1980, Ladanyi, 1974 and others) and will not be re-
peated here. A question of primary interest to this report is the deter-
mination of the actual minimum support pressure which will maintain the
tunnel in a stable condition. To determine this value we must now move
away from the weightless model which has been used, and invoke the effect
of gravity, thus differentiating between the crown of the tunnel and the
floor - a distinction which has not been present so far.
3.4.2.3 Gravity Effect - Limit Equilibrium
In the preceding analyses, we have seen that progressive reduction
in support pressure leads to the development of plasticity in the material
surrounding the tunnel. In a manner somewhat analogous to a slope stability
or retaining wall problem, we now seek to analyze kinematically possible
failure mechanisms to determine what minimum support pressure must be in-
stalled to stabilize such mechanisms. In other words, the approach of
limiting equilibrium can be utilized.
According to Eq. (14), there exists an infinite family of spiral
I slip lines in the plastic zone of the form:
r = ;-;.6'(~~~p) for a Case 1 material. For the example which has been utilized in the last
two sections, typical slip lines are shown in Figure 6, for the limiting
case of Pi = 0 when the plastic zone has reached its maximum extent
(re = 4.45 ri). The existence of such slip lines, in a homogeneous
material, has been well demonstrated by the model tests of York and Reed,
1953. As shown on Figure 6, it is possible to define blocks or wedges of
material, bounded by plastic slip lines, which eould provide kinematically

i"'"
28.
possible failure mechanisms. Clearly, there are an infinite number of such
blocks, as there are an infinite number of slip lines. The stability of a
given block is a function of the weight of material contained within the
block, the plastic shear strength of the material (which is fully mobilized
along the slip lines) and the existence of any internal support pressure.
In general, the internal support pressure required to stabilize a block may
be found by summing forces in the direction of potential movement, which is
parallel to the axis of symmetry of the block. Hence, for the block shown,
the general expression;
would be valid.
It is readily seen, by inspection, that a block with a vertical
axis of symmetry is most critical, as the driving force (W) is in the di
rection of potential movement. For a wall block, the driving force is zero
in the direction of potential movement, and is opposed to the direction of
movement for a floor block. Thus, some minimum value of support pressure,
(Pi) min, may be required to stabilize the tunnel crown due to gravity
effects, whereas the sidewalls require no such support, and the floor
stability is actually enhanced by gravity.
To determine the value of the minimum required support pressure on
the basis of seeking out the most critical failure block bounded by slip
lines as shown on Figure 6 is analytically feasible. However, such an
approach would be somewhat cumbersome. More seriously, determination of
minimum support pressure on such a basis would be placing an unwarranted
confidence in the highly idealized model of a perfectly homogenous, per
fectly plastic etc. material which we have utilized. For material such as
rock, the plastic zone represents a zone of broken rock, which will have

29.
been greatly affected by geological detail and will certainly not produce
the idealized slip lines shown in Figure 6. To obtain a simple and conser
vative value for the effect of gravity blocks in the crown it is generally
assumed that the full weight of the failed material i.e. the material in
the plastic zone ri < r < r e , must be carried by internal support
(Hoek and Brown, 1980). This is equivalent to assuming a vertically bounded
prismatic failure block with zero shear resistance along its boundaries,
and extending from the tunnel crown to the limit of the plastic zone. As
previously noted, the gravity destabilizing effect is fully active at the
crown, irrelevant at the side walls, and of a negative sense (i.e. stabi
lizing) at the floor. These effects may therefore be simply, although
crudely, accounted for by adjustment of the closure support curve shown in
Figure 6 by the term t( (re - ri), where ~ is the unit weight of
rock, increasing the support pressure by this amount in the crown, and
decreasing it in the floor, as shown schematically in Figure 7. Thus, as
experience clearly tells us, there exists a difference in the support re
quirements of the crown compared to the sidewalls or floor. Although this
difference, which is the effect of gravity, has been rather crudely ac
counted for in this analysis, it is important to recognize that the funda
mental step which enabled the gravity effect to be accounted for in the
context of a weightless material model was the use of a limit equilibrium
check on potential gravity failure blocks. Although the limit equilibrium
analysis was greatly simplified, the validity of the logic remains, and is
important in the analysis of formation pressures on shaft linings.

30.
3.4.3 Minimum Internal Support Pressures
From the foregoing analyses, it is seen that the minimum internal
support pressure - which essentially corresponds to the design pressure of
the formation upon the tunnel supports - may be defined in several ways
which have quite different physical meanings. There are really four basic
definitions which are outlined below in quantitatively descending order.
(1) Maintain Material in Elastic Range
This refers to the internal support pressure required to avoid any
failure of the material around the tunnel i.e. no onset of plasticity.
Widely suggested as design criterion for use in tunnel and shaft analyses
(Dixon and Mahtab, 1976). Referred to herein as the upper bound value of
minimum support pressure.
(2) Limit Closure of Tunnel
Referring to the character~stic closure - support curve of Figure
6, a support system may be installed to provide a reaction which is suffi
cient to limit the closure deformation to a pre-determined, acceptable,
value. This design support value would in general be less than 1) above.
Methods of treating analysis of support reaction are covered by Lombardi,
1973j Hoek and Brown, 1980.
(3) Maintain Limiting Equilibrium of Gravity Blocks
Referring to the (schematic) modified characteristic curves of
Figure 7, a minimum support value is required in the crown of the tunnel to
maintain the equilibrium of gravity blocks. This, realistically, is the
lower bound value for internal support pressure in the crown.

31.
(4) Maintain Stable Plastic Zone
This is the absolute minimum support pressure. For values less
than this the radius of the plastic zone expands to infinity, giving rise
to infinite closure movements. This parameter has relatively little mean
ing, as the analytical equations show that for a material displaying any
cohesion in the plastic state - however small - a stable plastic zone is
always achieved, albeit at the cost of extremely large displacements. For
a material which is cohesionless in the failed (plastic) state, a stable
plastic zone can theoretically be achieved provided some positive value of
internal support, no matter how small, is maintained. In reality, require
ments (2) or (3) will generally control.
3.4.4 Extensions to Analysis
While it is not the intention herein to undertake an exhaustive
review of tunnel analysis criticisms and extensions, some comments are in
order for purposes of completeness and clarity.
3.4.4.1 Face Effect
It was noted in Section 2 that the model utilized was for condi
tions of plane strain, and hence existed remote from the three-dimensional
effects of the tunnel excavation face. It was further stated that the pro
cess of tunnel excavation would be modelled by reducing the internal sup
port pressure from an initial value, Po' equal to the virgin field
stress, to progressively smaller values. In reality, excavation of the
tunnel does not occur gradually, but results in an instantaneous reduction
of the internal support due to removal of the rock core. Nevertheless, work
by Lombardi, 1973 and by Panet, 1974, indicates that the restraining effect

I
32.
of the tunnel face upon closure deformations of the tunnel in the proximity
of the face is reasonably modelled by the approach of progressively reduc
ing the internal support pressure in the analytical model. Thus, a ficti
tious internal support is presumed to exist within the tunnel near to the
face. Panet, 1974, compared a 3-D axisymmetric numerical analysis with the
results of the type of 2-D analytical analysis outlined in the previous
sections. He found that, for a material in the elastic range, the radial
closure immediately behind the face was in the order of 0.3 to 0.4 times
the closure which ultimately occurred when the tunnel face, and hence its
restraining effect, were advanced more than 2 diameters from the point in
question. This may be viewed as equivalent to maintaining an initial fic
tituous internal support pressure of between 0.7 Po and 0.6 Po at
the face. Thus, the restraining effect of the face may be approximately
modelled in the 2-D analysis by assuming that the (fictitious) internal
support pressure is equal to (say) 2/3 Po when the face is at the point
in question, and reduces to zero when the face is a distance of 4 ri
from the point in question. Thus, artificial support which is intended to
maintain a minimum internal support pressure as discussed previously must
be installed between the time of excavation and the time at which the face
has advanced a distance of four times the tunnel radius.
More detailed analysis of the stress-deformation response near the
tunnel face requires 3-D analysis - most readily undertaken by numerical
analysis of an axisymmetric model. Nevertheless, the 2-D model with a fic
titious internal support pressure which is progressively reduced does pro
vide a most useful analytical method which provides excellent insight to
the mechanisms of stress redistribution and deformation.

33.
3.4.4.2 Time Dependent Behavior
The model utilized is independent of time. Ladanyi, 1974, proposes
a simple method of utilizing "isochrone" lines to modify the support-clo
sure diagram derived from the foregoing analysis consisting, in essence, of
arbitrarily reducing the material strength parameters as a function of
time. More recently, Ladanyi, 1980 and Hanafy, 1980 have utilized creep
relationships based on a power law to account for time dependence. The
thesis by Da Fontura, 1980 provides a useful review.
3.4.3.3 Non-Hydrostatic Field Stresses
All of the foregoing analysis has been based upon a hydrostatic
state of stress in the virgin condition. This may be a serious restriction
with regard to the analysis of tunnels. Muir-Wood, 1975, and more recently
Pender, 1980 have extended the characteristic line method to include non
hydrostatic loading. This restriction is not as serious for the problem of
shaft analysis for which the condition of hydrostatic loading will gen
erally be closely met.
3.4.5 Summary
This section has outlined the basic derivation of an analytical ap
proach to the analysis of the stress-deformation response of a tunnel sec-
tion. Four cases of different elastic and plastic material properties have
been presented, and an attempt has been made to explain, qualitatively, the
mechanisms at work during the process of stress redistribution and deforma
tion. While the approach is strictly valid only for a two-dimensional pro
blem in plane-strain, it is able to provide useful insight to the process
of tunnel excavation by the device of progressively reducing a fictitious

34.
internal support pressure. It is emphasized that the onset of plasticity
or failure around the tunnel is due to the difference between the major and
minor stresses in the plane of the cross-section i.e. the tangential and
radial stresses, giving rise to a "camera-shutter" type of closure along an
infinite family of equiangular spiral slip lines. Because the model is
weightless, it is necessary to check the limit equilibrium under gravity
loading of potential failure blocks bounded by the spiral slip lines in
order to determine the minimum support pressure required. This limit equi
librium check is approximated by simply considering the full weight of the
material in the plastic zone to require support, and this approach succeeds
in differentiating between the crown, sidewalls and floor of a tunnel.
In essence, the well known hole-in-a-plate model has been utilized
for the basic analytical approach, modified for the special conditions of a
tunnel by including a limit equilibrium check of potential gravity failure
blocks. An exactly analogous approach may be followed for the analysis of
the formation pressures acting on a shaft lining, with the primary modifi
cations being due to the nature of the stresses causing plasticity and to
the fact that gravity effects act perpendicular to the plane of the hole
in-a-plate cross-section.

35.
4.0 SHAFT ANALYSIS
4.1 Introduction
After extensive review of the literature pertaining to the anal
ysis of formation pressures on shafts, one is struck by several factors.
Firstly, there is a surprising paucity of material. Secondly, it is com
monly argued that whereas the simple hole-in-a-plate model may be question
able for a tunnel due to non-hydrostatic loading and due to differences in
the effects of gravity at different points around the tunnel periphery,
these deficiencies are not generally present for a shaft. As a consequence,
simple hole-in-a-plate models are almost universally invoked for shaft an
alysis, and the result is then idential to the basic characteristic sup
port-closure curve outlined in the last section, but neglecting any gravity
corrections. In short, a shaft is viewed simply as a two-dimensional tunnel
problem around which gravity may be neglected. To quote Lombardi, 1973 "In
the centrosymmetrical case, as perhaps for a vertical shaft sunk in a homo
geneous rock, the problem is simpler in so far as every displacement points
towards the centre and thus exhibits only radial components. In the same
way the forces and stresses are only directed radially or tangentially". As
we shall see, this convenient and simple two-dimensional approach is rea
sonably valid, but only under cerain conditions, depending primarily upon
the ratio of horizontal to vertical field stresses, ko • Terzaghi, 1942,
had already recognized that the problem of shaft design in soils was not as
simple as merely rotating a tunnel in a weightless medium through ninety
degrees, and undertook an elegant engineering solution to a three-dimen
sional shaft problem. This section will endeavour to reconcile both ap
proaches by outlining the ranges of validity of each.

36.
Finally, it should be noted that attempts to determine the current
state-of-the-art basis for assessment of formation pressures around shafts
were remarkably unproductive. Mayo, 1968, in a state-of-the-art report re
fers to the rule of thumb of "one inch of concrete (liner) per foot of dia
meter" as still being the most acceptable. Virtually all of the more ana
lytical approaches which were found were simply based on provision of suf
ficient support pressure to avoid the onset of plasticity - identical to
the upper bound minimum support pressure from the previous section - al
though most authors emphasize that this is really only an approximate
method for controlling deformations (Weehuizen, 1959; Ostrowski, 1972). In
private communication with several consultants and contractors currently
involved in shaft design or construction, little additional insight was
gained. Indeed, in two cases the view was expressed that supports capable
of resisting pressures equal to the virgin state of stress, po, should gen
erally be provided. Such a view cannot in general be defended, and would
place an unnecessary penalty on the cost of shaft supports.
4.2 Mechanisms of Shaft Behaviour
The two basic shaft models referred to briefly above may be
thought of as essentially two-dimensional (hole-in-a-plate model, weight
less material) and essentially three-dimensional (Terzaghi, 1942) respect
ively. The applicability of each model may be understood in terms of the
mechanics of behaviour of the material around the shaft, notably the manner
in which failure (plasticity) of the surrounding material is generated.
Consider the excavation of a vertical shaft as shown in Figure 8.
As with the tunnel analysis, the excavation of the shaft at any particular
section (depth) may be modelled by considering the progressive relaxation

37.
of the internal support pressure starting from an initial value equal to
the in situ horizontal stresses appropriate to the depth being considered.
We will consider the horizontal stress field to be hydrostatic and of mag-
nitude Po = koOV ' where ko is the ratio of the virgin hori-
zontal to vertical stresses. The vertical stress is initally equal to the
overlying weight of material i.e. oy - tJ; =)(z. The internal support pres-
sure prior to excavation is equal to the remotely applied stress, i.e.
Pi = Po' As excavation proceeds Pi is progressively reduced.
As Pi is reduced, the material initially responds elastically
with the tangential stress increasing above Po near the shaft, the
radial stress deceasing, and the longitudinal stress remaining constant,
vertical and equal to J(Z. For this axisymmetrical case, as long as the
material remains in the elastic range, the equations governing the stress
distribution in the plane of the section are identical to those derived for
the two-dimensional tunnel case (Poulos and Davis, 1971), given by Eq. (2)
and (3).
~ = Fb -0-/1)(r0-)2
0; = ~ r(;:z, _~)("'*)2
Thus, as Pi is reduced, a stress difference is generated at the shaft
(2 )
(3)
wall due to the increasing 0; and decreasing t7;. Provided that no plasti
city occurs, the closure of the shaft in the elastic medium may also be
calculated by the same equations as those utilized for the tunnel case.
If the process of decreasing the internal pressure could be con
tinued, without the onset of plasticity, to the point where the internal
pressure is equal to zero, we see from Eq. (2) and (3) that the tangential
stress would rise to a value of twice the field stress at the shaft wall,

38.
the radial stress would drop to zero, and the vertical stress would remain
equal to the gravity load, all three stresses being principal.
i6'. o;-"'ZPo=Z~cYz
o;.~O
0; = .5"2
As the potential for the onset of plasticity depends upon the max-
imum principal stress difference, we see that there are actually three pos
sible alternatives for which pair of stresses initiates failure. Plasticity
could be generated in the plane of the cross-section by the difference bet-
ween the tangential and radial stresses, or it could be generated in the
vertical plane by the difference between either the vertical and radial
stresses or the vertical and tangential stresses. The latter case, although
possible, has been neglected in the following analysis. Which of the re-
maining two mechanisms occurs first, depends upon whether the vertical or
the tangential stress is the larger. This in turn depends upon the value
Consider first, as an example, a case for which the value of ko
is equal to or greater than unity as shown diagrammatically on Figure 9. As
Pi is reduced, 0; rises to values always greater than tJZ, and 0; falls
rapidly below tr.!(except for extremely high values of ko ), and thus the
maximum stress difference lies in the plane of the section and is due to
(OQ - 0;. ). If, during this process, the strength of the material is insuf
ficient to sustain the stress difference - which may, of course, occur be-
fore Pi is reduced to zero - then plasticity will be generated at the
shaft wall. The nature of this plastic zone is to form spiral slip lines,
exactly as in the tunnel case previously investigated. Plastic closure of
the shaft w,ill occur in "camera-shutter" form, with the surfaces of sliding

39.
causing movements only in the horizontal plane. Shear stresses in the ver
tical direction remain zero, and the vertical stress will remain unchanged,
as no failure has occurred in the vertical plane. This statement implies
that failure in the horizontal plane does not affect the m~terial strength
in the vertical plane, which is true only for an ideal material. While
this is clearly a simplification, it allows the mechanistic difference to
be clearly seen between the cases of horizontally generated plasticity,
(0& -0;. ) and vertically generated plasticity, «(Jz -0;). Thus, the situ
ation described closely resembles the two-dimensional tunnel case, with the
minor change that a condition of constant longitudinal stress prevails
(l:J.OZ={J) compared to the constant longitudinal strain (llcZ=O) assumed
for the tunnel case. It is this case, which we may refer to as "horizontal
plasticity" that has been referred to as the two-dimensional case, and it
is intuitively obvious that use of the simple 2-D hole-in-plate model may
be used to give approximately correct solutions to the stress - deformation
response, as outlined in following sections.
The above case contrasts with that shown diagrammatically in Fig
ure 10 where, for illustration, a value of ko < 1/2 has been assumed.
In this case, even if the internal pressure is reduced to zero, the tangen
tial stress never reaches a value as great as the vertical stress. Thus,
as Pi is progressively reduced, the maximum stress difference is always
governed by (OZ - 0; ). If, at some stage of this process, the strength of
the material is exceeded, plasticity will be generated in the vertical
plane by the (~ -~) stress difference. Failure generated in this mode
will create a family of inclined slip lines in the vertical plane, as ill
ustrated in the lower part of the figure, requiring downwards and inwards
movement of the material. As a consequence of the relative vertical

40.
movement, shear stresses will act vertically in the r - z plane, and excess
vertical stress (due to further reduction of Pi or due to the higher
initial vertical stresses at sections deeper in the shaft) is thereby shed
to surrounding material, causing a rotation of principal stresses in the
vertical, «(JZ - 0; ), plane. At the same time, the wedging action of the
inward movement will cause an increase in tangential stresses to a limiting
value equal to the major (near-vertical) principal stress. Thus, principal
stresses are no longer radial, tangential and vertical, the problem ceases
to be two-dimensional and the direct use of the 2-D tunnel model to deter
mine the stress-deformation response is no longer justified. Terzaghi,
1942, and later Coates, 1970 addressed this problem of "vertical plasti
city" with a view to determining the minimum support pressure required for
stability i.e. the minimum design formation pressure.
Before proceeding further with the analysis of these two cases, it
is worthwhile to develop a means of identifying the general range of appli
cability of each model i.e. the two-dimensional model of horizontal plas
ticity and the three-dimensional model of vertical plasticity.
4.2.1 Conditions of Validity for 2-D and 3-D Models
The simple mechanistic arguments of the previous section suggest
that a 2-D hole-in-a-plate "tunnel" model is reasonably applicable to a
shaft if the onset of plasticity is generated by stresses in the horizontal
plane i.e (0.9 -~ ), whereas a 3-D model must be invoked if plasticity is
generated in the vertical plane by the (OZ-o;,) stress difference. By
inspection of the illustrative examples in Figures 9 and 10, plasticity
will generally be of the horizontal (0& - 0;) type for ko < 1. 0 [exclu
ding the unusual case of the ~ - t7Z stress difference generating plasti-

41.
ci ty], and of the vertical (OZ -0;. ) type for ko < 1/2. Between these
two bounds, the determination of which mechanism will occur for a parti
cular case may be analytically solved as follows.
As the internal support pressure is reduced, the material redist
ributes stresses elastically, and the tangential-radial stress difference
at the shaft wall may be written from Eq. (2) and (3) as:
(30)
Assuming a linear Coulomb material (Case 1 from the tunnel analysis sec
tion), the maximum stress difference which may be sustained may be written
(0;-03)= OC rOj (N¢'e -/) (31)
As, for elastic response, ~ and ~ are principal stresses, we may equate
Eq. (30) and (31) and simplify to give;
(32 )
Eq. (32) thus indicates that, once Pi is reduced to the value given by
the above expression, horizontal plasticity due to the (~ -0;.) stress
difference will occur.
Similarly, we may write an expression for the «(JZ - 0;.) stress
difference in the vertical plane at the shaft wall from Eq. (2) as:
(t/Z -0;.) = (OZ -~) (33)
Once again, in the elastic range, OZ and ~ are principal stresses
and, equating Eq. (33) and (31) gives, upon simplification;
Eq. (34) indicates that, if Pi is reduced to the above value, vertical
plasticity will occur due to the (OZ - 0;.) stress difference.
(34)
Comparing Eq. (32) and (34) we may deduce that the equation which
gives the larger value of Pi will determine which form of plasticity
will first occur, as it is the larger value of Pi which will first be

42.
encountered during the progressive reduction of the internal support pres
sure. From this comparison, by equating Eq. (32) and (34) we may define a
critical value of ko - the ratio of horizontal to vertical field
stresses - as follows;
(tp kr//." = f +-)fz #'4) - OC ~ ;V~¢" OZ) (35)
If the actual value of ko at the depth of the particular shaft section
being considered is greater than (ko ) crit, then horizontal plasticity
will first be generated. Note that this expression does not indicate that
plasticity will be generated - only that if plasticity does occur, then it
will be in the horizontal plane. Conversely, for (ko ) actual < (ko )
crit, any onset of plasticity will be in the vertical plane due to the
«(7z - 0;) stress difference.
Referring to the illustrative examples previously used, we see
that the use of Eq. (35) agrees with the previous conclusions of potential
horizontal plasticity for ko > 1.0, and potential vertical plasticity
for ko < 1/2. From Eq. (35), the maximum possible positive value which
(ko ) crit can attain is equal to 1.0. Thus, any in situ value of
(ko ) actual> 1 will always be greater than (ko ) crit, and any
plasticity generated will therefore be of the horizontal mode. It can also
be shown that no plasticity can occur if the value of (ko ) crit is less
than 1/2, as the uniaxial compressive strength, ~ , must then be greater
than the vertical stress, o.!, and no vertical plasticity can occur even if
Pi (= 0;.) is reduced to zero. Thus, the minimum value of (ko ) crit
with which we need be concerned is 1/2.
Equations similar to Eq. (35) could be developed for other mate
rial characteristics, such as Cases 2, 3 and 4 on Figure 2, and would pro-
vide a means of determining the type of shaft analysis appropriate to the

43.
particular section under consideration, provided that in situ values of
ko are known. However, values of ko are difficult to obtain.
Nevertheless, precedent data and knowledge on the likely ranges of ko
in different formations provides some insight to distinguishing the type of
shaft analysis most probably appropriate.
i) For: (ko ) actual> (ko ) crit.
If plasticity occurs under these conditions it will be of the
horizontal mode due to the stress difference in the plane of the cross-sec
tion (~-~), and a 2-D hole-in-a-plate analysis is appropriate (see Sec
tion 3). This situation would be expected where (ko ) actual is rela
tively high compared to conventional at rest earth pressure coefficients,
and in all situations where (ko ) actual is greater than unity. Pub-
lished data on measured ko values (e.g. Hoek & Brown, 1980) suggests
that most rock formations would fall into this category, particularly at
relatively shallow depths (say less than 1000 m) where ko is commonly
greater than unity. Thus, as a broad but reasonable generalization, we may
state that for shafts in rock;
(ko ) actual> (ko ) crit.
is likely to occur. Thus, if actual field data is not obtainable, it would
be generally reasonable to proceed with a 2-D hole-in-a-plate type of shaft
analysis in rock. This conclusion indicates that the hole-in-a-plate ana
lytical shaft approach taken by many workers in rock mechanics does, in
fact, have justification, although this justification has not been expli
citly stated.

44.
ii) For: (ko ) actual < (ko ) crit.
If plasticity occurs under these conditions, it will be of the
vertical mode due to the stress difference in the vertical plane (OZ - 0;. ),
and a 3-D Terzaghi type analysis is appropriate (See Section 4). As noted
previously, this situation is valid for all cases where (ko ) actual is
less than 1/2, which covers most soil deposits. For normally consolidated
soils the at-rest earth pressure may be approximated by;
(36)
Manipulating Eq. (36) in conjunction with the inequality above (based on
Eq. (35» shows that the condition of vertical plasticity will govern for
all cases where plasticity is possible (i.e. exluding cases for which o.c >~) in a normally consolidated soil.
Theoretically, the value of (ko ) actual may rise to the limit
of the passive earth pressure coefficient for overconsolidated soils, and
thus achieve values greater than (ko ) crit within a soil deposit. Prac
tically, however, it is unlikely that ko will lie above the range 0.5 -
1.0 in most soil deposits. Lacking specific field data, it would be rea
sonable to assume in soil deposits that;
(ko ) actual soil < (ko ) critical
is likely to occur, giving rise to vertical plasticity and the need for a
3-D shaft analysis.
From the foregoing discussion, a simple and convenient division
arises between the analysis of shafts in rock (or, perhaps, very heavily
overconsolidated soils) and in soils (normally consolidated to moderately
overconsolidated). The former (rock) case may be treated in essentially
two-dimensions due to the "horizontal" mode of (00 - or) plastic! ty engen
dered, while the latter (soils) case requires a three-dimensional treatment
due to the "vertical" mode of «(fz - 0;.) plasticity which dominates. It is

, -
45.
of interest to note that Coates. 1970. derives an analysis for shafts in
rock based upon the 3-D Terzaghi analysis. justified by the statement ..
where the ground around the shaft has failed. the vertical stress for the
elastic condition before failure might have been the major principal stress
and thus greater than the horizontal tangential stress. In this case. the
stress initiating failure would be the vertical stress". As shown by the
foregoing analysis. however. this situation is. in fact. very unlikely to
arise in rock. due to the generally high values of ko encountered.
The two basic analytical models. two-dimensional and three-dimen
sional. are reviewed in the following sections.
4.3 Two-Dimensional Analysis
As long as the material surrounding the shaft in the axisymmetri
cally loaded model remains elastic as the internal support pressure is de
creased. the equations for stress redistribution and deformations derived
in Sections 3.4.2.1 and 3.4.2.2 for the tunnel case are valid for the shaft
case. As further support pressure reduction causes horizontal (0& -o,r ) plasticity to be generated. Eq. (7) and (8) will govern the stresses within
the plastic zone (for a Coulomb material). provided that the onset of hor
izontal plasticity has not caused a change in the vertical stress i.e. the
material strength in the vertical plane remains unchanged. leaving the
vertical stress as an intermediate principal stress.
However. the analyses of plastic closure deformations presented
previously are no longer precisely applicable to this case of shaft an
alysis. It will be recalled that Ladanyi. 1974. computed the closure due to
the plastic zone around a tunnel based on the assumption of plane-strain.
which allowed the volume of material in the plastic zone before and after

46.
its formation to be compared while ignoring volume changes parallel to the
tunnel axis. In the case of a shaft, the condition of plane-strain must be
replaced by a condition of constant vertical stress (i.e.~o.? - 0). If such
a modification were made, values of plastic shaft closure could be deter
mined to produce a support pressure - closure characteristic curve such as
that utilized in the previous analyses of tunnels. Lacking such an exten
sion, the direct use of the tunnel analysis equations (see Figures 2 and 3
for different material characterization) will result in some error when
applied to a shaft. It would be of interest to undertake the necessary an
alytical modifications to determine the significance of the errors. Despite
several attempts, this extension has not been adequately derived within the
scope of this work. Nevertheless, as a first approximation, the tunnel
formulae may be used to derive a support pressure - closure characteristic
curve for a shaft in rock (high ko ).
With regard to the minimum support pressure applicable to this
case, we see that the situation is analogous to that of a tunnel side wall
as indicated on Figure 7. The question of limiting equilibrium of gravity
blocks is irrelevant for this case, as the vertical stress remains every
where equal to the gravity stresses and thus the weight of any vertically
bounded block is supported at its base by the in situ vertical stress (re
calling that the spiral plastic slip lines in the horizontal plane are
sections through vertical planes). Unlike a tunnel, for which the gravity
block limiting equilibrium condition creates different characteristic lines
for the crown, sidewalls and floor, only a single characteristic curve is
applicable to this shaft case. Minimum support pressure may thus be var
iously defined as that required to avoid the onset of any plasticity, or as

47.
that required to maintain a stable plastic zone, or as that pressure asso-
ciated with some desired limit of radial closure.
In short, the foregoing case of a shaft in rock - or in any mate-
rial for which (ko) actual> (ko ) crit. as defined by Eq. (35) -
may be approximately analyzed by using the two-dimensional tunnel equations
previously derived and summarized in Figures 2 and 3, although with some
degree of error due to the deviation from plane-strain conditions. This is
precisely the approach taken classically by many investigators (Ostrowski,
1972, Weehuizen, 1959, Galanica, 1959), who have considered a shaft as a
vertical tunnel in weightless material.
An interesting approach to the problem of predicting the formation
pressure which will develop on a rigid liner placed at or near the shaft
face has been suggested by Abel et al, 1979, in analyzing the results from
an instrumented shaft at the Mt. Taylor mine. As this case history is an-
alyzed in further detail in Section 4.6, the original paper has been in-
cluded as an Appendix for reference purposes. In this section, the approach
suggested by Abel is presented in more generalized form than in the ori-
ginal reference.
The problem under consideration is that of a concrete lined shaft
in rock, for which the relatively rigid concrete lining is placed right up
to the shaft face as soon as possible after excavation. The question is to
predict the formation pressures which will develop against the liner as the
shaft face is further advanced. The case is appropriate to a two-dimen-
sional analysis on the basis of ko considerations.
From the 2-D tunnel equations previously developed, the radius of
plastic zone which develops may be written, Eq. (12), as
(12)

48.
for a Coulomb material. Thus, the formation pressure which develops on the
lining, Pi, may be written in terms of the plastic zone radius, as;
(36)
Note that this equation is analogous to that given in Abel's paper as Eq.
(1), but is generalized to account for the difference between the plastic
properties of the rock (Scp,AI}1},) and the elastic properties of the rock
(~,~). If the material is considered as elastic perfectly plastic such
that the plastic envelope is identical to the elastic peak strength enve-
lope, then the above equation becomes identical with Abel's Eq. (1), given
below in conforming notation;
A variety of expressions similar to Eq.(36) may be readily de-
veloped for different material characterizations. For the four cases shown
in Figures 2 and 3, the equations for the radius of plastic zone may simply
be rewritten to express (Pi) as a function of (re ). Abel quotes an
additional expression based on a material characterization suggested by
Talobre, 1957 (not reviewed - in French) which is essentially the same as
Eq. (36) with the cohesion of the material in the plastic state set equal
to zero. From any such expression which is selected as appropriate to the
material involved, the formation pressure could be determined if the radius
of plastic zone which develops is known. The key problem, therefore, is to
assess the likely thickness of the plastic zone which develops.

49.
Abel argues that (for this "rigid" lining case) the plastic zone
will develop to that distance at which the radial stress, as determined
from an elastic analysis of the zero internal pressure case, is just suffi
cient to provide the confinement necessary to resist the tangential stress,
also determined from an elastic, Pi - 0, analysis. Thus, this limiting
value of radial stress may be calculated, according to Abel, from knowledge
of the elastic stress distribution for Pi = 0 and the failure criterion
of the material. This is shown schematically on Figure 11, taken from Fig
ure 5 of Abel's paper. The extent of plastic zone which has been determined
in this manner must be associated with a specific value of internal support
pressure or formation pressure as required by Eq. (36). Thus, the value of
formation pressure, Pi, which will act on the lining may be directly
predicted from Eq. (36) based on this assessment of plastic zone extent.
Plotting the curves shown in Figure 11 is somewhat tedious, and Abel's
approach may be undertaken analytically quite simply as follows.
As previously derived, the radial stress at the plastic - elastic
boundary is given by Eq. (11) as:
ore =(~-McOC) (11)
(Reference to Figure 2 will give other expressions for ~e for other mate
rial characterizations). Thus, ore may be directly calculated from know-
ledge of the field stress, Po, and the elastic material properties
Mc and c.b. Then, for a purely elastic material, the radial stresses
are given by Eq. (2) as:
0;. =Po -(po-Pt)(rff)Z (2 )
for zero internal pressure, this reduces to
0;. = "bLI- (r0-)V (37)
(Given as Eq. 4 in Abel's paper).

50.
The radial stresses given by Eq.(37) and Eq.(ll) are equated at r - re
to give;
(38)
The value of re from Eq. (38) may then be substituted in Eq. (36) to
determine the predicted value of formation pressure, Pi. Knowing this
value for Pi, the actual distribution of radial and tangential stresses
in the plastic zone may then be calculated if desired.
Conceptually, the justification for Abel's approach is somewhat
difficult to see - the best argument seems to be as follows. Abel argues
that, at a section just above the shaft face, the radial stresses are those
which would occur for an elastic medium and zero support pressure i.e. Eq.
(37). The tangential stresses which are generated, however, are much less
than those predicted by an elastic analysis, due to the supporting or
"stress shielding" action of the face. A lining is then placed up to the
face, and the face is further advanced. As the face advances, removing the
stress-shielding effect, the tangential stresses increase towards their
maximum possible value, as given by the elastic analysis for the Pi = 0
case. However, the value which the tangential stress can actually reach is
limited by the material strength, which is dictated by the value of the
confining (radial) stress at any point. Hence, plasticity may be generated,
commencing at the shaft wall and moving outwards until a sufficient radial
stress value is reached to stop the process. During this process, deforma-
tions occur and the lining causes a reaction i.e. the value of support
pressure Pi increases. As the support pressure increases, the plastic
zone growth is inhibited, and a balance is reached when the plastic zone

I
51.
just extends to the point at which the radial stress is equal to the speci
fic value of elastic - plastic interface stress appropriate to the material
properties and remote stress field under consideration (Eq. 11). The
support pressure associated with this balance is the predicted formation
pressure.
The approach taken by Abel has two significant advantages - it is
simple and, at least for the case analyzed by Abel, it appears to give very
satisfactory results compared to measured values of formation pressures.
The specific analysis undertaken by Abel is summarized in Section
4.6, and is compared to an analysis of the same data based upon use of the
two-dimensional "tunnel" equation to derive a support pressure - closure
characteristic line diagram.
4.4 Three-Dimensional Analysis
The case for which plasticity of the material surrounding a shaft
is initially generated by the vertical and radial stress difference, {ar-~~
is treated by Terzaghi, 1942 and later by Coates, 1970. However, as
previously demonstrated, this case is really only applicable to soils,
rather than to rocks as assumed by Coates.
Referring to Figure 12, let us assume that, at a given depth in a
shaft, plasticity has been generated by the (OZ -0;) stress difference,
causing downwards and inwards movement of the material. Vertically acting
shear stresses, ~Z' will thus be generated on cylindrical surfaces as
shown in Figure 12 and the principal stresses will rotate by an amount, 5 ,
such that the state of stress upon an element near the shaft will be as
shown in Figure 12. For ease of computation, a cohesionless Coulomb mate
rial will be considered, and the state of stress on an element may then be

52.
represented in the Mohr diagram shown in the figure. We see that the
principal stresses in the vertical plane have changed from (Oi - 0;) to
(0;-03), due to the onset of plasticity.
For a case in which the principal stresses in the plastic zone
remain parallel to the shaft (or tunnel) axis, tangential, and radial
respectively, we see from Eq. (7) and (8) (see also Figure 2) that for a
cohesionless Coulomb material the plastic zone stresses are given by:
0; = (17)('/1;·)(#;;,.0-/) (37)
and
for the case shown in Figure 12, Terzaghi argues as follows. Due to the
downwards and inwards movement of the shaft wall, wedging action will cause
the (intermediate) tangential stress to increase to its maximum value com-
patible with the Mohr theory, which will be when it is equal to the major
principal stress, 0;. Thus, in the plastic zone,
(39)
From the Mohr diagram, we see that the maximum ratio of vertical to radial
stress which the material can sustain is given by:
(0/0;) = N¢'/ = rd/7t'(4.5 r ¢;/,?) (40)
We also note that flf/ </21p.
If we undertake to analyze a horizontal section through the shaft,
the maximum ratio of tangential to radial stress which could exist in the
plastic zone is, from Eq. (39) and reference to the Mohr digram, given by:
(41)
However, from the Mohr diagram, it is clear that the ratio (~/~) is al
ways greater than the ratio (OZ/~). Thus, if we analyze the section on
the assumption that a stress ratio of only (o.!/~) can be sustained, de-

53.
fined by the flow va1ue~, this will give conservative answers as the
actual stress ratio which can be sustained is greater than this, equal to
(~/~) as defined by the flow va1ueAl~. Thus, as a reasonable approxi-
mation, the stresses in the plastic zone may be determined from the 2-D
equations Eq. (37) and (38) by replacing the value of !V.¢p by~, giving;
0; = "1.(~)(/V~ -I) (42)
and
0; = N¢/ (";f;) (#1'1/ - /) (43 )
Although the ratio (~/~) is somewhat greater than (o.z/~), Terzaghi
assumes that, for purposes of analysis,
o;~oz (44 )
Similarly, an expression for the radius of the plastic zone,
r e , may be determined by replacing N.¢p by Ai.¢1 in Eq. (12) which, for a
cohesion1ess material, results in:
/"e' ~/4> ~co;.j}f#;f; -/) (45)
Equations (42), (43) and (44) thus give an approximate analysis of the
stresses in the plastic zone, based upon modification to the two-dimen-
siona1 tunnel analysis equations to account (approximately) for the rota-
tion of principal stresses.
The primary goal of Terzaghi's analysis is to determine the mini-
mum internal support pressure, Pi, which must be sustained. Just as in
the tunnel analyses outlined previous1~ an upper bound value of (Pi)
min. could be defined as that value necessary to avoid the onset of any
plasticity, given by;
(,?J)m//l. = ZPo/!Njde-r/) (46)

I
54.
A lower bound value, defined as that required to ensure that a stable plas-
tic zone is formed (re <00 ) is satisfied for any value of Pi
greater than zero, from Eq. (45). However, to determine if this lower bound
value can in fact be reached without instability, it is necessary to check
the limiting equilibrium of potential gravity failure blocks. Terzaghi
undertakes this check by considering a cylindrical potential failure block
of radius r as shown in Figure 13. Due to the shear stresses acting on the
vertical plane, trz ' the vertical stress o.z is less than the gravity stress
JZ, and hence the block is not held in simple equilibrium between the
weight of the block and the vertical stresses at its base - unlike the
previous two-dimensional case. For the block shown,
W= C?rS (47)
were:
W= 7T(r?-//oZ)& r
9=JZ7Ti~d, Ij'
S ~ 271r z (Trz )AV(;
(48)
(49)
(50)
Using Eq.'s (42), (43), and (44) to determine the stresses acting, and Eq.
(47) to check the limit equilibrium of the gravity block, it is then pos-
sible to determine the minimum support pressure which must be maintained in
the shaft, as follows.
From the Mohr diagram, Figure 12, the value of the shear stress at
given depth Z and radius r is given by:
trz = 0;. Can J2fz (51 )
Assuming a linear increase in ~ with depth, the average shear resistance
available along the cylindrical surface of radius r extending from ground
surface to depth Z may be written
7rz = (~o;.) tan X (52 )

55.
Note that this is conservative, as the actual average value of the radial
stress will be greater than (1/2~). Hence, from Eq. (50), we may write;
S = (ZJ!'rz)(i 0;. rO/7 X)
Thus, from Eq. (47), (48), (49) and (53),
Jr /
1Tf/'l'-0'2)%z- Z7!'rOZdr:. (zT/rz)(eo;.£cza X) r: t
Utilizing the stresses determined from Eq. (42), (43) and (44) we may
write;
where:
and
,Cda X = /7£-1 _ Z N¢I mp"I7N~ N~ 1-/
/7 = 0i. /77.:7 = Ahl£'
ri z
r#4 tl)_/ /7
/? Alp"
(53 )
(54 )
(55 )
(56)
(57)
The location of the critical failure surface will be that for which the
average shear stress reaches a maximum i.e at location Ii = 17/1
on Figure 13. For this, we set d( ttZl7;t>JiI7 = 0 in Eq. (55) giving;
mer = z N¢/ r I N¢I - (N¢/ - Z) 0 Z
'i ZN~ ;V~ 1-0 (N~r/) (58)
We also see, from Figure 13, that the maximum possible value that tan X
could achieve at a radius r I is equal to tan fiI2, and thus, from Eq.
(55);
/7/ 2 -/ taa)2'2 :. /77170 N~
2 Np, r;' 0,'/ #pJ', r/) - I 1V¢',r/ Z /7; N¢,
(59)
The minimum required support pressure, embodied in the parametern7~, and
the location of the critical surface of sliding, represented by r 1 = n,r

~
56.
may be calculated for any depth from Eq. (58) and (59), provided
v~lues of 01 and 02 are known.
To assess the values of 01 and 02, Terzaghi utilizes an
ingenious numerical analysis which results in the conclusion that, under
conditions of minimum internal support;
¢i := ¢z = (¢p - 5 ") for 30°< fOp <40" (60)
Thus, for a material of known angle of internal friction in the
plastic state, 0p , values of N01 and tan 02 may be calculated.
For selected values of the depth ratio, Z/ri, the parameter f,7~may then
be expressed as a function of the distance to the failure surface, n1,
from Eq. (58). Substituting in Eq. (59) then allows calculation of the
value of n1 and hence of~, giving the required value of (Pi) min.
The results of this calculation, for the case of a cohesionless Coulomb
material, are presented in the u.s. Department of the Navy Design Manual
NAVFAC DM-7 and are reproduced as Figure 14. The results show, for mate
rials of 0p > 30° that a maximum value of the minimum support pressure
is reached at a depth ratio Z/ri of approximately 4, whereas materials
weaker than this will show a continued increase in required support pres
sure to depth ratios of about 10. As most shafts extend to depths of at
least ten times their radius, it may be concluded that a limiting maximum
value of required minimum support pressure is generally reached beyond
which, for further advances of the shaft face, no increase in the necessary
minimum support pressure occurs.
Thus, Terzaghi's approximate three-dimensional analysis may be
viewed, in its essence, as a method of accounting for the necessary limit
equilibrium check of potential failure blocks under the action of gravity.
In both the tunnel and the shaft analyses stress distributions are ini-

57.
tially calculated assuming a model of weightless material. For a tunnel,
this model is corrected for gravity (in terms of the minimum support pres
sures required) by accounting for the limit equilibrium of the gravity
blocks existing in the broken zone above the crown of the tunnel. For a
shaft in which it is assumed that no vertical plasticity occurs (ko ac
tual > ko critical), no correction is required as the vertical stresses
in the walls remain equal to the gravity stresses. For a shaft in which
vertical plasticity is generated (ko actual < ko critical), the
Terzaghi approach provides the necessary correction for the support pres
sure required to resist the failure of vertical cylindrical gravity blocks
in the shaft walls.
The limit equilibrium of gravity blocks which are not vertically
sided provides the basis for the minimum support pressure predictions
reviewed by Prater, 1977. Full assessment of Prater's paper would require
a project of its own, as the work refers to a series of German language
publications. However, several serious shortcomings are evident in
Prater's paper. He refers to a shortcoming of Terzaghi's work in ·'its
unrealistic prediction of the shape of the plastic zone which according to
Terzaghi increases in radius with increasing depth reaching a limiting
value asymptotically". This is not predicted by the Terzaghi approach.
Whereas the minimum support pressure, based on limit equilibrium, does
reach a limiting value, this is by no means a prediction of the radius of
the plastic zone. It simply reflects the fact that, within a plastic zone
of some unspecified extent, the location of the critical (vertical) slip
surface reaches a limiting distance from the shaft wall. Terzaghi does,
however, utilize a calculation of the stresses in the plastic zone to
define the stresses acting upon the potential failure surface - chosen to

(
58.
be a vertical cylindrical annulus with a horizontal base. This step is
ignored by Prater, and apparently by the German work which he reviews,
giving rise to a serious error. Without regard to the effect of shedding
of excess vertical stress away from the plastic zone around the shaft,
Prater et al go directly to a limit equilibrium analysis of a potential
truncated cone failure block, shown in Figure 15. In assessing the equili-
brium of the block, it is assumed that the tangential stress (and hence the
tangential force, T) is related to the vertical stress by an earth pressure
coefficient (variously assumed as k = 1; k = (1 - sin ~); etc.) and that
the vertical stress is equal to the overburden stress (5z). As the tan-
gential force has an outward acting wedging component, F, which tends to
stabilize the block, this wedging component is thus related linearly to the
overburden depth. Hence, as the shaft depth increases to infinity;
oz o'Z -00
T k(d"Z)-oo F = r(T)-oo
As the wedging force goes to infinity, the block cannot fail, and the re-
suIt is thus predicted that the support pressure required decreases to zero
at an infinite shaft depth - a result which hardly seems likely. This
deficiency is noted by Walz, 1978, in his discussion of Prater's paper.
However, as all of the significant referenced work is in German, notably in
a Ph.D. thesis by Walz, this material has not been accessed for the current
project. The work refers to the case of shafts in soil, and may provide
useful additional insights to this problem.
4.5 Cr.iticisms, Extensions and Comments
Two basic approaches to the analysis of formation pressures around
shafts have been presented in the foregoing sections. Firstly, a two-dimen-

I
59.
sional approach was presented, generally applicable to shafts in rock and
based upon the same analytical expressions as those applicable to the an
alysis of a tunnel under plain strain conditions. Secondly, a three-dimen
sional approach was reviewed, generally applicable to shafts in soil and
based upon approximate modifications to the two-dimensional stress analysis
equations combined with an assessment of limit equilibrium conditions
around the shaft. Both methods are approximate in many areas, and some
criticisms, extensions and comments to the methods are briefly outlined in
this section.
4.5.1 Field Stresses
For all analyses presented it has been assumed that the field
stresses in the plane of the cross-section are hydrostatic. In general,
this is a reasonable assumption for shaft analysis. If specific data are
available to indicate a non-hydrostatic state of stress the analyses may be
modified, although at the cost of increased complexity. Muir-Wood, 1975,
and Pender, 1980 indicate methods by which unequal field stresses may be
accounted for in analysis.
4.5.2 Horizontal and Vertical Plasticity
In differentiating between the cases appropriate to two-dimensional
and three-dimensional analysis respectively (Section 4.2.1), it was impli-
citly argued that creation of horizontal plasticity due to a tangential -
radial stress difference would not significantly alter the elastic material
properties in the vertical plane. As shown in Abel's paper (see Appendix,
I
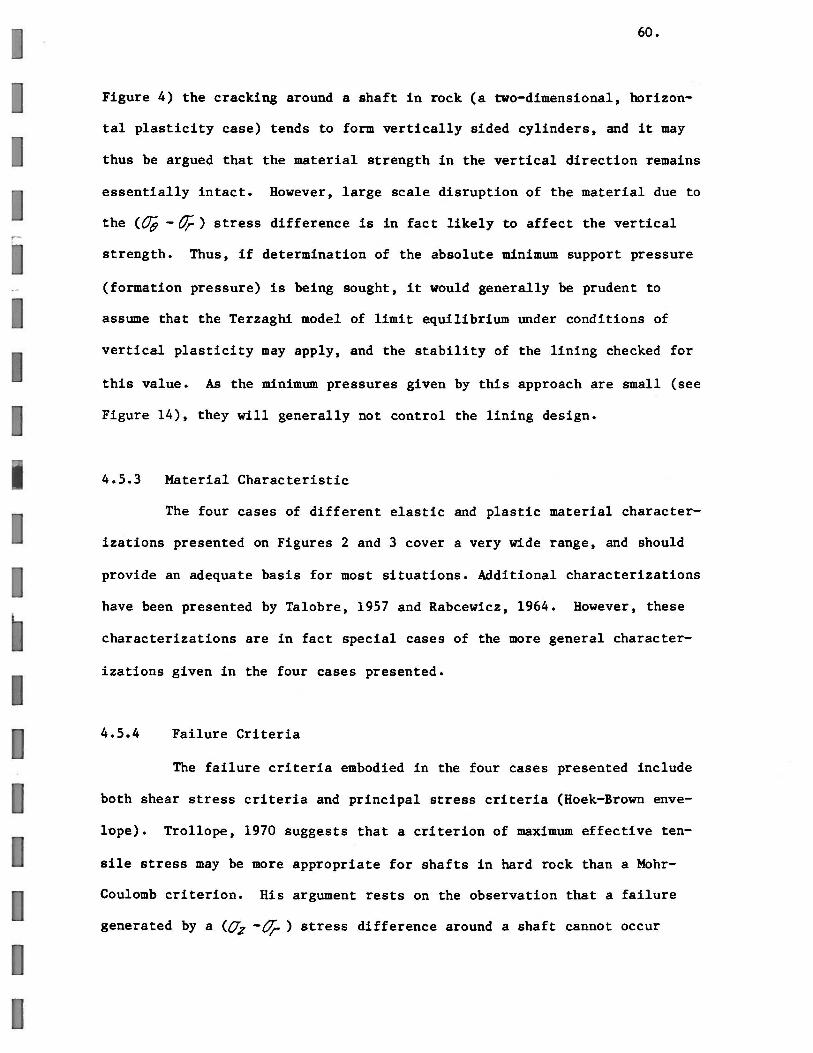
r
60.
Figure 4) the cracking around a shaft in rock (a two-dimensional, horizon
tal plasticity case) tends to form vertically sided cylinders, and it may
thus be argued that the material strength in the vertical direction remains
essentially intact. However, large scale disruption of the material due to
the (~-~) stress difference is in fact likely to affect the vertical
strength. Thus, if determination of the absolute minimum support pressure
(formation pressure) is being sought, it would generally be prudent to
assume that the Terzaghi model of limit equilibrium under conditions of
vertical plasticity may apply, and the stability of the lining checked for
this value. As the minimum pressures given by this approach are small (see
Figure 14), they will generally not control the lining design.
4.5.3 Material Characteristic
The four cases of different elastic and plastic material character
izations presented on Figures 2 and 3 cover a very wide range, and should
provide an adequate basis for most situations. Additional characterizations
have been presented by Talobre, 1957 and Rabcewicz, 1964. However, these
characterizations are in fact special cases of the more general character
izations given in the four cases presented.
4.5.4 Failure Criteria
The failure criteria embodied in the four cases presented include
both shear stress criteria and principal stress criteria (Hoek-Brown enve
lope). Trollope, 1970 suggests that a criterion of maximum effective ten-
sile stress may be more appropriate for shafts in hard rock than a Mohr
Coulomb criterion. His argument rests on the observation that a failure
generated by a (CTz -~ ) stress difference around a shaft cannot occur

.~
61.
unless the failed element of rock is freed from the surrounding rock (by
joints, for instance) and thus able to move downwards and inwards along the
inclined shear surface. Note, however, that the discussion in Section
4.2.1 implies that such a failure is very unlikely in a hard rock shaft.
Nevertheless, Trollope defines an effective tensile stress criterion as:
OJ =0.;- V(o;+t72)
This criterion may be introduced to the analysis of stresses around the
shaft to give a critical depth of shaft at which such failure will first
initiate. Trollope suggests that structural support sufficient to avoid
such failure should be installed. As previously noted, however, the pro
vision of internal support sufficient to avoid any failure (plasticity) is
unnecessarily stringent. The above failure criterion could readily be
utilized within the analytical framework presented, and would modify the
calculated support pressure at which failure first initiates, the radius of
plastic zone etc., and may be valid for brittle rocks which tend to display
strain-extension fracturing under low confining stresses. In essence, this
is simply a modification to the material characterization chosen.
4.5.5 Deformations
For the two-dimensional analysis of a shaft section, it was noted
that use of the plane-strain tunnel formulation to determine radial defor-
mation is not strictly valid, although the errors are likely to be small.
For the Terzaghi type of three-dimensional model, no reference material is
available concerning deformation analyses. While such a task might be
fruitful, the use of numerical analysis techniques by computer modelling
world generally be preferable. As a very approximate guide, the shaft wall
movements necessary to allow the full mobilization of shear strength along

62.
the limiting equilibrium surface selected could be roughly deduced from the
strains measured at peak strength in testing the material. Coates, 1970,
indicates this approach.
4.5.6 Face Effect
As discussed in Section 3.4.4.1 with reference to tunnels, the
face of the excavation provides a supporting or stress-shielding effect.
Panet, 1974, suggests that the effect of the face upon the deformations of
a section immediately behind the face is equivalent to maintaining a fic
titious internal support pressure of about 2/3 the field stress, with this
effect reducing to near zero at a distance of about four radii from the
face. Galle, 1962, suggests that the stresses in the elastic walls of a
vertical well are equal to those calculated by two-dimensional analysis at
any distance greater than about 3 radii from the face. However, both of
the above analyses are based upon elastic models, and could usefully be
extended to compare numerical 3-D elastic - plastic models with 2-D elastic
- plastic models.
4.5.7 Thickness of Plastic Zone
Ostrowski, 1972, in one of the more interesting papers available
on the analytical design of shafts, used the theory of the strain energy of
distortion to predict the thickness of plastic zone. The apparent advantage
of such an approach is that it deals with volumetric and shear stress in
variants, thus including the effect of the intermediate principal stress.
Unfortunately, derivation and application of the relevant equations is only
briefly presented in Appendices, making them difficult to follow. Abel,
1979, has found that the use of Ostrowski's approach gives values which are

63.
not compatible with field data, and there would therefore seem to be little
advantage in its use.
4.5.8 Time Dependence
No consideration has been given to the effects of time dependence
of material properties in the foregoing analyses, and reference should be
made to the comments on this topic under Section 3.4.4.2.
4.5.9 Face Stability
An additional stability phenomenon which is well known during shaft
sinking, particularly in soils, is that of heave of the face. The question
of face stability has not been reviewed herein, although this does not
imply that it is of minor importance. Indeed for many shafts it is the
critical stability concern, and its omission here is due solely to lack of
time. Some interesting work was instigated by Broms, 1967, and extended by
Attewell, 1971, on the question of stability ratios in saturated clays
(i.e. the determination of critical values of the ratio of undrained shear
strength to overburden stress at which intrusion of the clay into the shaft
or tunnel face would occur). Review and extension of this work to provide
guidance for shaft design in a wider variety of materials including both
soils and rocks would be a useful undertaking.
4.6 Case History Analysis
In order to provide validation for the analytical approaches out
lined in this report, the literature was surveyed to obtain case history
data which could be analyzed. Unfortunately, only a single paper - that by
Abel et aI, 1979 - was found which contained data which was at all adequate

64.
to provide a case history. This scarcity of published case history data on
shaft analyses and field measurements is a serious deficiency in trying to
assess the most appropriate analytical approaches for various shafting
conditions. The author is grateful to Dr. Morgenstern for uncovering the
paper by Abel.
Most published reports on shaft sinking projects contain data on
advance rates and shaft excavation techniques, but with only fragmentary
information (if any) on the properties of the formations being penetrated,
the basis of design of the shaft linings, and the field performance of the
linings in terms of stresses or deformations. Such papers include those by
Pack and Skinner, 1976; Barron and Toews, 1963; Gooch and Conway, 1976;
Redpath, 1971; Collins and Deacon, 1972; Hulshizer et aI, 1976; Lambert,
1968; Grieves, 1974; Sibson, 1968;' and Zahary and Unrug, 1972. According
to Zahary "Interesting results were obtained recently in Poland and Russia
using dynamometer and strain gauges installed in the shaft lining. Lateral
pressures measured showed wide variations, particularly in competent
rocks". Unfortunately, the results are not presented, with reference being
made to the Russian language publications of Krupiennkow, 1963 and Unr~g,
1970.
The paper by Abel, Dowis and Richards, 1979, is, therefore, a
particularly useful contribution, containing adequate data on the formation
properties and field stress, the concrete lining, and the results of lining
stress measurements at the 14 foot diameter Mt. Taylor mine shaft. This
paper has been attached for reference as an Appendix to this report.
In his paper, Abel suggests an interesting approach to the problem
of predicting the formation pressures which develop upon a rigid concrete
liner cast close to the excavation face as the face advances. The basis of

"
65.
the analysis has been presented in Section 4.3. Sufficient data is pre-
sented in Abel's paper to provide a quantitative example and validation of
the analytical approaches suggested in this report. In this section, the
data applicable to the 3032 foot level of the Mr. Taylor shaft is analyzed
both by the method suggested by Abel, modified somewhat to allow the an-
alysis to be undertaken in a more general form, and by the support pressure
- closure characteristic line method. An interesting and worthwhile com-
parison emerges.
While reference may be made to the attached paper for more detail,
the critical elements of the data necessary for analysis are summarized
below, with notation conforming to that used in this report.
Field Stresses
OV = 2906 psi, based on overburden load Po = 2150 psi, based on hydrofracture stress measurements ko = 2150/2906 = 0.74
Shaft Geometry
r i Depth
= 7 ft. = 3032 ft.
Material Characterization
Linear Mohr-Coulomb
i) Elastic Properties:
at - 500 psi (uniaxial compressive strength), based upon reduction of intact specimen strengths by a factor of about 5
~ = 29°. Hence N~e - tan2 (45 + ~e/2) = 2.90 E c 60,000 psi.
ii) Plastic Properties:
OC)' assumed to vary linearly from 0 psi at the shaft wall to 500 psi at the elastic-plastic interface (r = re). Therefore, (ctp) AVG. = 250 psi.
0p c ~e = 29°. Hence N~e c N~p c 2.90

Liner Properties
Cc .. Ec =
I~ =
24 inches (thickness of concrete) 4.03 x 10⁶ psi 5.000 psi (uniaxial compressive strength)
66.
Abel proceeds directly to utilize two-dimensional analyses. which
implicitly assumes that the stress difference which governs formation of a
plastic zone is the tangential - radial stress difference. Following Sec-
tion 4.2.1. this assumption may be checked explicitly as follows:
( ktl)cr/I: .: -l f- }f? N~e') - oc,;f? IV'k0-)
Substituting the relevant figures gives:
As:
(ko)crit. = 0.64
(ko)actual = 0.74
we see that (ko ) actual> (ko ) critical. which defines a condition
(35)
for which plasticity will occur in the horizontal plane. generated by the
(i?&-O'r) stress difference. As argued in Section 4.2.1. this condition
allows use of a 2-D analysis.
As outlined in Section 4.3. Abel criticizes the equation relating
support pressure to plastic zone radius derived from Terzaghi's work on
the basis that it applies to an elastic - perfectly plastic material. The
more general form of equation for a linear Coulomb material having differ-
ent elastic and plastic properties may be substituted. as given by Eq.
(12). where:
~ = r~- / (Po r .5c,P - Me OC) 1 }fN,p -I) [ - -'7- r .5cp -.;
(12)
While other material characterizations could be used. see Figure 2. the
test data on the formation materials is not presented by Abel in sufficient

67.
detail to allow this. The relevant terms for the above, and following,
equations may be readily determined from the data as:
Po = 2150 psi
5 c,P = C,PftQn~ = /.3Z'p5~·
Me =/1+ rN¢'e -/)~~.?fNP4'.,..lj Mc = 2.35
From Eq. (11), the radial stress at the elastic-plastic interface is given
by:
ore =(rb - McOC) (11)
from which;
0/-6' = 9 7S 'p5~'
Note that this simply derived value agrees exactly with the value deter-
mined by Abel using a more complex iterative procedure (Eq. 11 in Abel's
paper) •
For a purely elastic material, the radial stress distribution
under conditions of zero internal support pressure (i.e. immediately upon
excavation and before a lining reaction has developed) are given from Eq.
(2) as:
0; = Poj/-/Yr)'i Hence, at r = a distance, r e ,
0;.6' = ,-Cb LI- (r',fre)Z J From which, re = 1.35 ri
which agrees with Abel's value. Abel then suggests that the lining pressure
which will develop is that which is appropriate to the above value of
plastic zone radius. Abel uses a formulation for elastic material given by
Ta1obre, 1957, and obtains a predicted value of support pressure as:
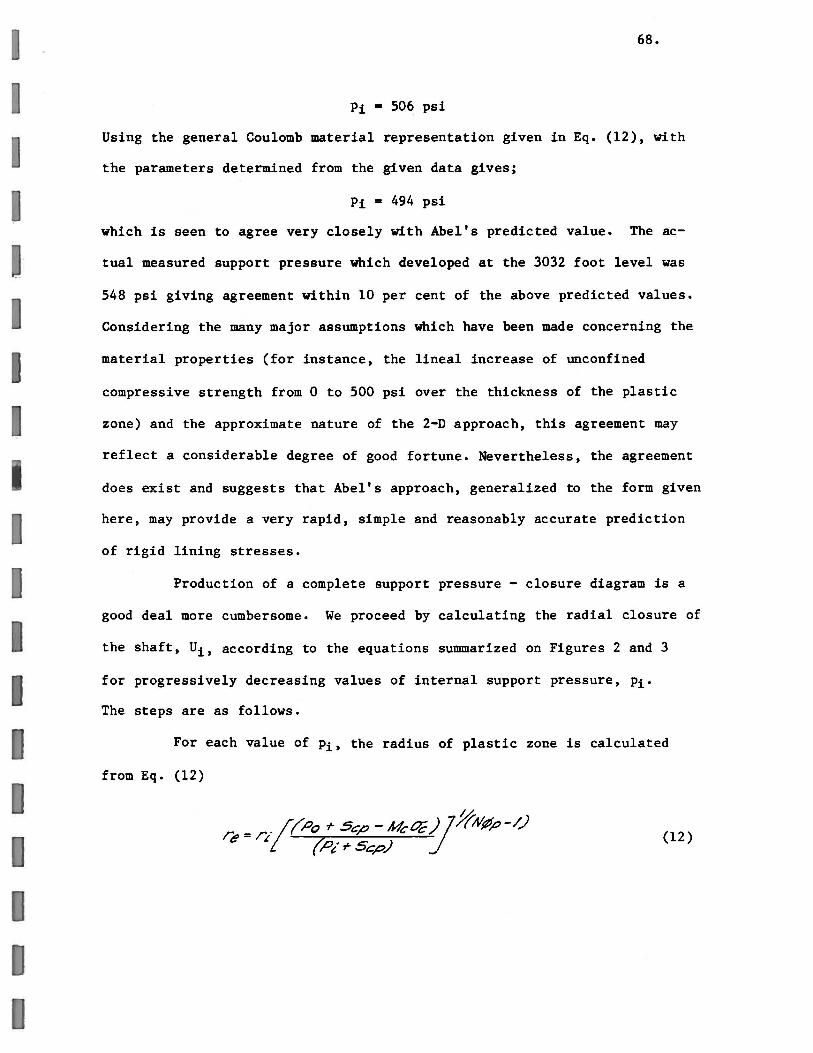
I
68.
Pi - 506 psi
Using the general Coulomb material representation given in Eq. (12), with
the parameters determined from the given data gives;
Pi = 494 psi
which is seen to agree very closely with Abel's predicted value. The ac-
tua1 measured support pressure which developed at the 3032 foot level was
548 psi giving agreement within 10 per cent of the above predicted values.
Considering the many major assumptions which have been made concerning the
material properties (for instance, the lineal increase of unconfined
compressive strength from 0 to 500 psi over the thickness of the plastic
zone) and the approximate nature of the 2-D approach, this agreement may
reflect a considerable degree of good fortune. Nevertheless, the agreement
does exist and suggests that Abel's approach, generalized to the form given
here, may provide a very rapid, simple and reasonably accurate prediction
of rigid lining stresses.
Production of a complete support pressure - closure diagram is a
good deal more cumbersome. We proceed by calculating the radial closure of
the shaft, Ui , according to the equations summarized on Figures 2 and 3
for progressively decreasing values of internal support pressure, Pi'
The steps are as follows.
For each value of Pi, the radius of plastic zone is calculated
from Eq. (12)
re = ri /(p() r Scp - McOC) ;}fAl(#p-/) !' (,.q'r Scp) J (12)

69.
from which the value of re first becomes greater than ri (onset of
plasticity) at Pi = 975 psi. Note that this may also be determined
from Eq. (11);
~e = (Po - McOC)
Starting at Pi = 975 psi, for each further reduction in Pi, the
displacement of the elastic-plastic interface, Ue , is calculated from
Eq. (17)
(/,.. J/) (~OC)/"e LIe = ~
(11)
(17)
A value of V = 0.20 was assumed (Not given in Abel's paper). The calculated
thickness of plastic zone, Eq. (12) is assessed to see whether it is a thin
zone (i.e. I?I/i' <6) or thick zone (;elit' >7/3) and the appropriate value
of the parameter Rc calculated by:
Thin zone; Rc = 2 Dc .1/1 ( Ii- Iii" )
Thick zone; Rc = 1.1 Dc
where Dc is the ratio of plastic dilation to plastic shear strain,
Dc -= - 5~/?~
(26)
(27)
(20)
The average plastic dilation, eay , may then be calculated for each step
from Eq. (25) as:
j(re?;)?-lj!i'" fficJ
z(U~I!')(~/r~)? 6'/71/ = (25)
Note that negative values are obtained for epl/' indicating volume increase
of the plastic zone. Finally, the total closure (elastic plus plastic) of
the shaft wall is calculated from Eq. (28) as:
.L , /; //-e4~)Z 7
0' = -?j /-(-/-I-A 7 ./ (28)

70.
where the parameter A is equal to:
A ,., (2 ~rt!' - ~4V)( I'JI//;o )z (29)
The resulting characteristic line of support pressure versus closure is
given for the 3032 foot level of the Mt. Taylor shaft in Figure 16.
In order to predict the lining pressure, it is necessary to cal-
culate the lining stiffness. Following Hoek and Brown, 1980, the stiffness
of the concrete lining, kc, is given by;
J::: _ Ecb·Z-Mo- t"c)Z.l c - (IrJ/c)L(/-ZJ/c)/i"Z+/~.-Z-c):;
Note that ri refers to the excavated radius of the shaft and not to the
internal radius of the concrete lining as incorrectly shown in the refer
ence. Choosing a value of Poisson's Ratio for the concrete of ~ - 0.2,
gives
KC = /. 48 X /0 ~SL' = L1;q~ (U0-~o)
As discussed in Section 3.4.4.1 and Section 4.5.6, the effect of
the shaft face, according to Panet, 1974, is to provide a "fictitious" in-
terna1 support pressure of roughly (2/3) po. Thus, if the lining is
assumed to be poured right up to the excavation face, the liner instal1a-
tion will have taken place at a closure appropriate to a support pressure
of Pi = (2/3) po. If no further factors were involved, the lining
would then deform according to its stiffness to produce an equilibrium
support pressure of about 1100 psi as shown on Figure 16. However, Abel
calculates that the combined effects of concrete shrinkage and creep give
rise to a radial closure of about 0.25 inches. Shifting the lining
reaction curve by this amount, gives an equilibrum support pressure of
about 740 psi. This has been referred to as (Pi) max., as it represents
the maximum possible formation pressure which could develop upon the lining

I
71.
if the lining were poured right up to the excavation face and in perfect
contact with the rock. In reality, some gap will exist between the end of
the lining and the shaft face, allowing some additional inwards deformation
of the rock to occur before the lining is placed. A rough approximation to
the amount of additional closure occurring due to this gap might be obtain-
ed by assuming that the full shaft closure of approximately 4 inches would
occur with an unsupported gap of about 4 radii from the face (Panet, 1974),
and simply pro-rating this closure according to the unsupported gap actu-
ally left. By this very crude method, a gap of about 1-1/2 ft. would ac-
count for an additional wall closure of 0.2 inches, shifting the origin of
the lining reaction curve by this amount and producing an equilibrium sup-
port pressure of 550 psi, as measured in the field. Even without this
refinement - more properly considered as fiddling - the results of the
characteristic line analysis are very encouraging. The analysis indicates
a predicted upper limit to the formation pressure which could be expected
of 740 psi. Design of the liner to resist this stress could justifiably be
undertaken with a reduced factor of safety, in the knowledge that the
actual liner will not be installed flush to the excavation face. On this
basis the factors of safety for the 24 inch concrete liner, based on a
5,000 psi concrete compressive strength are, from use of Lame's thick-
walled cylinder equation,
for (Pi) max. - 740 psi, F.S. - 1.35 for (Pi) actual - 548 psi, F.S. - 1.82
Thus, use of the characteristic line method to determine a maximum
formation pressure, and use of this pressure to design the liner on the
basis of a factor of safety of 1.3 to 1.4 appears justified as the actual
factor of safety will then be higher than this, depending upon how much gap
is left between the shaft face and the lining. The advantage of the

72.
characteristic line method is that it provides a fairly complete picture of
the shaft lining response, such that the effects of changes in construction
sequence or modifications to the lining stiffness can be reasonably assess
ed, providing a rational basis for decisions. Abel's method has the advan
tage of simplicity, but provides only a "single-point" answer, for which
prudence would suggest that a somewhat more generous factor of safety be
used.

73.
5.0 FURTHER WORK
It is not intended in this section to provide an exhaustive listing
of possible extensions to the question of shaft analysis which could be
undertaken. Numerous areas of deficiency are undoubtedly evident upon read
ing of this report. However, during the progress of this work two major
concerns were persistently encountered which would benefit greatly from
further investigation.
The greatest single deficiency is the lack of well documented case
histories on shafts. Considering the antiquity of shaft sinking, the vast
number of shafts which have been sunk, and the high cost of the substantial
linings which are normally placed, this is a somewhat surprising lack. As
with any area of geotechnical engineering, it cannot be presumed that any
analytical methodology provides an adequate model of reality until such
methods have been tested against the actual performance of structures. The
lack of published data on shaft performance, including adequate detail on
formation material properties, in situ stresses, and lining response repre
sents a serious stumbling block to the validation of appropriate predictive
techniques for formation pressures. Research field programs aimed at gath
ering such data must be considered a high priority if we are to advance to
a state of rational lining design for shafts.
A second area within which research work would provide significant
benefits is the utilization of numerical techniques capable of including
the three-dimensional effects occurring near a shaft face for the purpose
of calibrating or correcting the more simply based two-dimensional analy
tical techniques. The latter have the benefit of relative simplicity and
speed, and hence may be inexpensively utilized. However, analysis of the
stresses, deformations and generation of plastic zones at or near the shaft

74.
face cannot be undertaken by simple models, and require that the 2-D models
be corrected for 3-D effects based upon a more complete understanding de
rived from numerical modelling. The work of Panet, 1974, while useful in
this regard, deals only with very limited cases. Recent numerical models
suggested by Hanafy and Emery, 1980, appear useful as a basis for a com
prehensive assessment of 3-D effects, time-dependence, liner placement se
quence etc. which would provide considerable benefit to the correction and
calibration of 2-D analytical approaches.
The above two areas are viewed as high priority research needs.
Beyond these, many areas of fruitful and important research may be envi
saged. The question of shaft lining design for drilled shafts utilizing
stabilizing muds and jacked-in liners is becoming of increasing importance
as drilling equipment becomes available for the provision of large diameter
shafts. The increasing use of subsurface space for housing a wide variety
of facilities, often at considerable depth and with stringent operating or
safety requirements, is evident in such schemes as radioactive waste stor
age, compressed air energy storage, and underground mining of tar sands
deposits. In all such projects shafts will provide the lifeline link to
the surface, and the assurance of adequate methods of designing such shafts
will be an important responsibility of the geotechnical community.

LIST OF REFERENCES
Abel, J.F., Dowis, E. and Richards, P. "Concrete Shaft Lining Design" 20th U.S. Symp. on Rock Mech., Austin, Texas, 1979
Attewell, P.B. and Boden, J.B. "Development of Stability Ratios for Tunnels Driven in Clay" Tunnels and Tunnelling pp. 195-198 Vol. 3, No.3, May 1971
Barron, K and Toews, N.A. "Deformation Around a Mine Shaft in Salt" Proc's. 2nd Can. Symp. on Rock Mechanics, pp. 115-134, Kingston 1963 ~-=-=-
Brockenbrough, R.L. "Steel Linings for Deep Mine Shafts" Trans. Soc. Min. Engs. AIME Vol 258 pp. 132-136, 1975
Broms, B.B. and Bennermark, H. "Stability of Clay in Vertical Openings" Proc's. ASCE Soil Mech. and Fndtn. Eng. Div., Vol. 193 Part 1, 1967
Coates, D.F. "The Effect of Stress Concentrations on the Stabili ty of Tunnels" Proc. lst Congr. ISRM Vol. 2, 1966
Coates, D.F. "Rock Mechanics Principles" Dept. Energy Mines & Resources, Mines Branch", Monograph 874 Revised 1970
Collins, S.P. and Deacon, W.G. "Shaft Sinking by Ground Freezing: Ely OuseEssex Scheme, U.K." Proc. lnst. Civ. Engrs. Supple No. 7506S, 1972
Collins, S.P. "The Three Valley Aqueductin Tunnel" Tunnels and Tunnelling Vol. 4 No. 5 pp. 441-445, 1972
Curtis, D.J. and Rock, T .A. "Tunnel Linings-Design?" in: Computer Methods in Tunnel Design, Inst. Civ. Engrs., 1978. Symposium on Shafts and Shaft Sinking. The Chem. Metall. and Min. Soc. of South Africa, 1948/1949
da Fontura, S.A.B. "Time-Dependent Response of Rock Masses During Tunnelling" Ph.D. Thesis, Univ. of Alberta, 1980
Daeman, J.J .K. "Problems in Tunnel Support Mechanics" Underground Space, Vol. 1 pp. 163-172, 1977
Dahl, D. and VOight, B "Isotropic and Anisotropic Plastic Yield Associated with Cylindrical Underground Excavations". Proc's Int. Symp. on Large Underground Openings, Oslo 1969
Deere, D.U. et al. "Design of Tunnel Liners and Support Systems" Nat. Tech. Inf. Service PB183799, 287 pp.
Deere, D.U., Peck, R.B. et al. "Design of Tunnel Support Systems" Highway Research Record No.339, Transp. Res. Board, Washington, 1970
TN s s:<:t~6Z
"\Id 70~ lS;c

/
Desai, C.S. and Reese, L.C. "Stress-Deformation and Stability Analyses of Deep Boreholes" Proc's 2nd Congr. ISRM paper 4-13, pp.475-484, Belgrade, 1970
Dixon, J.D. and Mahtab, M.A. "A Method for Computing Stabilization Pressures for Excavations in Incompetent Rock" U. S. Bureau of Mines. Report of Investigation RI8128, 1976
Dschandshgawa, J. et aL "The Results on Rock Pressure of Deep Mines of Tkibuli-Shaori (USSR) Coal Deposits" Proc. 2nd Congr. ISRM, Theme 4 No.10, Belgrade, 1970
Fairhurst, C. and Daemen, J.J.K. "Practical Inferences from Research on the Design of Tunnel Supports" Underground Space Vol. 4 No.5, pp. 297 -311, 1980
Florence, A.L. and Schwer, L.E. "Axisymmetric Compression of a Mohr-Coulomb Medium Around a Circular Hole" Int. Journal for Numerical and Analytical Methods in Geot. Eng. Vol. 2, pp. 367-379, 1978
Galanka, J. "Problems of Shaft Sinking in Poland" Op. cit.
Galle, E.M. and Wilhoit, J.C. "Stresses Around a Wellbore Due to Internal Pressure and Non-Symmetrical Geostatic Stresses" Soc. Petrol. Eng's Journ. Vol. 2, No.2, pp. 145-155, 1962
Golder Associates and J.F. Maclaren Ltd. "Tunnelling Technology: An Appraisal of the State of the Art for Application to Transit Systems" Publ. Ontario Ministry Trans. and Comm., 1976
Gooch, A.E. and Conway, J.P. "Field Measurements and Corresponding Finite Element Analysis of Closure at the Lucky Friday Mine in the Coeur D'Alene District, Id~ho" U.S. Dept. Interior, Bureau of Mines, Research Report R18193, 1976
Grieves, M. "Shaft Sinking at Boulby Mine" Tunnels and Tunnelling pp. 32 -34, July 1974
Hanafy, E.A. and Emery, J. "Advancing Face Simulation of Tunnel Excavations and Lining Placement" Proc's 13th Can. Symp. on Rock Mechanics, Toronto, 1980
Hebblewhite, B.K., Miller, H.D.S., Potts, E.L.J. "A Method for Predicting Time Dependent Deformations in Evaporite Around a Vertical Shaft" Proc's Conf. Rock Eng. Brit. Geot. Soc. Vol. 1, pp. 529-539, 1977
Hoek, E and Brown, E.T. "Underground Excavations in Rock" Restricted Circulation Draft: to be published by Inst. Min. & Met., London, 1980
Horvath, J. "Calculation of Rock Pressure in Shafts and Roadways of Circular Section" Int. Journal Rock Mech. and Min. Sci. Vol. 8, pp. 239-276, 1971
'\.~ -, os f \~

r- ,
Hulshizer, A.J., Desai, A.J., Dave, B.J. "Drilling and Lining of Ocean Shafts - Seabrook Power Project" Proc's RETC, pp. 148-168, Las Vegas, 1976
Jacobsen, S. "Pressure Distribution in Steel Lined Rock Tunnels and
!l /~ 0.-1: <;flI( C 'V i aeger, J ••
Int. Water Power and Dam Const. Vol. 29 No. 12, pp. 47-51, l ! q t 9) f> II:( R
"Elasticity, Fracture and Flow" J. Wiley and Sons, 1956
Shafts" 1977
Kaiser, P.K. "Effect of Stress History on the Deformation Behavior of Underground Openings". Proc. 13th Can. Symp. on Rock Mechanics, Toronto, 1980
Kitamura, I. (ed.) "Tunnelling Under Difficu1 t Conditions" Proc' s Int. Tunns. Symp. Tokyo, 1978
Ladanyi, B. "Use of the Long-Term Strength Concept in the Determination of Ground Pressure on Tunnel Linings" Proc's 3rd Congress ISRM. Vol. II Part B, Denver, 1974
Ladanyi, B. "Direct Determination of Ground Pressure on Tunnel Lining in a Non-Linear Viscoelastic Rock" Proc's 13th Can. Symp. on Rock Mechanics, Toronto, 1980
Lambert, R.N. "High Speed Shaft Sinking in South Africa" Proc's Tunnel and Shaft Conf. Ed. D.B. Yardley, pp. 195-214, Minnesota, 1968
Lombardi, G. "The Influence of Rock Characteristics on the Stability of Rock Cavities" Tunnels and Tunnelling Vol. 2 No.2, pp. 19-22 and Vol. 2 No.3, pp. 104-109, 1970
Lombardi, G. "Dimensioning of Tunnel Linings" Tunnels and Tunnelling, pp. 340-351, Vol. 5 No.4, July 1973
Longden, B.A. "Current Techniques in Deep Shaft Sinking and Development" Can. Min. Journ. V. 90 No.3, pp. 61-65, 1969
Mayo et a1. "Tunneling - The State of the Art. A Review and Evaluation of Current Tunneling Techniques and Costs with Emphasis on Their Application to Urban Rapid Transit Systems in the U.S.A." U.S. Dept. Housing and Urban DeveL, Contract B-7'66 NTIS: PB178036, 263 pp., 1968
Morrison, R. and Coates, D. "Soil Mechanics Applied to Rock Failure in Mines" Trans. CIM Vol. 58, 1955
Muir-Wood, A. "The Circular Tunnel in Elastic Ground" Geotechnique Vol. 25 , No.1, pp. 115-127, 1975
Onischev, U. "Ground Stress in Vertical Shafts" Ugul, Dec. 1959 (in Russian)

,-
Ostrowski, W.J. S. "Design Considerations for Modern Shaft Linings" Can. Min. and Met., Trans. CIM, Vol. LXXV, pp. 184-198, 1972
Pack, P.D. and Skinne'r, E.H. "Design Review of a Rectangular Shaft In Alluvium" Proc's 17th U.S. Symp. on Rock Mech., Utah 1976
Panet, M. "Contribution to the Design of Tunnel Support Behind the Face" proc's 3rd Congo ISRM Vol. II Part B, pp. 1163-1168 (in French), 1974
Peck, R.B. "Deep Excavations and Tunnelling in Soft Ground" State of the Art Report, Proc's 7th Int~. Soil Mech. Fndtn. Eng., Mexico \~ 710 Al A( 1969 (
Pender, M.J. "Simplified Analysis for Tunnel Supports - Discussion" ASCE Journ. Geot. Eng. Div., Vol. 106 No. GT-7, pp. 833-835, July 1980
Poulos, H.G. and Davis, E.H. "Elastic Solutions for Soil and Rock Mechanics" J. Wiley and Sons, 1975
Prater, E.G. "An Examination of Some Theories of Earth Pressure on Shaft Linings" Can. Geot. Journal Vol. 14 No.1, pp. 91-106, 1977
Redpath, J .S. "Sinking the Creighton No.9 Shaft at Sudbury" Min. Congr. Journal Vol. 57 No.3, pp. 66-70, 1971
Shtein, M.S. "The State of Stress Near the Bottom of a Mine Shaft" Soviet Mining Science Vol. 9, pp. 123-128, 1973
Sibson, J.N.S. "Photoelastic Investigation of Shaft Stress Changes Due to Mining" Trans. Ins t. Min. & Metallo Sec tion A. Min. Ind. V. 77 No. 1, pp. A34-A36, 1968
Swaisgood, J.R. and Versaw, R.E. "Geotechnical Investigations for Mine Shafts" Mining Engineering Vol. 26 No.6, pp. 37-40, 1974
Terzaghi, K. "Theoretical Soil Mechanics" J. Wiley and Sons, 1942
Trollope, D.H. "The Stability of Deep Circular Shafts in Hard Rock" Proc' s 2nd Congo ISRM Vol. 2 paper 4-39, Belgrade 1970,
U.S. Department of the Navy. "Design Manual: Soil Mechanics Foundations and Earth Structures" NAVFAC DM-7, March 1971
Wagner, H. "The Application of Rock Mechanics Principles to Strata Control in South African Gold Mines" Proc. 10th Can. Rock Mech. Symp., pp. 247-280, 1975
Walz, B. "Discussion" Can. Geot. Journ. Vol. 15 No.3, pp. 438-440, 1978
Weehuizen, J .M. "New Shafts of the Dutch State Mines" Symp. on Shaft Sinking and Tunnelling, Inst. Min. Eng., London 1959

r
Westergaard. H.M. "Plastic State of Stress Around a Deep Well" ~ostO.Jl
Soc. of CWo Eng. Vol,. 1tXY-II_No~. Jan0 940_ in Contributions_ to SOr~Mecnanics,_1925-l940
Wichur. A. "Rock Pressure on the Shaft Circumference as a Normal Stationary Probability Function Archiwum Gornictwa 6.1. 1970
Wilson. J .W. "Shaft Sinking Technology and the Future Needs of the Mining Industry" Proc's RETC. pp. 103-125. Las Vegas. 1976
York. B. and Reed, J.J. "An Analysis of Mine Opining Failure by Means of Models" Trans. AIME Mining Branch V. 196. pp. 705-710. 1953
Zahary. G. and Unrug. K. "Reinforced Concrete as a Shaft Lining" Proc. 8th Can. Rock Mech. Symp •• pp. 265-282. 1972

ADDITIONAL REFERENCE MATERIAL (Sought But Not Obtained)
Buchanan, J. "The Load Cell Installation in No.3 Mine, Dominion Wabana Ore Ltd. Bell Island, Nfld" Mines Branch PM 194, 1955
Krupiennikow, G.A. "Some Methods, Results and Investigations of the Co-operation Between Rock Masses and a Shaft Lining" In volume Rock Mass Pressure Acting on the Lining of Vertical Shafts, Moscow 1963 (in Russian)
Kyoto University, Memoirs of Faculty of Engineering, Vol. 21, Part II, 1959; Vol. 23 Part I, 1961; Vol. 25, Part II, 1963
Murty, N.P.L. "Earth Pressure on Shafts" Journ. Soil Mech. Fndtn. Eng. India, Vol. 9, No.4, pp. 435-443, 1970
Talobre, J. "La Mechanique des Roches" Dunod, Paris 1957
Unrug, K.F. "The Measurement of Strains, Stresses and Rock Mass Pressure Applied in Mining Openings" Budownictwo Gornicze No.2, 1970 (in Russian)
U.S. Army Corps of Engineers "Tunnels and Shafts in Rock" Engineer Manual EM 1110-2-2901, 1978
Walz, B. "Active Soil Pressure on a Cylindrical Caisson Compared with Model Measurements" Proc's. 6th Conf. on Soil Mech. and Intn. Eng. Vienna, Austria. Vol. III, pp. 669-672, 1976
Walz, B. Ph.D. Thesis, No. 083, Univeristy of Berlin, 1976

SminDU
I
I
I

' 
",,,rIRIAt. C"'''IPACr~R/ r ArION F.¥rFNr 0': ~""'O/AL. '!sTRIf·5~ 51RI!'551!'S Srlfi'~5:51!"!!S 1 p~A5r/<: rI!JROKFN) 4r ,'N IN
~~A$r/c ('INTACT) PLA5 r;C/I!JROKEN) Ze'llVr. ~/.45'/' "A 4.~rl'C ~,£A!;jT;C Zl:JNc pt.ASr"/C ZONE
.Nr~;"'J!."At::~ rONI ZONE - /""i'!"' - i'l-"" J"""4' ~ r ::s ClIO /j-" ::: r:!::; r~
"'A~'- :i ..,;:JZ!. .....
It ~d~ ~I"/N<!'AR'I r ....
_ ~""'MI!J
r;j.~ -~_:M,:~-!lJNpp-; c., ./r ~i_1 or, -
4f--r._$~ C~fOM~ i'P.' ~ _SCp) ("io - ~q;.)
5. ~ 'y~ 0'.,. ./ ~. .- N~-/ -A4IJj,-/ 0; -~ ... 4:p)(~)~-~ !!1e;.. A6ft--'('''''''' on)
~ "'" -P"(~-/,JAo/~~ .. ~ I'd ,c,'AS£" i? _ t·e,.
06.~~ .. ~y~}-1J,-! ~p e;
"~"ltIl 0'
~_c,., _~ r,. •
I ,I: .... ; .. HVR~ ~ """"-I 'i;?''''''~~--~~1~-1 PARAI!JO£A ~ -1't7,.' (~S .. JilIpA> ) ~;!"=
I"" 4 (T ?p.- · "5,;-~ (.P" -MF~) -t .... /n"',fl- $/n"!o t7; -/1,-4 - tJ;,,}(/2;?)' "-4/-4-
~- JIjm / .H~ -/iM,o."tf.-JI2-/J7h-o 0; .,q,"4-'%-)(~) 2
.!::~6'C 2
4tZ_'_~i -'V ~ ~. 0; • ~'ffnr;-J/~ ~ 1'I!! t-';'~(~t7;p.' ''!WJC~J}
If- ( ..... ~}.~,fI;c;;".,.A!v- or;!" • f/nf{. -fHfp<l-~' .. ~q; r;! -j , ;....-.,,~"" " PO ~ I} 'T ",,~,.,: (Po - A~o;.)
,*,N-II1;"Jr,."'~/tf .. ~J. ~ 4".l§ ... ~4'~ f' ~/J(;~J ;V=I-(m",If~ f'!!S,tJtf'-""'tfrA~}J o;,-P;--fptfd; .. ~~r,)J
I
(mpl ~)e ::::::::'r;~:r ""'If I
IHOEK- BROWN PARA80~AI
CASS:: 4-~~~v ~~.~~.(~K!:"~~~.':-!£]
'I' (~/GllJlr~ ·.,DW""tJIIC"/j;-~hc/
~-p'. i) gJ.o
~'r;'~ -oc- - o;.~. (-0 • ~ ~ t7; ~,,( '~) I~ j q;} "
& ,( '\ os ',LJ ,.q;.;;f~/1(;)J 4-2',;- tT
N .... ·/ --
F/9'vre e MATER/AL CNARACTER/ZAT/ON5 ANO STRESS ANALY5/5 E~UAr/ON5 FOR rUNNELS - SUMMARY.

MAT,RhlU. CNA,vACTE,v/ ZA T/ON R4P/AL D/.$<1,(AC~- RAr/O O.c APERA6E ""AD/At: MENT"', ,oLA~T/C O/l'.4T/0/V TO PLA~r/c O/~P'4CGMIFA./r
,0£ AS T/C/LlROKt!'IV) EL A~#ljr/~ P'{;4$ r/c .r'/A:5T/C O/L.A T/ON 4T W4~,(. or CAv/ry
'LA:lr/c ,/NTACT) I,vTEPr-Ac r ~HrA"" ~rRA/N rONE ZONG -ut!" - /' . ~4V - d J/,o/J/,o -u/-
cASE' Z '" t (/,;'~ ~~'A~~ _ c"",,""M'LI
ul'. c., _ . ..
~~ fj~")r'McOC Dc = -$/nfd" ~ .,,,,-.JItr.~ ,=-~~,!,~19 E
t:.. ret!- "'9ik oc ,,/ ~- 4· ...v"",,-/ ~-/ i!!!6"-"'I- -.", I'~'~ +A» ~-~ 2(~#,)(~,.hf "'" ·P"I'''''-~Ao/~~ .. ~
£"ASE g _ t·&P-/!~f;F~if;~ I
Hi· 'if-f/; ~.n:J'J &
tK-1P''lfJ tr '«-fN)
w~,...,. _h~~ : .;, 41 ~or .t!f!!! ,o~",it: ~"n16 A.(r '% - ~4,..}(r~)r !!io-..... ;oo;~ .. -~- ~. 0 .... , I~/ANVA'''TJ '" ~ A.f6 ... -/ ~ ,' ""'~.< ff I ,oAAALI""~ "" ..... "'7'7 r I'~$ '" ~n ) ~)r,~Pi:
l'e;-"~~)II-~-I u,. 4 .,./7' ~~N)·e Pn;-fN)//I(~.) -/,. iI/n4//- .-U/7.tt!c ~ ~
n-4/-4 ~~r ~"'A-,o"""I'.:.p-L .. r/liH
'"'" -p,.,,~.Af -/~-/)~/) ~ .~ r~~.> Y.r
~<'-3 ~-fN) e 1.1 04:-fN)
~ ~1j- 4V 0;
~-d;,.~o;~,.~tE')l ON· q- , ...... ~).~II';i::""" __
~. __ -1'11.,0 ___ 1_ # /n~~A-~ dj t7j
a"'V)'i!-MNQi
1>0i.~.y~4'~ l-:lptJi?! E "fof4(117p~.h I-~I')e
~·II1:"1~Hfo~/~ .. ~.;J-~ (~J 5p)~ ::!.Zc;;~:~t'r [NG'EK-8A>CW/v PAA>ABP~A J
C:~J5£: 4-
z-' ~R;~~_~.d':'£;I'~ (;-~K;~N;;'.~(J
(£o/Dsr/c: ~~~~,./"".,.c:V09"'<: ) a,-r;,. v Jr .... (fo/ 0 , 0 <"'m- ~ n 14' a 1if//!A7'J 111 - 0 E c:
V .~~L---.• 0-
I .... h~r<t'"" e A -(Z LLt-1:,.)(;-'/'.)? . ~ /'~
N ... ·' 4- ~~c
~/9vre 3 MATER/AL CNARACTER/Z4770NS ANO LJEFORMAT/ON ANALYS/S Et;1UAT/CJN5 r~P rUNNELS - SUMMARY.

/.6
1.4
/.z
~ /.(7
-I-
'" VI ~ all
~ 'l)
(7.6
~
r:;:;:;::-' -------.- ------.-~ ~A~/MV"" EXTENT o~ P<AST/C ZON~ ______ ___ _
\ 'L==: &p <30' i ~
c/-' = 0. O/Pc I t;o (?"
Z ~~."'5~{C_ BENA~/OU~ I " ~ --. --_ ... -?] I " 0,.; @Jp. :: 0.32,q . -'- - -' 1~ -.. -- 0 I "-. I --, ':-- I
.. . - . _._-----_. __ .. (})- //7//'/0/ a:?/7c:::V~/O/7
0- O/7.5er 0/ p/O'.sr/c/~¥ c» -Md.K//77U/77 exns-nr oJ' p/O'sr/c ~O/7e_
l:? cO; "~(jfE)A' =.41-----.-.-.--{jj!' ::: __ ?-~~" __ =I'L -'" - -- ----7t-~ -==--' =---=-=:=::-..:=-.=--'= '-=~=~--'-'-1-'-'-'-'-'-'---'-' - ' .--" 0'
.I /
1. 0
/' /'
2.(7
0-e :..t'
J.o 4.0
RO'd/~/ . .,.
:5.0
r' ~
?:l:f: ~ 6'~ .. .!J.5" OC .. o_~~
CI!' OC (T (et!''' a /3~) ~~A57"/C BcNAV/OV~
6 .0 70
Figure 4 E.YAMPl.E OF srRE55 OlsrRIBUrlONS WITH REDUCING /N7"ERNAL SUPPORT.
tJ.tJ

"0/,77/ '.gCY/7S07.:;:J 7f7'/Of7'tiY
E 't:J Z "() / -p t:J
I~~~-===========I==:::::::::::::::::I~------------~;p cb
.:aOu.oa.:?/~S-,o/d- -=?/~S,o/5'
.:;;avpa' ://T"S,o/.!? h"//17.:::1'"

a::u?,;"../a.,t Gi'/
=?/.,IS.o/c7- '=>/.,IS,o/j:.
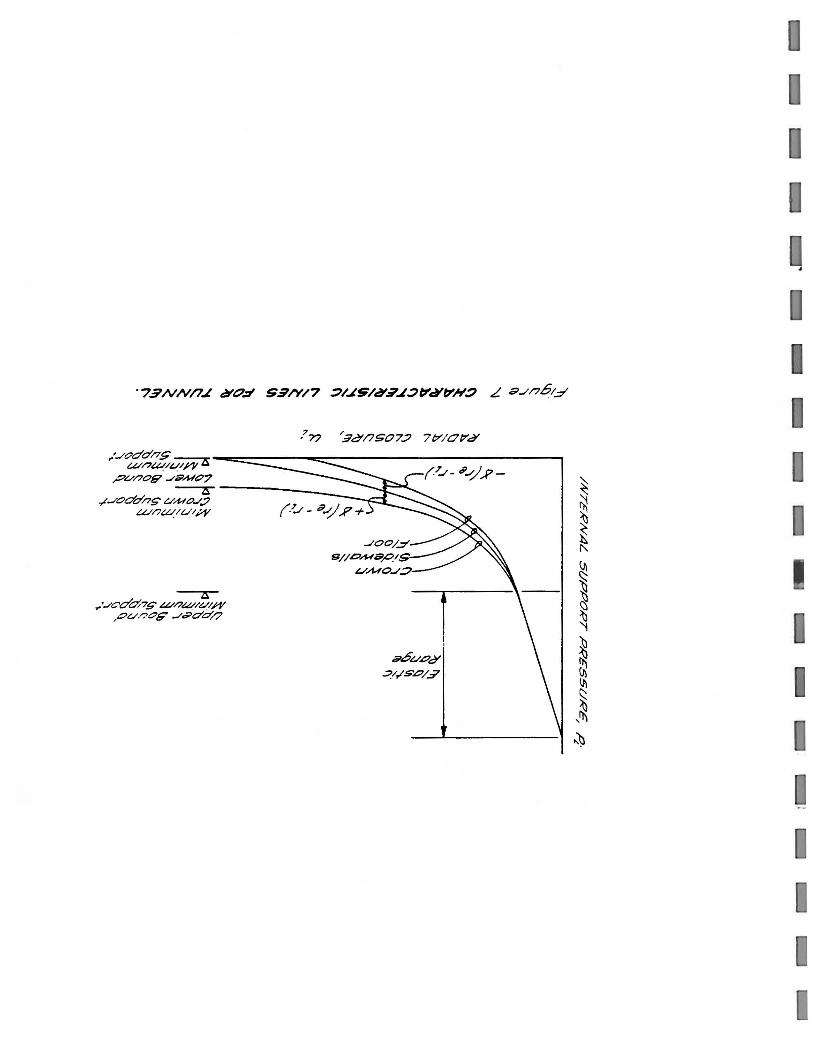
A .,.·../C'da/§' a///U!//u/-'1'
.,.?V/7cG' ..-/~dd/7 1 !

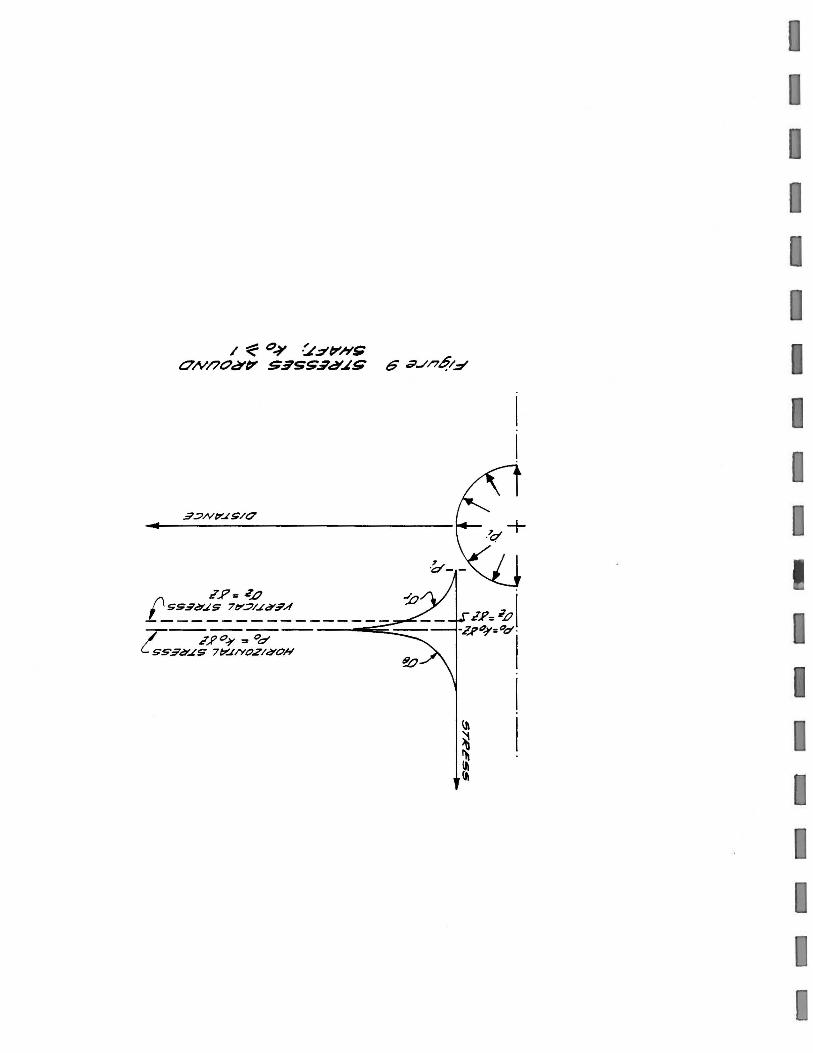
I ~ 0..y ·~.:rtl"H$; C7N/70eYt!' S3SS;;?~~S; G ';..//7~/.:T'
2"R: &7.0 I -U .... ·""I
I

· f.:;;; "¥ ~~e;/'t9 ON/70&l'IJI' S3!;S;,;~~g 0/ ;J/7~/~
-'( \ .
r' ," ~"U'/~/'
:7, .. sc/d
.f :;:. o~ ~..3f?'HS; c7N/70dl? S;~S;S.?d~~ .7/~SI?77
- .?"RD.j' ~ "'.::7'-5G;t:!JU$ 7""J'NOZ/a-ON
J

I
";;NOZ .;J/~!j;f:?'7d .:70 1V0/j.l7'N/Nd';;~';;d // ~J/?~/=,
"~
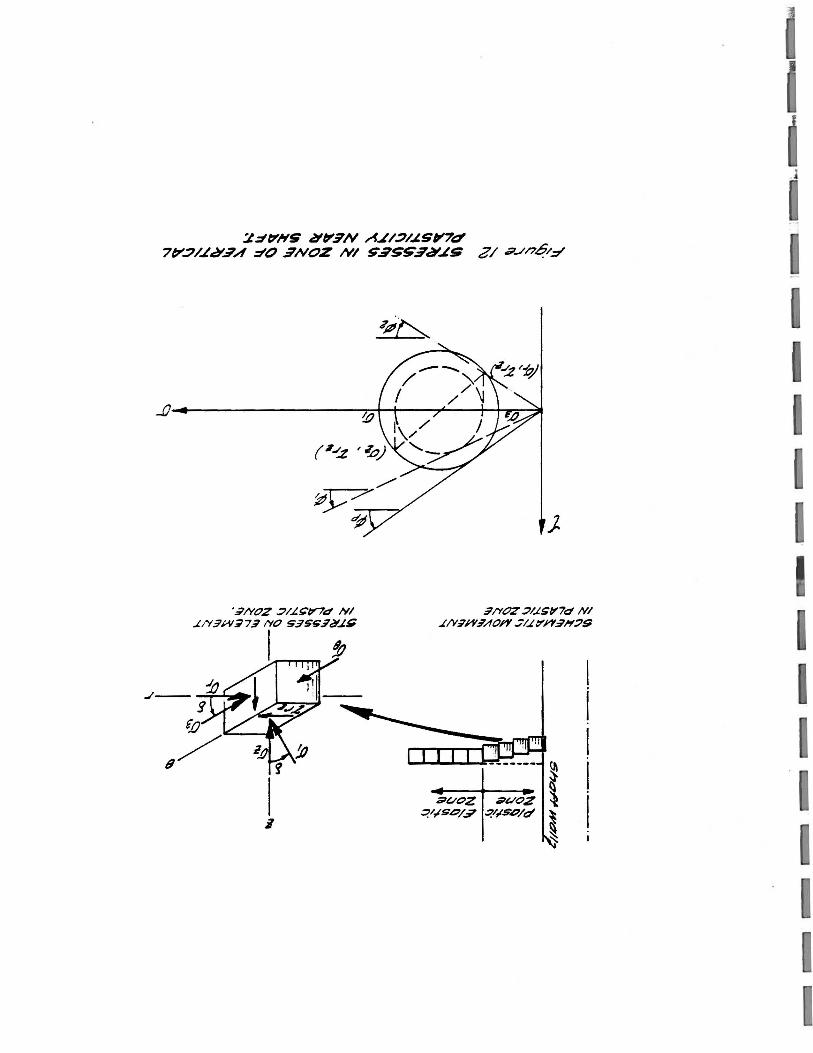
2~t1'HS 1lJ't1';/V A~/:;J/~SI1'7d 7f?'.:7/~dI';A :1'0 ,;NOZ /V/ ~';!;;!j;,;~~S; Z/ 3..//7Q/d
-O.~----------------~~~4---~---+-h~~
'~IYOZ ://~>t:rId /'II ~,.ygVY~7g /YO !;gSS;t3'~_
I
j.
gIY(/Z :7a!:~7d /'II LIY;W;/fOI1' jlL ~""'~I'f:7~
,
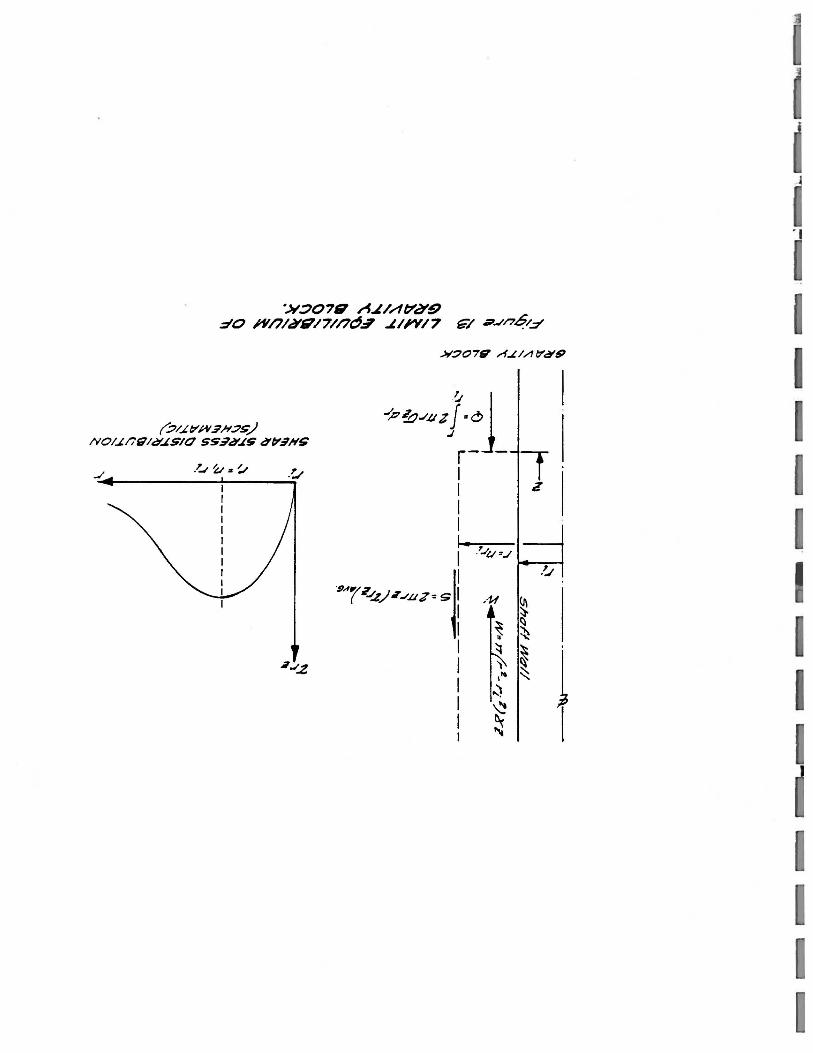
·.>t'::J07/iT A~//I~e)'9 ~o PY/J/t¥/?/7//JC; ~//IV/7 G'/ ;..;'/7~/~
r;7/~ f7P1 g#.:?~/ NO~~~H~~aSS~~~S~~;NS
-oj r- --I I I I I. 1 I . ;.tv "oJ'
I I /14 I .~
I ~ I
~ I I
,'-
,,~ I ~ I ~ I
f J
.'../
~ ~ -..:
~ ~
I
1 I

· 7f?/d'.2U l?'W SS;~7IYO/S;';h'0:7 N/ ~.:Tl?'H9
: >.:7~/7S;S;';~d ~~Odd/7G W/7PV/N/;f' :17/ ;.J/7~/.::7'
"/L6/ :t-ne? .7"'~A"'N ~8/Y /# .. -17;(7 ~;17 . _J;i!JI
·V.J 'C'/~t?'tiJ' H~d3d C/ 9 t? Z o ~--~~--~--------------~--~--~--+o
/,j --~-----------------~~ . i ~,,~.a¢1 . ./ , -.--I . .'-1 ~-;':-~I ~
?"tJ
----~ ---~,,~z=~1
81:7
2'1
(.II
~ ~ ~ ~ ~ ~
~ ,C't\
9/ ~ ,~
~"Z

'5'.:;;?tJI'.;,Id'ns 3~/77/tJI'.:7' 7/:?'/~N.ii'~Od 7t?'.:;J//V0:7 ~/ ~.//7~.J"
-' . '

:L.::TI1'HS .3N/W d'07A""~ ~W ~7.:TA;7 ;y ZG'O. d'O.::r .;i'/v/7 ~/~t;/CJf':;J.::JI?'d'/?"N;:;J 9/ .?../np/..:r
'0"-':/"-':// CiI.,/ii1../.:7UO.:7 ../0/
. ~/ 53 ·0 ....... d'8CP./.:7 PUD a6D"""~/,/~S; ;;~a../.:7vo.:?
CiI~// .;;v/7SO/.:7 'S;4 ii1..//7ss;vd p~//dd~ _ •• -
~~U::)4'S;; PV/70../D ':':70./ ../0/
CiI~// ;;;1..//7S0/.:7 'SA .;;unss.:;../d .,/.Joddn~ ---
~ _, .~..:. ' ii'
/.;;;>/1CP7 # 2t;c?E ~ .:) r :~ " :. . I".
, ; ' "
dT/70//1 t?'H;?g ,:?/~S;;17'7d
C/ /70/ /. f?' hI!?f' :7 / ~ 51?' 7.5'
'b'(ii"/,?/ : .G>:7.o~ ~p cp..//7Ssa../o ~OOt://7S ~ua/DA.//7b.:#f
0
ttl . !~ "
I~ '
i~ :~ I~ Ot7.{" .~
i~ ~ :~
,~ ~ ~ I~ ~ (\.,
~ -~/~
~ ~ ~ ~ \J\
~ \7,{/ ~
\ <II ......

r--
APPENDIX
PAPER BY ABEL, J.F; DOWIS, E. AND RICHARDS, P. - "CONCRETE SHAFT LINING DESIGN" 20th U.S. SYMPOSIUM ON ROCK MECHANICS,
AUSTIN! TEXAS, JUNE 4th - 6th, 1979

!!".,
I
:~CRETE SHAFT LIN I NG DES I GN
J.F. Abel Jr., Colorado School of Mines. £. Dowis, Gulf Mineral Resources Co.; and =. Richards, Jenny Engineering Corp.
-'.i5 pappr was presented at the 20th U.S . Symposium on Rock Mechanics. held in Austin . Tpxas. June 4-6. 1979 . The matPriai
. ~ject to correction by the author . Permission to copy is restricl.ed to an abstract nf not more than 300 words. Write '
'. Ken Gray. U. of Texas at Austin. Petroleum Engineering Dept
.;BSTRACT
Instrumen~e.tion placed at three :evels in the concrete linino of the l4-ft 1.0. shaft at the Mt. Taylor-Mine permitted :~ecking which lining pressure eq~ation " ~st fit the particular geologic conditions.
iobre's (1957) lining pressure prediction _~~ation for clastic rock most closely 3?proxirated the ~easured results. The ::ohr-CouloY"'b st!"ength criteria appeared to ~est describe the strength/confinement con:itions outward into rock adjacent to the 14-ft Mt. Taylor shaft.
:~':'RODUC':' IO:l
Traditional shaft support has been ~i~h either timber or steel sets or a cast :cncrete lining. Steel and timber sets are much more flexible than concrete. :his results from (1) the low compressive strength, typically 250 psi across the :,rain, of the tiMber blocking ... ,hich braces :he SEtS against the rock, and (2) the ~lgh elastic flexibility of steel or timber sets. The stiffness of concrete, after :uring, is much higher than any composite structure of timber blocking and steel sets. It is this feature of concrete which :omplicates the understandinn of concrete lining design. -
Irrespective of whether steel, timber ~r concrete is used for shaft support. the very nature of the shaft sinking cycle ~e~erally results in the support being installed fairly close to the sh~ft bottom. !n Eorth America:1 sink inc oractice con:r~~e lini:1g is seldom m;r~ than 20 ft away !rom the shaft bottom. A zone of "stress ~~ieldina" occurs near the shaft bottom ·' .lich i ~nefits sinking in weak ground.
~e=ences and illustratlons at end of paper.
The elastic analysis of Galle and Wilhoit (1961) demonstrated that the elastic stresses in the wall "as close as 2.9 radii from the bottom agreed well with those calculated by the plane strain solution". They also show that the tangential stresses at the shaft wall within 2.9 radii above the shaft bottom 3re less than predlcted by the olane strain solution. The 2.9 radii interval above the shaft bottom represents the elastic "shielded zone". They state, "ThErefore, the plane strain solution may be used to calculate the stresses everywhere around a well bore except very near the bottom or the top." The "shlelded zone" allows the concrete to be poured and to cure at least partially, before full ground stresses are applied. This zone of stress shielding advances with the sinking of the shaft. Galle and Wilhoit also show a zone of elastically higher stress below the shaft bottom. This higher stress zone extends approximately the same distance below the shaft bottom.
7he sho~t length of the elastlc shiel~ zonesUp~0rts the traditional assumption that the influence of the shaft bottom stress deviations can be ignored in shaft lining design. Measurement results from the Straight Creek pilot bore (Abel, 1967) give a vastly differe~t picture. Ground stabilization occurred at an average distance behind the tunnel face in excess of 40 radii. Abel and Lee (1973) reported the onset of stress ahead of an advancing tunnel in excess of 14 radii. In contrast to the elastic predictions, the response of a rock ~3SS to driving a tunnel or sinking a shaft is apparently non-elastic, as shown by the greater influence distances in rock.
The sequence of loading for shaft linin at the Mt. Taylor Mine of Gu!f ~ineral Resources Company near Grants, ::ew ~exico, indicated a progressive loading of the linin which related to the incremental deepening

of the shaft and advance of the stress shielded zone. Figure 1 presents an idealized representation of the progressive development of ultimate tangential stress in the rock mass adjacent to the shaft wall as the shaft is deepened. This representation has been inferred from measurements of the progressive increase in concrete lining stress. It has been assumed that the overburden stress acts uniformly on any horizontal plane.
LINING PRLSSURE PREDICTION
Steel sets are blocked against the rock at a low loading condition and concrete is poured against the rock under no load. In both cases the rock mass has to deform against the support before significant support loads develop. A flexible support capable of yielding when subject to the deformation of the rock adjacent to the shaft need only be designed to resist the active pressure of the rock mass. A rigid support resists the elastic deformation as well as the active pressure of the rock mass. For instance at Mt. Taylor the approximate cured concrete stiffness is 4,000,000 psi, whereas the rock stiffness is between 600,000 and 1,000,000 psi. As such the concrete lining represents a stiff inclusion within the rock. 7he stiffer concrete resists the elastic deformation of the rock tc~ard the shaft. A stiff concrete lining 11terally draws load from the rock and this additional lining load must be accommodated in concrete shaft lining design.
The traditional methods of estimating rock pressure on a shaft lining (Terzaghi, 1943 and Talobre, 1957) assume a rigid (nonyielding) lining. The properties required to predict the external pressure (Pi) exerted on a rigid concrete lining by a rock mass are angle of internal friction, rock mass cOMpression strength and cohesion. The horizontal ground stress is also necessary, since it is the driving stress. The horizontal load that was carried by the rock prior to shaft excavation must be sup~orted by the conposite structure of the shaft lining and the adjacent rock.
Terzaghi (1943) presented the following prediction equation for the lining pressure on a rigid lining in plastic (yielding) rock:
('!an~-l)
Pi = 2 f 011 + (f"5 } (r ) (Tan~ +1) t (7an ~ -1) R
cro (1) (Tan~ -1)
?i radial stress applied to outside of lining
Ta,. (3 passive pressure coefficient
Tan ~ = 1 + Sin ~ 1 - Sln ~
i Oji=
60 =
r = R =
angle of friction horizontal ground stress (ass~ uniform e rock Mass uniaxial cOMpression strength excavation radius relaxed zone radius
Talobre (1957) developed a Similar equat1 for clastic (brittle) rock, as follows: e
Pi = r Ta~ ,- +~ (l-Sin f )1 (~)(Tanf -1
c Tan I
c = rock mass cohesion
(2)
. The properties of a rock mass are not read11y measurable. The angle of frictior ( I) can be either the angle of internal friction if the potential failure of the rock is through int~ct.roc~ (Fig. 2) or t~ angle of surface fr1ct10n 1f the failure would occur along weaknesses in the rock mass. However, once the concrete is in place only the angle of internal friction need be considered. Hobbs (1970) demonstrated that the angle of friction for British coal measure rock was the same fOI triaxially confined intact rock as for broken rock.
The uniaxial compression strength of rock mass (0-0 ) cannot be determined from specimen tests, unless the specimens are very large. Table I presents several ind o cations of the decrease in rock strength with increase in size. The reported decrease in uniaxial compression strength from NX(2-in.) cores specimens to large blocks of rock ranges from over seven ti~ to about four times. Wilson (1972) recom mended the use of specimen cohesion for rock mass compression. Obert, et. al. (1 ' suggest dividing specimen strength by 2 0:
4 to obtain a design compression strength for the rock mass.
The rock mass cohesion (c) ca~ be ca culated from the mciasured angle of intern, friction and the estimate of rock mass COl
pression strength, as follows:
c:ro c
2 / Tan ~ (3 )
The excavation radius is tied to the internal lining radius as determined by production and use requirements of the sh and by the required thickness of the lini Lining thickness must be determined by it ative solution, involving first the selec tion of a trial lining thickness and seco calculating the resulting lining safety factor. This orocess is reoeated until t desired safety-factor is obtained. The lining thickness is designed to carry ~he lining pressure which develops after sln~

:~ I. Uniaxial compression strength decrease with increasing specimen size.
COAL QUARTZ DIORITE (Pratt and others,
: leni awsk i , 1968) 1972)
;ide Side ~:1gth Strength Length Strength In. ) (psi) q.n. ) (psi) --0.75 4260 3.18 4420 1 4760 4.24 4530 2 4880 4.5 4860 2.7 4575 8 3340
3 4070 12 1980 6 1850 18 1400
12 ll58 24 1660 18 910 36 1080 24 800 72 1330 28 774 108 990 36 709 Increase Decrease 48 650 34 times 78\ 60 644
:-::Crease Decrease :: times 85\
35 removed the stress shield. Above the ~ieldec zone the design tangential rock
·:ress ( ()t) and the maximum lining pres'Jre (Pi) are present.
In the typical case where the elastic :~~gential stress, as well as overburden :ress, exceeds the uniaxial compression
::rength of the rock mass the rock near the ~aft wall relaxes, or unloads, to a stress :~at can be supported. The relaxation of : zone of overstressed rock behind the con::ete lining results in partial failure of ·.:~ e rock (Fig. 3).
The radius of the relaxed, or over'~ressed, rock zone (R) adjacent to the ' laft has traditionally been estimated .ith the Mohr-Coulomb strength criteria. :Jck strength increases outward from the , ~aft wall as the radial confining stress ~) increases. The elastic tangential
: ~ress in the rock is a maximum at the :"aft wall, and decreases outward into the ~ock (Fig. 3).
Within the relaxed zone, rock failure ~~sults in expansion of the rock mass which .s resisted by the concrete lining. Rock ~ailure cannot be permitted until the con:rete has gained sufficient strength to :esist the radial expansion stress which ~~uals the lining pressure (Pi). The par: ially relaxed rock adjacent to unsupported :~afts and tunnels or in pillars can fre:'~ently be seen as splits in the rock when ·joki~g into a borehole drilled into the :io or wall. Figure 4 presents schemati:ally this partial failure of the rock in he re1axed zone. The lower half of Figure
; prese~ts the associated Mohr-Coulomb ':edicted stable stress distribution out'~rd from the concrete lining at the 3032-ft
depth in the Mt. Taylor shaft. In the unlined portion of the shaft, near the shaft bottom, the stresses are limited to the rock mass co~pression strength (~). The actual tangential and vertical stresses may well be less because this portion of the shaft is within the "shielded zone". The stresses in the shielded zone increase upward. In weak ground this limits the length of pour in order to prevent sloughing and caving of the exposed rock.
The Mohr-Coulomb strength criteria predicts the extent of the relaxed zone outward from the shaft wall (i). The boundary of the relaxed zone is the point where the radial stress (air) is just sufficient to triaxially reinforce the rock mass to carry the overburden (CJv ) or tangential stress (Cit), whichever is greater. \: ' .:" .
( r2) "" , err:: Os 1 - ~ (4) ~ -.~._ (r+ R ) - '\ " '- ~
:~ .. ~ Failure Strength ::
()t:: OH (1 0-0 + Tan~ err (5) . :, .. ~ I '·
+~~) \ )....,Ij.4.- ' -- \Iy'"
(6 )
.: .,/~. ::r 'i .
Figure 5 shows the predicted radial and tangential stress distributions adjacent to the shafts at the 3032-ft depth at Mt. Taylor. The elastic stress distributions are also shown. Figure 5 also indicates the transfer of tangential stress from the overstressed rock near the shaft (Area I) to the triaxially confined rock beyond the boundary of the relaxed zone (Area II).
The radial stress (err) increases from zero to Pi from the shaft bottom to the top of the shielded zone. The lining pressure, calculated from Talobre's clastic equation, is 507 psi (See Figs. 4 & 5). The unconfinec compression strength (ero ) of the rock mass must decrease as the overstressed rock near the shaft relaxes (partially fails) against the lining. The unconfined compression :_strength of the partially failed rock directl against the lining is ~onservativeJy assumed to be zero. The triaxial strength of the rock adjacent to the lining is not zero, however, because it is confined by the 507 psi lining pressure. Its strength is:
Failure Strength (psi)
Failure Strength (psi) = 1469 "Osi
00 + Tant! (Pi) (7)
o + 2.90 (507)
based on the Mohr-Coulomb strength criteria and the properties of the Upper Westwater sandstone. The uniaxial compression strength (0-0 ) is assumed to rise across the relaxed zone, reaching 500 psi at the overstressed zone/elastic rock boundary. The failure strength curve shown on FIgure 5 indicates the tangential and radial stress distribution adjacent to the shaft. Their elastic distributions are also shown, although the overstressed :-ock :lear the s.lM!ft wall will of CO'.lI"se not be responding elastically, The area, desig-

nated Area I on Figure 5, below the elastic tangential stress curve and the failure strength curve represents the load that cannot be carried by the overstressed rock. This load must be transferred to the stronger confined rock in the elastic zone, indicated as Area lIon Figure 5.
The Mohr-Coulomb strength criteria ignores the effect of the intermediate stress. Mogi (1967) indicated that "10 to 50% differences of strength are associated with the influence of the intermediate principal stress." Ostrowski (1972) applied the strain e~ergy of distortion theory of failure to predict the thickness of the relaxed zone adjacent to the shaft wall while taking into consideration the intermediate stress. The assumptions are simple, (Seely and Smith, 1952), namely (1) volumetric strain from hydrostatic stress does not result in failure, and (2) rocks yield or fail only under sufficiently large differential 3-dimensional stress conditions. The critical indicator of failure is the shear stress invariant (t):
r----------------------------------~ t = j j(CJ'i- (/2)2+("l- 03)2+("2_03)2
61, 62, (8 )
63 = Principal stresses
Near the shaft the principal stresses are the tangential stress ( crt), the radial stress ( COr) and the vert~cal stress (o-v). Failure is predicted when the shear stress invariant (t) reaches the critical value for the associated volumetric stress invariant (s):
s= 01.+ <J2+ OJ 3
(9 )
The critical "t" value for associated "s" values can be defined by applying equations 8 and 9 to the same triaxial strength tests used for the Mohr-Coulomb strength criteria, as shown on Figure 6 for the 3032-ft depth at Mt. Taylor. At a specific shaft depth the elastic volumetric stress invariant adjacent to a circular shaft is a constant, since art plus or equals twice the assumed uniform horizontal stress and the vertical overburden stress is ass~ed uniform. The thickness of the relaxed zone (1) is determined by finding the thickness which produces a shear stress invariant just under the strength, or failure, line.
MT. TAYLOR CASE STUDY
The concrete lining in the l4-ft 1.0. shaft at the Mt. Taylor Project of Gulf Minel"al Resources Co. was instrumented with Carlson strain cells at three depths: 940 ft, 2030 ft and 3032 ft. The measured concrete strains were converted to concrete stress (otc) and then the lining pressures (Pi) calculated. The Lame' thick walled cylinder equation was employed:
Pi = (ftc
C<; ~ ~+~~-) r = excavation radius a = shaft lining radius x instrumen~ radius (See Figure 3)
(10)
Table II presents the results of the ins. mentation program. The scatter of the c~~: culated lining pressures can be seen on Figure 7. This scatter may be the resUlt of the irregular shaft wall.
Statistical regression curves were fitted to the calculated lining pressures as shown on Figure 7. It is interesting ~ note that the lining pressure predicted fo the 3032-ft depth from the 940-ft and 2030-ft depth data was reasonably close, even though the rock types changed, as not on Table III.
The in situ stress conditions and roc mass properties are two elements in predic ing pressure on a shaft lining. The forma tions were hydrofractured at 1106 and 2390 ft. A horizontal stress equal to 0.7 times the vertical stress was indicated by these tests. The vertical stress was assumed to be the result of the overburder. load. The average rock density of 138 lb/ ft 3 resulted in estimated in situ stresses shown in Table III. The physical properties employed in the analysis are also pre sented on Table III. The estimated rock mass compression strengths of 1000 psi for the Mancos shale and 500 psi for the Upper Westwater were obtained by decreasing the specimen strength of the Mancos by over 7 times and the Upper Westwater over 5 time~ T~ese reductions were inferred from the fissile nature of the Mancos, similar to Bieniawski's (1968) cleated coal, and fror. the massiveness of the Upper Westwater, similar to Pratt's (1972) quartz ?iorite. Figures 8 and 9 present the triaxial test results for the Mancos shale and the Uppe: Westwater Canyon member of the Morrison Formation, respectively.
S~~PLE CALCC~ATIONS FOR 3032-FT DEPTH
The first step in calculating the pr. sure o~ the lining involves calculating t~ thickness of the relaxed zone (~ ) at the 3032-ft depth. An iterative process was employed which yielded a relaxed zone thi~ ness of 0.353 times the excavation radius. as follows:
or = DB (1 - r2 ) (r+ i) 2
(11)
or = 2150(1 + r2 )
(r+ 0.353 r)2 = 975 psi

The triaxial compression strength under )si of confinement is (Mohr-Coulomb
;~rength cri teria) :
Fail = 00 + Tan~(or) = 500 + 2.90
(975) .. 3300 psi (12) .~e triaxial compression strength just ex~~eds the elastic tangential str~ss ( at) ~~r the relaxed zone equal to 0.353r, as ~"llows :
(}t = OH (1 + r2) (13) (r+R)2
= 215 1 + -~ r2)-~ (r+0.353r)2
3320 psi
~he tangential stress (at) value is used for ;omparison to the failure strength (OFail) :ecause the overburden stress is only 2906 ?si.
The predictions of lining pressure~ ~he above relaxed zone thickness at 3032-ft ~ePtn are presented on Table IV. One addi~ional lining stress prediction is included In Table IV, the no cohesion clastic modifi:ation of Talobre's (1957) equation pre:ented by Rabcewicz (1964). Similar results :or the 940-ft and 2030-ft depths are also jn Tat1e IV. Factors of safety for all 1ree instrumented depths are presented on
.able V. The design concrete strength is 5000 psi. La~e's thick walled cylinder equation provides the solution, as given ~l~:
f~
FS ( ~ + 1) 2 (14) ..--:-0--'2 t'l.
t lining thickness (in.) a shaft lining inside radius (84-in.)
f~ z concrete design strength (5000 psi) Pi linin~ pressure
The distortion energy method predicts :he thickness of the reJ~xed zone (~) at :he 3032-ft depth as 0.113 tines the excavation radius. This is shown on Table VI and Figure 6 for the value of "i" in terms of "r" where the strength and stress invariant values are equal. With Terzaghi's equation the predicted plastic lining pressure is 854 psi. The Rabcewicz no cohesion clastic lining stress prediction is e99 psi and the Talobre prediction is 850 psi. These lining pressures are greatly in excess of the maximum 548 psi calculated from the strain cell instrumentation. See Table IV for comparisons. The assumption that the critical shear stress invar:ant (t) determined from triaxial tests can ?re(' ict strength under polyaxial stress conditions does not appear to be valid.
£QNCRE~E CONSIDERATIONS
The assumotion that concrete acts as a rigid shaft lining is conservative. The
elastic deformation of the snar~ ~"''''''''':I __ is progressively loaded reduces the radial stress imposed. Similarly the tendency of concrete to shrink, and to creep under stress will also reduce the radial stress.
The maximum rigid lining stress for tho 3032-ft depth in the 14-ft 1.0. shaft indicated by the field measurements was (Lame thick-walled cylinder equation):
Otc = 2Pi( /\) r -a
(15 )
Otc = 2 (548) ( 1082 )= 2740
1082
-842
psi
The minimum safety factor for the 24-in thick concrete lining is 1.82 for the 5000+ psi concrete.
The elastic decrease in shaft diameter for the 24-in concrete lining at the 3032-ft depth, when subjected to the average 420 psi exterior lining pressure is 0.090 in., calculated as follows:
Average lining stress crt:c = 420(216) 48
1890 psi Stiffness of the concrete (E) from American Concrete Institute (ACI) ,(1977):
E = 57000 ;-t; (16) fc = concrete strength
Average lining strain ate (17) -E-
1890 = 0.000469 in./in. 4,030,000
Average lining circumference C = 2 1T' (96) = 603 in.
Shortening of circumference ~C = co( = 603(0.000469)=
0.283 in. Deformed shaft diameter d
new = (C-tlC) 111' =
191.91 in. Decrease in shaft 1.0. .od = 0.09 in.
The elastic decrease in shaft lining diameter will decrease the radial stress acting on the suP?osed rigid lining. This decrease will be in direct relation to the diameter decrease of the elastic defor~ation of the shaft if unlined, calculated from Obert and Duvall (1967) as
u = 4r aH (18)
U
r = Er =
OH
u
~ elastic decrease in shaft d:a~eter
(in. ) excavation radius (lOS-in.) elastic rock modulus (~OO,OOO psi) horizontal ground stress
(2150 psi) 4(108)2150 = 1.55 in.
600,000

The resulting decrease in lining pressure (Pi) from elastic deformation of the shaft lining is:
0.09 l:'"55 (100) 5.8\ increase in lining pressure (Pi) due to elastic lining response.
This may not be a significant decrease, but it is in the right direction, conservative.
Concrete undergoes non-elastic shrinkage in the course of curing. If the moisture content of the concrete is held constant this shrinkage amounts to about 0.07% for a rich 7 sack mix. If the concrete is exposed to air drying, which was not the case for the wet Mt. Taylor shaft, shrinkage is tripled to 0.21\ for Type I cement and more than tripled to 0.23\ for Type III cement (Troxel, and others, 1968).
Shrinkage will further decrease the diameter of the shaft lining and thereby reduce the predicted lining stress, as follows:
0.07% strain = 0.000700 in./in. ~C 603(0.000700) = 0.422 in.
dnew = 191.87 in. ~d = 0.13 in. 0.13 1.55 (100) ~ 8.4% decrease in lining
pressure due to shrinkage alone.
Troxell, et. al. (1968) state, "that the rate of creep is relatively rapid at early ages." "Roughly, about one-fourth of the ultimate creep occurs within the first month and three-fourths within the first year." The rate of shaft sinking will partially determine how soon the concrete lining will be fully loaded: therefore, ~ow muc~ creep will occur. Troxell, et. al. (1968) describe non-elastic creep under sustained stress partly through "viscous flow of the cement/water paste, closure of internal voids, and crystalline flow of aggregates, but it is believed that the major portion is caused by seepage into internal voids of colloidal (absorbed) water from the gel that formed by hydration of the cement."
The magnitude of creep depends on several factors relating to the quality of the concrete, as well as to the stress applied and to how early in the curing process the concrete is loaded. The ultimate magnitude of concrete creep under stress "is usually about 1 millionth per unit of length, per unit stress (psi)" (Troxell, and others, 1969). The non-elastic concrete/rock interaction is complex and difficult to predict. However, if no other factor were to decrease the lining pressure the estimated creep relate~ stress decrease would be approximately: Circumferential creep strain {= 0.000001 (1890) = 0.001890 in./in.
~C 603(0.001890) 1.14 in. d ~ 191.64 in. new 6 . ~d O. 3 -~n.
0.36 (100) 23.4\ decrease in !i~!~; r:ss oressure (P~) d·.Je to COo,
alone. .
The composite effect of the :-.o:-.-~._ elastic response of the concrete Iln'::": shrinkage of the concrete. and t:-.E _: .. ~ .. which is governed by the stress a~c~::~~ history appear to prevent a precise a;~~:'~ ment of these effects on shaft l.:..::ir.Q -- ::. is possible to state that each of ::-.~:" :~ tors increase the effective:-:ess of a ~:.:t crete shaft lining. - .
OVERBREAK
Overbreak is another factor that ,~_ fluences the stability of a CO~crete s;~ •• lining. Overbreak is rock excavation '. beyond the pay-line. The concrete ola-~A beyond this design line is considered ~;~~ at the contractor's expense. Overbreakw.~c allowed because neither the owner nor t~~ contractor wants to excavate tights bc~:~. placing the lining. The approximate c~~:. break, in terms of design concrete ~a:~J-p. at the three instrumented levels at Mt. Taylor was 16.3% at the 940-ft de~th, e. , at 2030-ft and 7.5% at 3032-ft. ?hlS co ~ ~. pares quite favorably with the results c! an extensive study of tunnel cverbreak which indicated an average of about 12' over several tens of miles of tu~nell:-g.
SUHMARY _~ND CONCLCSIONS
The prediction of the press~re ~~~. on a concrete shaft lining is the cr!:l:J; item in designing a concrete s~a~t. :~~ level of confidence is directl rela~0d: ' the confidence in the rock pro Ertle! ].~
the in situ stress field used n the ~r~diction.
The Talobre (1957) equation for predicting lining pressure produced values which most closely approxi~ated the n( J~
ured results at Mt. Taylor. Ta10Lre's ~ -is for clastic (bri~tle) rock, whereas Terzaghi's model was for plastic (yielc!:~ rock. The rock s through wh i ch the Mt. ': J; •
shafts were sunk are relatively low-str~':' shales and sandstones, apparently not S~~· ject to significant time dependent Fla,":.~ deformation. The shale and sandstone ~J~r very similar physical properties whic~ ~~~. the regression prediction of lining pre- 4: possible at Mt. Taylor. The ~a~cos S~3;' . actually stronger under unconfined co~ : ·:· " sion than the Upper Westwater sa~dstO~c: We initially thought the high mo~~~o~~! .. nite content of the Mancos s~ale ~~g~: : :. mit it to respond plastically. Sha:: :~:,. ers in the Grants area expect and ac~;c~' high advance rates in the ~ancoS. 7~:f -~. plies that it is not pliable a~e v!scc~~ but a rock which can be blasted, l03~c~ ;.! supported efficiently, similar to ~2rc brittle rock.

~ CK!'lOWLEDGEMEr:TS -The authors are indebted to Sam Smith,
-arry Fischer and Jim Hanley who installed ;~d read the instruments. Without their ,~forts this oaoer would be of little value. ~; also ackno~ledge the generous per~ission ~f Gulf Mineral Resources Company to use the ~ield data.
:U:FERENCES :.--
~el, J.F., Jr., 1967, Tunnel mechanics, . Quart. CSM, v. 62, n. 2, Colo. School
of Mines, Golden, 88 p.
.~el, J.F., Jr., and Lee, F.T., 1973, Stress changes ahead of an advancing tunnel, Intl. Jour. of Rock Mech . and Min. Sciences, v. 10, n. 6, pp 673-697.
American Concrete Institute, 1977, Building code requirements for reinforced concrete, ACI Pub 318-77.
Bieniawski, Z.T., 1968, The effect of specimen size on compressive strength of coal, Intl. Jour. of Rock Mech. and M1n. Sciences, v. 5, n. 4, pp 325-326.
3leniawski, Z.T. and Van Heerden, W.L., 1975, The sianificance of in ~itu tests on large rock specinens, Intl. Jour. of Rock Mech. and Min. Sciences and Geonechanics .~stracts, v. 12, n. 4, pp 101-114. ,
~owis , J.t., 1971, Shaft sinking cost analysis, unpublished M.S., University of Arizona, Dept. of Min. and Geol. Engr~., 145 p.
Galle, E.M. and Wilhoit, J.C., Jr., 1962, Stresses around a wellbore due to internal pressure and non-symmetrical geostatic stresses, Soc. Petroleum Engineers Jour., v. 2, n. 2, p. 145-155 .
Hobbs, D.W., 1970, The behavior of broken rock under triaxial compression, Intl. Jour. of Rock Mech. and Min. Sciences, v. 7, n. 2, pp 125-148.
Lane, K.S., 1957, Effect of lining stiffness on tunnel loading, Proc. 4th Int'l. Conf. on Soil Mech. and Fnd. Eng., v. 2, pp 223-227.
~etcalf, J.R., 1966, Angle of repose and internal friction, Intl. Jour. of Rock Mech. and Min. Sciences, v. 3, n. 2, pp 155-162.
:1oC'i, K., 1967, Effect of intermediate principal stress on rock failure, Jour. of Geop. Res., v. 72, n. 20, pp 5!17-5' 31.
Obert, L., Duvall, W.I. and Merrill, R.H., 1960, Design of underground openings in competent rock, USBM Bul. 587, 36 r
Obert, L. and Duvall, W.I., 1967, ROCK mecl anics and the design of structures in rock, Wiley, New York, 650 p.
Ostrowski, W.J.S., 1972, Design considerations for modern shaft linings, Trans. CIM, v. 75, pp 184-198.
Pratt, H.R. et. al., 1972, The effect of specimen size on the mechanical proper ties of unjointed diorite, Intl. Jour. of Rock Mech. and Min. Sciences, v. 9, n. 4, pp 513-529.
Rabcewicz, L.V., 1964, The new Austrian tunnelling method, Water Power, v. 16, n. 11, pp 453-458.
Richards, D.P. and Abel, J.F., Jr., 1979, Shaft lining design in rock, AlME Annual Mtg., 7 p.
Seely, F.B. and Smith, J.O., 1952, Advanced mechanics of materials, 2nd Ed., Wiley, New York, 690 p.
Talobre, J., 1957, La mechanique des roches Dunod, Paris, 444 p.
Terzaghi, K., 1943, Theoretical soil mechanics, Wiley, New York.
Troxell, G.E., Davis, H.E. and Kelly, J.W . . 1968, Composition and properties of concrete, 2nd Ed. McGraw-Hill, 527 p.
Wilson, A.H., 1972, Research into the deter mination of pillar size, Part I. An hypothesis concerning pillar stability The Mining Engineer, v. 131, n. 141, pp 409-417.

Depth (ft)
II
0
940
2030
3032
Dept:-l
~
Ii 940
2030
3032
Depth (ft)
940
2030
3032
TABU: II Shaft li n i ng :>reli sure ca1culat1on for 14-ft d 1ametnr shaft.
Excava-tion Ins t rllr.1ent Tangential Cell Ca l cul a ted Rad1us Rad1US Stress Locat1on Li n1ng pressure ( i n. ) (In . ) (ps i ) (ps i )
r x (ftc P1
0 0
114 . 0 99.5 400 NE 107
113 . 0 98 . 5 400 NW 1 04
106.5 95.0 400 SrI 85
l()6 • 5 95 . 0 370 SE 79
105.0 94 . 5 350 Nt: 70
106 . 0 95.0 950 !T\'; 198
106 . 0 95.0 1500 5;7 313
10£ . 0 95 . 0 1 500 Sf: 313
.. !'Io Read1ng
110.0 97.0 2300 W 548
108.0 96.0 1360 5 304
117.0 106.0 1360 E 405
':''-BLE III
I~ Sltu stresses a~d p~yslcal properties a~ shaf~ l~s~r~~e~~a :! o~ cepths.
Ver'tica1 Stress
(?Sl)
av 901
1945
2906
Estimated Horizo:1ta Ground Stress
(psi)
667
1440
2150
Hor!.zc :i t~l Stress
(psi)
OF. 667
1440
2150
A:,cle of In~erna1 "riction
; 32.1 0
32.10
29.20
'!'ABL: : V
Passive Pressure Coeff1-cient
:-r'lI 3.27
3.27
2.90
i<ock ~ass
Cor.;;:,.esSlon St::enqth
(Jo 1000
1000
500
L!~lng ~ress~re 0: Mt. 7aylor s~aft, 14-ft d~a~eter shaft.
Bed
~~a;.cos
S:>a1e
Mancos Shale
t:p?er :iestwater Sandstone
Lin i ng p,.essure (pS1) =~c::r-Cc::lol:lb .erza;"l,1 "ii5c::e'.'~cz 17~ Relaxed P1ast1c No Cone- Clastic Zone ~aximu~ P::e- sion Pre- Pre-T:,:ckness Measured d,cted I dicted d1cted
(xr)
0.0642r
0.200r
0.353r
107
313
548
10
142
434
654 213
737 297
769 506

:epth (ft)
940
2030
3032
:
TABU V Linlna thlcknesses and resul.lng factors of safety. Mt. Taylor 14-ft s~aft.
f'ilctor O!: ,actors Of saf~ty Safety for for Desia~ Llnin~ Thlckness
Llnin~ Th i ckness Mln imur.t T~rzaahl Rabcewlcz Talobre ~'I1nlmum Measured Plastic No Coheslon ClaStlC Measured· Deslgn Lining Predicted PredIcted PredIct(!d
(1.n. ) (in. ) Thickness
:<2.5 18 7.52 '730 1. 23 3.78
21.0 18 2.57 5.67 1. 03 2.71
24.0 24 2.2S 2.28 1. 28 1. 95
·~o::e: R(!fer to ~ABLL II, minimum measured 11~inn thlckness is the minlmum excavation radius m.nus the Ins1.de radius of the shaft 1inin~ (84 in.). TA3Lf IV presents the measured and predicted l1.nln; ?ressurcs (Pl). Refer to equation 11 for method of calculating the factor of safety for the minimum meas~re~ and design lining thicknesses.
TAB i.E VI
DlstOrt1.on ener~y 1in1.n; pressure preclct1.0n, 3032-!t depth as plotted in FIgure 6.
(A) Triaxlal test strength line
Cor.! lr:ing Stress (!12=~)
(pSl)
100·
500
1000
rai ure Sa ss (<1ll
( si)
790
1950
3400
VOlumetrIc Stress lr.varlant - 5
(;:>si)
330
983
1600
S:'"!~ar S~:ess Invarlant - t
(;::Sl)
325
684
1131
1363.5---cross 44690ver---2402---polnt---146l.5
1500 4850 2617 1579
2000 6300 3433 2027
(B) ~va1uation of polyaxia1 stresses to find critical shear stress invarlant (t) at predicted fallure.
'lelaxed Zone ~~ickness (in tenns of r)
O.OOr
0.05r
0.10r
Volumetr1.C Stress Invariant - s
(psi)
2402
2402
2402
S:lear St.ress Invarlant
(pSl)
1791
1632
1494
O.1~29r---cross over----- 2402-----point----- 1461.5
o .15r 2402 1374
0.20r 2402 1270
0.2Sr 2402 ~179
0.30r 2402 1093
~ote: Confining stress in triaxlal :ests is unlform aroun~ the test specimen. Therefore. 02=~ in the volumetrlc and shear stress invariant equatlons.

)'
Shaft {
I
, "our ·0"
~ ___ -: Rou"" ., ..
t-j--i "- ·2" :.. • Roun ..... ,-~ .. r- __ : ROVM .~ •• ~ __ : 110_ "s" ~_ __: ROUnd !'6"
t-.1
t--1 i- ·7"
..- --, . I I I ~ --' . L _J R ...... "It"
~ I
2OHt:'x" , " ::;:: t~~':"" .. 2" ,~~ ... ~.... ... .... ... ........... , ....... ~ .. ,.. ............... ...., ....... .......... ....
, ---:-~:~~nliifui{ii i 11 ii""-a;; -'-- - - - - ___ - ~ ~_=_~_!U'I
o K
Distance from Snaft Wall_
01= Tangential Stress
0;:-:: Radial Stress a;;:: Herlzontal Stress
FIG, 1 - PROGR~SSIVE INCREASE IN ELASTIC TANGENTIA~ S;R~SS AQOUND SHAFT AT POUR O· AS EACH SHAFT ROUND IS EXCAVATED .
Potential failure
Potential failure through intact rock . Physical properties Angle of internal
friction Intact rock
cohesion
, --"
surfaces ----/
Potential fai lure along rock moss weaknesses. Physical properties
Angle of surface fric tion
Rock-on-rock cohesion
FIG. 2 - POTENTIAL FAILURE OF ROCK.

J i ---------
OH ---------t t
OH ~ ~ + + + + ~ t ~ --ElastiC'
,------~ ,c;:a; -~oC' /" ~ ... , _;...... ,Jtf ./_(:-.': ,. ,,~ '!"'~":.... ' ...
CSf -~ ...-
----------
t t t t t t t t t OH
- FIG. 3 - ~HA'T LAYOUT.
Fails by Shear In Tenslor,
: . ' .. 'I~ Relaxed Zone to I
~
I] I~ I) I
0;= ~v.= 2906 psi I a; 22906;:5'
~ar= B6~C;: =975 a;:-- 507psi ~.", . oro ~.",
'l-q "l-~ I ~ 6-.:''';'';
ct: o psi
FIG. 4 - CRACKIN~ IN RELAXED ZONE AND MoHR-COULOMB CALCULATED STRESS DISTRIBUTION, 50,2-FT DEPTH.

!>ooo
Relo.leCi ar
Over Ifr.sseel zon.-{o;,. !>OOp.' eeyoncl ______ _ ! Over stressed Zone
4000
0;,. 0
01 SlIoII Woll
." 1000~ 0.
."
." 2000 ~ ...
U5 1000
:;;;--e-: --,
o V -cr. I...EIO$IICI
o I 01' J ~J 0.", 03,
I
Hor lzonrol St r."
(RadlOI Slrell)
0.4' O~, _I 06, 07, 08'
• TanS_a
09, 10' II, 1.2,
Dis tonce from Shoft Wall in Terms of Excavation Radius (d
FIG. 5 ~ TANGENTIAL AND RADIAL STRESS DISTR IBUTION OUTWARD FROM SHAFT WALL, 3032~~T DEPTH, MOHR-COULOMB STRE~GTH CRITERIA AND TA~OBRE PRESSURE PREDICTION.
-iii Q.
C 2000 0 ~
0 > c:
1500 II) II) CI) ~ -(/') iOOO -c: 0 -~ 0 500 -II) i5 -
I = 29_ 20 ; a; = 5 0 0 psi
0;= 2906pSi ; a; = 2150psi
~
o CI)
.s:: (/')
0' I I o 500 1000 1500 2000 2500 3000
Volumetric Stress Invariant - s (psi)
FIG. 6 - DISTORTION ENERGY ESTIMATE OF RELAXED ZONE THICKNESS, 3032-FT DEPTH.

II)
0.
a:: , CD ~
~ II) II)
CD ~
a.. co c: 'c ~
~ CD
700 Parabolic Curve Fit I I
Pi : + 3 + 0.0653(H) + 0 .0060-233 (H) 2 r2 = 0.824; Syx: 67 psi
6001 ,',
500 I I .'1
400 I If,"
300 I r ff It
linear Curve Fit
2001 //~ Pi=-19+0.134(H) r2= 0.805; Syx=78psi
'0 100 I .IV :J ~ o U
1000 2000 3000 4000 Depth (ft)-H
FIG. 7 - SHAFT LINING PRESSURE ME~SURE~ENTS AND REGRESSION CURVE FITS.
II)
0.
oS: -co c: CD ~ -CJ)
CD ~
~
0 La..
Failure Strength{psil = 7720 + 3.27{Confining Stress-psi)
25000
20000
15000
10000
5000
o
r2 = 0.664; Syx = 2640 psi
I = 32.1 0
cohesion = 2140 psi
e
o 1000 2000 3000 4000 5000 Confining Stress (psi)
LEGEND • - Mancos Shale
• - Mulatto Tongue of Mancos
FIG. 8 - TRIAXIAL COMPRESSION TEST RESULTS, ~NCOS SHALE FORMATION.

Failure Strength (psi) = 2730+2.90(Confining Sfress
-·~200 -~ -01150 c Q) ~ -(f)
G) ~
~
o
100
IJ... 50
r2 = 0.733 ;
I = 29.20 ; Syx = 2930psl
cohesion = 800 psi )0 r-I--t--=~I
- psi)
o
LEGEND
1000 2000 3000 4000 5000 Confining Stress ( ps i)
• ~ 0+75 East Drift e-- 14-ft Shaft Station
FIG. 9 - TRIAXIAL COMPRESSION TEST RESULTS. UPPER WES7WATER CANYON MEMBER OF THE ~ORRISON FORMATION .

CONVERGENCE CONFINEMENT METHOD (after McCreath)
fi'fJ~ p te /~ He Cvea (0 Thes 7S
MASS DENSITY DEPTH TUNNEL RADIUS FRICTION ANGLE
PLASTIC FRICTION ANGLE COHESION PI.ASTIC COHESION COEFF. OF LATERAL STRESS ELASTIC MODUU GROtJN)
POISON RATIO GROUND DILATANCY COEFF. UNCONRNED~
RAllO PEAKlRESID STRENGTH
SHEAR MODULUS G=E/(2*(n+l» COEFF.OF PASSIVE PRESS. m=(1 +SIN(li»/(I-SIN(li» VERTICAL STRESS Po=Z*g LAMBDAe lame=I/(I+m)*(m-l+Sc/Po)
Coefficient Mc
Mc=(I+(lam-l)*Po/Sc)/(lam+l)
Plastic dilation
(9) (Z) (a) (fI)
(flp) (c) (cp) (K) (E) (n)
(AL) (Sc) (s)
1 35
30 0.13 0.01
1 100 0.3
0.5
(G)
(m)
(Po)
(lame)
(MC)
ev=(2*(UlIR)*(R/a)"2)/«(R/a)"2-1 )*(1 +lIrc» (ev) Parameter rc
Thin Plastic zone rc=2*(-sin(li»*ln(R/a)
Thick Plas'Iic zone rc=I.I*(-sin(li» Deformat. at the boundary of PlaB1.zol Ul =(1 +n)/E*(Mc*Sc)*R Coeff.of Passive Pressure lam=(1 +sin(li»/(I-sin(li» lamp=(1 +sin(lip»/(I-sin(lip» Parameter A A=(2*U l/R-ev)*(R/a)"2
ELASTO-PLASTIC DISPL. IN GROUND
Press. at the boundary of Plast.zone Pl=Po*(I-sin(li»-c*cos(li) RA~USOFPLASnCZONE
(rc)
(rc) (U1)
(lam)
(lamp)
(P1)
R=a * « Po+cp/tan(li)-Mc*Sc )/( Ps+cpltan (Ii» )"( I/(1am-l » ELASnC~SPL
kN m m
deg
kPa
kPa
deg
!
0.611 rad
0.524 rad
K=n/(l-n)
--------------------------------------------kPa Sc=2*c*tan(45*asin(1 )/90+li)
1.4745 0.0746
r------"1 kPa
kPa
1.3604
Ria < (3)"0.5
Ria > (3)"0.5
3.6902
3
kPa
m
m (Ue) Ue=Ul*Rla
(u(e+p»U ELASTO-PLASTIC DISPL m U(e+p)=a*(I-«I-ev)/(1 +A»"0.5)
(3)"0.5= 1.7321 Ps lams Ps/Po U1 R Ris rc ev A U(e+p) kPa =1-Ps/Po m m m
1 0 0.0050749 0.573929 0.5739 0.637 -0.0034 0.0069 0.00177 1.7686 0.9 0.1 0.9 0.0053452 0.604502 0.6045 0.5774 -0.0037 0.0078 0.00203~ ii.ii 0.2 0.8 0.0056639 0.640546 0.6405 0.511 -0.0042 0.009 0.00238 ""'2':'3'B2'6T 0:; 0.3 0.7 0.0060474 0.683916 0.6839 0.4358 -0.0047 0.0105 0.00285 2.85474 0.6 0.4 0.6 0.0065211 0.737486 0.7375 0.3493 -0.0055 0.0126 0.00353~ o.s 0.5 0.5 0.007127 0.806004 0.806 0.2474 -0.0065 0.0157 0.00454~ 0.4 0.6 0.4 0.0079407 0.898028 0.898 0.1234 -0.0081 0.0208 0.00624 6.23796 IT 0.7 0.3 0.0091169 1.031047 1.031 -0.035 -0.0108 0.0303 0.0095 9:5oOii7 IT 0.8 0.2 0.0110411 1.248663 1.2487 -0.255 -0.0169 0.0539 0.0177117.71ii9 IT 0.9 0.1 0.0151188 1.709818 1.7098 -0.615 -0.043 0.1 774 0.0588 "'"'5B.'B'1i'37
0 0 0.0427681 4.836721 4.8367 -0.631 -0.0316 1 .1 526 0.30773 "'"'3'ii7.'732
0.9
0.8
0.7 1\ 0.6 F(s . r;-0.5
0.4
0.3
0.2
0.1
0
0 0.05 0.1 0.15 0.2 0.25 0.3 0.35

CONVERGENCE CONRNEMENT METHOP (after McCreath)
MASSDENSnv (9) DEPTH (Z) TUNNEL RADIUS (a) FRICT10N ANGLE (fl)
PLASTIC FRICTION ANGLE (tip) COHESION (c) PLASTIC COHESION (cp) COEFF. OF LATERAL STRESS (K) ELASTIC MODUU GROUtO (E) POISON RATIO GROtJN) (n) DILATANCY COEFF. (AL)
17.36 29
29
73.168 1
60000 0.2
in deg
deg
psi
psi
7 0.506 ,ad
0.506 rad
K=n/(l-n)
ff X XJ Ii rtf:? -f!r~
UNCONFINED STRENGTH (Sc) 500 psi Sc=2*c*1an(45*asln(1 )/90+li) I1c Lrcr!{ / 0 RATIO PEAKlRESiD STRENGTH
SHEAR MODULUS G=E/(2*(n+l » COEFF.OF PASSIVE PRESS. m=(l +SIN(fI))/(l·SIN(li)) VERTICAL STRESS Po=Z*g
73.1687948
LAMBDAe lame=l/(l+m)*(m·l+Sc/Po)
Coafflclent Mc
Mc=( 1 +(Iam-l )*Po/Sc)/(lam+ 1)
Plastic dilation
(s)
(G)
(m)
(Po)
(lame)
(Mc)
510.33
2150 psi
2.3423
ev=(2*(UlIR)*(R/a)"2)/(((R/a)"2-1 )*(1 +l/rc» (ev) Parameter rc
Thin Plastic zone rc=2*(-sin(II»*ln(R/a)
Thick Plastic zone rC=1.1*(-sln(fI» Deformat. at the boundary of Plaat.zOl Ul =(l+n)/E*(Mc*Sc)*R Coeff.of Passive Pressure lam=(l +sin(li»/(l-sin(li» lamp=(l +sln(lip»/( l·sin(lip» Parameter A A=(2*Ul/R-ev)*(R/a)"2
ELASTo-pLASnC PISPL IN GROUND
Press. at the boundary of Plaat.zone Pl =Po*(l-sin(li»-c*cos(li) RADIUS OF PLASTIC ZONE
(rc) RIa < (3)"0.5
(rc) RIa > (3)"0.5 (U1)
(lam) 2.8821
(lamp) 2.9821
(P1)
Rca * «Po+cp/tan (Ii)-Mc* Sc)/(Ps+cp/ta n(li» )"( 1/( lam·l » ELASTIC DlSPL (Ue) Ue=Ul*Rla
(U(e+p»Lj ELASTo-PLASTlC D1SPL U(e+p)=a*(l·«l-ev)/(l +A»"0.5)
131"0.5= 1.7321 lams Ps/Po U1 R Ria rc ev
=l·PslPo in in 0 1 0.2773726 11.84201 0.6821 0.3709 '0.011
0.1 0.9 0.2923464 12.48129 0.719 0.3199 -0.0121 1720 0 .2 0 .8 0.3099146 13.23134 0.7622 0.2633 ·0.0135 i505 0 .3 0.7 0.3309157 14.12795 0.8138 0.1998 ·0.0153 1290 0.4 0.8 0.3568218 15.22544 0.877 0.1272 -0.0176 1075 0.5 0.5 0.3890763 16.61103 0.9569 0.0428 -0.0208
"ii6"O' 0.6 0.4 0.4318193 18.43588 1.062 -0 .058 -0 .0258 m 0.7 0 .3 0.4916676 20.99101 1.2092 -0 .184 ·0.0335 430' 0.8 0.2 0.5840125 24.93354 1.4363 -0.351 -0.0492 ill 0 .9 0.1 0.7545485 32.21432 1.8557 -0.533 -0.0754
0 0 1.2610101 53.83694 3.1012 -0.533 -0.0597
2500
2000
A U(e+p) In
0.0269 0.13492 134.923 0.0305 0.15523""'1"55.'22s 0.0351 0 .18159""'1iii":'5ii7 0.0412 0.21695"""'2i6.'9s 0.0496 0.26641"""2"ii"6.4Oi
0.062 0.33951 ~ 0.0817 0.45619~ 0 .1174 0 .66486~ 0.1981 1 .11461~ 0.4211 2.25802~ 1.0251 4.801 79 """4eO"i"":79
1500 fiG. \~ 1000
500
J 1===== o 0.5 1.5 2 2.5 3 3.5 4 4.5 5
~ -/
1 i1r!2:/s