LONDON HOUSING PRESSURES
39
LONDON HOUSING PRESSURES JANET SUTHERLAND Independent Housing Consultant
-
Upload
khangminh22 -
Category
Documents
-
view
1 -
download
0
Transcript of LONDON HOUSING PRESSURES

LONDON HOUSING PRESSURES
JANET SUTHERLAND
Independent Housing Consultant

Introduction
• Expressing my own views
• London’s triple whammy:
– London’s growing population
– Rising housing costs & reducing supply of affordable housing
– Impact of welfare reform

Movement of people
• From inner London to outer London • From outer London to adjoining home counties • Some further afield Dynamics: 1. Affordability and welfare reform 2. PRS and Housing Benefit
Movement of: 1. Local authority homeless 2. Social services placements 3. People making own economic choices

London’s growth challenge
• London’s population expected to grow to 8.7m by 2016
• And to 9.7 m by 2021
• And to 10m by 2030
• Thus London needs an additional 400,000 homes
• GLA projections


Rising housing costs in London
• House prices spiralling
• Private Sector rents out of reach of many
• Few PRS landlords now accept HB cases
• “Affordable rents” unaffordable to many, especially households with children
• Changing LA allocation policies
Diminishing supply
• New supply – Reduced grant funding – Reduced delivery through Section 106 planning – Smaller homes provided
• Social rent – losses through Right to Buy – Estate regeneration schemes – mixed tenure – RP’s transferring homes at relet to affordable rent

Welfare reform - London Picture
• ½ of all benefit cap cases
• 160,000 affected by LHA changes
• 55,000 by SSSC/bedroom tax
• 450,000 paying more Council Tax
London Council’s

Choices
London Council’s

Affordable housing?
• 2/3 growth in London HB is in PRS (LHA)
• Rents up 14%
• Increase in employed claimants
• No recognition of London’s higher costs
London Councils
57769
82492
97852
111481 111203
122359 128962
123608
0
40000
80000
120000
160000
2010 2011 2012 2013
Employed Not employed

The London impact – ‘Migration’
London Councils

London Councils
32,000
33,000
34,000
35,000
36,000
37,000
38,000
39,000
40,000
41,000
42,000
Q1 Q2 Q3 Q4 Q1 Q2 Q3 Q4 Q1 Q2 Q3 Q4 Q1 Q2
2010 2011 2012 2013
Ho
use
ho
lds
1 2
3
The London impact – Homelessness & TA

The London Impact – New burdens
• Capping homeless households
• Increased homelessness & DHP demand
• Arrears & debt
• Future demand
London Councils

PRS Claimants only, for London
Data from
DWP Stat-
Xplore
Area PRS HB Claimants,
Apr 2011
PRS HB Claimants,
May 2013
Change
Central London*
17,252 13,576 -21.3%
Inner London 101,344 99,776 -1.5%
Outer London 165,616 181,697 +9.7%
England
1,372,093 1,493,438
.
+8.8%
Data from DWP
Stat-Xplore
Area PRS HB
Claimants,
Apr 2011
PRS HB
Claimants,
May 2013
Change
Central
London* 17,252 13,576
-21.3%
Inner London 101,344 99,776 -1.5%
Outer London 165,616 181,697 +9.7%
England
1,372,093 1,493,438
.
• Central London here is composed of City
of London, Westminster, Kensington &
Chelsea, and Hammersmith & Fulham
• +8.8%
• Central London here is composed of City of
London, Westminster, Kensington &
Chelsea, and Hammersmith & Fulham

Implications for local government
• Housing & homelessness
• Migration & school places
• Mobility & transport
• Care & child protection
• Devolution of financial risk
• Reputation
London Councils

Assessing the impact
• Over half of households affected by the benefit cap live in London
• With a total of £130m to be cut from household incomes each year
• The top 20 worst affected local authority areas are all in London
• 2447 households were capped between 15 April and 31 May 2013
• Of these, 86% had 1-4 children and 67% were capped by £100 or less per week
• 29% of households who found work, say they looked for a job as a direct response to being notified or becoming aware of the cap.
*Data analysis by Sheffield Hallam in April 2013, DWP in July 2013 and Ipsos MORI/DWP in July 2013

Haringey – experiences of the benefit cap
• Borough population over 250,000
• Over 2,300 children live in households affected by cap
• Evictions and relocation to cheaper parts of country not happening yet, but on horizon as Discretionary Housing Payments end
• Some PRS landlords now excluding benefit recipients
• To date small number finding employment or moving

A north outer London borough - Welfare reforms impact on residents
23
Over 20,000 households impacted by Council Tax and Housing Benefit Reforms across the borough
4,600 with a gap of more than £25 a week between
their rent and their housing benefit
Total “welfare gap” between housing costs and housing benefit support of at least £20m a year for 2013/14

Over 10% of population are in receipt of Housing or Council Tax Support – at least 40% of these earn income from work
24
Total households: 35,858
(Sept 2013)
Housing Benefit Claimant Tenancies
Private
RentalSector
Local
AuthorityTennants
Social Sector
Tenants
20,830 On out of work benefits
Both HB and CTS
24,794
Housing Benefit and Council Tax Support Claimants
16,804
8,211
5,451
HB Only
5,673
CTS Only
5,392
55% of HB claimants live in the
private sector – Around half of
these claimants are in work
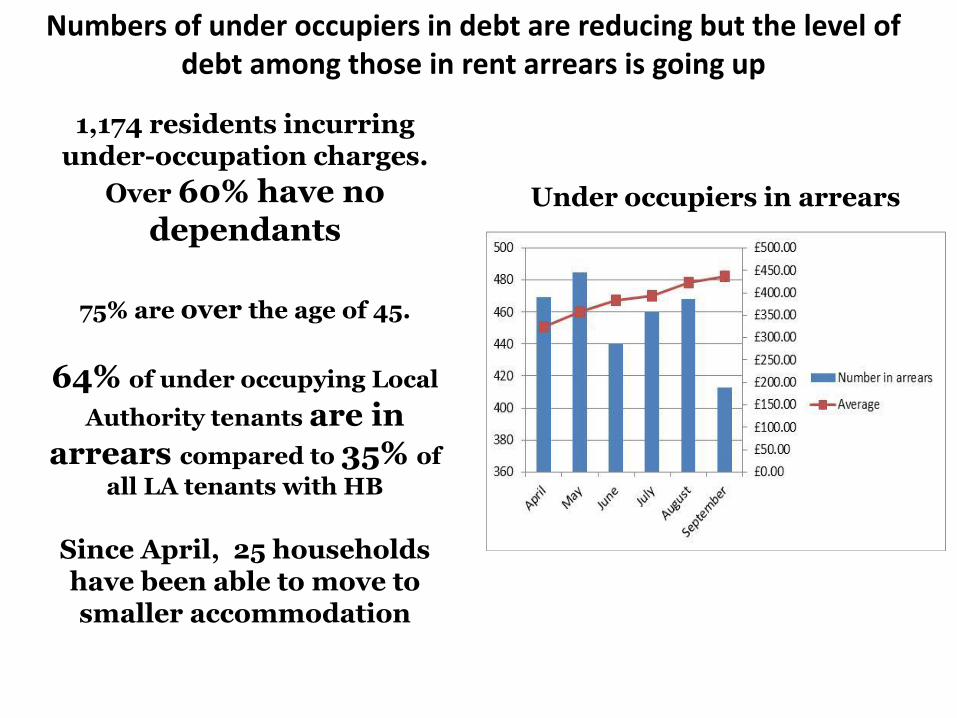
Numbers of under occupiers in debt are reducing but the level of debt among those in rent arrears is going up
25
1,174 residents incurring under-occupation charges.
Over 60% have no dependants
75% are over the age of 45.
64% of under occupying Local
Authority tenants are in arrears compared to 35% of
all LA tenants with HB
Since April, 25 households have been able to move to smaller accommodation
Under occupiers in arrears

Numbers of Local Housing Allowance claimants are increasing – and the majority are working
26
24%
45%
Number of housing allowance claimants
Housing Benefit claims by tenure
Housing Benefit claims from private sector tenants
increased by 65% over
the last 5 years
Percentage of these claimants
in work has risen from 24%
of claimants to 45% in that
time
Rent is going up by 10% a
year while LHA rate is due to rise by 1% a year

The average family affected by the Benefit Cap lives in the private sector, has 2 or 3 children and is losing £85 a week
27
0
50
100
150
200
250
£0-£50 perweek
£50-£100per week
£100-£150per week
£150-£200per week
£200+perweek
7+ Children
5-6 Children
3-4 Children
1-2 Children
0 Children
Larger families are losing more
money per week
61% of affected
households are headed
by single female parents
the majority live in the
Private rental sector
540 households affected

Disproportionate numbers of capped couples with children are moving into work while single mothers opt to “stay and pay”
28
18% of those due to be affected have moved into
work, 3% have moved house
Stay and pay In work
(180 cases)
66 capped households have opted to “stay and pay”, losing on average £36 a week.
Analysis suggests that 36% of benefit cap households are
at high risk of presenting with housing crisis
Moved
(20 cases)

0
200
400
600
800
1000
1200
2008/9 2009/10 2010/11 2011/12 2012/13
Presentations Acceptances TA admissions
Numbers in housing crisis are rising
0
100
200
300
400
500
600
700
800
2008/9 2009/10 2010/11 2011/12 2012/13
Council Housing Association Private Rented Sector
29
The number of affordable private sector units
available for the council to
house its clients has decreased
The number of people being accepted as
homeless is
increasing. Housing application Investigations
up 17% in 18 months

A growing gap between LHA rates and rents making housing less affordable for many families
30
In July 2013 there
were 6,954
households with a shortfall between their
LHA rate and their rent.
155,000,000
165,000,000
175,000,000
185,000,000
195,000,000
205,000,000
2013/14 2014/15 2015/16 2016/17 2017/18
Max LHA Allowanceper annum
Total Rent per annum
Rents are rising at 9% a year while LHA rates are rising at just
1% a year.
by 2017 4,000 households
in borough could have a
shortfall of £100 or more a week
0
2000
4000
6000
8000
10000
12000
14000
16000
2013/14 2014/15 2015/16 2016/17 2017/18
Nu
mb
er
of
ho
useh
old
s
Year
Projected shortfall between LHA rate and rent
200+
100-199.99
50.00-99.99
25-49.99
0-24.99
Shortfall
per week (£)

This means the cost of temporary housing is rising
Number of Temporary Accommodation Units Procured above Housing
Benefit Subsidy Cap
0
50
100
150
200
250
300
350
400
450
Apr-
12
May-
12
Jun-
12
Jul-
12
Aug-
12
Sep-
12
Oct-
12
Nov-
12
Dec-
12
Jan-
13
Feb-
13
Mar-
13
£0
£200,000
£400,000
£600,000
£800,000
£1,000,000
£1,200,000
Apr-
12
M
ay-
12
Jun-
12
Jul-
12
A
ug-
12
S
ep-
12
Oct-
12
N
ov-
12
D
ec-
12
Jan-
13
F
eb-
13
Mar-
13
31
Increasing demand and
higher rents means it costs the council more to
procure temporary accommodation for homeless
families
At the end of last year the council had spent more than above the
subsidy level limit £1m

Couple with 2 children under five
32
Weekly Income Weekly Outgoings
Work 388.99 Rent – 2 bed flat in the borough 265
Child Tax Credit 77.16 Council Tax 25
Housing Benefit 118.54 Utilities 50
Child Benefit 33.70 Transport 60
Total 618.34 Food and household goods 100
Clothes – school uniform etc 40
Childcare 105
Total 645
Figures based on both partners working (one full time, one part time)
both on London living wage, and making use of free childcare 15hrs a
week but requiring some additional childcare before and after work and
in school holidays.
Next year: rent goes up to £290 a week but housing benefit only increases to £119.72

Councils securing properties out of borough - 1
• Data 2009 – 2012, Bureau of Investigative journalists
• Total moves within London – 19,057
• Total moves into borough
Highest: Enfield 2,184 - Haringey 1,833
Waltham Forest 1,810 - Redbridge 1,731
Barking & Dagenham 1,618
Lowest: Kingston 7 - Richmond 11 - Sutton 16 Camden 123 - Bromley 149

Boroughs securing properties within other London Boroughs
• Examples:
• Newham 3792 (including 1352 to Redbridge, 1136 to Barking &
Dagenham, 929 to Waltham Forest, 238 to Havering)
• Islington 2115 (including 1120 in Haringey & 372 in Enfield)
• Haringey 1788 (including 1147 in Enfield)
• Redbridge 1241 (including 252 to Barking & Dagenham)
• Greenwich 1009 (including 405 to Lewisham)
• Camden 552 (including 242 to Haringey and 117 in Enfield)


Councils securing properties out of London
Moves out of London, examples:
Ashford 1 - Thanet 3 – Romford 6
Hastings 3 (2 from Newham, 1 from Croydon)
Kent 20 ( 13 from Bromley 2 from Newham etc)
Thurrock 34 - Luton 36 - Essex 27
Slough 100 – Gravesham 86 (all from Bexley)
Dartford 436

Private rented sector
• Flexibility, ease of access, supports London’s economic vitality and dynamism.
• For young people and job seekers, and increasingly, families
• The private rented sector is home to a quarter of all Londoners, and based on current projections it will house a third within a decade and a half.
• Home ownership is now unobtainable for many
• As more people live in it longer, they need better management, consistent standards and more choice

PRS – key principles
• London Rental Standard
• Longer tenancies for families
• Landlord accreditation bodies to improve PRS
• Increase housing supply – use PRS to unlock stalled schemes
• Building typologies – designed for occupation by renters rather than buyers,
• Owned and managed by institutions and professional landlords for the long term.