The London experience
34
1 The definitive, peer-reviewed and edited version of this book chapter is published and can be cited as Santos, G. (2008), ‘The London Experience’, in Verhoef, E., Van Wee, B., Steg. L. and M. Bliemer (eds.), Pricing in Road Transport: A Multi- Disciplinary Perspective, Edward Elgar, pp. 273-292. DOI: 10.4337/9781848440258.00022 ISBN: 978 1 84542 860 0 Chapter 14 The London experience Georgina Santos Transport Studies Unit University of Oxford Abstract: This chapter discusses the London Congestion Charging Scheme. It provides a thorough and critical discussion of the background, design, effects, and costs and benefits of the scheme, and it indicates its “winners and losers”. Furthermore the chapter elaborates on the possible effects of extending the scheme.
Transcript of The London experience

1
The definitive, peer-reviewed and edited version of this book chapter is
published and can be cited as
Santos, G. (2008), ‘The London Experience’, in Verhoef, E., Van Wee,
B., Steg. L. and M. Bliemer (eds.), Pricing in Road Transport: A Multi-
Disciplinary Perspective, Edward Elgar, pp. 273-292.
DOI: 10.4337/9781848440258.00022
ISBN: 978 1 84542 860 0
Chapter 14
The London experience
Georgina Santos
Transport Studies Unit
University of Oxford
Abstract: This chapter discusses the London Congestion Charging Scheme. It provides a
thorough and critical discussion of the background, design, effects, and costs and benefits of
the scheme, and it indicates its “winners and losers”. Furthermore the chapter elaborates on
the possible effects of extending the scheme.
2
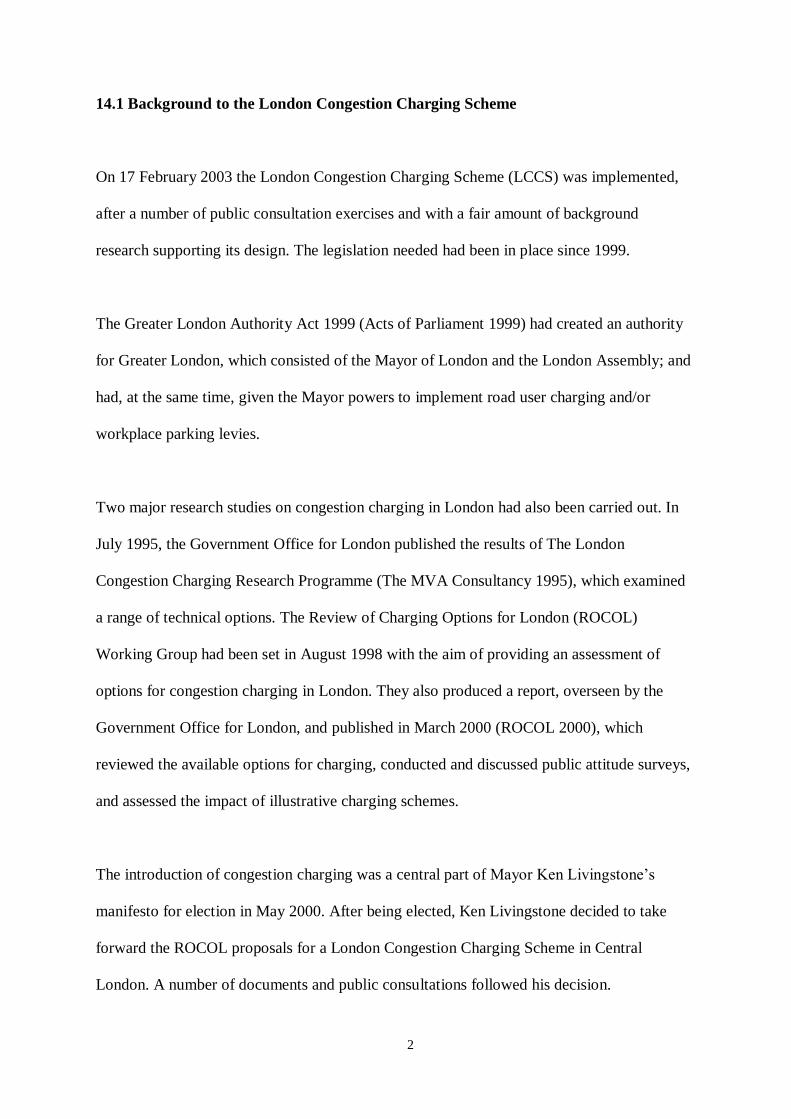
14.1 Background to the London Congestion Charging Scheme
On 17 February 2003 the London Congestion Charging Scheme (LCCS) was implemented,
after a number of public consultation exercises and with a fair amount of background
research supporting its design. The legislation needed had been in place since 1999.
The Greater London Authority Act 1999 (Acts of Parliament 1999) had created an authority
for Greater London, which consisted of the Mayor of London and the London Assembly; and
had, at the same time, given the Mayor powers to implement road user charging and/or
workplace parking levies.
Two major research studies on congestion charging in London had also been carried out. In
July 1995, the Government Office for London published the results of The London
Congestion Charging Research Programme (The MVA Consultancy 1995), which examined
a range of technical options. The Review of Charging Options for London (ROCOL)
Working Group had been set in August 1998 with the aim of providing an assessment of
options for congestion charging in London. They also produced a report, overseen by the
Government Office for London, and published in March 2000 (ROCOL 2000), which
reviewed the available options for charging, conducted and discussed public attitude surveys,
and assessed the impact of illustrative charging schemes.
The introduction of congestion charging was a central part of Mayor Ken Livingstone’s
manifesto for election in May 2000. After being elected, Ken Livingstone decided to take
forward the ROCOL proposals for a London Congestion Charging Scheme in Central
London. A number of documents and public consultations followed his decision.

3
The first such document was Hearing London’s Views, which was published in July 2000,
and sent to local councils, businesses and road user representatives in order to get feedback
on the initial ideas for a charging scheme.1 After these comments, the Mayor’s draft
Transport Strategy, which included proposals for a central London congestion charging
scheme, was published on 11 January 2001 and sent to public consultation until 30 March
2001. This in turn was followed by his final Transport Strategy, published on 10 July 2001.
The proposed congestion charging scheme was then sent out for public consultation in its
own right from 23 July to 28 September 2001. The results of this public consultation,
especially in the area of exemptions and discounts, translated into modifications to the
proposed scheme. Following the publication of the proposed modifications to the Scheme in
November 2001, there was a further consultation period until 18 January 2002.
On 26 February 2002 the Mayor finally confirmed the Scheme Order. This Order was
subsequently modified several times until 14 February 2003. Even after the Scheme was
implemented there were a number of Variation Orders that were confirmed and incorporated
into the Greater London (Central Zone) Congestion Charging Order, the most significant one
being the extension of the charging zone to include Kensington and Chelsea. More variations
may be introduced in the future.
1 Despite several phone and e-mail attempts over three months, TfL were unable to provide the author
with information on the proportion of people who replied to Hearing London’s Views in favour of the
scheme before it was implemented. As of February 2007 no information on the matter is available on
the Transport for London website.

4
14.2 The London Congestion Charging Scheme
The LCCS, designed and managed by Transport for London (TfL), is an area licensing one.
All vehicles entering, leaving, driving or parking on a public road inside the zone between
7:00am and 6:00pm Monday to Friday, excluding public holidays must pay a congestion
charge. This was initially £5, but on 4 July 2005 it was increased to £8. Similarly, the original
hours of charging extended until 6:30pm, but they were shortened by 30 minutes on 19
February 2007, when the charging zone was extended westwards.
Figure 14.1 shows the limit of the area. The north limit follows the Grand Union Canal and
Harrow Road in part, Westway A40, Eastbourne Terrace, Praed Street, Sussex Gardens, Old
Marylebone Road, Marylebone Road, Park Crescent, Euston Road, Pentonville Road, and
City Road. The east limit follows Old Street, Commercial Street, Tower Bridge Road. The
south limit is determined by New Kent Road, Kennington Lane, Vauxhall Bridge Road,
Grosvenor Road, Chelsea Embankment and Cheyne Walk. The west limit follows Edith
Grove, Redcliffe Gardens, the southbound route of the Earl’s Court One-Way System,
Pembroke Road, Warwick Gardens, Addison Road, Holland Road, the West Cross Route, the
Great Western Railway Line and Scrubs Lane.

5
Figure 14.1 Map of the London congestion charging zone
Source: www.cclondon.com/download/DetailMapECCZ.pdf
No charge is made for driving on the roads that mark the limit of the charging zone, and there
are two free corridors: one north to south along Edgware Road, Park Lane, Grosvenor Place,
Bressenden Place and Vauxhall Bridge Road; and another one north-west of the zone, east to
west, as the diversion route would have been too long for drivers just wanting to cross that
segment of Westway A40. The dark-coloured roads on Figure 14.1 are all free of charge.
The charging zone is relatively small. It roughly covers 39 km2 (15 mi
2), representing 2.4 per
cent of the total 1,579 km2 (617 mi
2) of Greater London.
Payment can be made for a day, a week, a month and a year, up to 90 days in advance. The
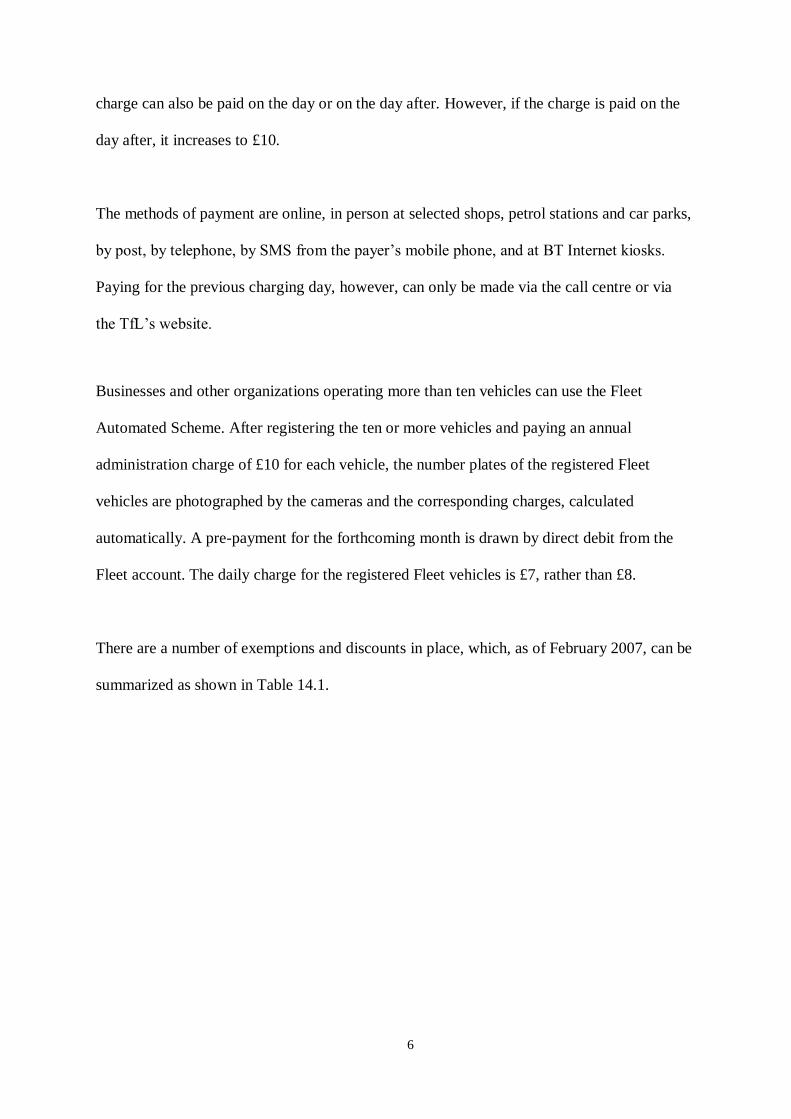
6
charge can also be paid on the day or on the day after. However, if the charge is paid on the
day after, it increases to £10.
The methods of payment are online, in person at selected shops, petrol stations and car parks,
by post, by telephone, by SMS from the payer’s mobile phone, and at BT Internet kiosks.
Paying for the previous charging day, however, can only be made via the call centre or via
the TfL’s website.
Businesses and other organizations operating more than ten vehicles can use the Fleet
Automated Scheme. After registering the ten or more vehicles and paying an annual
administration charge of £10 for each vehicle, the number plates of the registered Fleet
vehicles are photographed by the cameras and the corresponding charges, calculated
automatically. A pre-payment for the forthcoming month is drawn by direct debit from the
Fleet account. The daily charge for the registered Fleet vehicles is £7, rather than £8.
There are a number of exemptions and discounts in place, which, as of February 2007, can be
summarized as shown in Table 14.1.

7
Table 14.1 Exemptions and discounts
Discount/status Category
Fully exempt Motorcycles, mopeds and bicycles
Emergency vehicles
Public transport vehicles with 9 or more seats
Vehicles used by disabled persons who are exempt from road tax
Licensed London taxis and mini-cabs
National Health Service vehicles that are exempt from road tax
100% discount with Certain military vehicles
free registration Vehicles with 9 or more seats not licensed as buses (e.g. work buses,
community service buses, private hire minibuses)
100% discount with Vehicles driven for or by individuals or institutions that are
a one-off £10 Blue Badge holdersa
registration Motortricycles (1 metre or less in width and 2 metres or less in length)
100% discount with Alternative fuel vehicles (requires certain emission savings for each vehicle
£10 registration per type, as described on the TfL website) and electrically propelled vehicles
per year Roadside assistance and recovery vehicles (e.g. motoring organizations
such as the Automobile Association)
90% discount with Vehicles registered to residents of the central zone
£10 registration
per year
Notes:
a Blue Badges, which existed before the scheme was implemented, are special parking permits issued
to disabled people to allow them to park near shops, stations, and other facilities. The badge belongs
to the disabled person who qualifies for it (who may or may not be a car driver) and can be used in any
vehicle they are travelling in. The discount applies to individual Blue Badge holders anywhere in the
EU.
Source: www.cclondon.com/exemptions.shtml

8
The 90 per cent discount to residents, which originally only applied to residents living inside
the charging zone, has been extended beyond the charging zone boundary. The decision was
made on the basis of the results of the 2004 public consultation on the Transport Strategy
Revision.
The reasons for extended residents’ discount zones are linked to parking and severance issues
(TfL 2005b, p.10). For example, in some cases, the designated residents’ parking is inside the
extension and there are no alternative parking arrangements for these residents outside the
zone. In other cases, the nearest, most accessible local services and amenities (such as
hospitals, libraries, and leisure centres) are inside the extension (TfL 2005b, p.11). The areas
where the extended residents’ discount applies are the shaded areas just outside the bold line
that shows the limits of the charging zone on the map in Figure 14.1.
Enforcement is undertaken with Automatic Number Plate Recognition (ANPR). There are
camera sites located at every entry and exit to the congestion charging zone and also inside
the zone. These cameras read and record the number plates of virtually all the vehicles
making use of the zone, to subsequently send them to a processing centre with ANPR
software. These number plates are then matched against the number plates that have paid, are
exempt, entitled to a 100 per cent discount, or registered with the Fleet Scheme. The pictures
of the matched number plates are then deleted. After a manual check, violators are tracked
through the Driver and Vehicle Licensing Agency and issued with a Penalty Charge Notice
(PCN) of £100. As of February 2007 the PCN of £100 is reduced to £50 if paid within 14
days, and increased to £150 if not paid within 28 days.
9
Once a penalty has increased to £150, a charge certificate is sent to the registered keeper or
hirer of the vehicle. Failure to pay the outstanding charge can lead to the registration of the
debt with the County Court and the eventual appointment of bailiffs to recover the debt.
Vehicles with three or more outstanding congestion PCNs may be clamped or removed,
anywhere in Greater London. As of February 2007 the clamp fee is £65 and the removal fee
is £150. Storage of the vehicle costs £25 a day. If a vehicle is clamped or removed, then all
the outstanding charges must be paid before it is released. If the release fee is not paid, then
the vehicle may be disposed at auction or by scrapping. In this case, the registered keeper
remains liable for all outstanding charges, including an £80.25 disposal fee.
14.3 Impacts of the LCCS
At the time of this chapter going to print, the Western extension was still very recent and
there were no actual data on the impacts, only forecasts. For this reason, the impacts are
reported separately for the original zone, which is the area to the east of what is now the north
to south free route, highlighted with a bold line cutting across the whole charging zone on
Figure 14.1, and the extension, which is the area to the west of that route.

10
14. 3.1 Original zone
14. 3.1.1 Impacts on traffic
Congestion
The aim of the LCCS was to reduce traffic congestion in and around the charging zone, and it
succeeded in so doing in the first two years. Even in the third year congestion was lower than
that observed before the Scheme was introduced, although the difference was not as big.
During 2003 and 2004 there were average reductions in congestion within the charging zone
of 30 per cent when compared with pre-charging levels (TfL 2005a, p.14). Congestion is
defined by TfL as ‘the difference between the average network travel rate and the
uncongested (free-flow) network travel rate in minutes per vehicle-kilometre’ (TfL 2003a,
Table 3.1, p.46). Using the uncongested network travel rate of 1.9 min per km (approximately
32 km per hour) from TfL (TfL 2003a, p.52), and 2002 and 2003/04 average travel rates of
4.2 and 3.5 min per km, respectively, it can be seen that congestion decreased from 2.3 to 1.6
min per km (TfL 2005a, p.15). Most of this reduction in travel times was the result of reduced
queuing ‘time at junctions, rather than increases in driving speeds’ (TfL 2005a, p.13).
In 2005, however, TfL (2006, p.4) reported that average delay values were 1.8 min per km,
rather than 1.6 min per km as in the previous two years. This would imply a reduction in
congestion of just under 22 per cent, in contrast with the 30 per cent reported for 2003 and
2004.
Since vehicles travelling on the Inner Ring Road (which marked the limit of the original
charging zone) do not pay the congestion charge, TfL expected that through traffic, with
origin and destination outside the charging zone, would divert and use the Inner Ring Road

11
instead. However, improved traffic management arrangements were put into place on the
Inner Ring Road before the Scheme started, and this prevented an increase in congestion. For
example, between one and two seconds were taken off green light time on radial roads, which
were anticipated would have less traffic, and added on to green light time on the Inner Ring
Road. That made a sufficient difference to keep the Ring Road operating satisfactorily with
marginally lower levels of congestion in 2003, when compared with pre-charging conditions
in 2002 (TfL 2004a, p.14). However, a further two surveys were undertaken in 2004 and,
although the first of these surveys still indicates a reduction in congestion, comparable to that
found in 2003, the second survey, conducted in Autumn 2004, indicates similar levels of
congestion to those that prevailed in 2002, before the LCCS was implemented.
Congestion on main radial routes approaching or leaving the charging zone decreased in 2003
and increased in 2004, with TfL (2005a, p. 18) concluding that the level of congestion in that
year was only marginally lower than in 2002, before charging. In 2005 conditions on the
main radial routes were similar to those observed in 2004 (TfL 2006, p.4). Main roads in
inner London also had higher levels of congestion in 2005 than in 2002, before the Scheme
was implemented (TfL 2006, p.4).
Vehicle counts
The total volume of traffic entering the charging zone during charging hours in 2003 and
2004 was 18 per cent lower than in 2002. Table 14.2 gives the percentage changes in
numbers of different vehicle types entering and leaving the charging zone in 2003 and 2004.
As expected, there was a reduction of potentially chargeable vehicles and an increase in
exempt vehicles.

12
Table 14.2 Percentage change in number of vehicles entering and leaving
the charging zone in 2003 and 2004
Change
inbound
2003 vs
2002
Change
outbound
2003 vs
2002
Change
inbound
2004 vs
2003
Change
outbound
2004 vs
2003
Cars -33% -35% -1% -2%
Taxis +17% +8% -1% 0%
Buses and coaches +23% +21% +8% +4%
Vans -11% -15% -1% -1%
Lorries and other -11% -12% -5% -5%
Pedal cycles +19% +6% +8% +8%
Powered two-wheelers +12% +5% -3% -4%
Source: TfL (2005, Fig.11, p.25).
Whilst the number of certain vehicle-types will decrease, the kilometres they are driven may
increase. Depending on the relative magnitude of these changes, the total vehicle-kilometres
driven may increase or decrease. Chargeable vehicles in London have, however, all decreased
their vehicle-kilometres, which indicates that the reduction in their number was not
compensated by the potentially longer distances driven.
TfL reports a decrease of 15 per cent in vehicle-kilometres driven by vehicles with four or
more wheels inside the charging zone during charging times in the first year of the LCCS and
a further 6 per cent reduction in the second year (TfL, 2005a, p.28). Table 14.3 gives the
changes in vehicle-kilometres by vehicle type.

13
Table 14.3 Vehicle-kilometres (vkm) driven within the charging zone during charging hours, including percentage share of traffic
2002 vkm 2003 vkm 2004 vkm % change % change
Vehicle type (millions) (millions) (millions) 02 to 03 03 to 04
All vehicles 1.64 100% 1.45 100% 1.38 100% -12% -5%
Four or more wheels 1.44 88% 1.23 84% 1.16 84% -15% -6%
Potentially chargeable 1.13 69% 0.85 58% 0.80 58% -25% -6%
Cars 0.77 47% 0.51 35% 0.47 34% -34% -7%
Vans 0.29 18% 0.27 19% 0.26 19% -5% -4%
Lorries and other 0.07 4% 0.07 5% 0.06 5% -7% -8%
Licensed taxis 0.26 16% 0.31 21% 0.29 21% +22% -7%
Buses and coaches 0.05 3% 0.07 5% 0.07 5% +21% +5%
Powered two-wheelers 0.13 8% 0.14 9% 0.13 10% +6% -2%
Pedal cycles 0.07 4% 0.09 6% 0.09 7% +28% +4%
Source: TfL (2005, Fig.15, p.29).
Note: Annualized weekday for 2002, 2003 and 2004.

14
Public transport
Table 4 summarizes the number of buses and bus passengers crossing the charging zone in
2002 and 2003. Up to half of the increase in bus passengers was provisionally assessed as
being primarily due to the LCCS, with the remainder probably reflecting the long-term
background growth in bus patronage, as a result of service improvements (TfL 2005a, p.44).

15
Table 14.4 Bus passengers and buses crossing the charging zone boundary
AM peak (7:00-10:00am) Charging hours (7:00am - 6:30pm)
Inbound Inbound Outbound
Passengers Buses Passengers Passengers Buses Passengers Passengers Buses Passengers
per bus per bus per bus
Autumn 2002 77 000 2 400 32 193 000 8 280 23 163 000 7 800 21
Autumn 2003 106 000 2 950 36 264 000 10 500 25 211 000 9 900 21
Percentage difference +38% +23% +12% +37% +27% +8% +29% +26% +2%
Source: TfL (2005, Fig. 27, p.45).

16
In 2004 the number of passengers crossing the charging zone by bus inbound between
7:00am and 10:00am increased by a further 12 per cent compared with 2003 (TfL 2005a,
p.45)
In the first full year after the introduction of the LCCS there were substantial reductions in
excess waiting time, the additional waiting time at bus stops caused by service irregularity or
missing buses. This reduction was 24 per cent overall across Greater London and over 30 per
cent in and around the charging zone (TfL 2005a, p.50). In the period March to December
2004, there was a further reduction in excess waiting time of 18 per cent in and around the
charging zone (TfL 2005a, p.50).
In the first year of the LCCS there was a decrease in patronage of the London Underground.
This was mainly due to the slowdown of the economy, the decrease in tourism in London,
which in turn might have been linked to the war in Iraq, and the temporary closure of the
Central Line for almost three months, following a derailment at Chancery Lane station (TfL
2003b, points 2.2 and 5.4). In the second year of the LCCS this trend was reversed. Although
inside the charging zone, patronage of the Underground during 2004 was still lower than in
2002, across the whole Underground network, patronage was roughly similar to that of 2002,
before the introduction of charging (TfL 2005a, p.52).
No change was registered in the use of national rail following the implementation of the
LCCS (Tf, 2004a, p.39; TfL 2005a, p.53).
17
14.3.1.2 Economic impacts
The impacts of the LCCS on the economy in central London have been neutral (TfL 2005a,
p.68). The scheme started in February 2003, when the economy was slowing down, after four
quarters of negative growth (TfL 2005a, p.71). The economy picked up however, at the end
of 2003 and during 2004.
A number of studies and data bases were used to compare business performance in terms of
variables such as number of businesses or sites, numbers of employees, sales and profits,
inside and outside the congestion charging zone and before and after the introduction of the
LCCS. The conclusion of these comparisons is that, overall, businesses have not been
significantly affected by the congestion charge (TfL 2005a, p.73). Commercial and
residential property markets do not show any impacts from the congestion charge either (TfL
2005a, p.68).
Ernst and Young conducted an independent review, which concluded that the £5 charge had
had a neutral impact on the central London economy (TfL 2006, p.68).
14.3.1.3 Impacts on accidents and the environment
TfL (2005a, p.5; 2006, p.6) claims that the LCCS is responsible for between 40 and 70 fewer
accidents per year within the charging zone and on the Inner Ring Road in comparison with
the background trend. They estimate the monetary costs of accident savings at £15 million
per year. Assuming there have indeed been between 40 and 70 accidents saved per year,2 the
monetized value of 15 million seems to be too high.
2 TfL (2006, pp.112-114) summarizes the results obtained by an independent statistical study, which
confirms that congestion charging has led to these additional net reductions.

18
From all traffic accidents in London involving personal injury, around 87 per cent are slight,
13 per cent are serious, and just under 1 per cent are fatal (TfL 2005a, Figure 78, p.106; TfL
2001, Table 16, p.28; TfL 2004b, Table 6.1.1, p.50).3 Applying these shares to the upper
bound of 70 accidents saved, as reported by TfL (2005b; 2006), together with the total cost
per accident by severity as calculated in the Highways Economics Note 1 (DfT 2007, Table
3, p.11), yields an estimate of just over £4 million at 2005 prices.4 This is much lower than
the £15 million reported by TfL.
Despite the increase in the use of bicycles and motorcycles, accidents involving them have
decreased, in line with the long-term background trend (TfL 2005a, p.5). Higher average
speeds have not resulted in more accidents because most of the time savings are experienced
at junctions, where there is less queuing (TfL 2005a, p.5). Driving speeds themselves have
not increased.
Emissions of nitrogen oxides and particulate matter within the charging zone have been
reduced by 18 and 22 per cent, respectively, due to the effect of both charging and vehicle
technology (TfL 2006, p.118). On the Inner Ring Road, the reductions were approximately
12 per cent for nitrogen oxides and 13 per cent for particulate matter (TfL 2006, p.118).
3 Figure 78 (TfL 2004b) corresponds to traffic accidents on the Inner Ring Road and within the
charging zone only, but the shares are the same as those derived from Table 16 in TfL (2001) and
Table 6.1.1 in TfL (2004b), which cover the whole of Greater London.
4 The average values per accident, by severity of accident, are £1,644,790 for fatal accidents,
£188,920 for serious accidents, and £19,250 for slight accidents (DfT 2007, Table 3, p.11). These
estimates include lost output, medical and ambulance costs, human costs to reflect the pain, grief and
suffering, police costs, insurance and administration costs, and damage to property. These estimates
correspond to average accidents. For example in 2005, a fatal accident on average involved 1.10
fatalities, 0.36 serious casualties and 0.54 slight casualties (DfT 2007, paragraph 6, p.4).

19
The reduction in emissions of carbon dioxide inside the zone in the first year of operation is
estimated at 15.7 per cent inside the charging zone and 8.5 per cent on the Inner Ring Road
(TfL 2006, Table 6.3, p.117). No estimates are available for later years.
14.3.2 Western extension
The Western extension is different form the original charging zone. The impacts from
congestion charging are therefore expected to be different. Table 14.5 presents the numbers
of employees, business units and residents in the two zones, showing how these differ.
Table 14.5 Employees, business units and residents in the original
charging zone and in the Western extension
Original zone Western extension
Employees(a)
1,235,257 218.477
Business units (a)
81,667 21,692
Residents(b)
148,000 230,000
Sources: (a) TfL (2006, Table 11.2, p.206); (b) TfL (2005b, Table 7.1, p.95)
and TfL (2004b, p.3).
The benefits in general will be lower because the expected reductions in traffic are smaller
than those experienced with the original scheme. The reasons for this are as follows:
1. Drivers in the extension who already pay the charge because they use the original
charging zone, will continue to travel regardless of charging inside the extension or not
(TfL 2005b, p.66, point 6.1.7).
2. Residents within the extension are entitled to a 90 per cent discount and will probably be
attracted onto the roads. By paying the discounted charge they are able to drive not only in
20
the extension but also in the original charging zone. Some residents who did not drive may
start driving, including those who initially made alternative arrangements after the LCCS
was first introduced (TfL 2005b, points 6.4.11 and 6.4.12, p.72).
3. There is a greater proportion of car travel by residents in the extension than there is in the
original zone, and therefore a higher proportion of households are able to take advantage of
a residents’ discount. The number of cars registered for a resident discount may thus
increase by more than 150 per cent (TfL 2004c, p.3).
A reduction in vehicle-kilometres of between 10 and 14 per cent within the extension is
expected. Average speeds are also projected to increase by between 10 and 14 per cent (TfL
2005b, point 6.4.10, p.72).
Traffic on the free corridor north to south (the west limit of the original charging zone) is
expected to increase by between 1 and 2 per cent, and traffic on the other limits of the
original zone is expected to decrease by between 1 and 2 per cent (TfL 2005b, point 6.4.14, p.
73). Traffic on the boundary of the Western extension (other than the free corridor north to
south) is projected to increase by between 3 and 5 per cent (TfL 2005b, point 6.4.16, p.73).
The extension will also cause an increase in vehicle-kilometres in the original charging zone
of roughly 2 per cent, mainly because, as explained in point (2) above, residents will be
priced onto the roads. As a result of this, average speeds in the original charging zone are
expected to decrease by 2 per cent (TfL 2005b, points 6.4.17 and 6.4.19, p.74).

21
With the end time brought forward to 6:00pm, inbound traffic to the enlarged zone between
6.00pm and 6.30pm is expected to increase to pre-charging levels. The increase could be
even higher if drivers who used to enter the original charging zone earlier in the day change
their travel time to enter it after 6:00pm and those who used to arrive after 6:30 change their
travel time to arrive earlier but after 6:00pm, when charging now finishes (TfL, 2005b, point
6.4.21, p.74).
An increase of between 2 and 3 per cent in public transport passengers is expected, 75 per
cent of which will affect buses (TfL 2005b, point 6.4.47, p.84).
As shown in Table 14.7 in the section that follows, TfL believes that as a result of the
extension there will be fewer accidents, which they value at £5 to £10 million per year.
However, Santos and Fraser (2006, pp.287-288) are suspicious of those estimates, which
either attribute too many accidents prevented to the extension or assume an excessive
proportion of severe injuries and fatalities prevented, or both.
14.4 Costs, benefits and revenues
14.4.1 Original LCCS
The capital costs of the LCCS were approximately £200 million at 2002 prices, most of
which were provided by the central government.5
The annual costs and benefits of the LCCS are presented in Table 14.6. The figures are in
2005 values and prices.
5 Information provided by TfL on request.

22

23
Table 14.6 Annual operating costs and benefits of the London scheme (£ million at 2005
prices and values, charge at £5)
Costs
TfL administration
TfL contractors
Additional bus costs
Total
5
85
20
110
Benefits
Time savings and reliability benefits to car occupants, business trips
Time savings and reliability benefits to car occupants, journey to work and other trips
Time savings and reliability benefits to taxi occupants, business trips
Time savings and reliability benefits to taxi occupants, journey to work and other trips
Time savings and reliability benefits to commercial vehicle occupants
Time savings and reliability benefits to bus passengers, business trips
Time savings and reliability benefits to bus passengers, journey to work and other trips
Charge-payer compliance costs to car occupants, business trips
Charge-payer compliance costs to car occupants, journey to work and other trips
Charge-payer compliance costs to commercial vehicle occupants
Vehicle fuel and operating savings
Accident savings
Disbenefit to deterred trip makers, business trips
Disbenefit to deterred trip makers, journey to work and other trips
Reduced CO2 emissions
Total
65
45
30
10
35
2
40
-10
-10
-10
10
15
-5
-20
3
200
Source: TfL (2006, Table 9.1, p.172).
‘Charge-payer compliance costs’, listed as disbenefits, are resources consumed by charge-
payers (not the Scheme operators) to comply with the Scheme. These estimates include, for
example, the time consumed in actually paying charges, such as in making the telephone call,

24
walking to the retail outlet, or logging on to the Internet. They do not include the financial
transaction as this is deemed to be a transfer payment.
The scheme generated net revenues of roughly £122 million in 2005/06, including the
increase experienced after the change from £5 to £8. From these revenues, £100 million have
been spent on improving bus services (TfL 2006, p.174).
14.4.2 Western extension
The capital costs of the extension are projected to be between £113 and £118 million at 2005
values and prices (TfL 2005b, Table 7.8, p.108).
Table 14.7 gives costs and benefits of the extension for the first year of operation. The values
are in 2005 values and prices.

25
Table 14.7 Costs and benefits of the Western extension for the first year of operation
(£ million at 2005 values and prices)
Costs
High
sensitivity
Low
sensitivity
Service provider costs (operating) 9.9 11.8
Enforcement infrastructure costs (operating) 6.1 6.1
Contracted enforcement costs (operating) 4.6 4.6
Business operations costs (operating) 3.0 3.6
Additional bus costs 15.0 11.0
6.00pm finish: reduced operating costs to existing scheme -1.0 -1.0
Total 37.6 36.1
Benefits High
sensitivity
Low
sensitivity
Time savings to vehicle occupants 63 44
Increased journey time reliability to vehicle occupants 6 4
Time savings and increased reliability for bus users 21 15
Reduced fuel consumption 2 2
Reduced number of accidents 10 5
Disbenefits to deterred car occupants -16 -12
Charge-payer compliance costs -6 -7
6.00pm finish: loss of benefits to existing scheme -12 -7
Total 68 44
Source: TfL (2005b, Tables 7.4, 7.6 and 7.7, pages 100, 104 and 105, respectively).
The lower sensitivity values reflect a ‘relatively inelastic response to the introduction of
charging’, and the higher sensitivity values reflect a more elastic response (TfL 2005b, p.71).
The corresponding reductions in vehicles with four or more wheels entering the extension are
projected to be 13 per cent under the low sensitivity assumption and 17 per cent under the
high sensitivity assumption.

26
The net revenues from the extension, after including operating costs but not implementation
costs or additional bus costs in the calculations, are projected to be between £25 and £40
million per year (TfL 2005b, Point 7.5.26, p.102).
It is interesting to note the very high annual costs of the extension, which result in relatively
small benefits – between £7.9 and £30.4 million per year. Santos and Fraser (2006) model the
extension using a spreadsheet traffic model and find similar results to TfL’s, and a benefit
cost ratio of around 1. This cost-benefit analysis includes capital and operating costs and
benefits, discounted over a ten-year period.
Unfortunately Tables 14.6 and 14.7, which are virtually reproduced from TfL’s reports,
contain information that cannot be checked. The author would have preferred to check the
reliability and validity of the data, methods and assumptions in more detail. However, TfL
were unable to answer any of her questions or provide any data within a reasonable time
span.
14.5 Winners and losers
In the case of London, the original charging zone has clearly yielded social gains by reducing
levels of traffic and travel times. With heterogeneous travellers, who have different values of
time, use different modes of transport, and have different journey purposes, the distributional
impacts are, however, necessarily complicated to assess.
Using vehicle counts pre- and post-charging and their occupancy rates, Santos (2004, p.273)
estimates that 52 per cent of all people travelling to or from the charging zone used buses

27
before the LCCS was introduced. If taxi and pedal and motorcycle users are added as well,
the total share of people who did not use a chargeable mode of transport before the LCCS
rises to 63.9 per cent. These are winners, in the sense that they are enjoying the benefits from
the scheme (higher speeds and lower travel times) without paying anything and without
undergoing the disutility of making alternative travel arrangements.
From a very conservative point of view, the remaining 36.1 per cent would be car users, who
are probably losers. These car users are mostly worse off either because they have had to
switch mode or change time or suppress their trip, or because the benefits they get from lower
travel times are lower than the cost of the charge. The exceptions are commuters with a very
high value of time and car users that travel during working hours, or are either exempt or
entitled to a discount.
Santos and Bhakar (2006, p.29) estimate that the minimum income for a car commuter to
benefit from a £5 charge is £1,400 per week. They do this exercise assuming that the value of
time is lower in uncongested conditions in comparison with congested conditions.6
This weekly salary of £1,400 is roughly equivalent to an annual salary of just under £75,000.
Given that on average, the richest 10 per cent of full-time workers in London earn over
£65,450 per year (Office for National Statistics 2004a, Table 7.7a), it is not unreasonable to
think that quite a number of car commuters would have benefited from the £5 congestion
charge.
6 MVA et al (1987, p.176) estimate that the value of time in congested conditions can be up to 40 per
cent higher; Wardman (2001, p.125) concludes that it can be 50 per cent higher; and Steer Davies
Gleave (2004, p.19) concludes that it can be almost 100 per cent higher. TfL (2005b, point 7.5.4,
p.99), however, assumes a uniform value of time, regardless of the prevailing traffic conditions.

28
Using the same methodology reported in Santos and Bhakar (2006), if an £8 charge is
assumed instead of a £5 charge, the minimum weekly salary for a car commuter to benefit
from the scheme increases to £2,348, roughly equivalent to an annual salary of £122,000.
This casts doubt on what proportion of car commuters would actually benefit. Although it can
be ascertained that it will be less than 10 per cent, the smallest quantiles reported by the
Office for National Statistics (2004a, Table 7.7a) are deciles, and so it is impossible to
pinpoint the exact percentage of Londoners with an annual salary higher than £122,000. In
any case, it would be difficult to determine what proportion of those high earners use the
charging zone on a daily basis. It should be borne in mind, however, that these estimates refer
to commuting values of time, and not to working values of time. There is no doubt that
business trips by car benefit from the charge, even if the same values of time are assumed
during congested and free-flow conditions.
14.6 Conclusions
The London Congestion Charge is not a first-best (Pigouvian) charge and it is not a second-
best charge either. It is rather a practical, unsophisticated charge, equal for all vehicle types,
despite their different congestive effects. It does not vary in time or location, except for the
fact that it applies in a specific area between 7:00am and 6:00pm.
Even though the costs of running the scheme are very high, the economic benefits are
positive. In general, it is seen as a success story. The only aim of the LCCS was ‘to reduce
traffic congestion in and around the charging zone’ (TfL 2004a, p.7). It has, no doubt,
succeeded in so doing, and as expected, is contributing to four of the Mayor’s ten priorities
for transport as set out in his Transport Strategy (Greater London Authority, 2001): ‘to reduce
congestion, to make radical improvements in bus services, to improve journey time reliability

29
for car users, and to make the distribution of goods and services more reliable, sustainable
and efficient’ (TfL 2004a, p.7).
Santos and Fraser (2006, p.296) note that important decisions regarding the scheme design
such as: (a) the level of the charge, and whether it was going to differ by vehicle type or time
of the day; (b) the times when the Scheme was going to operate; and (c) the exact limits of
the charging zone, were not based on economic principles. Instead, they were based on
political considerations, and the results of an extensive consultation process in which TfL
engaged before the Mayor confirmed the final Scheme Order. Interestingly, this did not
prevent the LCCS from achieving the objective of reducing congestion.
The Western extension, on the other hand, may yield negative economic benefits. The
benefit-cost ratio that TfL (2005b, p.108) calculates is only positive under an optimistic set of
assumptions. Given the limited scope for decreases in congestion in the extension (due to the
very different composition of traffic and the attractiveness the extension will present to
residents who might be priced onto the roads) and the very high implementation and
operation costs, the prospects are not promising.
When the LCCS was implemented in 2003, the Mayor managed to surpass the most
important obstacle, which was public and political acceptability. Proof of that is that, if no
one had paid the charge, the Scheme would simply not have worked. The enforcement
system, not designed to deal with no one paying the charge, would have collapsed.

30
Banking on that success, the Mayor extended the charging zone westwards, despite the low
benefit-cost ratios forecast by TfL. This decision was really a political one, not an economic
one, as the net social gains will be negligible, if not negative. Environmentalists, supporters
of sustainable transport and users of non-chargeable modes of transport are probably on his
side. A situation like this can only happen in London, where car dependency is the lowest in
the UK. Data averaged over the years 2003 and 2004 (Office for National Statistics 2006,
Table 10.05) show the miles travelled by car per person per year is 63 per cent in London,7 in
contrast with an average of 84 per cent for the UK as a whole. No other region in England is
below 80 per cent. Scotland and Wales are also above 79 per cent.
The London experience is therefore not easily transferable to other towns and cities in the
UK, and care should be taken when trying to apply a similar policy in other places around the
world, especially those with poor public transport and/or high car dependency.
Acknowledgements
Georgina Santos gratefully acknowledges financial support from the Rees Jeffrey’s Fund.
Any views and errors in this chapter are the author’s own.
7 This was 67 per cent in the period 1999-2001 (Office for National Statistics, 2004b, Table 10.6). The
reduction is probably caused by both the LCCS and the improvements in bus services.

31
References
Acts of Parliament (1999), Greater London Authority Act 1999 c. 29, London: HMSO.
www.hmso.gov.uk/acts/acts1999/19990029.htm
Department for Transport (2007), Highways Economics Note No.1, 2005 Valuation of the
Benefits of Prevention of Road Accidents and Casualties, London, January.
www.dft.gov.uk/pgr/roadsafety/ea/pdfeconnote105
Greater London Authority (2001), The Mayor’s Transport Strategy.
www.london.gov.uk/mayor/strategies/transport/trans_strat.jsp
MVA Consultancy (1995), The London Congestion Charging Research Programme: Final
Report, London: HMSO.
MVA Consultancy, ITS University of Leeds, and TSU University of Oxford (1987), Value of
Travel Time Savings, Newbury, Berks: Policy Journals.
Office for National Statistics (2004a), First release: 2004 Annual Survey of Hours and
Earnings, Table 7.7a.
www.statistics.gov.uk/downloads/theme_labour/ASHE_2004_inc/tab7_7a.xls
Office for National Statistics (2004b), Regional Trends 38 – Data
www.statistics.gov.uk/statbase/Product.asp?vlnk=11614&image.x=7&image.y=9

32
Office for National Statistics (2006), Regional Trends 39 – Data
www.statistics.gov.uk/statbase/Product.asp?vlnk=14356
ROCOL Working Group (2000), Road Charging Options for London: A Technical
Assessment, London: The Stationary Office.
www.gos.gov.uk/gol/transport/161558/228862/228869/
Santos, G. (2004), ‘Urban Road Pricing in the UK’, in Georgina Santos (ed.), Road Pricing:
Theory and Evidence, Oxford: Elsevier.
Santos, G. and J. Bhakar (2006), ‘The Impact of the London Congestion Charging Scheme on
the Generalised Cost of Car Commuters to the City of London’, Transport Policy, 13 (1), 22-
33.
Santos, G. and G. Fraser (2006), ‘Road Pricing: Lessons from London’, Economic Policy, 21
(46), 264-310.
Steer Davies Gleave (2004), The Effect of Road Congestion on Rail Demand, Report to the
Passenger Demand Forecasting Council, July.
Transport for London (2001), Transport Statistics for London 2001, London.
www.tfl.gov.uk/tfl/pdfdocs/stats2001.pdf

33
Transport for London (2003a), Impacts Monitoring Programme: First Annual Report.
Transport for London, London, June. www.tfl.gov.uk/tfl/cclondon/cc_monitoring-1st-
report.shtml
Transport for London (2003b), Congestion Charging: Six Months On, Transport for London,
London, October. www.tfl.gov.uk/tfl/downloads/pdf/congestion-charging/cc-6monthson.pdf
Transport for London (2004a), Congestion Charging Central London – Impacts Monitoring:
Second Annual Report, April. www.tfl.gov.uk/tfl/cclondon/cc_monitoring-2nd-report.shtml
Transport for London (2004b), London Travel Report 2004, London.
www.tfl.gov.uk/tfl/pdfdocs/ltr/london-travel-report-2004.pdf
Transport for London (2004c), Report to the Mayor – Annex E: Economic Assessment, July.
www.tfl.gov.uk/tfl/cclondon/cc_report_mayor2005.shtml
Transport for London (2005a), Congestion Charging Central London – Impacts Monitoring:
Third Annual Report, April. www.tfl.gov.uk/tfl/cclondon/pdfs/ThirdAnnualReportFinal.pdf
Transport for London (2005b), Proposed Western Extension of the Central London
Congestion Charging Scheme, Report to the Mayor following consultation with stakeholders,
businesses, other organisations and the public, September. www.tfl.gov.uk/tfl/cc-ex/tfl-
report.shtml

34
Transport for London (2006), Congestion Charging Central London – Impacts Monitoring:
Fourth Annual Report, June. www.tfl.gov.uk/tfl/cclondon/pdfs/fourthAnnualReportFinal.pdf
Wardman, M. (2001), ‘A review of British evidence on time and service quality valuations’,
Transportation Research E, 37 (2-3), 107-128.