Controlled polymerization of aniline at sub-zero temperatures
17
ELSEVIER Synthetic Metals 95 (1998) 29-45 SYlIITIHI|TII£ |TRILS Controlled polymerization of aniline at sub-zero temperatures P.M. Beadle ~,l, Y.F. Nicolau "'*, E. Banka ", P. Rannou ~, D. Djurado b ~' CEA/D~partement de Recherche Fondamentale sur la MatiOre Condens~e/Sl3M/PMS. CENG. 17 rue des Martyrs, 38054 Grenoble Cedex 9, France h lxlboratoire de Spectrom~trie Physique, Universit~ J. Fourier Grenoble L BP 87, 38402 St. Martin-d'Hbres. France Received 10 November 1997;received in revised form 2 February 1998:accepted 13 February 1998 Abstract Aniline is polymerized by oxidation with ammonium persulfate in aqueous hydrochloric acid solutions at sub-zero temperatures down to -43°C in the presence of LiCl and ethanol. The polymerization is controlled by concomitant potential, temperature and pH profiling. The concentrations of LiCI and ethanol are so determined to enable complete dissolution of the reactants in solution and to prevent freezing. Six polymerization steps were identified at low temperatures. The reduction of primarily synthesized pernigraniline to emeraldine with FeCI,_ is investigated. The as-synthesized and deprotonated emeraldine is purified by extraction with chloroform. The polyaniline is characterized by viscosity, gel permeation chromatography (GPC), UV-Vis-NIR spectroscopy, conductivity, X-ray diffraction and chlorine analysis. High molecular weight polyanilinesare synthesized at temperatures lower than - 25°C having inherent viscosities within 2.0-2.15 dl/g, M, = 30 000 g/tool, Mw = 1140 000-170 000 g/mol, with Mw/Mn = 2-3. The polymers in the emeraldine base form dissolved in NMP-0.5% LiCI show a more planar conformation as indicated by the wavelength of the exciton peak reaching 680 nm. An enhanced crystallinity in terms of structural perfection is observed by means of X-ray diffraction spectra. The UV-Vis-NIR spectra of polyanilines reduced with FeCI2, protonated with ( _+ )-10-camphorsulfonic acid (CSA), in m-cresol show a smeared polaron peak shifted into the UV. They show a broad convex NIR band peaking far beyond 2700 nm indicating an enhanced polaron delocalization. The conductivity of the films of emeraldine protonated by CSA cast from m-cresol are higher than 300 S/cm for polymers with inherent viscosities exceeding 1.8 dl/g and show an enhanced resistance to ageing. The purification of the emeraldine base by extraction with chloroform increases the molecular weight of the polymers and leads to an enhanced conductivity of the films. Polymers synthesized at low temperatures with FeCI2 reduction have better physical properties probably on account of less branching. © 1998 Elsevier Science S.A. All rights reserved. Keywords: Polyaniline; Polymerization; Molecularweight; Spectroscopy 1. Introduction Aniline blacks, obtained by chemical or electrochemical oxidation of aniline, have been discovered over the past cen- tury and during this time used as cotton dyes. At the beginning of this century, as a result of systematic investigations of their nature and properties undertaken by Willstgtter's school [ 1,2] and Green's school [ 3,4], two classes of aniline blacks were identified: 'greenable' and 'ungreenable' in acidic solu- tions. The greenable aniline black, emeraldine base (EB), was considered to be a linear octamer of aniline that might exist in several oxidation forms. It was shown later that it is actually a polymer that can be reduced to leucoemeraldine base (LEB), oxidized to pernigraniline base (PN) and also protonated forming a salt (EM) [5]: * Correspondingauthor. Present address: Castrol International, TechnologyCentre, Whitchurch Hill. Pangbourne. Reading,Berkshire RG8 7QR, UK. 0379-6779/98/$19.00 ~') 1998ElsevierScienceS.A. All rights reserved. PII S0379-6779( 98 )00028-9 I.EB - ~ n It was obtained by oxidation of aniline with ammonium persulfate or potassium dichromate in diluted aqueous sul- furic or hydrochloric acid solutions providing that the tem- perature does not exceed room temperature and that the aniline content is in excess. Ungreenable aniline blacks were obtained by oxidation of aniline or greenable aniline black with aniline or other aromatic amines in neutral or alkaline
-
Upload
independent -
Category
Documents
-
view
1 -
download
0
Transcript of Controlled polymerization of aniline at sub-zero temperatures

E L S E V I E R Synthetic Metals 95 (1998) 29-45
SYlIITIHI|TII£ |TRILS
Controlled polymerization of aniline at sub-zero temperatures
P.M. Beadle ~,l, Y.F. Nicolau "'*, E. Banka ", P. Rannou ~, D. Djurado b ~' CEA/D~partement de Recherche Fondamentale sur la MatiOre Condens~e/Sl3M/PMS. CENG. 17 rue des Martyrs, 38054 Grenoble Cedex 9, France
h lxlboratoire de Spectrom~trie Physique, Universit~ J. Fourier Grenoble L BP 87, 38402 St. Martin-d'Hbres. France
Received 10 November 1997; received in revised form 2 February 1998: accepted 13 February 1998
Abstract
Aniline is polymerized by oxidation with ammonium persulfate in aqueous hydrochloric acid solutions at sub-zero temperatures down to -43°C in the presence of LiCl and ethanol. The polymerization is controlled by concomitant potential, temperature and pH profiling. The concentrations of LiCI and ethanol are so determined to enable complete dissolution of the reactants in solution and to prevent freezing. Six polymerization steps were identified at low temperatures. The reduction of primarily synthesized pernigraniline to emeraldine with FeCI,_ is investigated. The as-synthesized and deprotonated emeraldine is purified by extraction with chloroform. The polyaniline is characterized by viscosity, gel permeation chromatography (GPC), UV-Vis-NIR spectroscopy, conductivity, X-ray diffraction and chlorine analysis. High molecular weight polyanilines are synthesized at temperatures lower than - 25°C having inherent viscosities within 2.0-2.15 dl/g, M, = 30 000 g/tool, Mw = 1140 000-170 000 g/mol, with Mw/Mn = 2-3. The polymers in the emeraldine base form dissolved in NMP-0.5% LiCI show a more planar conformation as indicated by the wavelength of the exciton peak reaching 680 nm. An enhanced crystallinity in terms of structural perfection is observed by means of X-ray diffraction spectra. The UV-Vis-NIR spectra of polyanilines reduced with FeCI2, protonated with ( _+ )-10-camphorsulfonic acid (CSA), in m-cresol show a smeared polaron peak shifted into the UV. They show a broad convex NIR band peaking far beyond 2700 nm indicating an enhanced polaron delocalization. The conductivity of the films of emeraldine protonated by CSA cast from m-cresol are higher than 300 S/cm for polymers with inherent viscosities exceeding 1.8 dl/g and show an enhanced resistance to ageing. The purification of the emeraldine base by extraction with chloroform increases the molecular weight of the polymers and leads to an enhanced conductivity of the films. Polymers synthesized at low temperatures with FeCI2 reduction have better physical properties probably on account of less branching. © 1998 Elsevier Science S.A. All rights reserved.
Keywords: Polyaniline; Polymerization; Molecular weight; Spectroscopy
1. Introduction
Aniline blacks, obtained by chemical or electrochemical
oxidation of aniline, have been discovered over the past cen- tury and during this time used as cotton dyes. At the beginning
of this century, as a result of systematic investigations of their nature and properties undertaken by Willstgtter's school [ 1,2] and Green's school [ 3,4], two classes of aniline blacks were identified: 'greenable' and 'ungreenable' in acidic solu-
tions. The greenable aniline black, emeraldine base (EB), was considered to be a linear octamer of aniline that might
exist in several oxidation forms. It was shown later that it is actually a polymer that can be reduced to leucoemeraldine base (LEB), oxidized to pernigraniline base (PN) and also protonated forming a salt (EM) [5]:
* Corresponding author. Present address: Castrol International, Technology Centre, Whitchurch
Hill. Pangbourne. Reading, Berkshire RG8 7QR, UK.
0379-6779/98/$19.00 ~') 1998 Elsevier Science S.A. All rights reserved. PII S 0 3 7 9 - 6 7 7 9 ( 98 )00028-9
I.EB - ~ n
It was obtained by oxidation of aniline with ammonium persulfate or potassium dichromate in diluted aqueous sul- furic or hydrochloric acid solutions providing that the tem- perature does not exceed room temperature and that the aniline content is in excess. Ungreenable aniline blacks were obtained by oxidation of aniline or greenable aniline black with aniline or other aromatic amines in neutral or alkaline

30 P.M. Beadle et al. / Synthetic Metals 95 (1998) 29-45
solutions. The oxidation of aniline in acidic solutions using an excess of oxidant also produced ungreenable aniline blacks. It has already been stated that the greenable aniline black is stable only in its green form at temperatures not exceeding 40°C, and it becomes progressively ungreenable if kept otherwise. In the early 1920s it was found that the oxidation mechanism involves anilinium radicals [6], and also autocatalytic reactions [7]. De Surville et al. [8] have reviewed the old literature on this subject.
Lantz and Gascon [9] have synthesized the 2,5- bis (phenylamino)-N-phenyl- 1,4-benzoquinonediimine by oxidation with sodium dichromate of a mixture of N-phenyl- 1,4-benzoquinonediimine with aniline in an aqueous acetic acid solution at room temperature:
~ oxlaali~
HN-
~._¢,--NH
and similarly the N-(4'-anilino)-N'-( l'-diphenylamino)- 2,5-bis(phenylamino)-l,4-benzoquinonediimine by oxida- tion of a mixture of N-(4'-anilino)-N'-(l '-diphenyl- amino)- 1,4-benzoquinonediimine with aniline. The obtained base underwent condensation by oxidation with oxygen in air in mineral acidic aqueous solutions at 70°C, but even at room temperature more slowly, forming a derivative contain- ing the safranine ring:
+ 2 <~)--NH 2 l_ o~ddation
I o~ddation
They concluded that ungreenable aniline blacks should contain phenazine and safranine rings. Phenazine rings were
identified later in polyaniline by mass spectrometry [10], their presence being explained by condensations following branchings by ortho couplings of aniline to quinonediimine rings via Michael addition reactions. Such types of aniline additions to N,N'-diphenyl-l,4-benzoquinonediimine fol- lowed by condensations were studied by Taimr and Pospisil [11].
Since the discovery that polyaniline (PAn) is the generic polymer of a novel class of conducting polymers [ 12,13 ] it has become the object of numerous studies. The linear poly(p-phenyleneamineimine) structure of PAn, i.e. the structure of Green's emeraldine, was confirmed by Wudl et al. [ 14-16]. Using a modified Honzl condensation they syn- thesized the phenyl-capped octaaniline and a linear poly(p- phenyleneamineimine) that showed similar optical, magnetic and electrochemical properties to PAn, but not identical. Sur- prisingly, they state that HCl-protonated phenyl-capped octaaniline had almost the same conductivity as emeraldine hydrochloride (E.HCI).
Most studies have been performed on PAn chemically syn- thesized at 1-5°C according to MacDiarmid et al. [17], a synthesis derived from Green' s synthesis that becomes a stan- dard procedure. This standard PAn in the form of EB is only partly soluble in 1-methyl-2-pyrrolidinone (NMP) [ 18-20] and the soluble part has a low molecular weight [21-27] (MW): Mn=20 000-26 000 g/tool, M,~=30 000-60 000 g/mol, a large polydispersity Mw/Mn=2.5-3 and a low inherent viscosity ~)a,h=0.8--1.2 dl/g. Protonated by the ( +_ )-10-camphorsulfonic acid (CSA) it is only partly solu- ble in m-cresol [28-30]. The films obtained from these solutions by m-cresol evaporation have a poor tensile strength of about 50 MPa [23] and a mediocre conductivity of about 100 S/cm [31 ]. Standard E.HC1 powder has a conductivity of about 5 S/cm. The influence of the polymerization con- ditions on the properties of PAn was later studied [ 32-46 ], but synthesis conditions leading to a significantly higher solubility, MW and conductivity were not found.
In order to synthesize a soluble polymer, having a high MW and a low content of defects, it is necessary to know and to understand the polymerization mechanism in solution and also the nucleation of the solid polymer grains and the post- precipitation polymerization. The polymerization initiation in solution has been mostly studied; the nucleation and the post-precipitation polymerization considerably less, with a few exceptions, almost neglected. Several polymerization mechanisms were proposed for the first polymerization steps leading to the aniline dimer and trimer and for the polymer- ization propagation involving: radical cations only [47-49], nitrenium cations [ 50-52 ], and radical cation-monomer cou- plings [53-56]. But starting with the aniline dimer and trimer formation, an autocatalytic polymerization propagation mechanism becomes prevalent [ 57-64]. A polycondensation mechanism was also proposed [65,66]. The polymer is first synthesized in the PN oxidation state, then the precipitated PN is reduced to the emeraldine (EM) oxidation state by the excess of aniline [ 67]. The polymerization occurs partly in
P.M. Beadle et al. / Synthetic Metals 95 (1998) 29-45 31
solution and partly at the interface between the precipitated polymer particles and the aqueous phase because the aniline oligomers are insoluble in the aqueous phase as in the emul- sion precipitation polymerization of poly(vinyl chloride), polyacrylonitrile, poly (tetrafluoroethylene) and poly ( vinyl- idene dichloride) [68], all being polymers which are insol- uble in their monomers. The smallest particle diameter result- ing from the first aggregation step of growing PN oligomers was determined: (i) by scanning transmission microscopy (STM) on colloidal E.HCI particles [69], 5-10 nm, (ii) by filtration of EB solutions in NMP [70], 5-10 nm, and (iii) by dynamic light scattering of EB solutions in NMP [26], 15 nm. Colloidal E.HC1 particles showing a rice-grain mor- phology, 60-90 nm in width and 140-180 nm in length, resulting from a second aggregation step, were also deter- mined by STM [69]. EB particles 20-100 nm in diameter were also identified by filtration of EB solutions in NMP [ 70]. The spherical shape and diameter of emeraldine parti- cles corresponding to different aggregation steps are similar to those of poly(vinyl chloride): 10-20 nm, after the first aggregation step at less than 1% conversion, and 100-200 nm, after the second aggregation step at 1-2% conversion. Thus, very probably, as for the polymerization of poly (vinyl chloride), the polymerization of aniline in the liquid phase accounts for a minor part of the polymerization, which mainly occurs at the interface between the first aggregated particles and the liquid phase and also inside the swollen particles. As in the precipitation polymerization of polyacrylonitrile [ 68 ], most macromolecules should be living, buried inside the par- ticles, being inaccessible to the monomer. The living char- acter of the E.HCI was pointed out by the increase of its MW when submitted to several successive oxidations to PN in HCI solutions and reductions back to E.HC! by the excess of aniline [22].
Contrary to the conventional representation of the oxida- tive polymerization of aniline leading to a linear backbone, the polymer should have a randomly branched backbone [ 71-78 ], possibly entailing some crosslinking. The branch- ings arise on one hand owing to the 10% probability ofortho couplings of aniline [79,80] and on the other hand owing to the possible Michael reductive additions of aniline and other oligomers to non-terminal quinonediimine moieties of the already synthesized PN [ 56,81 ] that may occur in the frame of the autocatalytic polymerization process. Both possibilities produce 1,2,4 couplings on benzene branching rings. It is very difficult to identify them by their characteristic IR C-H stretching bands due to overlapping with other EMIR bands [82]. They were however identified by ~3C NMR [83,84] and quantified at _< 5% in the EB part soluble in NMP, the part assumed to be less branched than the insoluble part. Another branching possibility giving tertiary N may occur in the frame of the autocatalytic polymerization [57]. The ter- tiary N is very difficult to identify both by IR [85] and ~SN solid state NMR spectroscopy [25]. Tertiary N atoms were not observed by ~3C NMR spectroscopy of the soluble EB part [83]. ttowever, the discrepancy between the MW of
PAn samples determined by gel permeation chromatography (GPC) and by solid state ~SN NMR spectroscopy [25] might be explained assuming branchings from 2% of N atoms. The presence of tertiary ring-N has been identified in the N( 1 s) XPS spectrum of EB films cast from NMP solutions at a binding energy (BE) of 399.9_ 0.1 eV, besides amine and imine N [86]. It is worth noting here that PN is hydrolysed in the acidic solution during polymerization and the products of hydrolysis are partly incorporated in the polymer, produc- ing defects [ 871.
It was reported that decreasing the synthesis temperature below - 3 ° C increases the MW of EB to M , = 2 3 000, Mw= 160000 g/mol, Mw/Mn~7, [77] = 1.23 dl/g (meas- ured in NMP at 30°C), and that increasing the ammonium persulfate/aniline molar ratio to 1-1.25 improves the solubility of EB in NMP owing to suppression of hydrolysis reactions and to promotion ofpara couplings of aniline rad- ical cations [ 88 ]. A PAn of high MW was obtained by pro- cessing the standard synthesis at - 40°C in the presence of 5.8 M LiC1 for 48 h [89]: M°=108000 g/mol, Mw = 385 000 g/mol, Mw/Mn = 3.6 (M, = 54 900 g/mol, Mw = 203 000 g/mol, Mw/Mn = 3.7, and a chlorine content of 1.6%, according to Adams and Monkman [ 84] ). Knowing that the reaction rate between ions of the same sign is increased by increasing the ionic strength, it is thought that increasing the concentration of ions in solution leads mostly to an increase of the reaction rate between radical cations in solution and those found in the solid polymer particles, thus promoting the lengthening of the chains. Regrettably, the synthesis was not controlled by potential profiling and noth- ing was reported about the solubility of the high MW poly- mer, or its intrinsic viscosity, covalent chlorine content and conductivity. Adams et al. [90-92] recently studied the influ- ence of the polymerization conditions on the properties of high MW PAn prepared at sub-zero temperatures in the pres- ence of LiC1. They used an oxidant/aniline mole ratio of about 1.1, a dropwise addition of oxidant over 14 h 15 min and a total reaction time of 46 h, conditions which gave a maximun yield of polymer at - 27.5°C and a maximum MW at -26°C: M , = 4 3 500 g/mol, Mw=209 000 g/mol, Mw/ M, = 4.8. Increasing the LiCI concentration from 2.87 M to 3.88 M produced an increase of the covalent chlorine content from 1.38 to 2.33%. The PAn was not totally soluble as EB in NMP or protonated by CSA in m-cresol and, unexpectedly, the increased MW showed no effect on the conductivity of the films compared to previously reported values determined on PAn synthesized at room temperature. This result is in contradiction with the MW dependence of the conductivity previously determined on powders by Scheer et al. [21 ] and Heeger and Smith [ 93 ].
Here we report on the sub-zero temperature oxidative polymerization of aniline to PN in the presence of LiCI, starting with a homogeneous liquid phase and subsequent reduction to EM.HC1 by FeC12, under monitored conditions of potential, temperature and pH, along with the characteri- zation of obtained PAns by GPC, viscometry, conductivity,

32 P.M. Beadle et al./ Synthetic Metals 95 (1998) 29~t5
UV-Vis -NIR spectroscopy and wide-angle X-ray diffraction (WAXD). Under such conditions the radical cationic polym- erization mechanism is promoted and the autocatalytic mech- anism repressed, enabling the synthesis of less branched pol- ymers. A logarithmic dependence of the conductivity on the inherent viscosity of PAn solutions is found. We interpret our results in comparison with other contradictory results on account of the different degree of branching.
2. Experimental
2.1. Materials
99% R.G. aniline, 98% N-phenyl-l,4-phenylenediamine (NPPD) and 97% 1,4-phenylenediamine (PPDA) were vac- uum distilled and stored under nitrogen in the fridge prior to use. 98% Ammonium persulfate, 99% iron(II) chloride tetrahydrate, 99% lithium chloride, 37% hydrochloric acid, 95-98% sulfuric acid, 25% ammonia, anhydrous ethanol (undenaturated), all reagent grade, 98% ( _+ )-10-camphor- sulfonic acid, 99% m-cresol, 99.9% chloroform stabilized with 0.5-1% ethanol (HPLC grade) and 99% l-methyl-2- pyrrolidinone (HPLC grade, and spectrophotometric grade) were all used as received.
2.2. Syntheses
The syntheses were carried out in air, at different temper- atures ranging from - 7 to - 43°C, in a 400 ml glass beaker cooled under steady-state conditions by immersing it either into a 4 1 Dewar vessel containing an organic slush or into a jacketed outer vessel connected to a thermostat-controlled circulating chiller unit. To obtain the organic slush, 98% o- xylene (m.p. - 25°C), 96% nitromethane (m.p. - 29°C) or 97% tetrachloroethane (m.p. - 4 3 ° C ) was cooled and crys- tallized using liquid nitrogen. In this case, in order to prevent disturbing the recording of the temperature during these syn- theses, the slush was not regenerated by adding liquid nitro- gen; it was only stirred in synthesis 17. The syntheses were performed under stirring by pouring in one go the solution of oxidant into the solution of aniline that was placed in the beaker and cooled at the ordered temperature. The oxidant solution was cooled separately at the same temperature before addition. The redox potential and the temperature of the solu- tion were collected point-by-point during the syntheses using a Schott CG841 automatic digital pH-meter-mV-meter con- trolled by a dedicated computer by means of Pt and SCE electrodes and a 100 1) Pt resistance thermometer immersed in solution, respectively. The pH of the solution was also recorded during some syntheses using a Metrom E510 pH- meter by means of the T-glass Metrom electrode coupled with a Ag/AgC1 reference electrode, allowing pH measure- ments down to -20°C . Both the SCE and the Ag/AgC1 reference electrodes immersed in solution were mounted using intermediary LiCl-ethanol electrolytic bridges.
We tried to reproduce the standard synthesis [ 17] at sub- zero temperatures. Thus, the initial oxidant/aniline mole ratio was kept constant at 0.25. In order to record significant poten- tial, temperature and pH evolutions it is necessary to prevent the crystallization of any species before or at the beginning of the polymerization. This necessitated the addition of increasing quantities of LiCI and ethanol at lower tempera- tures. Although we tried to keep the initial aniline and HCI concentrations constant they varied a little from one synthesis to another. The aniline molar concentration was kept within 0.39-0.42 M; the total reaction volume within 263-280 ml. The HCI molar concentration was kept within 0.51-0.53 M for the syntheses carried out at - 7 and - 14°C, and within 0.96-1.08 for the syntheses carried out at lower temperatures. For those syntheses carried out at less than - 14°C the ethanol concentration was kept within 30-35 vol.%. For the syntheses performed at - 7 and - 14°C, 6.25 g (0.0274 mol) of ammo- nium persulfate were dissolved in 100 ml of 1 M HCI, and separately 10 ml (0.1097 mol) of aniline were dissolved in 150 ml of 1 M HC1. For the syntheses performed at temper- atures lower than - 14°C, 6.25 g of ammonium persulfate were dissolved in 60 ml of 2 M HC1, and separately 10 ml of aniline were dissolved in 190 ml of a mixture of 85 or 95 ml 3 M HCI with 95 or 85 ml ethanol, respectively. LiC1 was added in the proportions of 1/3 and 2/3 to the ammonium persulfate and aniline solutions, respectively, to the indicated molarity, see Tables I and 2. In some syntheses, the oxidant at room temperature was added dropwise to the cooled aniline solution. For other syntheses, after the polymerization time of aniline to PN, a rapid reduction of the PN to E.HC1 was performed by addition in one go of a solution of 3.64 g (0.0183 mol) of FeCI2 in 50 ml of HCI containing 5 g of LiCk This solution was cooled to the same temperature as the polymerization suspension at the time of addition. The time of addition and the temperature of the solution of FeCI2 were formerly determined from the potential and temperature profile of a previous synthesis at the same ordered tempera- ture without using FeC12 reduction. In some other syntheses, polymerization accelerators were added to the aniline solu- tions as indicated in Table 2. The syntheses were stopped when the potential reached a constant end value. For each synthesis the suspension was then filtered through a porous glass funnel no. 4 at the temperature reached at the end of synthesis or after a rapid heating to room temperature, and the green precipitate collected, washed with copious amounts of 1 M HCI until the filtrate became colourless, and finally dried overnight at 50°C under dynamic vacuum. The as-syn- thesized E.HC1 was deprotonated by stirring in 1 1 of 0.1 M ammonium hydroxide for 72 h. The obtained EB was then filtered, washed several times with water and dried to constant weight at 25°C under dynamic vacuum for approximately 24 h.
2.3. Purification
The EB powder was extracted with chlorofornl using a Soxhlet apparatus, for the time necessary to see siphoning of
P.M. Beadle et al. / Synthetic Metals 95 (1998) 29~t5 33
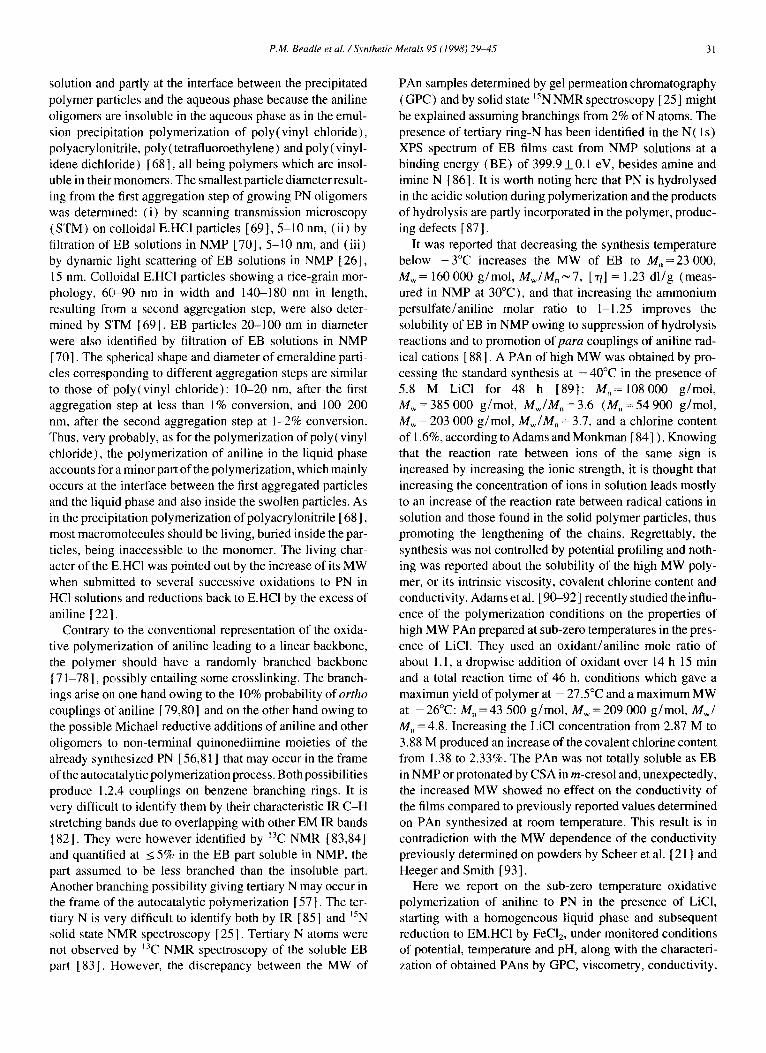
Table 1 Synthesis conditions and characterization results
Synthesis Initial temp. [LiCI] Polym. time Total synthesis Reducer Viscosity rh,,, A~ 1~11~ ~. Film conductivity (°C) (mol/ l) (min) time (h) (dl/g) (nm) (S/cm)
1 - 7 nil 12 4.2 aniline 0.95 664 0.90 75 4- 4 2 7 0.44 12 5.0 aniline 1.34 658 0.83 73 _ 4 3 7 1.73 12 5.4 aniline 1.68 662 0.87 96 -+ 6 4 -- 14 1.90 23 25.0 aniline 1.71 672 0.96 232-+ 17 5 - 14 1.90 23 0.6 FeC12 2.06 670 0.93 225-+ 14 6 25 " 1.90 55 17.5 aniline 1.92 660 0.86 313 5:27 7 - 25 ~' 2.06 55 168.0 aniline 1.41 672 0.99 149 ± 9 8 -- 25 ~' 1.90 50 2.1 FeCI2 1.76 666 0.98 167 -+ 13 9 - 25 1.90 50 1.3 FeC12 2.06 671 0.82 275 ___ 17
10 - 25 2.06 60 1.3 FeCI2 1.82 664 0.93 242_+ 18 I 1 - 27.5 2.06 45 h 0.8 FeCL_ 1.87 668 0.98 307 _+ 28 12 -- 30 ~ 1.90 118 22.5 aniline 2.02 679 1.06 151 5:10 13 -- 30 ' 2.06 125 18.3 aniline 2.05 680 1.06 220-+ 13 14 -- 30 " 2.53 205 25.8 aniline 1.85 672 0.96 124 -+ 7 15 --30 ~ 1.90 120 18.3 FeCI2 2.01 678 1.05 268_+21 16 -- 30 ~' 2.06 125 21.7 FeC12 1.98 680 1.05 168 _+ 13 17 -- 43 ~~ 2.68 505 167.0 aniline 2.05 680 0.96 264 _+ 19 18 -- 43 :' 3.00 140 16.7 aniline 2.16 674 0.96 323 ± 22
Cooling by organic slush bath. b Early reduction.
Slush kept at melting temperature until potential stabilization at the end of synthesis.
Table 2 Synthesis conditions and characterization results. [ LiCI] = 2.06, reducer FeC12
Synthesis Mode of addition of oxidant. Initial temp. Polym. time Total synthesis Viscosity r/~,h Aex le~/l~ ~, Film conductivity Additive (mol%) ~' (°C) (min) time (h) (dl /g) (nm) (S/cm)
19 dropwise over 10 min - 2 5 30 0.7 1.86 675 1.01 222+ 18 20 h dropwise over 25 min - 30 c 85 2.3 2.15 652 0.75 186 + 10 21 a dropwise over 40 rain - 2 5 65 1.5 1.43 682 1.03 138+9 22 dropwise over 140 rain - 2 5 140 2.5 2.05 662 0.81 268+20 23 L. 0.5% NPPD - 2 5 35 1.4 1.14 673 0.99 218_+ 15 24 ' 0.5~ NPPD - 4 3 ~ 95 20.0 1.19 666 t.01 236+ 17 25 ().59~ PPDA - 2 5 28 0.6 1.75 672 0.99 149+ 13 26 0.5 % EB v - 25 50 1.3 1.65 676 t .02 297 _+ 20 27 10'~ EB - 2 5 42 0.8 1.56 674 1.01 122_+8
~' With respect to polymerizable aniline. b [ LiC11 = 1.90
Cooling by ort, anic slush bath. d [LiC1] =0.
" [LiC1] = 2.68. Reducer aniline. Finely ground powder of sample 9.
a c o l o u r l e s s c h l o r o f o r m , u s u a l l y b e t w e e n 4 a n d 10 h. T h e
e x t r a c t e d E B w a s t h e n d r i e d at r o o m t e m p e r a t u r e u n d e r v a c -
u u m fo r 5 h. T h e e x t r a c t e d pa r t w a s i s o l a t e d b y e v a p o r a t i o n
o f t h e c h l o r o f o r m , f o l l o w e d b y d r y i n g u n d e r v a c u u m a n d
t h e n w e i g h e d . S o m e p u r i f i e d E B p o w d e r s w e r e f u r t h e r d e p r o -
t o n a t e d b y s t i r r i n g in 1 1 o f 0 .3 M a m m o n i u m h y d r o x i d e fo r
48 h.
2.4. C h a r a c t e r i z a t i o n
E B s a m p l e s r e s u l t i n g f r o m d i f f e r e n t s y n t h e s e s w e r e c h a r -
a c t e r i z e d b y v i s c o m e t r y , G P C , U V - V i s s p e c t r o m e t r y a n d
c h e m i c a l a n a l y s i s .
I n h e r e n t v i s c o s i t i e s , rli,h, w e r e d e t e r m i n e d a t 2 5 ° C o n
f r e s h l y p r e p a r e d s o l u t i o n s u s i n g an U b b e l o h d e v i s c o m e t e r .
0 . 1 % E B s o l u t i o n s w e r e p r e p a r e d b y s t i r r i n g t h e p o l y m e r
p o w d e r in c o n c e n t r a t e d s u l f u r i c a c i d fo r 15 h. T h e s o l u t i o n s
w e r e f i l t e red o n a p o r o u s g l a s s f u n n e l no . 4 p r i o r to m e a s u r e -
m e n t s , a l t h o u g h t h e d i s s o l u t i o n o f t h e E B p o w d e r s w a s to ta l .
M W d e t e r m i n a t i o n s b y G P C w e r e c a r r i e d o u t on 0 .05 w t . /
v o l . % E B s o l u t i o n s in H P L C g r a d e N M P c o n t a i n i n g 0 .5 w t . /
v o l . % LiC1 ( a l s o u s e d as e l u e n t ) . V i s u a l l y , all t h e s a m p l e s
w e r e to t a l l y s o l u b l e . E B p o w d e r s w e r e d i s s o l v e d b y s t i r r i n g
fo r 15 h , t h e n t h e s o l u t i o n s w e r e f i l t e red o n 0 .2 l~m f luo ro -
c a r b o n f i l te rs p r i o r to i n j e c t i o n . 20 m l o f s o l u t i o n w e r e

34 P.M. Beadle et al./ Synthetic Metals 95 (1998) 29~t5
injected into a PL gel 10 I~m mixed-B column from Polymer Labs under a flow rate of 0.5 ml/min. The column was heated at 80°C and standardized with polystyrene standards. A Waters R401 refract•meter was used as detector.
UV-Vis spectra were recorded from 280 to 820 nm using a Hewlett-Packard 8452A spectrophotometer on 0.05 wt./ vol. EB solutions in spectrophotometric grade NMP contain- ing 0.5 wt./vol.% LiC1 contained in 1 mm optical path quartz suprasil cells.
The C, N, H and C1 contents in EB samples were deter- mined by elementary quantitative chemical analysis.
CSA-protonated EB samples were characterized by U V - Vis-NIR spectroscopy, conductivity and X-ray diffraction.
Solutions containing 0.5 wt./vol.% EB in m-cresol, pro- tonated with CSA to an acid/N molar ratio of 0.5, were prepared by magnetic stirring at room temperature for at least 3 weeks. To prevent chain segmentation during dissolution of EB or CSA-protonated emeraldine in different solvents we did not use ultrasound or high speed (20 000 rpm) homog- enizers. UV-Vis -NIR spectra of the solutions were recorded from 300 to 2700 nm using a Varian Cary 2400 spectropho- tometer. To record a solution spectrum a drop of solution was spread by capillary adhesion forces between two infrasil quartz slides. When inspected under an optical microscope in transmitted light, the emeraldine grains should be generally no longer visible in solution before recording a spectrum or casting a film.
Free-standing thick films, about 20 p,m in thickness, were cast from solutions on glass plates by m-cresol evaporation at 50°C for 3 days. The films were removed from the glass plates by dipping them in 1 M CSA solution for 1 h, then rinsing with acetonitrile and drying. The conductivity of the films was measured using the four-probe method in van der Pauw geometry [94]. The contacts were applied by pressure. The conductivity of as-synthesized E.HC1 powders was measured on compressed pellets with the four-probe in-line method.
WAXD patterns were recorded in the Debye-Scherrer geometry using a two-circle goniometer (Philips PW 1835), a 1200 W X-ray tube, a Ge monochromator selecting the Cu Kctl radiation and a linear multi-channel position-sensitive detector from Raytech having 1024 channels placed every 0.02 ° in 20. Four pieces of E.CSA film were stacked together to form a sample about 80 ~m in thickness. The spectra were recorded between 3 and 50 ° (20) counting 4 s in steps of 0.06 ° (20). To improve the resolution, scans were repeated 10-20 times and summed. To keep only the intensity scattered by the sample the diffuse background was evaluated by recording a blank which was subtracted after correction of the absorption effect.
3. Results and discussion
3.1. Potential, temperature and p H profiling
Constantly monitoring the redox potential, the temperature and the pH of each polymerization bath enables us to follow
each stage of the synthesis which involves significant changes in the oxidation state and in the protonation state of the inter- mediary products and synthesized polymers.
A typical potential and temperature evolution during the syntheses is shown in Fig. 1 for synthesis 4, started at - 14°C using thermostat-controlled cooling, in agreement with pre- vious observations made at room temperature [ 95,96]. Upon the addition of oxidant, the initial formal redox potential of the anilinium hydrochloride solution at - 14°C of 445 mV increases almost instantaneously to about 800 mV, which is less than the formal oxidation potential of the ammonium persulfate solution at - 14°C of about 1007 inV. The poten- tial then falls quite rapidly to a minimum at about 690 mV during the first 4 min, then it increases again to about 800 mV during the next 6 min to reach a plateau at about 800 mV for 14 rain. Then it decreases rapidly to about 600 mV over the next 10 rain and continues to decrease very slowly towards a constant final value of 470 mV at - 14°C.
Following the addition of the ammonium persulfate solu- tion to the beaker containing the anilinium chlorhydrate solu- tion the temperature immediately increases a little owing to the release of the heat of mixing, but then it decreases to reach a minimum (marked with an arrow in Fig. 1 ) after 14 min. Then the temperature increases steeply to reach a sharp max- imum during the following 14 min and then it decreases progressively to the ordered temperature of the cooling unit, - 14°C, with an indicated shoulder 4 rain after the maximum (marked with another arrow in Fig. 1 ).
800
700
600
E
• ~ 500
@
400
300
200
i 1 ' I I
- :
I f i I
• o
I L l I I l [ I 1
0 10 20 30 40 50 60 70 80 Time ! min
Fig. t. Potential and temperature profiling during synthesis 4.
-4.0
-6.0
-8.0
?
10 t ~
E ~2
F-
12
14

P.M. Beadle et al. /Synthetic Metals 95 (1998) 29~15 35
800
720
:~640
B 560 eL
480
400
I ~ I ' I I I I
t • l e e • o • e e e •
• II °•
° 2 •
o + • 4 •
•
1 I , I , 1 ~ I ~ I
0 8 1 6 2 4 3 2 40 T i m e / rain
Fig. 2. Potential and pH profiling during synthesis 4.
-0.20
-0.24
-0.28
-0.32 ~c~
-0.36
-0.40
-0.44
The evolution of the pH during this synthesis is presented in Figs. 2 and 3. This evolution is in general agreement with previously re.corded ones for syntheses made at positive tem- peratures [97], but at sub-zero temperatures, and in connec- tion with the concomitant potential and temperature evolution, it becomes evident that the synthesis involves sev- eral steps marked in the figures by numbers from 1 to 6. The pH decreases continuously during the first 200 rain, due to a continuous release of HC1 and H2SO 4 in solution, but with five different slopes, and it increases continuously afterwards so long as the,, potential decreases. During step 1 the anilinium cations are deprotonated and oxidized to radical cations (or possibly also to nitrenium cations). This step lasts for at least 4 min at - 14°C as indicated by the potential decrease to the minimum at about 690 mV during which time the pH decreases very steeply and the solution takes a pink tint. During step 2 dimers and oligomers are formed for 10 min, the time needed for the potential to reach the plateau at about 800 mV; the pH decreases less rapidly. The solution takes a pale blue tim probably indicating the formation of oxidized oligomers. As seen in Fig. l and even better in the following Figs. 4 and 5, for the syntheses 10 and 9, respectively, the first and second steps are slightly endothermic because the temperature decreases (with some delay owing to the thermal inertia of the, temperature sensor) not solely on account of the permanent cooling because the temperature decreased below the starting temperature as seen in Fig. 5 and observed also for other syntheses. Step 3, lasting 14 min, is where the potential reaches a plateau at about 800 mV, where the polym- erization proceeds mostly by a chain mechanism suddenly
560
540 o5
> • gz o . --- 520
o O ~- 500
480
460
I I I I
• 6 , a~
~ oo1:1
I , I , I J
200 400 600 800
Time 1 rain
/ D
g 6 t~
I I - 0 . 3 2
-0.34
f D o -0.36
o
D -0.38
r
-0.40
-0.42
-0.44
-0.46
I , I -0.48 1000 1200
Fig. 3. Potential and pH profiling during synthesis 4 (continuation).
8 0 0
700
600
500 > E
.~ 400 e..
o ta.
300
200
100
I I I s ~
Addition of FeC! 2
<
0 1 o
o
o
o
o
I , I , I , I
0 20 40 60 Time ! min
-10 [ I
-12
-14
I - 1 6 ~
, ~ -18 ~
[-
-20
-22
, i , -24
80 100
Fig. 4. Potential and temperature profiling during synthesis 10.
releasing the polymerization and precipitation heat, produc- ing a rapid increase in temperature from about - 14 up to - 8.5°C. It is known that, starting with the formation of the oxidized aniline trimers, the polymerization can also proceed via an autocatalytic mechanism, i.e. oxidized oligomers can either catalyse the oxidation of aniline molecules to radical

36 P.M. Beadle et al. /Synthetic Metals 95 (1998) 29~t5
;•400 "d
e~
o
' I I I ' I I f '
600
V -i " k _ r-"
~" 200
0
i 0
- 5
-10
2 2 4J
-15 ~. o
I , I I I , I I I , I i -200
0 10 20 30 40 50 60 70 80 Time / min
Fig. 5. Potential and temperature profiling during synthesis 9.
-20
-25
cations or link aniline molecules, the reduced larger oligo- mers then being oxidized again by the remaining ammonium persulfate [98]. The evolution of the pH decrease indicates that the autocatalytic mechanism may act but the dominant polymerization mechanism is a chain polymerization. During steps i and 2 the pH decreases more than during step 3. During step 3 the pH decreases only a little. This means that during this polymerization step radical cations already formed dur- ing steps 1 and 2, by the oxidation of aniline molecules releas- ing HC1, are linked. During this time the polymerization proceeds so long as there is still ammonium persuifate avail- able to oxidize the growing chains. The potential reaches a ceiling during this step at about 800 mV because it is deter- mined by the PN potential deposited on the Pt electrode interacting with the solution. The PN dispersion appears as a purple colour. The polymerization leading to PN occurs according to the global reaction:
4n ~ J/X--NHaCI + 6n [NH4]2S2Oa
+ 4n HCI + 6rl [NH4]2SO 4 + 6n H2SO4
As soon as the ammonium persulfate is exhausted the excess of anil inium chlorhydrate in solution starts to reduce the precipitated PN to the oxidation state corresponding to EM, and the potential starts to decrease. It begins to decrease
steeply for 6 min down to about 640 mV during step 4, that corresponds to a steep decrease of the solution pH owing to released He1 and H2SO 4 by the oxidation of aniline. This reduction step as seen by the shoulder on the temperature versus time curve is exothermic in agreement with other stud- ies [99,100]. During step 5 the potential decreases more slowly from about 640 mV down to about 515 mV, corre- sponding to a slow decrease of the pH. The reduction rate from the PN oxidation state to an intermediary oxidation state corresponding approximately to Green's nigraniline (NA):
NA
that probably occurs during step 4, is higher than the reduction rate from the NA to EM, that proceeds during steps 5 and 6. The dispersion takes an intense blue colour. The PN reduction to E.HCI occurs according to the global reaction:
+ 4pq ~ - N H 2 + 2p(5n+q) HCI
L - i n
L "-" °' ° ' - k
Disregarding the different polymerization degrees during polymerization and reduction, the polymerization of aniline leading to E.HCI occurs according to the global reaction:
4 n ~ //~--NH3CI + 5n [NH4]2S2Oa
• L....v CI - ~ C I - ] n
+ 2n HCI + 5n [NH4]2SO 4 + 5n H2SO 4
A number of oligomers, p, of order q are formed following the polymerization of the radical cations created by the oxi- dation of anilinium chlorhydrate by the PN. The oligomers and low MW macromolecules may have any polymerization degree, not only a multiple of four as is written for the sake of simplicity. The reduction continues slowly over a long time to reach a constant potential during step 6 corresponding to an increase in pH. After heating to room temperature the potential decreased to a final value of 440 mV for this syn- thesis. This behaviour indicates that the reduction of PN to NA (step 4) and further on towards EB (step 5) proceeds first and the protonation of the reduced polymer in an oxi-
P.M. Beadle et al. / Synthetic Metals 95 (1998) 29-45 37
dation state corresponding to EB proceeds slowly afterwards (step 6). During this step 6 the suspension takes the charac- teristic green colour of EM.
Alternatiwzly to the formation of oligomers and low MW macromotectdes by the reduction of the PN to EM, the reduc- tive addition of aniline molecules to the polymer may happen following the autocatalytic polymerization mechanism. The reductive addition of aniline molecules to terminal quinone- diimine moieties on PN chains leads to an increase of the polymer length:
- - N :::::a~mNH + ~ - N H s C I
- - H N I ~ N H ~ N H 2 + HCI
But the reductive addition of aniline molecules to non- terminal quinonediimine moieties on PN chains leads to branching:
~ N : : : : ~ ( ~ c : ~ N - - + ~ ) - - N H3(3, ~ " - ' ~ - 4 ~ ~
- -N. -£=L- , + HO ~-~ e~
H2N
In order to suppress this branching probability during the reduction of PN to EM we experimented with the reduction of PN by FeCI2:
C , ] n
Pouring a hydrochloric solution of FeCI2 in the reacting bath in excess (double the necessary quantity) just at the moment when the potential begins to decrease after the pla- teau (that corresponds to a maximum of temperature), a rapid reduction occurs that brings the potential to its final value of 420 mV in 5 rnin for synthesis 10, at an addition temperature of about - 20°C, as seen in Fig. 4, and to 355 mV for synthesis 9 at an addition temperature of about - 17°C, as seen in Fig. 5. The exothermic character of the reduction is prominent. Instead of FeCI2, the reduction can be performed using CuC1 or SnC12 as reducers. In this case we carried out the reduction progressively, adding the reducer stepwise up to a potential of 360-380 mV ( at the reducing temperature), because these reducers can reduce the PAn to an oxidation state beyond that corresponding to EM. FeCI2 cannot reduce the PAn beyond its EM oxidation state because the formal redox potential of a FeZ+/Fe 3+ solution having [Fe z+ ] = [Fe 3+ ] = 1 in 1 M
HCI at 20°C is 455 mV. The potential of this solution decreases with temperature to about 422 mV at - 15°C and to about 402 mV at - 30°C.
The final PAn potential varies a little from one synthesis to another due to small yield differences and secondary reac- tions but it always remains in the range corresponding to the EM oxidation state 350-460 mV. Using FeCI2 reduction the end potential is maintained within 350-390 mV. The polym- erization potential also varies a little from one synthesis to another and sometimes the plateau itself shows some level differences during the polymerization step 3 restrained inside the range 780-835 mV.
3•2. Polymerization rate and yield
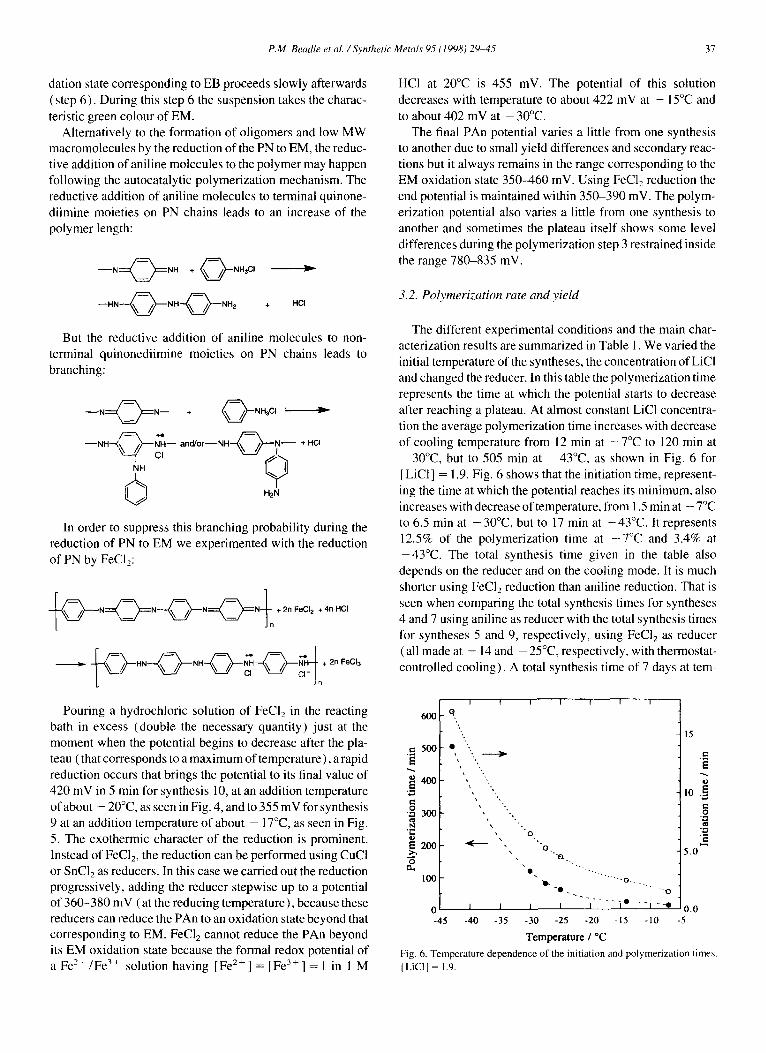
The different experimental conditions and the main char- acterization results are summarized in Table I. We varied the initial temperature of the syntheses, the concentration of LiC1 and changed the reducer. In this table the polymerization time represents the time at which the potential starts to decrease after reaching a plateau. At almost constant LiCI concentra- tion the average polymerization time increases with decrease of cooling temperature from 12 min at - 7 ° C to 120 min at -300C, but to 505 min at - 4 3 ° C , as shown in Fig. 6 for [LiC1] = 1.9. Fig. 6 shows that the initiation time, represent- ing the time at which the potential reaches its minimum, also increases with decrease of temperature, from 1.5 min at - 7°C to 6.5 min at - 30°C, but to 17 min at -43°C . It represents 12.5% of the polymerization time at - 7 ° C and 3.4% at -43°C . The total synthesis time given in the table also depends on the reducer and on the cooling mode. It is much shorter using FeC12 reduction than aniline reduction• That is seen when comparing the total synthesis times for syntheses 4 and 7 using aniline as reducer with the total synthesis times for syntheses 5 and 9, respectively, using FeCI2 as reducer (all made at - 14 and - 25°C, respectively, with thermostat- controlled cooling). A total synthesis time of 7 days at tern-
600
.= 5OO
t - O
• ~ 300
N 200
"8
1 o o
I o,
x
f I I l I I
15
""N
" " 0 x -.
"~t .
"O- " ' ' " ' " " 0 - _
" 0 . " . . . . . . . 0
I I - - - I . . . . ] o - - - f _ . . e 0 I I 0 . 0
-45 -40 -35 -30 -25 -20 -15 -10 -5
T e m p e r a t u r e / °C
i0 . . e~ o ..~.
" 4
5.0
Fig. 6. Tempera ture dependence o f the initiation and polymerizat ion times.
[Lie11 = 1.9.

38 P.M. Beadle et al. /Synthetic Metals 95 (1998 29~t5
peratures lower than -25°C using aniline reduction under thermostat-controlled cooling is practically much too long. Nevertheless, it can be reduced to 17-25 h if the cooling is not thermostat controlled, i.e., when we used an organic slush cooling and let natural heating in the laboratory reach room temperature, which was done for syntheses 6, 12-14 and 18. Using this method the total synthesis time was also reduced when FeCI2 was used as reducer for syntheses 8, 9, 15 and 16.
Increasing the concentration of LiCl up to 1.73 M lengthens the total synthesis time at - 7 ° C but not the initiation and polymerization times. However at - 30°C, for the syntheses 12-16, a lengthening is observed on both the initiation and polymerization times. A lengthening of the polymerization time with increasing ionic strength has already been observed previously [ 89 ], which is not consistent with a predominant propagation reaction of polymerization occurring between radical cations, but rather with a predominant propagation reaction between radical cations and solid oligomers or polymers.
The yield of the syntheses is 95-100% with respect to ammonium persulfate and almost 20% with respect to aniline (95-100% with respect to the oxidized aniline) irrespective of temperature and concentration of LiCl. When FeCI2 is used as reducer the yield of the syntheses is 16-17% with respect to aniline (but always 95-100% with respect to oxidized aniline) because the stoichiometry of the global polymeri- zation reaction is different. The yield is less than 16% if the reducer is added too early and it draws near to 20% if the reducer is added too late.
3.3. Molecular weight
The decrease of the cooling temperature produces an increase of the MW of the synthesized polymers as seen by the increase of their inherent viscosities. For instance, com- pare the inherent viscosities of the polymers synthesized by syntheses 4 ( 1.71 dl/g), 6 ( 1.92 dl/g) and 12 (2.02 dl/g) carried out at decreasing temperatures - 1 4 , - 2 5 and - 30°C, respectively, under a constant LiC1 concentration of 1.9 M. The dependence of the inherent viscosity on the syn- thesis temperature is presented in Fig. 7. Averaged values of inherent viscosities determined on several repeated syntheses under identical conditions were used to draw this curve. The comparison of the inherent viscosities of polymers obtained at the same temperature and LiC1 concentration with or with- out FeC12 reduction is not straightforward because the total synthesis time also influences the inherent viscosity. Poly- mers showing lower inherent viscosities are obtained for longer times of synthesis, as seen comparing synthesis 6 with 7, and synthesis 8 with 9. This result highlights the detrimen- tal segmentation of chains by hydrolysis that competes with the polymerization [ 87,101 ]. Owing to the observed increase in MW of oxidized polymers when reduced with aniline [ 22 ] the inherent viscosity of the polymers obtained by reduction with FeCI2 should be lower. Otherwise, less branched poly-
2.2
2.0 "7
-.- 1 . 8
1.6
1.4
I I I I I I
" O
x .
4 - - " 'b • \
1.2 I I I I 1
50 -45 -40 -35 -30 -25 -20 -5
T e m p e r a t u r e / °C
• \
I I
-15 -10
300
250
200
u
150 "" D
100
Fig. 7. Temperature dependence of the inherent viscosity and conductivity. [LiCI] = 1.9.
mers obtained using FeC12 reduction will show higher inher- ent viscosities than more branched polymers of equivalent MW because the hydrodynamic radius of the polymers is decreased by branchings. Consequently, in this respect, it is not possible to make any conclusions from our data.
Increasing the EiC1 concentration from 0 to 3 M produces an undeniable increase of the inherent viscosity of the poly- mers. Some exceptions within the values given in Table 1 are due to the opposite effect of hydrolysis acting during long- lasting syntheses. The effect was explained [89] on account of a retarded initiation and preferred incorporation of radical cations of aniline and aniline oligomers into already precip- itated growing chains promoted by increasing the ionic strength of the solution. Our determined pH and potential profiles, initiation and polymerization times together with inherent viscosities as a function of the concentration of LiCl do not refute the polymerization mechanism leading to PN proposed by Mattoso et al. [89] and related explanations. For the sake of comparison with other studies we determined the MW of each synthesized polymer by GPC on EB solutions in NMP containing 0.5% LiC1. One of us [ 26 ] stated formerly that MW determinations made using EB solutions are not very reliable because they represent only the MW of the soluble fraction of the polymer. The mode of dissolution, the concentration of LiCI and the temperature of the column also influence the MW determinations [84]. Besides this, an aggregation equilibrium is established in solution [20] that moves over time, chemical crosslinking occurs entailing the formation of tertiary ring-N [86] and physical crosslinking also occurs owing to residual Cl anions in the EB. More reliable values were determined using LEB solutions provid- ing hydrolysis can be avoided during reduction. As a matter of fact our MW determinations on EB solutions are not very reliable. They are not in perfect agreement with the deter- mined inherent viscosities. Actually, differently synthesized polymers having probably different degrees of branching are hardly comparable by inherent viscosity and GPC determi- nations. However, MW determinations by GPC are in a qual-
P.M. Beadle et al. ~Synthetic Metals 95 (1998) 29~t5 39
itative agreement with inherent viscosity determinations. The best values of MW determined for samples showing inherent viscosities within 2.0-2.15 dl/g are: M , = 3 0 0 0 0 g/re•l, M,~ = 140 000-170 000 g/mol with M w / M , = 2-3. Decreas- ing the cooling temperature from I to -25°C with addition of LiCI up to a concentration of about 2 M produces an important increase in Mw from about 55 000 to about 160 000 g/mol, but decreasing the cooling temperature from - 25 to -43°C and increasing the LiC1 concentration to 3 M no longer increase the MW considerably.
Syntheses 19-22 were carried out using a dropwise addi- tion of the oxidant over 10-140 rain and reduction of the synthesized PN by FeCIz. The synthesis conditions are sum- marized in Table 2. The results are not particularly different from those obtained by addition of the oxidant in one go.
3.4. Addition q f polymerization initiators
0.40
0.30
0.20 2~ <
0.10
I ' I ' I I I I
678 332
I I
- ! ..
' \
0 . ( , I J I ~ I J I ~ l , I ,
200 300 400 500 600 700 800 900
Wavelength / nm Fig. 8. U V - V i s absorpt ion spect rum of sample 15.
Syntheses 123-27 were performed in the presence of NPPD, PPDA or previously synthesized powder of EB. All these additives act as polymerization initiators in agreement with previous studies [95-97,102-104]. The addition of 0.5% NPPD with respect to the polymerizable aniline decreases the initiation time at - 25°C from 4.5 to 3.5 min and the polym- erization time from 60 to 35 rain, but the inherent viscosity of the obtained EB is low: 1.14 instead of 1.82 dl/g. The addition of 0.5% PPDA decreases the initiation time at - 25°C from 4.5 to 1.5 rain and the polymerization time from 60 to 28 rain, but the inherent viscosity of the obtained EB and the conductivity of the film made with it are lower than those obtained without addition. The addition of 10% EB decreases the initiation time at - 25°C from 4.5 to 2 min and the polymerization time from 60 to 42 rain, but the inherent viscosity of the obtained EB and the conductivity of the film made with it are lower than those obtained without addition.
3.5. UV-Vis spectroscopy
Tables 1 and 2 show summarized values of the wavelengths of the excitonic peak of different EB samples from different syntheses dissolved in NMP containing 0.5% LiCI, A~, the values of the ratios between the intensity of this peak and the peak corresponding to the "rr-'rr* transition at 330-332 nm, and the values of the conductivities of the films made with them protonated by CSA and cast from m-cresol.
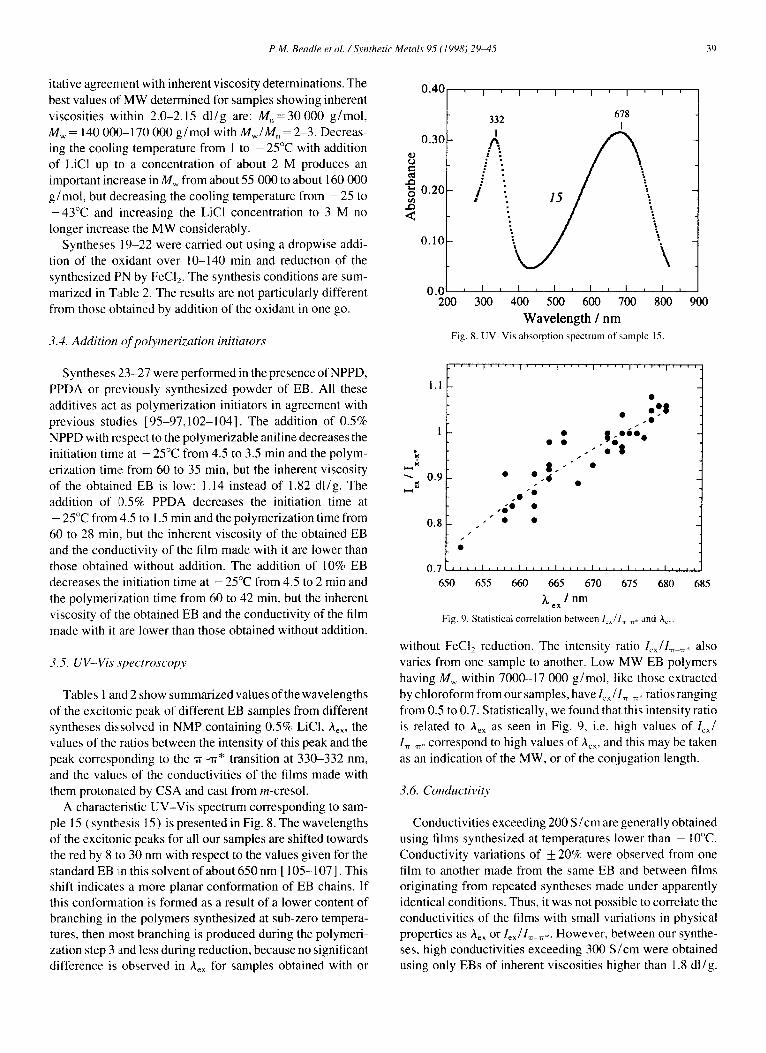
A characteristic UV-Vis spectrum corresponding to sam- ple 15 (synthesis 15) is presented in Fig. 8. The wavelengths of the excitonic peaks for all our samples are shifted towards the red by 8 to 30 nm with respect to the values given for the standard EB iin this solvent of about 650 nm[ 105-107]. This shift indicates a more planar conformation of EB chains. If this conformation is formed as a result of a lower content of branching in the polymers synthesized at sub-zero tempera- tures, then most branching is produced during the polymeri- zation step 3 and less during reduction, because no significant difference is observed in A~ for samples obtained with or
I.I
1
~ 0.9
• • e ~ .
. e
• . 6
/
0.8 • /
s
0.7 . . . . I . . . . t . . . . I . . . . I , , , , I L , , , ~ , , , ,
650 655 6 6 0 6 6 5 6 7 0 675 680
k I n m
Fig. 9. Stat ist ical correlat ion between 1o~/1~ ~:, and Ae~,
685
without FeCI2 reduction. The intensity ratio lexll ~ . : also varies from one sample to another. Low MW EB polymers having M,~ within 7000-17 000 g/mol, like those extracted by chloroform from our samples, have 1~ ~IT ~: ratios ranging from 0.5 to 0.7. Statistically, we found that this intensity ratio is related to A~x as seen in Fig. 9, i.e. high values of left In ~. correspond to high values of Ao~, and this may be taken as an indication of the MW, or of the conjugation length.
3.6. Conductivit3:
Conductivities exceeding 200 S/cm are generally obtained using films synthesized at temperatures lower than - 10°C. Conductivity variations of + 20% were observed from one film to another made from the same EB and between films originating from repeated syntheses made under apparently identical conditions. Thus, it was not possible to correlate the conductivities of the films with small variations in physical properties as Aex or lex/l~_~.. However, between our synthe- ses, high conductivities exceeding 300 S/cm were obtained using only EBs of inherent viscosities higher than 1.8 dl/g.

40 P.M. Beadle et al. / Synthetic Metals 95 (1998) 29~15
300
250
200 u
150
100
I t
/
s
. 7 o c
J S
- 3 0 ° C /
- 14 °C
5 0 i i i i i i i i i
1 . 2 1 . 4 1 . 6 1 . 8 2.0
] ] i n h / dig x
Fig. 10. Dependence of the conductivity of the films on the temperature and inherent viscosity of EBs used to make them. [ LiC11 = 1.9.
The conductivity measured on compressed powders of E.HCI ranges from 5 to 15 S/cm, irrespective of the synthesis conditions.
Using averaged conductivity values for several syntheses at the same temperatures and several film preparations from each synthesis, we find a linear dependence of the conductiv- ity on the logarithm of the inherent viscosity presented in Fig. 10, and hence on the Mw following the Mark-Houwink rela- tion. Theoretically expected enhanced conductivities ofpoly- anilines having higher MW [93] are clearly found for PAns synthesized at sub-zero temperatures when the chains take an expanded coil conformation [31 ] following protonation with CSA and dissolution in m-cresol. Formerly, Heeger and Smith [93] found a conductivity dependence on the inherent viscosity as a power law on compressed E.HCI powders. They found for a large increase of the inherent viscosity from 0.6 to 2.5 dl /g only very small increase in conductivity ranging from 8 to 20 S/cm. Resolutely, the compact coil conforma- tion of the E.HCl and the intergrain boundaries hindered the observation of a clear conductivity dependence on the MW. Similarly, Scheer et al. [21 ] found a very small increase of the conductivity on EB films protonated by HC1, from 3 to 17 S /cm for an increase in Mp ranging from 15 000 to 320 000 g/mol. The superficial protonation of the EB films by HC1 impeded them in finding an obvious dependence.
The stability on aging of the conductivity shows a MW dependence as well. As shown in Fig. 11, the loss in conduc- tivity by aging in air at 135°C for 200 h is more than one order of magnitude higher for a film made with standard low MW PAn ( r/i,,h = 0.65 dl /g) than for the high MW film, 18ex
( r/i,h = 2.55 all/g).
3.7. X-ray diffraction
X-ray diffraction profiles of CSA-protonated EM films made with standard EB and with EBs obtained from syntheses 1 and 5 are presented in Fig. 12. The three profiles are similar
1.0
0.0
-1.0 ~°
~0 -2.0 .20
-3.0
I I I I I I I
- 4 . 0 I l I I I I I -50 0 50 100 150 200 250 300 350
Aging time / h
Fig. 11. Film conductivity decrease on aging. (r. is initial conductivity.
"4
o .=
'~ ,~,
t " q
, I ~ I
10 20
a I n I i
30 40 50
2O Fig. 12. WAXD patterns for CSA-protonated tilms cast from m-cresol made with standard (st) EB and with EB from syntheses 1 and 5.
to one another indicating that the three EM samples are iso- morphous, but the relative intensities of the peaks are differ- ent. The two peaks centred at the lowest angles are better defined and more intense in the profiles of samples from syntheses 1 and 5 than in the profile corresponding to the standard EM. Going from the profile of the standard EM to the profile of the EM from synthesis 5, the intensities of the peaks centred around 17.5, 20 and 27.5 ° are increased. Two of us have recently proposed a model for the structure of E.CSA crystallized from m-cresol which consists of alternat- ing layers of flat EM chains and CSA - anions parallel to the (a ,c) plane [ 108], the chains being parallel to the c axis. The

P.M. Beadle et al. / Synthetic Metals 95 (1998) 29-45 41
profiles are indexed in Fig. 12 according to the monoclinic unit cell that we proposed. During the modellization of the structure we found that the intensities of the peaks are much more sensitive to the exact positions and conformation of the CSA- anions than to the exact orientation of the plane of the chains. In addition, we found that the intensities of the peaks centred around 2 0 = 20 ° are strongly increased by increasing the protonation ratio C S A - / N from 0.35 to 0.65. Based on the observed sensitivity of the intensities of the peaks on the degree of order of anions we can assign an improved order of CSA anions within the layers, i.e. in the (a,c) plane and along the c direction going from the standard profile to the profile from synthesis 5. The regularity of the interlayer stack- ing is also improved, as shown by the increased intensities of the Okl lines. Consequently, the increased conductivity of the films made with EMs synthesized at low temperatures is not only due to the increased MW but also to the enhanced crys- tallinity in terms of structural perfection. Assuming the proc- essing conditions of the films were the same for all the films, we can conclude that the syntheses made at lower tempera- tures and with FeCI= reduction lead to less branched chains.
3.8. UV-Vis--NIR spectroscopy
The carefiJl examination of the UV-Vis-NIR spectra of E.CSA solutions in m-cresol corroborates the results of con- ductivity and X-ray determinations on the films. The spectra of samples 1 and 18 are presented in Fig. 13. The spectrum of sample I :shows a sharp polaronic peak at 444 nm, corre- sponding to transitions from the polaron band to the 7r* band, and an intense broad band peaking far into the NIR corre- sponding to intraband transitions within the half-filled pola- ron band [ 109 ]. It is not different from the spectrum obtained using standard PAn. It represents delocalized polaron intra- chain transitJions and indicates a change of the conformation of PAn chains produced by a specific solvation of the CSA- protonated polymer by m-cresol [110]. This spectrum is characteristic of highly conductive PAn (150-400 S/cm)
. .Q
O
<
i i
0
. . . . I ' ' ' ' l ' ' ' ' I . . . . I . . . . [ . . . .
, , t . . . . I , , , , I , , , , I , , , , I , , , ,
500 1000 1500 2000 2500 3000
Wave leng th / n m F i g 13. U V - V i s - N I R s p e c t r a o f s a m p l e s 1 a n d 18.
O
<
' ' ' 1 ' ' ' ' 1 ' ' ' ' 1 . . . . I ' ' ' ' 1 . . . .
, , , , I , , , , I . . . . I . . . . I J , , , I . . . .
0 500 1000 1500 2000 2500 3000
Wave leng th / n m F i g . 14. U V - V i s - N I R s p e c t r a o f s a m p l e s 7 a n d 9 .
[ l 11 ]. The polaron peak at 444 nm is sharp and the NIR band is concave. The spectrum of sample 18 of high MW EM synthesized at low temperatures shows a smeared polaron peak which appears rounded and shifted into the UV. It shows a large NIR band peaking far beyond 2700 nm indicating an enhanced polaron delocalization. This behaviour indicates a more expanded coil conformation of the chains entailing a larger conjugation length that may happen only if the chains are less branched. We can see that the influence of the syn- thesis conditions on the UV-Vis-NIR spectra are striking by comparing spectra of samples 7 and 9, both presented in Fig. 14. Both EMs were synthesized at - 25°C but EM sample 9 was synthesized during 1.3 h with FeClz reduction, whereas EM sample 7 was synthesized during 168 h without FeC12 reduction. During such a long time some branching and/or chain segmentations probably occurred during synthesis 7 leading to a lower inherent viscosity and conductivity. The broad NIR band shown by sample 9 is convex, whereas that of sample 7 is concave, showing a peak position shifted far into the NIR. The conformations of the E.CSA chains in m- cresol actually determine the shape of the UV-Vis-NIR spec- trum. Thus, in Fig. 15 it is shown that the presence of 0.5% NPPD as an additive during synthesis 24 introduces a local- ized polaron band centred at 1070 nm, indicating that the dimer produced some couplings entailing less expansion of E.CSA coiled chains. However, this effect is not seen for sample 23 synthesized with FeCI= reduction.
3.9. Chemical analysis
C/N and H/C atomic ratios determined by chemical anal- ysis for samples 1-18 range within 5.95-6.0 (calc. 6.0) and within 0.75-0.80 (calc. 0.75), respectively. Observed small differences in these ratios from one sample to other were not taken into account owing to the difficulty in drying the sam- ples completely at 25°C, to avoid rehydration of the dried

42 P.M. Beadle et al. / Synthetic Metals 95 (1998) 29~15
. . . . I ' ' ' ' 1 ' ' ' ' 1 . . . . I ' ' ' ' 1 . . . .
4510 1070 2 4
o ° . ¢ . '
0 500 1000 1500 2000 2500 3000
W a v e l e n g t h / n m
Fig. 15. UV-Vis-NIR spectra of samples 23 and 24.
samples during handling and to reach a complete combustion of carbon.
3.10. Extraction with chloroform
The results of extraction with chloroform are summarized in Table 3. The extracted oligomers, low MW degradation products and low MW polymers having M, = 5000-8000 g/
mol, Mw = 7000-18 000 g/mol, Mw/M,, = 1.4-2.6 represent a maximum of 1% (exceptionally, 3% for sample 4). How- ever, an important increase in the inherent viscosity, MW and conductivity of the films formed with purified EB is observed, especially for synthesized EM at higher temperatures. A def- inite increase in the MW occurs during extraction due either to a post-polymerization process or to crosslinking. We tested the extraction with chloroform in particular because it is an acidic solvent, unlike previously used acetonitrile and THF that proved to produce some crosslinking. The fact that the solubility of the purified EBs has not decreased and the con- ductivity of the films made with purified EBs has increased indicates a post-polymerization process. The UV-Vis-NIR spectral evolution induced by chloroform extraction shown in Fig. 16 also indicates post-polymerization because the spectrum of the purified E.CSA indicates an enhanced charge delocalization. It is known that chloroform is an excellent solvent for hydrocarbon compounds and also a swelling solvent for many polymers. By swelling the EB, it might promote post-polymerization.
A troublesome hydrochlorination of the EB accompanies the purification. HCI may be produced by the oxidation of chloroform vapours in air. The chlorine content in the depro- tonated samples of EB with 0.I M ammonium hydroxide is within 2-4% atomic chlorine atoms per benzene ring (or per atomic nitrogen). This chlorine content is ionic chlorine
Table 3
Characterization of EB samples extracted with chloroform
Sample ~' Extract CI/C6 atomic ratio A~.~ 1..~/1~ ~ ~l,., Film conductivity (%) (%) (nm) (dUg) (S/cm)
1 3.48 664 0.90 0.95 74 ± 4
I ex 1 8.22 672 1.02 1.58 213 + 13
2 1.98 658 0.83 1.34 73 + 4
2ex 0.8 4.08 674 1.00 1.60 274 ± 20
3 2.22 662 0.87 1.68 96 _+ 6 3ex 1.0 6.36 672 1.01 2.18 229 ± 16
4* 2.40 664 0.92 1.95 184 ± 14
4ex 3.0 6.84 662 0.83 2.40 280 + 21
6 2.16 660 0.86 1.92 313 ± 27
6ex 0.5 7.80 658 0.84 1.91 340 ± 19
6exdp 3.18 678 1.08 1.97 310 + 21
9 2.34 671 0.82 2.06 275 ± 17 9ex 0.7 2.64 674 0.98 2.22 332 + 2 I
9exdp 2.58 672 1.40 2.30 274 + 29
I I 3.24 668 0.98 1.87 307 _+ 28
I lex 0.3 5.58 678 1.03 1.78 301 +21
12 3.78 679 1.06 2.02 151 _+ 10 12ex 0.7 13.44 664 0.90 2.14 308 ± 23
12exdp 4.50 674 1.04 2.17 315 ± 32
18 3.18 674 0.96 2.16 323 ± 22
18ex 0.7 8.52 668 0.89 2.55 270 ± 17
22 3.12 662 0.81 2.05 268 + 20 22ex 0.4 11.22 678 0.99 2.35 203 ± 17
ex: extracted sample; exdp: extracted and deprotonated sample; asterisk: synthesized under the same conditions as sample 4.

P.M. Beadle et al. / Synthetic Metals 95 (1998) 29~t5 43
,.Q
O
<
' ' 1 ' ' ' ' 1 ' ' ' ' l ' ' ' ' l ' ' ' ' l . . . .
,- l e x
, , , , l , , , , I , , , , I , , , , I . . . . I . . . . 0 500 1000 1500 2000 2500 3000
Wavelength / nm Fig. 16. UV-Vis-NIR spectra of samples 1 and lex.
because it can be drastically reduced by an enhanced depro- tonation in 0.3 M ammonium hydroxide for 24 h. To avoid hydrolysis we limited use to 0.1 M ammonium hydroxide solutions [35]. After extraction the chlorine content increases, thus for sample 12 it increased from 3.78 to 13.44 atomic %. This hydrochlorination produces a decrease in the absorption wavelength of the excitonic peak of the purified EB sample 12ex, Aex, from 679 to 664 nm and a decrease of the peak intensity ratio I~ /1 . . . . . from 1.06 to 0.9. After a supplementary deprotonation of the extracted EB, sample 12exdp shows a decrease in the chlorine content back to 4.5 atomic % wi~h an increase of the corresponding Aex and lex/ I~ ~. to 674 nm and 1.04, respectively. Although after t h e
supplementary deprotonation the chlorine content exceeded the initial content, we have not strengthened the deprotona- tion conditions to prove irrefutably that all the introduced chlorine by extraction is ionic, avoiding concomitant hydrol- ysis. It is shown by Adams et al. [ 91 ] that a residual chlorine of the order of 1-2 wt.% remains in the EB synthesized at - 2 5 to - 3 5 ° C using 2-4 M LiCl that may be covalent chlorine introduced by the reductive chlorination of PN [112]. After an enhanced deprotonation our EM powders keep a residual chlorine content of 0.3 wt.%.
3.11. Solubility
ence of LiCI can be actually controlled by potential profiling down to - 4 3 ° C by addition of 30-35 vol.% ethanol. Addi- tion of ethano! enables us to start the polymerization conven- iently in a homogeneous liquid phase.
Six polymerization steps were identified at low temper- atures.
The effective control of the polymerization by potential profiling enables us to reduce advantageously the primarily synthesized pernigraniline to emeraldine with FeCI> The reduction is immediate; thus, the total time of synthesis is considerably reduced without yield loss.
The purification of the emeraldine base obtained following our procedure by extraction with chloroform, instead of other common basic solvents used in the past, increases the molec- ular weight of the polyaniline by post-polymerization that does not involve crosslinking and leads to an enhanced con- ductivity of the films of emeraldine protonated with CSA in m-cresol.
Inherent viscosities of emeraldine solutions in conc. sul- furic acid, within 2.0-2.15 dl/g, indicate high Mw of about 200 000 g/mol.
Conductivities of the films of emeraldine protonated by CSA cast from m-cresol are higher than 300 S /cm and show an enhanced resistance to ageing.
The polyaniline thus obtained is probably less branched than standard polyaniline as indicated by: (i) a better solu- bility as emeraldine protonated by CSA in m-cresol; (ii) t h e
wavelength of the exciton peak of the emeraldine base dis- solved in NMP~0.5% LiCl reaching 680 nm and the ratio of peak intensities lex/l~, ~. > 1; (iii) an enhanced crystallinity of the emeraldine films protonated by CSA cast from m-cresol in terms of structural perfection; (iv) a significant depend- ence of the conductivity on the inherent viscosity of poly- aniline (i.e. Mw), dependence insignificant using standard polyaniline.
A c k n o w l e d g e m e n t s
This work has been supported by the European Commis- sion (Human Capital and Mobility Program, Project 0669 PANET) and by the Agence Rh6ne-Alpes pour la Mattrise des Matdriaux (Programme Polym~res Conducteurs).
All the EB samples we synthesized, even deprotonated under mild conditions with 0.1 M ammonium hydroxide, are soluble in NMP containing 0.5 % LiCI and protonated by CSA in m-cresol. Samples synthesized with FeCI2 reduction are more easily soluble than those synthesized without FeCI2 reduction under equivalent conditions.
4 . C o n c l u s i o n s
The polymerization of aniline in aqueous hydrochloric acid solutions by oxidation with ammonium persulfate in the pres-
R e f e r e n c e s
[ I ] R. Willstater, S. Dorogi, Ber. 42 (1909) 2147 and 4118. [ 2 ] R. Willstfitter, J. Cramer, Ber. 43 ( 1910) 2976; 44 ( 1911 ) 2162. [3] A.G. Green, A.E. Woodhead, J. Chem. Soc. 97 ~ 1910) 2388; 101
(1912) 1117. [4] A.G. Green, A.E. Woodhead, Ber. 45 (1912) 1955. 15] A.G. MacDiarrnid, A.J. Epstein, Faraday Discuss. Chem. Soc. 88
(1989) 317. 16] S. Goldschmidt, Ber. 53 (1920) 28; 55 (1922) 3216 and 3220. 17] J. Piccard, F. De Montmollin, Helv. Chim. Acta 6 (1923) 1021. [8] R. De Surville, M. Josefowicz, R. Buyer. Ann. Chim. 2 (1967) 5.
44 P.M. Beadle et al. / Synthetic Metals 95 (1998) 29-45
[9] R. Lantz, J. Gascon, Bull. Soc. China. Fr. 5 (1965) 816. [ 10] L. Dunsch, J. Prakt. Chem. 58 (1975) 1067. [ 11 ] L. Taimr, J. Pospisil, Angew. Makromol. Chem. 92 (1980) 53. [ 12] A.F. Diaz, J.A. Logan, J. Electroanal. Chem. 111 (1980) 111. [ 13] A.G. MacDiarmid, J.-C. Chiang, M. Halpern, W.-S. Huang, J.R.
Krawczyk, R.J. Mammone, S.L. Mu, N.L.D. Somarisi, W. Wu, Polym. Prepr. 24 (1984) 248.
[ 14] F.-L. Lu, F. Wudl, M. Nowak, A.J. Heeger, J. Am. Chem. Soc. 108 (19861 8311.
[15] D. Vachon, R.O. Angus Jr., F.L. Lu, M. Nowak, Z.X. Liu, H. Schaffer, F. Wudl, A.J. Heeger, Synth. Met. 17-19 (1987) 297.
[ 16] F. Wudl, R.O. Angus Jr., F.L. Lu, P.M. Allemand, D.J. Vachon, M. Nowak, Z.X. Liu, A.J. Heeger, J. Am. Chem. Soc. 109 (19871 3677.
[ 17] A.G. MacDiarmid, J.C. Chiang, A.F. Richter, N.L.D. Somarisi, in L. Alcacer (ed.), Conducting Polymers, Special Applications, Rei- del, Dordrecht, 1987, p. 105.
[ 18 ] O. Oka, S. Morita, K. Yoshino, Jpn. J. Appl. Phys. 29 (1990) L679. [ 19] K.-T. Tzou, R.V. Gregory, Polym. Prepr. 35 (1994) 245. [20] Y.-H. Liao, T.K. Kwei, K. Levon, Makromol. Chem. Phys. 196
( 19951 3107. [21] E.M. Scherr, A.G. MacDiarmid, S.K. Manohar, J.G. Masters, Y.
Sun, X. Tang, M.A. Druy, P.J. Glatkowski, V.B. Cajipe, J.E. Fischer, K.R. Cromak, M.E. Josefowicz, J.M. Ginder, R.P. McCall, A.J. Epstein, Synth. Met. 4143 (1991) 735.
[22] A.G. MacDiarmid, A.J. Epstein, Mater. Res. Soc. Syrup. Proc., Vol. 247, Materials Research Society, New York, 1992, p. 565.
[23] E.J. Oh, Y. Min, J.M. Wiesinger, S.K. Manohar, E.M. Scherr, P.J. Prest, A.G. MacDiarmid, A.J. Epstein, Synth. Met. 55-57 (19931 977.
[24] C.-H. Hsu, P.M. Peacock, R.B. Flippen, S.K. Manohar, A.G. Mac- Diarmid, Synth. Met. 60 (1993) 233.
[25] P.N. Adams, D.C. Apperley, A.P. Monkman, Polymer 34 (1993) 328.
[26] S. Davied, Y.F. Nicolau, F. Melis, A. Revillon, Synth. Met. 69-71 (1995) 125.
[27] M. Angelopoulos, Y.-H. Liao, B. Furman, T. Graham, Macromol- ecules 29 (1996) 3046.
[28] Y. Cao, P. Smith, A.J. Heeger, Synth. Met. 55-57 (1993) 3514. [29] C.L Gettinger, A.J. Heeger, D.J. Pine, Y. Cao, Synth. Met. 74
(1995) 8l. [ 30 ] Y. Xia, J.M. Wiesinger, A.G. MacDiarmid, Chem. Mater. 7 ( 1995 )
443. [31 ] A.G. MacDiarmid, A.J. Epstein, Synth. Met. 65 ( 19941 103. [32] S.P. Armes, J.F. Miller, Synth. Met. 22 (1988) 385. [33] A. Profi, F. Genoud, C. Menardo, M. Nechtschein, Synth. Met. 24
(1988) 193. [ 34] M. Gholamian, A.Q. Contractor, J. Electroanal. Chem. 252 ( 19881
291. [35] Y. Cao, A. Andreatta, A.J. Heeger, P. Smith, Polymer 30 (1989)
2305. [36] S.P. Armes, M. Aldissi, Polymer 32 ( 1991 ) 2043. [37] D.K. Moon, K. Osakada, T. Maruyama, T. Yamamoto, Makromol.
Chem. 193 (1992) 1723. [38] A. Yasuda, T. Shimidzu, Synth. Met. 61 ( 19931 239. [39] A. Yasuda, T. Shimidzu, Polym. J. 25 (1993) 329. 140 ] J.-E. Osterholm, Y. Cao, F. Klavetter, P. Smith, Polymer 35 (1994)
2902. 141 ] Y. Fong, J.B. Schlenoff, Polymer 36 ( 1995 ) 639. [42] N. Kuramoto, E.M. Geni~s, Synth. Met. 68 (1995) 191. [43] H. Yan, N. Toshima, Synth. Met. 69-71 (1995) 151. [44] S.M. Yang, J.T. Chen, Synth. Met. 69-71 ( 19951 153. [45] G. Boara, M. Sparpaglione, Synth. Met. 72 (1995) 135. [46] D. Ichinode, T. Arai, H. Kise, Synth. Met. 84-86 (1997) 75. [47] R.J. Waltman, J. Bargon, Can. J. Chem. 64 ( 19861 76. [48] Y. Wei, X. Tang, Y. Sun, J. Polym. Sci. Part A, Polym. Chem. 27
(1989) 2385.
[491 [501
151
[521
1531
[54]
[55 1561 I571 [581
[591 [601 [611
[62] [631 64] 65]
66]
167]
[681
[691
[70] [71]
[72] [73]
[741
[75] [76]
[77] [781
[791 1801
[811
1821 [83]
[841 [851
[861
[871
1881
[891
H. Yang, AJ. Bard, J. Electroanal. Chem. 339 ( 19921 423. E.M. Geni6s, M.J. Lapkowski, J. Electroanal. Chem. 236 ( 19871 189.
] Y. Wei, G.-W. Jang, C.-C. Chan, K.F. Hsueh, R. Hariharan, S.A. Patel, C.K. Whitecar, J. Phys. Chem. 94 (1990) 7716. Y.-B. Shim, M.-S. Won, S.-M. Park, J. Electrochem. Soc. 137 ( 19901 538. K. Sasaki, M. Kaya, J. Yano. A. Kitani, A. Kunai, J. Electroanal. Chem. 215 ( 19861 401. A. Kitani, M. Kaya, J. Yano, K. Yoshikawa, K. Sasaki, Synth. Met. 17-19 (19871 341.
] R.E. Cameron, S.K. Clement, Synth. Met. 33 ( 19891 269. F.L. Klavetter, Y. Cao, Synth. Met. 55-57 ( 19931 989. D.E. Stilwell, S.-M. Park, J. Electrochem. Soc. 135 (1988) 2254. G. Zotti, S. Cattarin, N. Comisso, J. Electroanal. Chem. 239 ( 1988 ) 387. Y.-B. Shim, S.-M. Park, Synth. Met. 27-29 (1989) E169. Y. Wei, Y. Sun, X. Tang, J. Phys. Chem. 93 ( 19891 4878. M.A. Spitsyn, A.V. Shlepakov, V.N. Andreev, Sov. Electrochem. 27 (1991) 525. K. Tzou, R.V. Gregory, Synth. Met. 47 ( 19921 267. S. Mu, J. Kan, Electrochim. Acta 41 ( 19961 1593. B. Johnson, S.-M. Park, J. Electrochem. Soc. 143 ( 19961 t269. D.M. Mohilner, R.N. Adams, W.J. Argersinger Jr., J. Am. Chem. Soc. 84 (19621 3618. L. Dunsch, J. Electroanal. Chem. Interface Electrochem. 61 (1975) 61. S.K. Manohar, A.G. MacDiarmid, A.J. Epstein, Synth. Met. 41M-3 (19911 711. A. Guyot, in G. Allen, J.C. Berington (eds.), Comprehensive Poly- mer Science, Vol. 4, Pergamon, Oxford, 1989, p. 261. S.P. Armes, M. Aldissi, M. Hawley, J.G. Beery, S. Gottesfeld, Langmuir 7 ( 1991 ) 1447. B. Wessling, Synth. Met. 41M-3 ( 1991 ) 907. A. Thyssen, A. Borgerding, J.W. Schultze, Makromol. Chem., Macromol. Syrup. 8 (1987) 143. J. Heinze, Makromol. Chem., Macronaol. Syrup. 8 ( 19871 73. A. Hochfeld, R. Kessel, J.W. Schultze, A. Thyssen, Ber. Bunsenges. Phys. Chem. 92 ( 19881 1406. A. Thyssen, A. Hochfeld, J.W. Schlultze, DECHEMA-Monogr. 112 (19881 441. J.W. Schultze, A. Thyssen, Synth. Met. 4143 ( 1991 ) 2825. K. Bade, V. Tsakova, J.W. Schultze, Electrochim. Acta 37 ( 19921 2255. L. Duic, Z. Mandic, S. Kovac. Electrochim. Acta 40 ( 1995 ) 1681. Z. Mandic, L. Duic, F. Kovacicek, Electrochim. Acta 42 (19971 1389. E.M. Genibs, C. Tsintavis, J. Electroanal. Chem. 195 (1985) 109. A. Thyssen, A. Hochfeld, R. Kessel, A. Meyer, J.W. Schultze, Synth. Met. 27-29 (1989) E357. S.A. Arnautov, S.V. Zaitsev-Zotov, V.M. Kobryanskii, Synth. Met. 84-86 f 19971 133. J. Tang, X. Jing, B. Wang, F. Wang, Synth. Met. 24 (1988) 231. A.M. Kenwright, W.J. Feast, P. Adams, A.J. Milton, A.P. Monkman, B.J. Say, Polymer 33 (1992) 4292. P.N. Adams, A.P. Monkman, Synth. Met. 87 (1997) 165. L.J. Bellamy, The Infra-red Spectra of Complex Molecules, Chap- man and Hall, London, 1975. D. Rodrigue, M. Arnold, J. Riga, J.J. Verbist, Journ6es Polym~:res Conducteurs, Strasbourg, 1994. C.Q. Cui, L.H. Ong, T.C. Tan, J.Y. Lee, Electrochim. Acta 38 (19931 1395. M. Abe, A. Ohtani, Y. Umemoto, S. Akizuki, M. Ezoe, H. Higuchi, K. Nakamoto, A. Okuno, Y. Noda, J. Chem. Soc., Chem. Commun. (1989) 1736. L.H.C. Mattoso, A.G. MacDiarmid, A.J. Epstein, Synth. Met. 68 (19941 1.

P.M. Beadle et al. / Synthetic Metals 95 (1998) 29-45 45
1901 P.N. Adams, P.J. Laughlin, A.P. Monkman, Synth. Met. 76 (1996) t57.
[ 91 ] P.N. Adams, P.J. Laughlin, A.P. Monkman, A.M. Kenwright, Poly- mer37 (1996) 3411.
192] P.N. Adams, L. Abell, A. Middleton, A.P. Monkman, Synth. Met. 84-86 (1997) 61.
[93] A.J. Heeger, P. Smith, in J.L. Br6das, R. Silbey (eds.), Conjugated Polymers, Kluwer, Dordrecht, 199t, p. 141.
[94] H.C. Montgomery, J. Appl. Phys. 42 ( 1971 ) 2971. [951 Y. Wey, K.F. Hsuech, G.-W. Jang, Polym. Prepr. 35 (1994) 242. [96] Y. Wey, K.F. Hsuech, G.-W. Jang, Polymer 35 (1994) 3572. 1971 J. Stejskat, P. Kratochvil, M. Spirkova, Polymer 36 (1995) 4135. 198 ] N. Gospodinova, L. Terlemezyan, P. Mokreva, K. Kossev, Polymer
34 (1993) 2434. 1991 Y. Fu, R.L. Elsenbaumer, Chem. Mater. 6 (1994) 671.
[ 100] Y. Maeda, A. Katsuta, K. Nagasaki, M. Kamiyama, J. Electrochem. Soc. 14:2 (1995) 2261.
11011 N. Gospodinova, P. Mokreva, L. Terlemezyan, Polymer 35 (1994) 3102.
[ 102] C.H. Yang, T.C. Wen, J. Appl. Electrochem. 24 (1994) 166. [ 1031 H. Tang, A. Kitani, S. Maitani, H. Munemura, M. Shiotani, Elec-
trochim. Acta 40 (1995) 849. [ 104] J. Stejskal, M. Spirkova, P. Kratochvil, Acta Polym. 45 (1994) 385. I 105 ] M. Angelopoulos, R. Dipietro, W.G. Zheng, A.G. MacDiarmid, A.J.
Epstein, Synth. Met. 84-86 (1997) 35. [106] W. Zheng, Y. Min, A.G. MacDiarmid, M. Angelopoulos, Y.-H.
Liao, A.J. Epstein, Synth. Met. 84-86 (1997) 63. [ 107] J.G. Master, J.M. Ginder, A.J. Epstein, J. Chem. Phys. 96 (1992)
4768. [ 1081 W. Luzny, E.J. Samuelsen, D. Djurado, Y.F. Nicolau, Synth. Met.
90 (1997) 19. 11091 Y. Xia, J.M. Wiesinger, A.G. MacDiarmid, A.J. Epstein, Chem.
Mater. 7 (1995) 443. [110] O.T. lkkala, L.-O. Pietil~i, L. Ahjopalo, H. Osterholm, P.J.
Passiniemi, J. Chem. Phys. 103 (1995) 9855. I 111 ] Y. Cao, P. Smith, A. Heeger, Synth. Met. 55-57 (1993) 3514. [ 1121 A.G. MacDiarmid, S.K. Manohar, J.G. Master, Y. Sun, H. Weiss,
A.J. Epstein, Synth. Met. 41-43 ( 1991 ) 621.