Homeostasis of plasma membrane viscosity in fluctuating temperatures
10
Homeostasis of plasma membrane viscosity in fluctuating temperatures Alexandre Martinie `re 1 , Maria Shvedunova 1 , Adrian J.W. Thomson 2 , Nicola H. Evans 3 , Steven Penfield 4 , John Runions 1 and Harriet G. McWatters 3 1 School of Life Sciences, Oxford Brookes University, Gipsy Lane, Headington, Oxford OX3 0BP, UK; 2 Institute of Molecular Plant Sciences, University of Edinburgh, Edinburgh EH9 3JH, UK; 3 Department of Plant Sciences, University of Oxford, Oxford OX1 3RB, UK; 4 Centre for Novel Agricultural Products, Department of Biology, University of York, PO BOX 373, York YO10 5YW, UK Authors for correspondence: John Runions Tel: +44 1865 483 964 Email: [email protected] Harriet G. McWatters Tel: +44 1865 275 028 Email: [email protected] Received: 15 April 2011 Accepted: 3 June 2011 New Phytologist (2011) 192: 328–337 doi: 10.1111/j.1469-8137.2011.03821.x Key words: Arabidopsis, circadian rhythm, desaturation, diffusion, fatty acid, plasma membrane, temperature sensing, viscosity. Summary • Temperature has a direct effect at the cellular level on an organism. For instance, in the case of biomembranes, cooling causes lipids to lose entropy and pack closely together. Reducing temperature should, in the absence of other factors, increase the viscosity of a lipid membrane. We have investigated the effect of temperature variation on plasma membrane (PM) viscosity. • We used dispersion tracking of photoactivated green fluorescent protein (GFP) and fluorescence recovery after photobleaching in wild-type and desaturase mutant Arabidopsis thaliana plants along with membrane lipid saturation analysis to monitor the effect of temperature and membrane lipid composition on PM viscosity. • Plasma membrane viscosity in A. thaliana is negatively correlated with ambient temperature only under constant-temperature conditions. In the more natural environment of temperature cycles, plants actively manage PM viscosity to counter- act the direct effects of temperature. • Plasma membrane viscosity is regulated by altering the proportion of desaturated fatty acids. In cold conditions, cell membranes accumulate desaturated fatty acids, which decreases membrane viscosity and vice versa. Moreover, we show that con- trol of fatty acid desaturase 2 (FAD2)-dependent lipid desaturation is essential for this homeostasis of membrane viscosity. Finally, a lack of FAD2 function results in aberrant temperature responses. Introduction According to the fluid mosaic model of biomembranes, molecules such as lipids and proteins are constantly in motion and diffuse within the plane of the membrane. The fluidity of the membrane is an intrinsic propriety of the lipid bilayer and protein mobility is crucial for many cellu- lar mechanisms, for example ligand–receptor interactions (Singer & Nicolson, 1972). Two main factors strongly influence membrane fluidity: the temperature and the rela- tive amount of lipid saturation. Interestingly, the lipid saturation in membranes is adjusted by the plant depending on environmental condi- tions. Membranes accumulate more desaturated fatty acids in cold than in warm growing conditions (Falcone et al., 2004). Desaturation of lipids makes them less able to tightly pack and, therefore, membranes with relatively higher amounts of fatty acid desaturation should be less viscous. The removal of hydrogen atoms that results in desaturation is done by members of the fatty acid desaturase (FAD) gene family, and the activity of these enzymes is probably inhibited in warm conditions (Burgos et al., 2011). Studies on RNA concentrations of FAD have shown little variation in response to either cold or warm treatment. Recently, however, O’Quin et al. (2010) have described temperature-sensitive degradation of FAD3 which might explain FAD-protein regulation in response to fluctuating temperatures. In addition to the effect of the degree of saturation of fatty acids, temperature variation affects membrane fluidity directly. As temperature increases, membranes become New Phytologist Research 328 New Phytologist (2011) 192: 328–337 www.newphytologist.com ȑ 2011 The Authors New Phytologist ȑ 2011 New Phytologist Trust
-
Upload
oxfordbrookes -
Category
Documents
-
view
0 -
download
0
Transcript of Homeostasis of plasma membrane viscosity in fluctuating temperatures

Homeostasis of plasma membrane viscosity influctuating temperatures
Alexandre Martiniere1, Maria Shvedunova1, Adrian J.W. Thomson2, Nicola H. Evans3, Steven Penfield4,
John Runions1 and Harriet G. McWatters3
1School of Life Sciences, Oxford Brookes University, Gipsy Lane, Headington, Oxford OX3 0BP, UK; 2Institute of Molecular Plant Sciences, University of
Edinburgh, Edinburgh EH9 3JH, UK; 3Department of Plant Sciences, University of Oxford, Oxford OX1 3RB, UK; 4Centre for Novel Agricultural
Products, Department of Biology, University of York, PO BOX 373, York YO10 5YW, UK
Authors for correspondence:John Runions
Tel: +44 1865 483 964
Email: [email protected]
Harriet G. McWatters
Tel: +44 1865 275 028
Email: [email protected]
Received: 15 April 2011
Accepted: 3 June 2011
New Phytologist (2011) 192: 328–337doi: 10.1111/j.1469-8137.2011.03821.x
Key words: Arabidopsis, circadian rhythm,desaturation, diffusion, fatty acid, plasmamembrane, temperature sensing, viscosity.
Summary
• Temperature has a direct effect at the cellular level on an organism. For instance,
in the case of biomembranes, cooling causes lipids to lose entropy and pack closely
together. Reducing temperature should, in the absence of other factors, increase
the viscosity of a lipid membrane. We have investigated the effect of temperature
variation on plasma membrane (PM) viscosity.
• We used dispersion tracking of photoactivated green fluorescent protein (GFP)
and fluorescence recovery after photobleaching in wild-type and desaturase
mutant Arabidopsis thaliana plants along with membrane lipid saturation analysis
to monitor the effect of temperature and membrane lipid composition on PM
viscosity.
• Plasma membrane viscosity in A. thaliana is negatively correlated with ambient
temperature only under constant-temperature conditions. In the more natural
environment of temperature cycles, plants actively manage PM viscosity to counter-
act the direct effects of temperature.
• Plasma membrane viscosity is regulated by altering the proportion of desaturated
fatty acids. In cold conditions, cell membranes accumulate desaturated fatty acids,
which decreases membrane viscosity and vice versa. Moreover, we show that con-
trol of fatty acid desaturase 2 (FAD2)-dependent lipid desaturation is essential for
this homeostasis of membrane viscosity. Finally, a lack of FAD2 function results in
aberrant temperature responses.
Introduction
According to the fluid mosaic model of biomembranes,molecules such as lipids and proteins are constantly inmotion and diffuse within the plane of the membrane. Thefluidity of the membrane is an intrinsic propriety of thelipid bilayer and protein mobility is crucial for many cellu-lar mechanisms, for example ligand–receptor interactions(Singer & Nicolson, 1972). Two main factors stronglyinfluence membrane fluidity: the temperature and the rela-tive amount of lipid saturation.
Interestingly, the lipid saturation in membranes isadjusted by the plant depending on environmental condi-tions. Membranes accumulate more desaturated fatty acidsin cold than in warm growing conditions (Falcone et al.,
2004). Desaturation of lipids makes them less able to tightlypack and, therefore, membranes with relatively higheramounts of fatty acid desaturation should be less viscous.The removal of hydrogen atoms that results in desaturationis done by members of the fatty acid desaturase (FAD) genefamily, and the activity of these enzymes is probably inhibitedin warm conditions (Burgos et al., 2011). Studies on RNAconcentrations of FAD have shown little variation in responseto either cold or warm treatment. Recently, however, O’Quinet al. (2010) have described temperature-sensitive degradationof FAD3 which might explain FAD-protein regulation inresponse to fluctuating temperatures.
In addition to the effect of the degree of saturation offatty acids, temperature variation affects membrane fluiditydirectly. As temperature increases, membranes become
NewPhytologistResearch
328 New Phytologist (2011) 192: 328–337
www.newphytologist.com� 2011 The Authors
New Phytologist � 2011 New Phytologist Trust

more fluid (less viscous) and, conversely, a decrease in tem-perature results in increased viscosity. Because membranesreact to temperature changes directly, they are presumed tobe involved in temperature sensing. In Bacillus subtilis, theprotein DesK is responsible for temperature sensing. DesK,a histidine kinase, has a role in sensing plasma membrane(PM) thickness variation induced by temperature changes.Autophosphorylation of DesK initiates transductioncascades which modify the gene expression profile inresponse to changing temperature (Cybulski et al., 2010).Other evidence highlights the role of lipid membranes intemperature sensing. Manipulation of lipid composition inyeast (Saccharomyces cerevisiae) and other organisms led toalterations in protein expression similar to those producedby temperature changes (reviewed in Vigh et al., 2005). Inplants, study of a variety of model systems has also sug-gested that lipid membranes of cells may play a role intemperature sensing. For instance, in the plant Brassicanapus, hot- or cold-activated protein kinases were up-regulated at ambient temperatures following the applicationof membrane fluidifying or rigidifying agents, respectively(Sangwan et al., 2002). These examples show that mem-brane fluidity could be a sensor input for cells.
The relationship between temperature, membrane com-position and membrane viscosity has not been investigatedin a plant system. Here we have demonstrated that fluores-cence dispersal after photoactivation of green fluorescentprotein (GFP) is an effective method for monitoring mem-brane viscosity in vivo. Surprisingly, we have found thatwhen temperature fluctuates in a manner similar to naturalconditions, PM viscosity does not decrease as temperatureincreases – the membrane actually became more viscous inwarm conditions than in cold. By studying lipid saturation,we have shown that Arabidopsis compensates for changingtemperature by adjusting the amount of fatty acid desatura-tion. Moreover, impairment in the fatty acid desaturationpathway abolishes the plant’s ability to adjust membraneviscosity and inhibits some physiological responses totemperature changes.
Materials and Methods
Plant materials and growth conditions
All experiments were carried out using the Columbia (Col0)accession of Arabidopsis thaliana (L.) Heynh or homozygousfad2.2 mutants in the Col0 background (described inLarkindale et al., 2005 and obtained from Professor M.R.Knight, Durham University, UK). Seedlings were grown onplates containing 1· Murashige and Skoog (MS) salts(Sigma) with 1% agar (Duchefa biochemie, Haarlem,Netherlands). Media was corrected to pH 5.8. Seeds weresurface-sterilized before being stratified in the dark at 4�Cfor 72 h before transfer to a growth chamber.
Entrainment protocols consisted of warm : cold temper-ature cycles (WC, 12 h at 27�C followed by 12 h at 12�C)in constant white light (50 lmol m)2 s)1) or light : darkcycles (LD, 12 h of white light followed by 12 h of dark-ness) at constant 20�C. Temperature cycles were providedby a Percival E30-B chamber (< 5 min ramp time betweentemperatures), and light cycles and constant light regimesby Sanyo MLR-350 growth chambers.
Production of transformed A. thaliana lines
For photoactivation of a PM marker, photoactivatable GFP(paGFP) was fused to the intrinsic PM protein LTI6b(AtRCI2b, At3g05890). 35s::paGFP-LTI6b was cloned byreplacing the DNA sequence of enhanced GFP with that ofpaGFP between BamH1 and EcoR1 restriction sites in thevector pBIB 35s::EGFP-LTI6b (Kurup et al., 2005). Thiswas accomplished using forward primer 5¢-GCT GGATCC GGT ATG GTG AGC AAG GGC GAG GAG-3¢ toadd a BamH1 restriction site and reverse primer 5¢-AGCGAA TTC TCT CAT CTT GTA CAG CTC GTC CATGCC-3¢ to remove the stop codon and add an EcoR1restriction site to the paGFP PCR fragment. Lines of Col0and fad2.2 homozygous for 35s::paGFP-LTI6b were pro-duced by floral dipping (Zhang et al., 2006) followed byselection on antibiotics.
For fluorescence recovery after photobleaching (FRAP)experiments, seedlings expressing 35s::GFP-LTI6b wereused (Kurup et al., 2005).
Leaf movement
Two biological replicates of the experiment were performedas described previously (Edwards et al., 2005), with eachreplicate containing eight to 16 plants of each genotype.Following imbibition and stratification, seedlings weregrown in LD 12 : 12 h at 22�C before commencementof imaging. Leaf movement rhythms were recorded inconstant light (50 lmol m)2 s)1) at the appropriatetemperature (12 or 27�C), starting at subjective dawn onday 11 postgermination. Circadian rhythms of leaf move-ment were analyzed using fast Fourier transform-nonlinearleast squares (FFT-NLLS) (Johnson & Frasier, 1985;Straume et al., 1991; Plautz et al., 1997) via the BRASSinterface (Brown, 2004). For period estimates, the first 24 hof data were discarded to ensure only the free-runningperiod was measured.
Hypocotyl measurements
Columbia and fad2.2 seeds were sown on square Petri plates(120 cm) and placed vertically in a growth chamberrunning the appropriate environmental regime for 7 d. Inevery case, foil-wrapped plates were included as dark
NewPhytologist Research 329
� 2011 The Authors
New Phytologist � 2011 New Phytologist Trust
New Phytologist (2011) 192: 328–337
www.newphytologist.com
controls. Plates were photographed and hypocotyl lengthsmeasured using ImageJ software. Results are means(± SEM) of two biological replicates, each containing 40seedlings.
Flowering time
Flowering time experiments were conducted in walk-inconstant-environment rooms set to a long-day photoperiodof LD 16 : 8 h or a short-day photoperiod of LD 8 : 16 hat the appropriate temperature (22 or 27�C). Light intensityat the level of the plant was 50–60 lmol m)2 s)1.Following germination on 1· MS plates, 2-wk-old Col0and fad2.2 seedlings were transferred to sterilized soil.Plants were checked daily until the floral meristem wasclearly visible. At this point, plants were dissected to countthe total number of rosette leaves. Results are means(± SEM) of 16–20 plants.
Lipid composition
Columbia seedlings were grown for 8 d postgermination on1· MS plates in LD 12 : 12 h or WC 27 : 12�C cycles.Samples were collected at 3 h intervals from dawn (time oflights on (LD) or temperature up (WC); that is, zeitgebertime (ZT) 0) on day 9 and immediately snap-frozen inliquid nitrogen. Analysis of total lipid composition wasperformed using gas chromatography, as described inLarson & Graham (2001). Results are means (± SEM) offive biological replicates. The degree of saturation of each18-carbon fatty acid is indicated by the number of doublebonds it contains (0, fully saturated; 3, fully desaturated).
In order to compare effects of light and temperature, datacollected during the ‘day’ (ZT 3 h, 6 h and 9 h) were pooledand analyzed separately from those collected at ‘night’ (ZT15 h, 18 h and 21 h). ZT 0 and 12 time points were notincluded in this analysis as we wished to avoid the transitionpoints between light and dark or warm and cold. The ratioof fully desaturated : saturated fatty acid was calculated bydividing the total amount of fully desaturated fatty acids bythe sum total amount of saturated and partially saturatedfatty acids.
Membrane viscosity
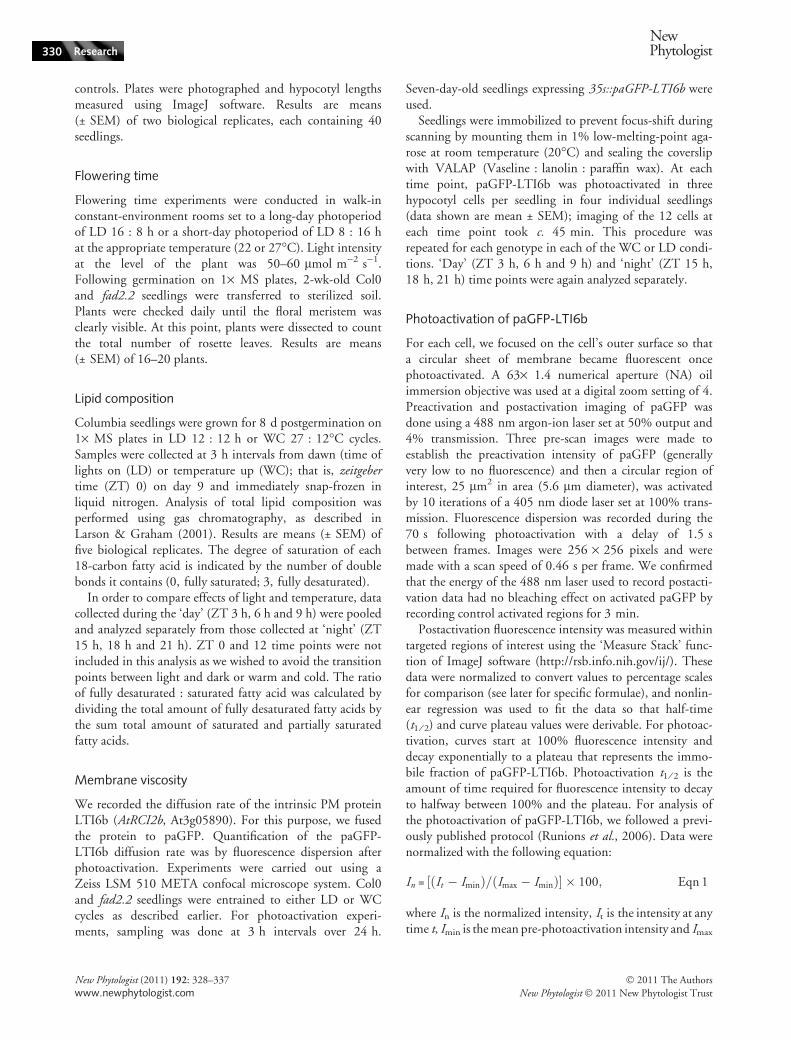
We recorded the diffusion rate of the intrinsic PM proteinLTI6b (AtRCI2b, At3g05890). For this purpose, we fusedthe protein to paGFP. Quantification of the paGFP-LTI6b diffusion rate was by fluorescence dispersion afterphotoactivation. Experiments were carried out using aZeiss LSM 510 META confocal microscope system. Col0and fad2.2 seedlings were entrained to either LD or WCcycles as described earlier. For photoactivation experi-ments, sampling was done at 3 h intervals over 24 h.
Seven-day-old seedlings expressing 35s::paGFP-LTI6b wereused.
Seedlings were immobilized to prevent focus-shift duringscanning by mounting them in 1% low-melting-point aga-rose at room temperature (20�C) and sealing the coverslipwith VALAP (Vaseline : lanolin : paraffin wax). At eachtime point, paGFP-LTI6b was photoactivated in threehypocotyl cells per seedling in four individual seedlings(data shown are mean ± SEM); imaging of the 12 cells ateach time point took c. 45 min. This procedure wasrepeated for each genotype in each of the WC or LD condi-tions. ‘Day’ (ZT 3 h, 6 h and 9 h) and ‘night’ (ZT 15 h,18 h, 21 h) time points were again analyzed separately.
Photoactivation of paGFP-LTI6b
For each cell, we focused on the cell’s outer surface so thata circular sheet of membrane became fluorescent oncephotoactivated. A 63· 1.4 numerical aperture (NA) oilimmersion objective was used at a digital zoom setting of 4.Preactivation and postactivation imaging of paGFP wasdone using a 488 nm argon-ion laser set at 50% output and4% transmission. Three pre-scan images were made toestablish the preactivation intensity of paGFP (generallyvery low to no fluorescence) and then a circular region ofinterest, 25 lm2 in area (5.6 lm diameter), was activatedby 10 iterations of a 405 nm diode laser set at 100% trans-mission. Fluorescence dispersion was recorded during the70 s following photoactivation with a delay of 1.5 sbetween frames. Images were 256 · 256 pixels and weremade with a scan speed of 0.46 s per frame. We confirmedthat the energy of the 488 nm laser used to record postacti-vation data had no bleaching effect on activated paGFP byrecording control activated regions for 3 min.
Postactivation fluorescence intensity was measured withintargeted regions of interest using the ‘Measure Stack’ func-tion of ImageJ software (http://rsb.info.nih.gov/ij/). Thesedata were normalized to convert values to percentage scalesfor comparison (see later for specific formulae), and nonlin-ear regression was used to fit the data so that half-time(t1 ⁄ 2) and curve plateau values were derivable. For photoac-tivation, curves start at 100% fluorescence intensity anddecay exponentially to a plateau that represents the immo-bile fraction of paGFP-LTI6b. Photoactivation t1 ⁄ 2 is theamount of time required for fluorescence intensity to decayto halfway between 100% and the plateau. For analysis ofthe photoactivation of paGFP-LTI6b, we followed a previ-ously published protocol (Runions et al., 2006). Data werenormalized with the following equation:
In = ½ðIt � IminÞ=ðImax � IminÞ� � 100; Eqn 1
where In is the normalized intensity, It is the intensity at anytime t, Imin is the mean pre-photoactivation intensity and Imax
330 Research
NewPhytologist
� 2011 The Authors
New Phytologist � 2011 New Phytologist Trust
New Phytologist (2011) 192: 328–337
www.newphytologist.com

is the brightest post-photoactivation intensity. Nonlinearregression was used to fit normalized intensity data for thepost-photoactivation time period with GraphPad Prism 5software using the exponentially decreasing equation:
Y ðt Þ = A expð�kÞðt Þ þB; Eqn 2
where Y(t) is normalized intensity, A, B, and k are para-meters of the curve, and t is time.
Each data set was first fitted independently with thisequation to ensure goodness of fit (generally r2 was > 0.95)before a single curve was fitted to all data points of a giventreatment by combining data sets and sharing curve para-meter values. Half-time (t1 ⁄ 2) from this curve fitting wascalculated as t1 ⁄ 2 = 0.69 ⁄ k.
Finally, the t1 ⁄ 2 value was used for calculating the proteindiffusion rate (Axelrod et al., 1976) as D = (0.88 R2) ⁄(4 t1 ⁄ 2), where D is the diffusion rate in lm2 s)1 and R isthe radius of the photoactivation spot.
Values of D were compared using either two-tailed t-testsor ANOVA followed by Tukey HSD using Microsoft Excelor SPSS software (SPSS software, IBM corporation, NY,USA).
Fluorescence recovery after photobleaching of EGFP-LTI6b and fluorescein isothiocyanate (FITC)
Fluorescence recovery after photobleaching experiments onEGFP-LTI6b were done using the same magnification andscan settings as described earlier for photoactivation. Theradii of photobleached regions were 2.21, 3.48, and4.43 lm in successive experiments. Pre-bleach and post-bleach scans were made using the 488 nm line of an argon-ion laser set to 50% output and 1% transmission. Bleachingwas done using five iterations of the 488 nm line set to100% transmission. Ten pre-bleach scans were made andfluorescence recovery was recorded during 143 s post-bleaching. For control FRAP experiments on FITC dilutedin 100% glycerol, pre-bleach and post-bleach images weremade with the 488 nm line of the argon-ion laser set to50% output and 0.5% transmission. Bleaching of FITCwas done within circular regions of radii 2.04, 3.49 and5.79 lm in successive experiments using a 405 nm diodelaser set at 100% transmission for 30 iterations and fluores-cence recovery was recorded for 35 s with no time delaybetween scans. Image resolution was 128 · 128 pixels andscan speed was 0.123 s per frame.
For analysis of the FRAP data for GFP-LTI6b and FITC,the data were normalized using the equation:
In = ½ðIt � IminÞ=ðImax � IminÞ� � 100; Eqn 3
where In is the normalized intensity, It is the intensity at anytime t, Imin is the minimum post-photobleaching intensity
and Imax is the mean pre-photobleaching intensity.Nonlinear regression was used to model the normalizedFRAP data. In this case, a two-phase exponential associationequation was used:
Y ðt Þ=AþBð1� expð�k1Þðt ÞÞþC ð1� expð�k2Þðt ÞÞ; Eqn4
where Y(t) is normalized intensity, A, B, C, k1 and k2 areparameters of the curve, and t is time. t1 ⁄ 2 was calculatedfor each individual data set by interpolation at the intensitychange midpoint using the curve-fitting equation.
Results
Measurement of membrane viscosity
Direct measurements of membrane viscosity in living tissuesare difficult to obtain. To overcome this problem, we reliedon the propensity of membrane proteins to diffuse withinthe lipid bilayer. The speed of protein diffusion within thebilayer is inversely correlated with membrane viscosity.LTI6b, a small intrinsic PM protein, was fused to GFP andstably expressed in A. thaliana (GFP-LTI6b). The fusionprotein was localized to the PM as previously reported(Cutler et al., 2000). To test the mobility of this protein inthe PM, we used FRAP to estimate the fluorescence inten-sity recovery half-time and the percentage of recovery.
First, we tested whether GFP-LTI6b diffuses within thePM. In first-order diffusion kinetics (i.e. when other factorssuch as protein interaction which might limit diffusion areabsent), there should exist a linear relation between the half-time of fluorescence recovery and the size of the bleachedcircular region (Sprague & McNally, 2005). To test thisassertion, we did a series of FRAP experiments with differ-ent-sized bleaching spots in both a saturated solution of thefluorescent stain FITC in 100% glycerol, a purely diffusivesystem (Fig. 1a–c), and on GFP-LTI6b-expressing ‘plantcells’ (Fig. 1d–f). In both cases, a linear relation wasobserved when the half-time of fluorescence recovery wasplotted against the area of the bleached spot (Fig. 1g). Thismeans that GFP-LTI6b diffuses without any interactionswhich might limit or increase the rate expected in first-orderdiffusion and is, thus, a good candidate for monitoringmembrane viscosity.
Second, to ascertain that fluorescence recovery is theresult of laterally diffusing protein within the lipid bilayeras opposed to insertion into the membrane within thebleached region via exocytosis, we produced kymograms,that is graphical representations of changing fluorescenceintensity along the line marked in Fig. 1(h) during the timecourse of FRAP experiments (Fig. 1h,i). A triangular shapeis clearly formed during the recovery phase (Fig. 1i) demon-strating that recovery of GFP-LTI6b is the result of lateraldiffusion from the nonbleached area.
NewPhytologist Research 331
� 2011 The Authors
New Phytologist � 2011 New Phytologist Trust
New Phytologist (2011) 192: 328–337
www.newphytologist.com

Finally, to optimize measurement of diffusion, we com-pared two methods of visualizing protein movement:photobleaching and photoactivation. For photoactivation, aphotoactivatable form of GFP (paGFP) was fused toLTI6b. Both dispersion of paGFP-LTI6b fluorescence afterphotoactivation and recovery of GFP-LTI6b fluorescenceafter photobleaching were recorded (cf. Fig. 1f,j) and ana-lyzed to extrapolate relative diffusion coefficients (Fig. 1k).
The standard deviation of the diffusion rate obtained forphotodispersion of paGFP-LTI6b was smaller than that forphotobleaching GFP-LTI6b (Dphotodispersion = 0.20 ± 0.02,Dphotobleaching = 0.18 ± 0.04). Consequently, we usedphotoactivation measurements to estimate membraneviscosity. Since LTI6b is free to diffuse, variation in thediffusion rate is the result of a change in membrane viscos-ity. Consequently, in these experiments, a higher diffusion
(a)
(b)
(c)
(d) (j) (k)
(e)
(f)
(g)
(h)
(i)
Fig. 1 Photobleaching and photoactivation to record membrane viscosity. Comparison of fluorescence recovery after photobleaching (FRAP)experiments with different bleached spot sizes confirms that fluorescence recovery is the result of lateral diffusion. Fluorescein isothiocyanate(FITC) in 100% glycerol (a–c) and GFP-LTI6b in the Arabidopsis thaliana Columbia (Col0) plasma membrane (PM) (d–f). (a) Region of interest(ROI), 13.07 lm2; (b) ROI, 38.43 lm2; (c) ROI, 105.54 lm2; (d) ROI, 15.47 lm2; (e) ROI, 38.22 lm2; (f) ROI, 61.68 lm2. (g) Half-times(t1 ⁄ 2) of fluorescence recovery for FITC (crosses) and GFP-LTI6b (diamonds) experiments increase linearly as the area of bleached spotsincrease, demonstrating that fluorescence recovers by lateral diffusion only (R2 = 0.97 for GFP-LTI6b and R2 = 0.99 for FITC). (h, i)Kymogaphic analysis of the time series of GFP-LTI6b bleaching and recovery shown in (e). (h) Pixel fluorescence intensity values weremeasured along the white line and are plotted vs time (i) during bleaching and recovery. The kymogram shows centripetal movement offluorescence within the bleached area. (j) Photoactivation of photoactivatable GFP (paGFP)-LTI6b. The sequence shows the PM beforeactivation, at the moment of activation and 22 s postactivation. (k) Nonlinear regression was used to fit fluorescence intensity dispersion afterphotoactivation; diffusion coefficients for paGFP-LTI6b were derived from these fits.
332 Research
NewPhytologist
� 2011 The Authors
New Phytologist � 2011 New Phytologist Trust
New Phytologist (2011) 192: 328–337
www.newphytologist.com

rate reflects a decrease in PM viscosity, and lower diffusionreflects increased PM viscosity.
Membrane viscosity does not necessarily reflect theexternal temperature
In nature, plants rarely experience constant conditions oftemperature or light. Thus we initially measured PM viscos-ity in A. thaliana (Col0 accession) seedlings grown underwarm : cold cycles in constant light (WC, 27 : 12�C) orunder light : dark cycles (LD, 12 : 12 h) at a constant20�C. Averaged over 24h, the PM was more viscous (i.e.lower paGFP-LTI6b diffusion rate) in WC cycles than inLD cycles (P < 0.05; Fig. 2a). Therefore, we compared PMviscosity between light and dark under LD conditions at aconstant 20�C, and between warm and cold under WCconditions at constant light. Diffusion during the warmportion of the WC cycles differs from that during the coldportion of the cycle, while no difference was recordedbetween light and dark conditions (two-tailed t-test,P < 0.01; Figs 2b,c, S1). Surprisingly, however, we foundthe PM was more viscous during the warm portion of atemperature cycle (Fig. 2b). As this result contradicts earlierreports of decreased viscosity at higher temperatures (e.g.Vaultier et al., 2006), we repeated the experiment usingplants grown under constant light and temperature condi-tions. In this case PM viscosity was indeed lower in plantsgrown at 27�C than at 12�C (two-tailed t-test, P < 0.01;Fig. 2d). Thus PM viscosity reflects ambient temperatureonly under constant-temperature conditions. Takentogether, these results demonstrate that membrane viscosityis not a direct reflection of external temperature but is sub-ject to homeostatic regulation by an unknown mechanism.
The proportion of desaturated fatty acid increasesduring the cold phase of a temperature cycle
Membrane viscosity changes can be achieved by adjustingthe proportion of desaturated fatty acids – a relatively greateramount of desaturated fatty acids equates to decreased vis-cosity. The degree of polydesaturation varies with growthtemperature; as a general rule, it decreases as temperatureincreases (Marr & Ingraham, 1962; Falcone et al., 2004).Previous studies have been principally concerned withresponses to constant temperature: the effects of regular tem-perature cycles upon lipid composition have not beeninvestigated. Therefore we analyzed fatty acid compositionof plants grown under cyclic conditions (Fig. S2).
There was a significant decrease in the proportion ofpolydesaturated (i.e. 16 : 3 and 18 : 3) fatty acids in plantsgrown in WC cycles relative to those in LD cycles(Fig. 3a–c), consistent with the greater PM viscosityobserved in such plants (Fig. 2a). Closer examinationrevealed a significant decrease in the proportion of polyde-saturated fatty acids during the warm portion of WC cycles(t-test, warm vs cold, P < 0.05; Fig. 3b). This matches themore viscous PM observed at this time (Fig. 2b). By con-trast, the overall proportions of saturated and desaturatedfatty acids did not differ over a LD cycle (t-test, light vsdark, P = 0.06; Fig. 3c), in accordance with more stablePM viscosity in these conditions (Fig. 2c).
Membrane viscosity homeostasis is altered in fad2.2plants
The observation of a higher proportion of desaturated fattyacids at the time of low PM viscosity (Figs 2b, 3b) suggests a
(a) (b)
(d)
(c)Fig. 2 Effect of temperature on plasmamembrane (PM) viscosity (viscosity isinversely proportional to photoactivatableGFP (paGFP)-LTI6b diffusion rate) in wild-type (Col0) Arabidopsis thaliana plants. (a)Mean diffusion rate over 24 h in warm : cold(WC) and light : dark (LD) cycles. WC,27 : 12�C temperature cycles for 12 h eachin constant light; LD, 12 : 12 h light : darkcycles at constant 20�C. (b, c) Meandiffusion rate in opposing parts of WC andLD cycles. Diffusion rate is significantly lower(viscosity higher) during the warm part ofWC cycles. Light or warm: ‘daytime’zeitgeber time (ZT) 3 h, 6 h and 9 h timepoints; dark or cold: ‘night-time’ ZT 15 h,18 h and 21 h time points. (d) Diffusion ratesin constant noncycling temperature conditionsfor plants grown at two temperatures. Plantsgrown at 12�C have significantly reduced PMdiffusion. Mean ± SEM, n ‡ 10; two-tailedt-test, *, P < 0.05; **, P < 0.01.
NewPhytologist Research 333
� 2011 The Authors
New Phytologist � 2011 New Phytologist Trust
New Phytologist (2011) 192: 328–337
www.newphytologist.com

causal connection between the two. To test this, we exam-ined the effect of temperature on PM viscosity in thelinolenic acid-deficient fad2 desaturase ethyl methane-sulfonate (EMS) mutant (Lemieux et al., 1990). Theendoplasmic reticulum (ER)-associated desaturase FAD2catalyzes the desaturation of 18 : 1 fatty acids to 18 : 2(Okuley et al., 1994), thus fad2.2 plants have a higherproportion of saturated and partially desaturated fatty acidsthan wild-type plants (Lemieux et al., 1990; Miquel et al.,1993). We predicted this would produce a more viscous PM.
Consistent with this prediction, the rate of lateral diffu-sion of paGFP-LTI6b within the fad2.2 PM was equivalentat 27 and 12�C (Fig. 4a) and matched the rate of diffusionin wild-type plants at 12�C. Moreover, PM viscosity offad2.2 did not differ across a temperature cycle (t-test:P = 0.65; Figs 4b, S3a), indicating it did not adjust mem-brane properties in response to temperature changes. Thushigh PM viscosity was associated with an increased propor-tion of saturated fatty acids, whether this was achieved bymanipulating temperature or genetic background. Similarto wild-type plants, fad2.2 PM viscosity remained constantduring LD cycles (t-test, P = 0.43; Figs 4c, S3b).Therefore, FAD2-dependent lipid desaturation is essential
for the diurnal homeostasis of membrane viscosity undertemperature cycles.
fad2.2 plants have a partial temperature insensitivityphenotype
fad2.2 plants are impaired in their PM ‘homeoviscosity’.They cannot compensate for the effect of temperature onmembrane viscosity (Fig. 4b). As the PM has beensuggested to play a role in temperature sensing in differentorganisms (Sangwan et al., 2002; Vigh et al., 2005;Cybulski et al., 2010), we wondered if this mutant is cor-rectly responding to temperature. We examined threephysiological outputs known, in wild-type plants, torespond predictably to increased temperature.
Elevated temperature resulted in earlier flowering with areduced number of leaves in wild-type plants growing inLD photoperiods (16 : 8 h at 22 vs 27�C). fad2.2 flowersearlier than Col0 at 22�C under long-day photoperiods(Fig. 5a) and short-day photoperiods (Fig. S4) butshowed no earlier flowering response when grown at 27�Cunder LD conditions. Hypocotyl growth is also clearlyrelated to temperature (Gray et al., 1998). As expected,
(a)
(b) (c)
Fig. 3 (a) Effect of light and temperature cycles on lipid compositionin Columbia (Col0) Arabidopsis thaliana seedlings grown inwarm : cold (WC) and light : dark (LD) cycles. Fatty acids (FA) arecategorized as fully saturated (C16 : 0 or C18 : 0), partiallydesaturated (C16 : 1 or 2, or C18 : 1 or 2), or polydesaturated(C16 : 3 or C18 : 3). Only 18 : 1 FA differed between phases of acycle (Mean ± SEM, n > 10). (two-tailed t-test, light vs dark, *,P < 0.05). (b, c) Ratio of polydesaturated : saturated and partiallysaturated FA in WC and LD cycles (light or warm: ‘daytime’zeitgeber time (ZT) 3 h, 6 h and 9 h time points; dark or cold: ‘night-time’ ZT 15 h, 18 h and 21 h time points). Means ± SEM, n = 5,two-tailed t-test, *, P < 0.05.
(a)
(b) (c)
Fig. 4 Diffusion rate of photoactivatable GFP (paGFP)-LTI6b in theArabidopsis thaliana desaturation mutant, fad2.2. (a) Diffusion ratein Col0 and fad2.2 at 12�C (dark gray bars) and 27�C (pale graybars); two-tailed t-test, 27 vs 12�C, *, P < 0.05. (b, c) Diffusionrates did not differ in fad2.2 in warm and cold or light and dark(light or warm: ‘daytime’ zeitgeber time (ZT) 3 h, 6 h and 9 h timepoints; dark or cold: ‘night-time’ ZT 15 h, 18 h and 21 h timepoints). Mean ± SEM, n ‡ 10.
334 Research
NewPhytologist
� 2011 The Authors
New Phytologist � 2011 New Phytologist Trust
New Phytologist (2011) 192: 328–337
www.newphytologist.com

Col0 had longer hypocotyls when grown at 27�C thanwhen grown at 20�C in constant light, but a similar resultwas observed for fad2.2. In fact, the relative increase inhypocotyl elongation was slightly more for fad2.2 than forCol0 (1.6 times for Col0 and 2.4 times for fad2.2).Finally, we measured the free-running circadian period(FRP) of leaf movement rhythms, a robust measure ofclock behavior. The FRP of the plant clock shortensslightly as ambient temperature increases (Edwards et al.,2005), although circadian clocks are temperature-compen-
sated (Pittendrigh, 1960) across the ambient range. Asexpected, the FRP of wild-type plants was shorter at hightemperature (22.4 h at 27�C vs 26.5 h at 12�C; t-test,P < 0.01; Figs 5b, S4a). However, the FRP of fad2.2 wasthe same at both temperatures (25.8 h at 27�C vs 25.9 hat 12�C; Figs 5b, S4b).
Discussion
For plants, temperature is, with light, one of the major abi-otic stimuli. Indeed, seasonal fluctuation in temperature actsas an input for key physiological processes such as seed germi-nation and floral induction. Understanding how plants senseand respond to temperature is crucial given current trends ofclimate change and the challenges these pose to agricultureand food security (Battisti & Naylor, 2009). In this study, wehave shown a clear correlation among temperature, mem-brane viscosity and fatty acid desaturation. Our conclusion isthat this represents a mechanism whereby plants stabilizemembrane viscosity during temperature variation. Thishomeostasis of membrane viscosity is FAD2-dependent.
LTI6b mobility as a sensor of membrane viscosity
We measured dispersion of paGFP-LTI6b within the PMto monitor membrane viscosity. This small intrinsic proteinhad high mobility (Fig. 1k) which means that the majorityof it is free to diffuse within the PM. To verify that the rateof LTI6b diffusion was not influenced by other cellular fac-tors, we demonstrated that the measured half-time of itsrecovery after photobleaching is correlated with the size ofthe bleaching spot (Fig. 1g) and showed that its recovery iscentripetal from the margins of the bleached region(Fig. 1i). Consequently, the speed of LTI6b diffusion isinversely related to the viscosity of the membrane(Goodwin et al., 2005). Although this technique is an indi-rect measurement of viscosity, it allows us to work directlywith a living multicellular organism and abolishes artifactsinduced by membrane preparation.
Arabidopsis thaliana compensates temperature‘seffect on PM viscosity by altering amounts of fattyacid saturation
Although there are diurnal changes in lipid composition insome plant species, including cotton (Rikin et al., 1993), inArabidopsis the proportion of fatty acids at any given satura-tion differs very little between light and dark or warm andcold parts of a cycle (Fig. 3a) (Ekman et al., 2007), suggest-ing only a minor effect of the diurnal cycle upon lipidcomposition. Our striking observation that the PM hadlower viscosity during the cooler portion of a temperaturecycle makes it clear that alterations in viscosity and lipidcomposition over 24 h do not occur passively in response to
(a)
(b)
(c)
Fig. 5 The Arabidopsis thaliana desaturation mutant fad2.2 hasimpairment in some physiological responses to temperature. (a) Leafnumber at flowering under long-day conditions (LD 16 : 8 h) at22�C (dark gray bars) and 27�C (pale gray bars). fad2.2 mutantsflower early (after only six to seven leaves) irrespective oftemperature whereas Columbia (Col0) plants flower significantlylater in reduced temperatures (leaf numbers, approx. eight at 27�Cvs 12 at 22�C, mean ± SEM, n ‡ 16, two-tailed t-tests, high vs lowtemperature, **, P < 0.01). (b) Hypocotyl length in response totemperature increase in Col0 and fad2.2. Col0 and fad2.2 show astrong increase in hypocotyl length at 27�C (pale gray bars)compared with 20�C (dark gray bars). ** P < 0.01, Mean ± SEM,n > 70. (c) Free-running period (FRP) of leaf movement circadianrhythms under constant light at two temperatures, 12�C (dark graybars) and 27�C (pale gray bars). Col0 and fad2.2 mutants have along FRP (c. 26 h) at low temperature. This was significantlyshortened to 22.4 h in Col0 plants grown at 27�C, but fad2.2 plantsdid not respond to the increased temperature. Mean ± SEM, n ‡ 8,two-tailed t-tests, high vs low temperature in Col0, **, P < 0.01.
NewPhytologist Research 335
� 2011 The Authors
New Phytologist � 2011 New Phytologist Trust
New Phytologist (2011) 192: 328–337
www.newphytologist.com

changes in external temperature. Our data suggest thatplants counteract the direct effects of temperature cycles onmembrane viscosity by altering the relative proportion ofdesaturated fatty acids within the membrane. That this phe-nomenon results specifically from changes in externaltemperature, not from a rhythmic environment per se, is evi-dent from the constant state of lipid composition and PMviscosity in plants maintained in LD cycles (Figs 2b, 3b).
fad2.2 plants are not able to regulate PM viscosity ineither temperature cycles or under constant temperature(Fig. 4a,b). Consequently, the fatty acid desaturation mech-anism, and especially synthesis of highly desaturated fattyacids (18 : 2 and 18 : 3), seems to be important for theregulation of membrane viscosity. fad2.2 mutants areparticularly sensitive to low temperature, suffering chroniccell damage and death when held at 6�C, a temperaturewild-type plants easily withstand (Miquel et al., 1993).fad2.2 germination is also impaired at low temperature butis indistinguishable from wild-type plants at 20�C (Miquel& Browse, 1994). Mutations in chloroplast-localized desat-urases alter thermal tolerance (Kunst et al., 1988; Kodamaet al., 1995; Zhang et al., 2005; and see Larkindale et al.,2005) and thus the plastid may be partially responsible formaintaining membrane fluidity (Penfield, 2008).Interestingly, it has recently been shown that the rate ofturnover of the FAD3 protein is temperature-sensitive(O’Quin et al., 2010). The half-life of the protein is muchlonger in cold conditions, probably leading to an accumula-tion of polydesaturated fatty acids and consequently a lessviscous membrane to compensate for the temperatureeffect. In conclusion, the fatty acid desaturation pathwayseems to be important for maintaining a homeostasis of PMfluidity during daily temperature cycles.
Is there a link between membrane viscosity, the FADpathway and temperature sensing?
Fatty acid synthesis mutants of Neurospora crassa have along-period circadian phenotype and ⁄ or defective tempera-ture compensation (Lakin-Thomas & Brody, 2000; Ruoff& Slewa, 2002). In Arabidopsis, mutation of FAD2 meansthat the free-running period of leaf movement does notshorten as it does in wild-type plants when grown at 27�C(Fig. 5c). The invariant FRP of fad2.2 grown at differenttemperatures suggests some impairment of the temperatureresponse mechanism in these plants. This result implies agenetic link between fad2.2 and circadian rhythm.Alternately, fad2.2 flowering time and hypocotyl growthdata do not show clear impairment of the temperatureresponse mechanism (Fig. 5a,b). Consequently, it is diffi-cult to conclude a clear temperature insensitivity of fad2.2.It is most likely that several mechanisms interact to ensureaccurate temperature sensing by plants. For instance, occu-pancy of the histone variant H2A.Z in nucleosomes is
temperature-sensitive; it drives gene expression and isinvolved in ambient temperature sensing (Kumar & Wigge,2010). Further work will be required to determine whetherthe change in membrane viscosity could be an input fortemperature sensing or if it is only a temperature outputvia the ‘homeoviscosity’ of the PM. In any case, it seemssensible to conclude that homeostasis of PM viscosityis important for all of the membrane processes, such assignaling and secretion, that require association of proteins.
Acknowledgements
We are grateful to Marc Knight for providing seed for thefad2.2 mutants and Andrew Millar and the IMPS(University of Edinburgh) for access to the leaf imagingsystem. We would like to thank Andrew Smith, Liam Dolanand Marc Knight for helpful discussions on the manuscriptand Pauline White for expert technical assistance. J.R. andA.M. are funded by BBSRC grant number BB ⁄ F01407 ⁄ 1.SP and HGM are Royal Society University Research Fellows.
References
Axelrod D, Koppel DE, Schlessinger J, Elson E, Webb WW. 1976.
Mobility measurement by analysis of fluorescence photobleaching
recovery kinetics. Biophysical Journal 16: 1055–1069.
Battisti DS, Naylor RL. 2009. Historical warnings of future food
insecurity with unprecedented seasonal heat. Science 323: 240–244.
Brown PE. 2004. BRASS – biological rhythms analysis software systemversion 1.3.1. URL http://template.bio.warwick.ac.uk/staff/amillar/
PEBrown/BRASS/BrassPage.htm.
Burgos A, Szymanski J, Seiwert B, Degenkolbe T, Hannah MA,
Giavalisco P, Willmitzer L. 2011. Analysis of short-term changes in the
Arabidopsis thaliana glycerolipidome in response to temperature and
light. Plant Journal 66: 656–668.
Cutler SR, Ehrhardt DW, Griffitts JS, Somerville CR. 2000. Random
GFP::cDNA fusions enable visualization of subcellular structures in cells
of Arabidopsis at a high frequency. Proceedings of the National Academyof Sciences, USA 97: 3718–3723.
Cybulski LE, Martin M, Mansilla MC, Fernandez A, de Mendoza D.
2010. Membrane thickness cue for cold sensing in a bacterium. CurrentBiology 20: 1539–1544.
Edwards KD, Lynn JR, Gyula P, Nagy F, Millar AJ. 2005. Natural allelic
variation in the temperature-compensation mechanisms of the
Arabidopsis thaliana circadian clock. Genetics 170: 387–400.
Ekman A, Bulow L, Stymne S. 2007. Elevated atmospheric CO2
concentration and diurnal cycle induce changes in lipid composition in
Arabidopsis thaliana. New Phytologist 174: 591–599.
Falcone DL, Ogas JP, Somerville CR. 2004. Regulation of membrane
fatty acid composition by temperature in mutants of Arabidopsis
with alterations in membrane lipid composition. BMC Plant Biology4: 17.
Goodwin JS, Drake KR, Remmert CL, Kenworthy AK. 2005. Ras
diffusion is sensitive to plasma membrane viscosity. Biophysical Journal89: 1398–1410.
Gray WM, Ostin A, Sandberg G, Romano CP, Estelle M. 1998. High
temperature promotes auxin-mediated hypocotyl elongation in
Arabidopsis. Proceedings of the National Academy of Sciences, USA 95:
7197–7202.
336 Research
NewPhytologist
� 2011 The Authors
New Phytologist � 2011 New Phytologist Trust
New Phytologist (2011) 192: 328–337
www.newphytologist.com

Johnson ML, Frasier SG. 1985. Nonlinear least squares analysis. Methodsin Enzymology 117: 301–342.
Kodama H, Horiguchi G, Nishiuchi T, Nishimura M, Iba K. 1995. Fatty
acid desaturation during chilling acclimation is one of the factors
involved in conferring low-temperature tolerance to young tobacco
leaves. Plant Physiology 107: 1177–1185.
Kumar SV, Wigge PA. 2010. H2A.Z-containing nucleosomes mediate the
thermosensory response in Arabidopsis. Cell 140: 136–147.
Kunst L, Browse J, Somerville C. 1988. Altered regulation of lipid
biosynthesis in a mutant of Arabidopsis deficient in chloroplast glycerol-
3-phosphate acyltransferase activity. Proceedings of the National Academyof Sciences, USA 85: 4143–4147.
Kurup S, Runions J, Kohler U, Laplaze L, Hodge S, Haseloff J. 2005.
Marking cell lineages in living tissues. Plant Journal 42: 444–453.
Lakin-Thomas PL, Brody S. 2000. Circadian rhythms in Neurosporacrassa: lipid deficiencies restore robust rhythmicity to null frequency and
white-collar mutants. Proceedings of the National Academy of Sciences,USA 97: 256–261.
Larkindale J, Hall JD, Knight MR, Vierling E. 2005. Heat stress
phenotypes of Arabidopsis mutants implicate multiple signaling
pathways in the acquisition of thermotolerance. Plant Physiology 138:
882–897.
Larson TR, Graham IA. 2001. Technical advance: a novel technique for
the sensitive quantification of acyl CoA esters from plant tissues. PlantJournal 25: 115–125.
Lemieux B, Miquel M, Somerville C, Browse J. 1990. Mutants of
Arabidopsis with alterations in seed lipid fatty acid composition.
Theoretical and Applied Genetics 80: 234–240.
Marr AG, Ingraham JL. 1962. Effect of temperature on the composition
of fatty acids in Escherichia coli. Journal of Bacteriology 84: 1260–1267.
Miquel MF, Browse JA. 1994. High-oleate oilseeds fail to develop at low
temperature. Plant Physiology 106: 421–427.
Miquel M, James D Jr, Dooner H, Browse J. 1993. Arabidopsis requires
polyunsaturated lipids for low-temperature survival. Proceedings of theNational Academy of Sciences, USA 90: 6208–6212.
Okuley J, Lightner J, Feldmann K, Yadav N, Lark E, Browse J. 1994.
Arabidopsis FAD2 gene encodes the enzyme that is essential for
polyunsaturated lipid synthesis. Plant Cell 6: 147–158.
O’Quin JB, Bourassa L, Zhang D, Shockey JM, Gidda SK, Fosnot S,
Chapman KD, Mullen RT, Dyer JM. 2010. Temperature-sensitive
post-translational regulation of plant omega-3 fatty-acid desaturases is
mediated by the endoplasmic reticulum-associated degradation pathway.
Journal of Biological Chemistry 285: 21781–21796.
Penfield S. 2008. Temperature perception and signal transduction in
plants. New Phytologist 179: 615–628.
Pittendrigh CS. 1960. Circadian rhythms and the circadian organization
of living systems. Cold Spring Harbor Symposia on Quantitative Biology25: 159–184.
Plautz JD, Straume M, Stanewsky R, Jamison CF, Brandes C, Dowse
HB, Hall JC, Kay SA. 1997. Quantitative analysis of Drosophila periodgene transcription in living animals. Journal of Biological Rhythms 12:
204–217.
Rikin A, Dillwith JW, Bergman DK. 1993. Correlation between the
circadian-rhythm of resistance to extreme temperatures and changes in
fatty-acid composition in cotton seedlings. Plant physiology 101: 31–36.
Runions J, Brach T, Kuhner S, Hawes C. 2006. Photoactivation of GFP
reveals protein dynamics within the endoplasmic reticulum membrane.
Journal of Experimental Botany 57: 43–50.
Ruoff P, Slewa I. 2002. Circadian period lengths of lipid synthesis
mutants (cel, chol-1) of Neurospora show defective temperature,
but intact pH-compensation. Chronobiology International 19:
517–529.
Sangwan V, Orvar BL, Beyerly J, Hirt H, Dhindsa RS. 2002.
Opposite changes in membrane fluidity mimic cold and heat stress
activation of distinct plant MAP kinase pathways. Plant Journal 31:
629–638.
Singer SJ, Nicolson GL. 1972. The fluid mosaic model of the structure of
cell membranes. Science 175: 720–731.
Sprague BL, McNally JG. 2005. FRAP analysis of binding: proper and
fitting. Trends in Cell Biology 15: 84–91.
Straume M, Frasier-Cadoret SG, Johnson ML. 1991. Least squares
analysis of fluorescence data. In: Lakowicz JR, ed. Topics in fluorescencespectroscopy. New York, NY, USA: Plenum, 117–240.
Vaultier MN, Cantrel C, Vergnolle C, Justin AM, Demandre C,
Benhassaine-Kesri G, Cicek D, Zachowski A, Ruelland E. 2006.
Desaturase mutants reveal that membrane rigidification acts as a cold
perception mechanism upstream of the diacylglycerol kinase pathway in
Arabidopsis cells. FEBS Letters 580: 4218–4223.
Vigh L, Escriba PV, Sonnleitner A, Sonnleitner M, Piotto S, Maresca B,
Horvath I, Harwood JL. 2005. The significance of lipid composition
for membrane activity: new concepts and ways of assessing function.
Progress in Lipid Research 44: 303–344.
Zhang M, Barg R, Yin M, Gueta-Dahan Y, Leikin-Frenkel A, Salts Y,
Shabtai S, Ben-Hayyim G. 2005. Modulated fatty acid desaturation via
overexpression of two distinct omega-3 desaturases differentially alters
tolerance to various abiotic stresses in transgenic tobacco cells and
plants. Plant Journal 44: 361–371.
Zhang X, Henriques R, Lin SS, Niu QW, Chua NH. 2006.
Agrobacterium-mediated transformation of Arabidopsis thaliana using the
floral dip method. Nature Protocols 1: 641–646.
Supporting Information
Additional supporting information may be found in theonline version of this article.
Fig. S1 Lateral diffusion of paGFP-LTI6b within theplasma membrane of Col0 seedlings over 24 h.
Fig. S2 Effect of light and temperature cycles on fatty acidcomposition of Col0 seedlings over 24 h.
Fig. S3 Lateral diffusion of paGFP-LTI6b within theplasma membrane of fad2.2 seedlings over 24 h.
Fig. S4 Leaf number at flowering in short days (LD8 : 16 h).
Fig. S5 Plots of circadian free running period (FRP) of leafmovement rhythms vs relative amplitude error (RAE).
Please note: Wiley-Blackwell are not responsible for thecontent or functionality of any supporting informationsupplied by the authors. Any queries (other than missingmaterial) should be directed to the New Phytologist CentralOffice.
NewPhytologist Research 337
� 2011 The Authors
New Phytologist � 2011 New Phytologist Trust
New Phytologist (2011) 192: 328–337
www.newphytologist.com