the R-134a does 190 kJ of work against the piston during the ...
Upload
khangminh22Category
view
4download
0
1
Dynamic Viscosity for HFC-134a + Polyether mixtures up to 373.15 K and
140 MPa at low polyether concentration. Measurements and Modelling.
María J.P. Comuñasa,b*, Antoine Baylaucqb, Christian Bonedb and Josefa Fernándeza
aLaboratorio de Propiedades Termofísicas, Departamento de Física Aplicada, Facultad de Física,
Universidad de Santiago de Compostela, E-15782 Santiago de Compostela, Spain. bLaboratoire des Fluides Complexes, Faculté des Sciences, BP 1155, F-64013, Pau Cedex, France.
*To whom correspondence should be addressed, Laboratorio de Propiedades Termofisicas,
Departamento de Fisica Aplicada, Facultad de Fisica, Universidad de Santiago de Compostela, E-15782
Santiago de Compostela, Spain, email: [email protected], Fax number 34981520676.

2
Abstract:
This paper reports viscosity data for mixtures containing a refrigerant (HFC-134a)
and a lubricant (triethylene glycol dimethyether, TriEGDME or tetraethylene
glycol dimethylether, TEGDME), at 12% mass fraction of TriEGDME and 14%
of TEGDME respectively. The measurements (140 data points) have been carried
out versus pressure (between 10 and 140 MPa) in the monophasic liquid state
from 293.15 to 373.15 K. Due to the fact that at normal pressure and temperature
the HFC-134a and the polyethers are not in the same single phase (the refrigerant
is a gas whereas the polyethers are liquids) accurate measurements of their
mixtures require specific procedures for the samples preparation and the filling of
the apparatus. A specially designed isobaric transfer falling-body viscometer is
used in this work. The viscosity of the mixtures is in average 40% higher than that
of the pure refrigerant, and this increase is more noticeable at low temperatures.
The experimental viscosities have been used in order to check the predictive and
correlation ability of several viscosity models (mixing rules, Geller and Davis
method, self referencing model, hard sphere theory, free volume model and
friction-theory). Most of the studied models under estimate dynamic viscosity
values over all the temperature and pressure ranges.
Keywords: HFC-134a, high pressure, modelling, polyethers, refrigerant,
lubricants, mixtures, viscosity, measurements

3
Introduction
The number of works concerning the dynamic viscosity of refrigerant + lubricant
mixtures has increased in the last years. Most of them involved experimental and
theoretical studies on mixtures containing POEs (Polyol Esters). For example, Geller et
al. 1-3 have reported the experimental viscosity of binary HFCs + commercial POEs
mixtures in the temperature interval 253.15-393.15 K, and from the saturation pressure
up to 5 MPa for lubricant mass concentration between 0.25 to 1. The same kind of
systems have been studied by Jonsson and Lijle4 with a falling ball viscometer between
313.15 and 353.15 K, up to 34 MPa, over all the composition range. The dynamic
viscosity for HFCs + Pentaerythritol Esters systems has been measured by Thébault and
Vamling5 and by Wahlström and Vamling6 with a capillary viscometer under saturation
pressure. In the first paper the viscosities are reported in the temperature interval 300-
350 K and over the refrigerant mass concentration from 0 to 30%, and in the later from
300 to 333 K and up to 22% of refrigerant. Cavestri and Schafer7 have determined the
viscosity for HFC-410A + commercial POE mixtures, from 258.15 to 378.15 K at the
saturation pressure.
Besides, works analysing the refrigerant + PAGs (polyalkylene glycols) systems are
less frequent. There are only in the literature two articles of Kumagai et al.8, 9 reporting
data of HFC-134a with ethyleneglycol, diethylene glycol, triethylene glycol,
tetraethylene glycol and two polyethylene glycols from 273.15 to 333.15 K at the
saturation pressure. It is interesting to notice that for all the above mentioned articles the
maximum pressure is 34 MPa. Until now, to our knowledge, there are no experimental
viscosity data in the literature of HFC-134a + polyalkylene glycol dimethylether
mixtures. In the present work the first experimental dynamic viscosity values for HFC-

4
134a + TEGDME and for HFC-134a + TriEGDME at low lubricant concentration (12%
mass fraction of TriEGDME and 14% of TEGDME) are reported. The mixtures with
low content in lubricant are of high interest in engineering, because in vapour
compression refrigeration and heat pump systems a small amount of compressor
lubricant, as a part of the working fluid, is circulating with the refrigerant10. The
working fluid is changed from a pure refrigerant, with well defined properties, to a
mixture with properties that are poorly understood and dependent on the lubricant
concentration. The migrated oil affects the heat transfer coefficient, which is an
important characteristic of any working fluid, changing the evaporator pressure drop
and degrading the performance of both the condenser and evaporator. The knowledge of
these effects is needed in the final election of the appropriate refrigerant + lubricant
pair, this is the reason why these types of mixtures have been studied in several
publications11-14. The change of the heat transfer coefficients, due to the presence of
lubricant, is depending of the lubricant’s type (POEs, mineral oils, PAGs or others) and
of the lubricant concentration, as Sundaresan et al. 15 have suggested. For refrigerant +
POE mixtures Geller and Davis2 have demonstrated that their coefficients are about
50% higher than those found for refrigerant + mineral oil mixtures.
The heat transfer coefficients are related to the conduction, convection and
radiation processes, which sometimes are expressed as the Nusselt or Prandtl
parameters16. The Reynolds number is also important to determine if the flow is laminar
or turbulent. In order to calculate these factors, the dynamic viscosity and the density
are needed. The oil viscosity has also another important effect on the evaporator
performance at low lubricant concentrations, as suggested by McMullan et al. 10. Their
results indicate that the degradation of the performance of the evaporator can be

5
minimized by selecting a low viscosity oil if the oil fraction is small, whereas the
lubricant should have a high viscosity if the oil concentration is high.
For all these reasons the experimental viscosity data for refrigerant + lubricant
mixtures at low lubricant concentration are very interesting from an industrial point of
view. The experimental viscosity data (140 points) reported in this work for HFC-134a
+ TriEGDME and HFC-134a + TEGDME mixtures for 12% and 14% polyether mass
fraction (or 0.9295 and 0.9290 refrigerant mole fraction) respectively, and over the
temperature interval of 293.15 - 373.15 K, have been extended up to high pressures (up
to 140 MPa) which is more of a fundamental interest than an industrial one. The
experimental viscosities have then been used in order to check the ability of different
mixing rules17, 18 and of several viscosity models (Geller and Davis method1, self
referencing model19, hard sphere theory20-22, free volume model23, 24 and friction-
theory25, 26) for viscosity prediction and correlation of refrigerant + lubricant mixtures.
Experimental Techniques
Materials. HFC-134a (molar mass 102.03 g⋅mol-1) was obtained from Gazechim Froid
with a purity of 99.94% and with water content not more than 24 ppm. The polyethers,
TriEGDME (molar mass 178.23 g⋅mol-1) and TEGDME (molar mass 222.28 g⋅mol-1)
were obtained from Aldrich with chemical purity better than 99%.
Presentation of the falling-body viscometer. Because the lubricant and refrigerant are
in two different thermodynamic states at atmospheric pressure and ambient temperature,
accurate measurements of their mixtures require specific procedures for the samples
preparation and the filling of the different apparatus used during this work. The
mixtures are prepared in a high-pressure variable-volume cell, containing a stainless-

6
steel ball (in order to agitate and homogenize the mixture) and equipped with a piston in
order to isolate the lubricant/refrigerant mixture from the pressurizing fluid (oil). This
high-pressure cell is pressurised up to a pressure higher than the saturation pressure to
ensure that the mixture is in a single-phase and is homogeneous.
The dynamic viscosity has been determined with the aid of a specially designed
isobaric transfer falling-ball viscometer. A detailed description of the experimental
equipment has been presented in a previous work27, in which the dynamic viscosity for
methane + decane mixtures has been measured. In this apparatus, a stainless-steel
cylinder falls through a fluid of unknown viscosity under selected conditions of
temperature and pressure. The viscosity is a function of the falling time (Δt), of the
density of both the cylinder, ρc, and the fluid, ρl, and of the apparatus parameters (a, b
and c), according to the following working equation:
c)t(b)t(a 2 +ΔρΔ+ΔρΔ=η (1)
where Δρ= ρc-ρl. In order to determine the calibration constants in eq. 1, measurements
of the falling time for reference substances, with known viscosity and density values,
under similar ranges of tΔρΔ at the same pressure and temperature conditions are
required. For each fluid the measurements of the falling time was repeated six times at
thermal and mechanical equilibrium, and it is reproducible to better than 1%. The final
values are the average of these measurements. The temperature is measured (with an
AOIP system) with an accuracy of ± 0.5 K and the pressure (with an HBM-P3M
manometer) with an accuracy within ± 0.2 MPa.
Calibration of the falling-body viscometer. In this work, toluene, propane, pentane and
heptane have been chosen as reference fluids in order to determine the calibration

7
parameters (a, b, and c). The falling time has been measured for these four compounds
between 293.15 to 373.15 K in steps of 20 K and from 10 to 140 MPa in 10 MPa
intervals. The density and viscosity for the reference fluids, over these temperature and
pressure intervals, are needed in eq. 1. Concerning the density, we have used the values
reported by Vogel et al. 28 for propane and the Tait-like correlations reported by Cibulka
et al. 29-31 for toluene, pentane and heptane. For viscosity, values interpolated from
published experimental data of propane28, pentane32-34, heptane35, 36 and toluene22, 37
have been used. The uncertainty and the temperature and pressure intervals for the
literature viscosity values, used in the calibration, are presented in Table 1. The
apparatus parameters, a, b, and c are determined by plotting the reference values of η
versus tΔρΔ for each temperature. In order to verify the calibration, the dynamic
viscosity of hexane has been measured for 313.15 and 333.15 K and from 10 to 140
MPa. The viscosity values obtained for hexane by using this calibration agree with the
literature values published by Oliveira and Wakeham33 within an average absolute
deviation of 0.4% and a maximum deviation of 1.3%. In the following this calibration
method is mentioned as method (I).
However, important discrepancies were sometimes found, between different
reported viscosity measurements for the reference fluids38
. Therefore, in order to
minimize the viscosity uncertainty of our viscosity measurements, in addition to the
previous method (I) two other calibration methods were used: estimated viscosity values
of the reference fluids are calculated with the Hard Spheres model by Assael et al. 20, 22
(calibration method mentioned as HS) and also with the one-parameter friction theory
model by Quiñones-Cisneros et al. 25, 26 (calibration method mentioned as FT). These

8
methods have also been applied in a recent work concerning the dynamic viscosity of
pure HFC-134a38
.
As a result, up to three different viscosity estimations, for each one of the
reference sets of viscosities (I, HS and FT), are derived for each measured temperature
and pressure. One calibration curve was made for each measured temperature and
pressure and for each one of the three sets of reference viscosities. The final
experimental values for viscosity are the average value of those obtained with the three
methods. Taking into account that the fundamental contribution to the viscosity
uncertainty is the accuracy of the calibration data, we have previously38 estimated an
accuracy of ± 2% for the 293.15, 313.15 and 333.15 K isotherms, ± 3% for the 353.15
K isotherm and ± 4% for the 373.15 K.
The viscosity of hexane has also been determined, by using for viscometer
calibration these last two methods, HS and FT. The deviations obtained between the
experimental data33 and the values determined using the three calibrations methods, are
plotted against the pressure in Figure 1. The experimental values obtained for hexane
using the FT method are slightly higher than those determined with the HS method, but
the average absolute deviation and the maximum deviation between both data sets are
only 1.2% and 2%, respectively. Our viscosity values for hexane with the HS method,
agree with the experimental values reported by Oliveira and Wakeham33 within an
average deviation of 2%, a Bias of –1% and a maximum deviation of 4.2%. Whereas
with the FT method these deviations are 2%, -0.2% and 5%, respectively. In both cases
⎢Bias ⎢<AAD, i.e. there are some values which are higher than those reported by
Oliveira and Wakeham, and others which are lower.

9
In order to determine the dynamic viscosities of HFC-134a + polyether mixtures
the three calibration methods have been used and, as already mentioned, the final values
were the average of the three viscosity values. For this purpose the hexane has been
included as reference fluid in addition to propane, pentane, heptane, and toluene.
Density measurements. In order to determine the viscosity in eq. 1 it is also necessary
to know the density of the mixtures. The principle of measurement, the apparatus
(Anton Paar DMA60/512P vibrating tube densimeter) and the experimental procedure
for the density determination are described in details in our previous work concerning
the pVT data of HFC-134a + TriEGDME39
and HFC-134a + TEGDME40 mixtures
between 293.15 K and 373.15 K and from 10 MPa to 60 MPa.
Experimental results
Measurements of the dynamic viscosity, η, of HFC-134a + polyether mixtures have
been carried out versus pressure (between 10 and 140 MPa in 10 MPa intervals) in the
monophasic liquid state from 293.15 to 373.15 K in steps of 20 K. In order to determine
the viscosities, the densities for these binary systems are needed in the Δρ �term of eq.
1. The experimental densities for HFC-134a + TriEGDME and for HFC-134a +
TEGDME mixtures have already been presented in previous works39, 40 from 10 to 60
MPa between 293.15 and 373.15 K with an uncertainty lower than 2⋅10-4 g⋅cm-3. At
pressures higher than 60 MPa and up to 140 MPa, the density values have been
extrapolated with the procedure previously described by Et-Tahir et al. 41 using a Tait-
like equation for the representation of density versus pressure.

10
The density values have been compared with the one generated by using the
Patel-Teja equation of state with a quadratic mixing rule. The experimental data (up to
60 MPa) and the predicted values with the Patel-Teja equation of state (EoS) are
reported in Table 2. The predicted densities up to 60 MPa are in good agreement with
the experimental density values for HFC-134a + TriEGDME and HFC-134a +
TEGDME. Specifically, average absolute deviations of 2.5% and 2.1% were found, in
the entire composition range, between the experimental and the predicted densities for
the systems containing TriEGDME and TEGDME respectively. The Tait-extrapolated
data from the experimental densities and the predicted values with the Patel-Teja EoS
from 60 to 140 MPa are also reported in Table 2. It can be noticed that always ρPT >
ρlab, (ρlab is both the experimental data and the Tait-extrapolated ones). At pressures
higher than 60 MPa the average absolute deviations between both, the Tait-extrapolated
and the predicted values, are 1.9% for the binary mixture with TriEGDME and 1.5% for
that containing TEGDME. The differences found between the different ways used in
density determination, are not very important in viscosity determination, as an error of
1% on the density of the fluid leads27 to a relative error of 0.2% on the viscosity, i.e.
lower that the experimental uncertainty of the falling body viscometer, used in this
study. In this work we have used the Tait-extrapolated values from the experimental
densities but it is interesting to notice that it was also possible to use the density values
predicted with an EoS. Nevertheless, it is necessary to choose an appropriate EoS that
gives good volumetric predictions. For example, if the Soave Redlich-Kwong (SRK)
EoS is used for density prediction of HFC-134a +polyether mixtures, an average
absolute deviation of 15% is observed.

11
The viscosity values obtained for HFC-134a + TriEGDME and HFC-134 +
TEGDME mixtures are presented in Table 3 are plotted against the pressure over the
entire temperature interval in Figure 2. It can be seen in this figure that the values
obtained with the three methods are in good agreement, only some discrepancies appear
in the region where no experimental data are available for the reference fluids (over the
373.15 K isotherm).
In Figure 3, the dynamic viscosity for these mixtures are compared with the
viscosity values of pure TriEGDME, TEGDME and HFC-134a determined in previous
works38, 42 over the pressure interval of 20 to 100 MPa and from 293.15 to 353.15 K. In
this figure the dynamic viscosity are plotted against the temperature and the pressure in
a 3D diagram (Tpη) with the same scale. The refrigerant viscosity is typically 2-3
orders of magnitude smaller than that of the lubricant. The viscosity of the mixtures is
in average 40% higher than that of the pure refrigerant, and this increase is more
noticeable at lower temperatures.
High Pressure Viscosity Modelling
In order to predict the dynamic viscosities for HFC-134a + polyether mixtures we have
used some models that only involve the viscosity data of the pure compounds of the
mixture. For pure HFC-134a the experimental viscosity values between 293.15 and
373.15 K and from 10 to 140 MPa have been taken from a previous work38. For
TriEGDME and TEGDME the values already measured42 between 293.15 and 353.15 K
and from 0.1 to 100 MPa in steps of 20 K have been used. Taking into account the
temperature and pressure intervals for which the viscosity of pure compounds is known,

12
in this work the ability of these models in the temperature interval of 293.15 – 353.15 K
and over the pressure range of 20 to 100 MPa has been analyzed.
In order to assess and compare the performances of various models it is
necessary to introduce quantities characteristic of the results obtained. We have used the
Absolute Average percentual Deviation (AAD), the Maximum percentual Deviation
(DMAX), and the Average percentual Deviation (Bias) which are defined as follows:
∑= φ
φ−φ=
n
1iexpi
cali
expi
N100AAD
⎟⎟⎟
⎠
⎞
⎜⎜⎜
⎝
⎛
φ
φ−φ=
expi
cali
expi100MaxDMAX
∑= φ
φ−φ=
n
1iexpi
cali
expi
N100Bias
where φiexp and φi
cal are, respectively, the experimental and the calculated values, and n
is the total number of points.
Mixing Rules. In order to model the properties of the mixtures it is essential to consider
the use of several mixing rules. There are different mixing rules but in this work only
some simple ones are tested in order to analyse the possibility to estimate the viscosity
of HFC-134a + polyether mixtures with the knowledge only of the viscosities of pure
substances and their mole fraction (or composition). We will then focus only on three
mixing rules without any adjustable parameter so they can be considered as predictive,
and on a mixing rule that involves one adjustable parameter, i.e. a correlation mixing
rule.
The first mixing rule used has the following form for a n-compounds mixture:

13
in
1iim lnxln ν=ν ∑
= (2)
where νm and νi are respectively the kinematic viscosities of mixture and of pure
compounds, and xi is the mole fraction of compound i. Geller and Davis1 have utilized
this mixing rule in order to predict the viscosity for refrigerant + POE lubricant
mixtures. These authors have found that this method is more appropriate for high
temperatures. Thus, the lower the temperature, the greater the deviations between
experimental data and calculated values using eq. 2.
For HFC-134a + TriEGDME mixtures (with 12% mass fraction or 0.0705 mole
fraction of TriEGDME) we have obtained an AAD of 19.5 %, a Bias of 19.5% and a
DMAX of 24.4% between the calculated values of dynamic viscosity and the
experimental ones of Table 3. These deviations are respectively 18.4%, 18.4% and
22.3% for HFC-134a + TEGDME system (with 14% mass fraction or 0.0710 mole
fraction of TEGDME). With this mixing rule the calculated values are always lower
than the experimental data (AAD=Bias).
The mixing rule proposed by Katti-Chaudhri17
has also been used for viscosity
prediction. This mixing rule has the following form for a n-compounds mixture:
iin
1iimm vlnxvln η=η ∑
= (3)
where vm and vi are respectively the molar volumes of the mixture and of the pure
compounds. The dynamic viscosity values calculated with this mixing rule have been
compared with the experimental data of Table 3 for HFC-134a + TriEGDME mixture
and an AAD of 20.4%, a Bias of 20.4% and a DMAX of 25.3% have been obtained.

14
These deviations are respectively 20.4%, 20.4% and 24.2% for HFC-134a + TEGDME
mixture.
Finally we have used a mixing rule proposed by Grunberg-Nissan18 that includes
one adjustable parameter, d12, that reflects the interactive effects. This mixing rule has
the following expression for a binary mixture:
1221i2
1iim dxxlnxln +η=η ∑
= (4)
If we analyse the predictive capability of this mixing rule by taking d12=0 an AAD of
18.5%, a Bias of 18.5% and a DMAX of 22.9% are found for HFC-134a + TriEGDME
mixture and for the system containing TEGDME these values are 17.0%, 17.0% and
20.2% respectively. With d12≠0 the obtained results with this mixing rule are better but
in this case, the method is not predictive any longer. By minimizing the average
absolute deviation between the calculated and the experimental data of Table 3 for
HFC-134a + polyether mixtures, we have obtained the following values for the
adjustable parameter: d12=1.0547 for the mixture that contains TriEGDME and
d12=1.0129 for the HFC-134a + TEGDME system. For the first mixture, the AAD is
6.3%, the Bias 2.3% and DMAX 14.4%. For the second one, these values are,
respectively, 4.6%, -1.7% and 12.1%.
Geller and Davis1 prediction method. These authors have applied a simple method for
viscosity prediction in which the viscosity is related to the molar volume of the fluid by
( )0
0V
VVB1 −=
η (5)
where V is the molar volume, B a coefficient and V0 is a hypothetical molar volume
corresponding to the disappearance of the molecular transport (lim 1/η→0). One of the

15
most successful applications of this model to liquid mixtures was described by Liu and
Wang43, who obtained an average absolute deviation less than 4% for 60 binary
mixtures containing polar and nonpolar compounds. Once calculated B and V0
parameters for pure compounds these authors have used the following mixing rules:
i0n
1iim0 VxV ∑
== (6)
in
1iim BlnqBln ∑
== (7)
where the subscripts m and i denote quantities for the mixture and the pure components
respectively, xi is the mole fraction of component i, and qi= xiVi/Vm. Geller and Davis1
have utilized this model for HFC-134a + commercial POE mixtures obtaining a root
mean square deviation of 15% and a maximum deviation of 30% between the calculated
values and the experimental data. The HFC-32 + commercial POE systems have been
studied by the same authors2 obtaining in this case an AAD of 7% and a DMAX of
20%. This method has been used by Geller and Davis1 to calculate viscosity of
refrigerant + POE mixtures at small oil concentrations in order to estimate the effect of
different lubricants on the heat transfer coefficients during the evaporation.
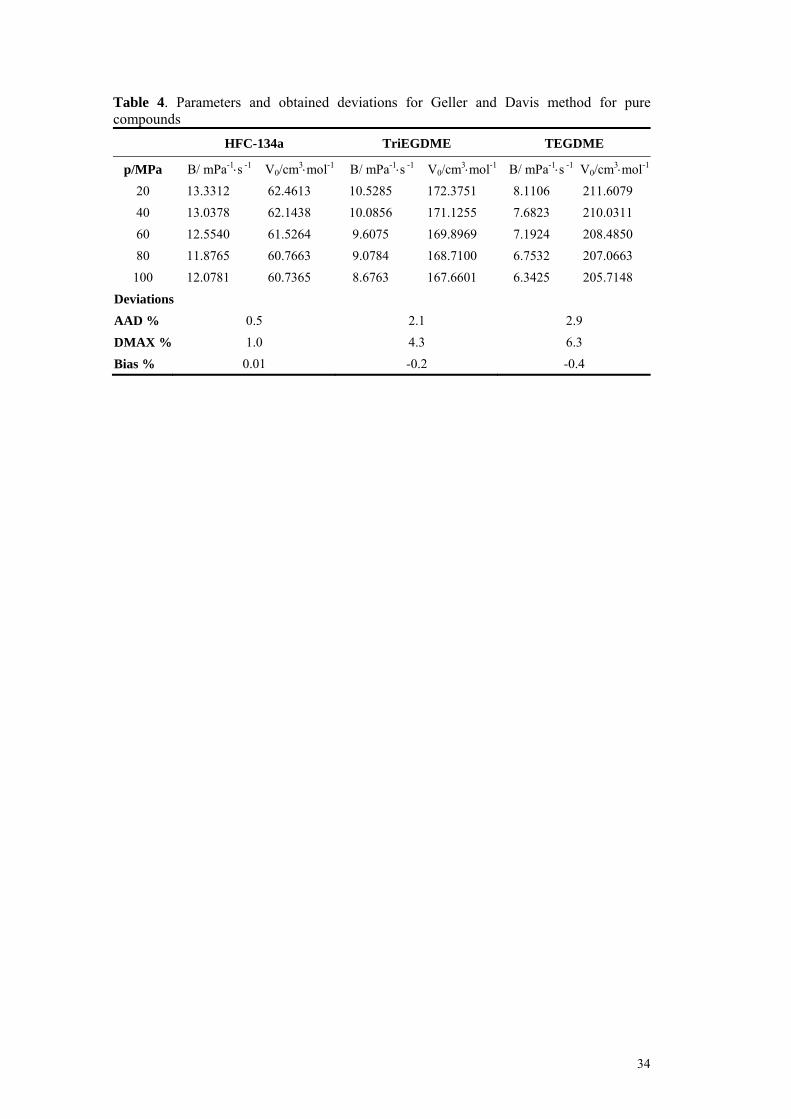
The ability of this method has been analysed in this work for viscosity prediction
of HFC-134a + polyether mixtures. Taking into account the viscosity values previously
reported for pure HFC-134a38 and for pure TriEGDME and TEGDME42, the values of B
and V0 have been determined by minimizing the average absolute deviation between the
calculated and the experimental data of pure compounds. The parameter values are
reported in Table 4 with the results obtained for the pure compounds. The obtained
deviations between the predicted values, obtained by using eqs. 6-7, and the

16
experimental data were an AAD of 18.5%, and Bias of 9.4% and a DMAX of 48.7% for
the system containing TriEGDME. These values are 15.7%, 1.1% and 41.5%
respectively for the mixture with TEGDME. The AAD obtained in this work is of the
same order of magnitude than those found by Geller and Davis for HFC-134a + POE
lubricants1, but the DMAX obtained in this work is higher. However, it is necessary to
point out that whereas Geller and Davis goes up to 5 MPa, in this work the predicted
values have been calculated up to 100 MPa.
The self-referencing method. This model has been developed by Kanti et al. 19, and has
the advantage of only requiring one experimental value η(p0,T0), at a pressure p0, and a
temperature T0. This is the reason why this method is referred to as self-referencing
model. The method involves neither molar mass nor any other physical properties
(including critical parameters), more details can be found in the original paper19. It can
similarly be applied without restriction to pure substances, synthetic mixtures and even
chemically very rich systems such as petroleum cuts for which the method was
originally developed. The method involves nine parameters (a, b, …, i) originally
determined by Kanti et al.19 using numerical analysis on a database containing linear
alkanes and alkylbenzenes. On the basis of knowledge of the values of these
coefficients, the method can be used directly without further adjustment, and for this
reason, it may be considered as general and predictive. The formulation of this method
is as follows:
⎟⎟⎠
⎞⎜⎜⎝
⎛−+++⎟⎟
⎠
⎞⎜⎜⎝
⎛++
−+++=⎟⎟
⎠
⎞⎜⎜⎝
⎛ηη
00
202
02
00 T1
T1)ihygy(
feydy)pp(
1ln)cbyay()T,p(
)T,p(ln (8)

17
where y = y0 + (gy02 + hy0 + i)(1/T - 1/T0) and y0 = ln[η(0.1,T0)]. This equation is used
with p in MPa, T0 and T in K and η(p0,T0) in mPa⋅s.�
In the present work we have used this formulation in order to determine the
viscosity values for HFC-134a + polyether mixtures. For this objective, in a first step
the parameters (a, b, …, i) determined in the original paper by Kanti et al.19 have been
used in eq. 8. Different combinations have been considered for the reference
temperature and pressure. In these conditions the DMAX obtained with the 168
experimental points of Table 3 (170 from which we subtract one reference point for
each mixture) was important, reaching the value of 51%. This fact shows, as it could
have been expected, that the original parameters are not appropriate for refrigerant +
lubricant mixtures. Secondly, the following mixing rules have been used in order to
calculate the mixture parameters (am, bm,…., im) from the parameters estimated on the
pure compounds (HFC-134a, TriEGDME and TEGDME) viscosity data:
in
1iim x α=α ∑
= (9)
where α represent each one of the parameters (a, b,..., i), and xi is the mole fraction of
compound i. We have chosen 293.15 K and 20 MPa, respectively, as reference
temperature and pressure. For polyether molecules, the parameters values have been
published in previous work44. In table 5 we report the values of the parameters for pure
HFC-134a the parameters have been fitted using our experimental viscosity values38 and
minimizing the AAD between the experimental and the calculated data. We report also
in Table 5 the deviation results obtained for this pure compound. With these parameters
the self-referencing model correlates the viscosity values of pure HFC-134a with an
AAD of 0.5%, a Bias of 0.01% and a DMAX of 1.0%. With this method the predicted

18
viscosities for HFC-134a + TriEGDME agree with the experimental data of Table 3,
with an AAD of 4.1%, a Bias of –0.2% and a DMAX of 12.6%. These values are 5.2%,
-3.2%, and 21.9%, respectively, for the mixture that contains TEGDME. The obtained
AAD are quite lower than that obtained with the other methods presented in this article.
The hard-sphere model. This model has been developed45, 46 for the simultaneous
correlation of self-diffusion, viscosity and thermal conductivity of dense fluids. The
transport coefficients of real dense fluids expressed in terms of Vr = V/V0 with V0 the
close-packed volume and V the molar volume, are assumed to be directly proportional
to the values given by the exact hard-sphere theory. The proportionality factor,
described as a roughness factor Rη, accounts for molecular roughness and departure
from molecular sphericity. Universal curves for the viscosity were developed and
expressed as:
∑=
ηη
=⎟⎟⎠
⎞⎜⎜⎝
⎛ η 7
0i
iri*exp )V/1(a
Rln with 3/2exp
2/18*exp V
MRT110035.6 η⎟
⎠⎞
⎜⎝⎛=η (10)
The coefficients aηi are universal, independent of the chemical nature of the compound,
and V0 and Rη are adjustable parameters. Assael et al. give correlation formulas relative
to V0 and Rη for alkanes20 and aromatics22. Rη is independent of pressure and
temperature, while V0 depends on temperature. This method can be applied to mixtures,
knowing V0 and Rη parameters for each compound, and using the following mixing
rules in order to determine these parameters for mixtures:
( ) ( )TVxx,TV i0n
1iim0 ∑
== (11)

19
in
1iim RxR η
=η ∑= (12)
where i and m subscript are used for pure compounds and mixture, respectively.
In this work we have used the aηi universal parameters reported by Assael et al.
20. The values of V0 and Rη for the two pure polyethers (TriEGDME and TEGDME)
have been published in a previous paper44. In a recently paper Assael et al. 47
recommend a value of Rη=1 for pure HFC-134a, taking into account this fact the V0(T)
values have been determined by minimizing the average absolute deviation between the
experimental38 and the calculated viscosities. The following expression has been
obtained:
( ) r6
r65
0 T/106750.8T109383.610831.2TV −−− ++= (13)
where Tr is the reduced temperature. The hard-sphere scheme represents the viscosity of
HFC-134a with an AAD of 2.9%, with a Bias of 0.2% and with a DMAX of 7.4%.
Taking into account the parameters values for pure TriEGDME, TEGDME and
HFC-134a, and considering the mixing rules eqs. 11-12, the dynamic viscosity of HFC-
134 + TriEGDME and HFC-134 + TEGDME can be predicted. The temperature
dependence of V0 parameters of mixtures and pure compounds can be observed in
Figure 4. The hard-sphere model predicts the dynamic viscosity of HFC-134a +
TriEGDME mixtures with an AAD of 12.3%, a Bias of 12.3% and a DMAX of 18.9%.
These values are, respectively, 5.0%, 4.0%, and 10.5% for the system containing
TEGDME. Finally, if V0 and Rη are fitted for each mixture it is obtained an AAD of 1%
and a DMAX of 3.1% for HFC-134a + TriEGDME and 1% and 8.5% respectively for
HFC-134a + TEGDME, but in this case the model is not predictive.
20
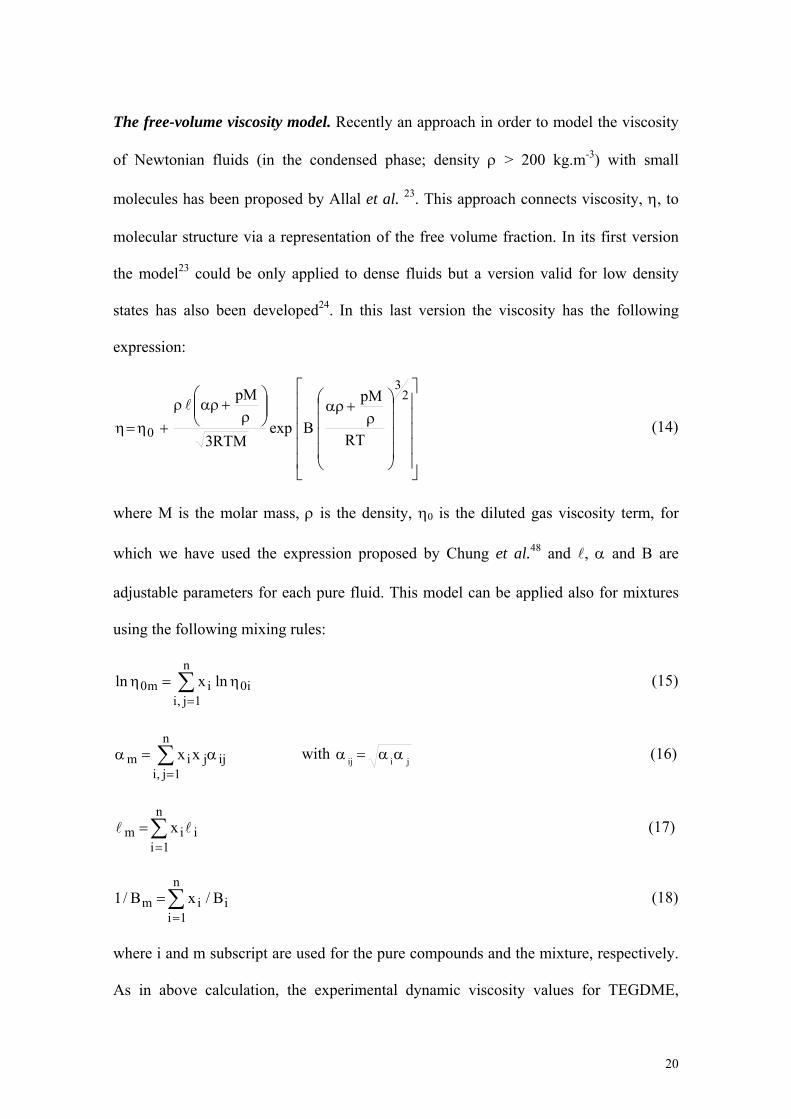
The free-volume viscosity model. Recently an approach in order to model the viscosity
of Newtonian fluids (in the condensed phase; density ρ > 200 kg.m-3) with small
molecules has been proposed by Allal et al. 23. This approach connects viscosity, η, to
molecular structure via a representation of the free volume fraction. In its first version
the model23 could be only applied to dense fluids but a version valid for low density
states has also been developed24. In this last version the viscosity has the following
expression:
⎥⎥⎥⎥⎥
⎦
⎤
⎢⎢⎢⎢⎢
⎣
⎡
⎟⎟⎟⎟
⎠
⎞
⎜⎜⎜⎜
⎝
⎛ρ
+αρ⎟⎟⎠
⎞⎜⎜⎝
⎛ρ
+αρρ+η=η
23
0 RT
pM
BexpRTM3
pMl
(14)
where M is the molar mass, ρ is the density, η0 is the diluted gas viscosity term, for
which we have used the expression proposed by Chung et al.48 and l, α and B are
adjustable parameters for each pure fluid. This model can be applied also for mixtures
using the following mixing rules:
i0n
1j,iim0 lnxln η=η ∑
= (15)
ijjn
1j,iim xx α=α ∑
= with jiij αα=α (16)
in
1iim x ll ∑
== (17)
in
1iim B/xB/1 ∑
== (18)
where i and m subscript are used for the pure compounds and the mixture, respectively.
As in above calculation, the experimental dynamic viscosity values for TEGDME,

21
TriEGDME and HFC-134a have been taken from previous works38, 42. In Table 6 the
parameter values for pure compounds (TriEGDME, TEGDME and HFC-134a) are
reported together with the deviations with which this model represents de dynamic
viscosity of these compounds. Taking into account these parameters values and the
mixing rules of eqs. 15-18 the dynamic viscosity of HFC-134a + TriEGDME and HFC-
134a + TEGDME mixtures can be predicted. The calculated values with the free
volume model agree with the experimental data of Table 3, within an AAD of 13.5%, a
Bias of 13.5% and a DMAX 18.5% for the HFC-134a + TriEGDME mixture. These
values are 15.1%, 15.1% and 20.6% for the mixture that contains TEGDME. If the lm,
αm and Bm values are fitted against the experimental viscosities of the mixtures, these
deviations are much lower (1%, 0.3%, 6% and 0.8%, -0.2% and 2.2%, respectively) but,
then, the model is not predictive.
Friction-theory. This model has been developed recently by Quiñones-Cisneros et al. 25,
26 and express the total viscosity, η, as the addition of a dilute gas term η0 and a friction
term ηf as follows f0 η ηη += . The dilute viscosity is defined as the viscosity at zero
density and can be obtained by the model proposed by Chung et al.48. The friction term
has been linked to the van der Waals repulsive pressure term pr and attractive pressure
term pa by three temperature dependent friction coefficients κr, κa and κrr as follows:
2rrraarr ppp κ+κ+κ=η (19)
The repulsive and attractive pressure terms can be obtained from cubic equations of
state (EoS); in this work the Peng-Robinson EoS has been used. In the first version of
this theory25 the viscosity of each pure compounds is modelled with the following
expressions for the friction coefficients:

22
[ ]( ) ( )[ ]( )[ ]( ) ( )[ ]( )
[ ]( ) 12exp c κ112expb 11exp b b κ112expa 11exp a a κ
2rr
210a
210r
−Γ=−−Γ+−−Γ+=−−Γ+−−Γ+=
(20)
with Γ=Tc/T, where Tc is the critical temperature. For pure TriEGDME, TEGDME and
HFC-134a the critical constants values have been published in previous works39, 44. In
Table 7 the ai, bi, ci parameters and the deviations between the calculated and the
experimental data38, 42 for pure compounds are reported. Once known the parameters for
pure TriEGDME, TEGDME and HFC-134a the dynamic viscosity for HFC-134a +
TriEGDME and HFC-134a + TEGDME mixtures can be predicted, taking into account
the following mixing rules25, 26:
∑=
η=ηn
1ii0i lnxln 0 ∑
=κ=κ
n
1iriizr (21)
∑=
κ=κn
1iaiiza ∑
=κ=κ
n
1irriizrr (22)
where:
mi
ii MM
xz
ε= ∑
=ε
=n
1i i
im M
xM (23)
The ε parameter that appears in the last equations has been fitted26 against several
compounds finding the best results with ε=0.30. With the friction theory we have
obtained for HFC-134a + TriEGDME mixture an average deviation of 7.6%, a Bias of
7.6% and a maximum deviation of 11.5% between the predicted values and the
experimental data of Table 3. These values are, respectively, 8.5%, -8.5% and 18.0% for
the system containing TEGDME.

23
Comparison between the models. The results obtained for dynamic viscosity prediction,
of HFC-134 + TriEGDME and HFC-134 + TEGDME mixtures, with the different tested
models: mixing rule (eq.2), Geller and Davis method, self-referencing model, hard-
sphere scheme, free volume and friction theory, are compared in Figure 5. It is
interesting to notice that the three models with physical background, free volume, hard-
spheres and friction-theory, predict in most of cases dynamic viscosity values that are
lower than the experimental values over all the temperature and pressure ranges, except
for the prediction with the friction-theory for HFC-134a + TEGDME for which the
predicted values are higher than the experimental data of Table 3. Furthermore, in most
cases, we obtain AAD = Bias, i.e. all the points are on the same side of the experimental
curve (lower values), except for the prediction with the self-referencing method and the
hard-sphere scheme for HFC-134a + TEGDME mixture, where the Bias is slightly
lower than the AAD, as it can be observed in Figure 5. It is interesting to point out that
the three models with physical background, together with the self-referencing method,
are the most adequate procedures in order to predict the viscosity of HFC-134a +
polyether mixtures, for low concentration in lubricant. An extended study over all the
concentration range would be useful in order to make clear the prediction ability of the
representative models at higher lubricant concentration.
Conclusion
Dynamic experimental viscosity data for HFC-134a + TriEGDME and HFC-134 +
TEGDME mixtures have been measured between 293.15 and 373.15 K and from 10 to
140 MPa, and at low polyether concentration (12% mass fraction for TriEGDME and
14% mass fraction for TEGDME) by using an specially designed isobaric transfer

24
falling-body viscometer. The viscosity of the mixtures is in average 40% higher than
that of the pure refrigerant, and this increase is more noticeable at lower temperatures.
The experimental viscosities reported in this work have been used in order to check the
ability of some mixing rules and of several viscosity models, (the Geller and Davis
model, the self referencing model, the hard sphere scheme, the free volume model and
the friction-theory), for viscosity prediction and correlation of refrigerant + lubricant
mixtures. Most of the studied models under estimate dynamic viscosity values over all
the temperature and pressure ranges. Other experimental measurements over wide
temperature, pressure, and composition range for different refrigerant + lubricant
mixtures are needed in order to complete this study.
Acknowledgments
This work was carried out under the Research Project PPQ2001-3022 MCYT-Spain and
the Spanish-French Joint Action HF 2001-0101.

25
Literature cited
(1) Geller, V. Z.; Davis K. E., Solubility and Viscosity of Refrigerant/POE Lubricant Mixtures,
presented in Int. Congr. Refrig.: Refrig. 19th, 1995, 223.
(2) Geller, V. Z.; Paulaitis M. E.; Bivens D. B.; Yokozeki A. Viscosities of HFC-32 and HFC-
32/Lubricant Mixtures. Int. J. Thermophys. 1996, 17, 75.
(3) Geller, V., Thermophysical Properties of Alternative Refrigerant/Lubricant Mixtures,
presented in IIR Proceedings Series "Refrigeration Science and Technology", 1998, 49.
(4) Jonsson, U. J.; Lilje K. C., Elastohydrodynamic Lubrication Properties of Polyol Ester
Lubricants-R134a Mixtures, presented in Proceedings of 1998 International Compressor
Engineering Conference at Purdue, Purdue University U.S.A., July 14-17, 1998, 123.
(5) Thébault, C.; Vamling L., A New Correlation For Viscosity of Oil/Refrigerant Mixtures,
presented in Int. Congr. Refrig.: Refrig. Third Millennium, 20th, 1999, 707.
(6) Wahlström, A.; Vamling L., Viscosity for Mixtures of HFCs and Pentaerythritol Esters,
presented in Int. Congr. Refrig.: Refrig. Third Millennium, 20th, 1999, 716.
(7) Cavestri, R. C.; Schafer W. R. Measurement of Solubility, Viscosity, and Density of R410A
Refrigerant/Lubricant Mixtures. ASHRAE Transactions. 2000, 106, 277.
(8) Kumagai, A.; Miura-Mochida H.; Takahashi S. Liquid Viscosities and Densities of HFC-
134a + Glycol Mixtures. Int. J. Thermophys. 1993, 14, 45.
(9) Kumagai, A.; Miura-Mochida H.; Takahashi S. Revised Viscosities for HFC-134a + Glycol
Mixtures from 273 to 333 K. Int. J. Thermophys. 1994, 15, 109.
(10) McMullan, J. T.; Hewitt N. J.; Masson A. L.; Murphy N. E. The influence of oil viscosity
and refrigerant quality on evaporator performance. Int. J. Energy Research. 1992, 16,
567.
(11) Eckels, S. J.; Pate M. B. In-Tube Evaporation and Condensation of Refrigerant Lubricant
Mixtures of HFC134a and CFC12. ASHRAE Transactions. 1991, 97, 62.
(12) Schlager, L. M.; Pate M. B.; Bergles A. E. Evaporation and Condensation of Refrigerant-

26
Oil Mixtures in Smooth Tube and Micro-Fin Tube. ASHRAE Transactions. 1988, 94,
149.
(13) Sur, B.; Azer N. Z. Effect of Oil on Heat Transfer and Pressure Drop During Condensation
of Refrigerant-113 Inside Smooth and Internally Finned Tubes. ASHRAE Transactions.
1991, 97, 365.
(14) Tichy, J. A.; Macken N. A.; Duval W. M. B. An Experimental Investigation of Heat
Transfer in Forced Convection Condensation of Oil-Refrigerant Mixture. ASHRAE
Transactions. 1985, 91,
(15) Sundaresan, S. G.; Pate M. B.; Doerr T. M., A Comparison of the Effects of Different
Lubricants on the In-Tube Evaporator of an HFC-Blend Refrigerant, presented in
Proceedings of 1994 International Compressor Engineering Conference at Purdue,
Purdue University U.S.A., July 14-17, 1994, 323.
(16) Lee, K. S.; Kim W. S.; Lee T. H.; Lee S. Y., An Experimental Study on the Behavior of
Frost Formation in the Vertical Plate Heat Exchanger, presented in Proceedings of 1994
International Compressor Engineering Conference at Purdue, Purdue University U.S.A.,
July 14-17, 1994, 329.
(17) Katti, P. K.; Chaudry M. M. Boiling points and surface tensions of mixtures of benzyl
acetate with dioxane, aniline, and m-cresol. J. Chem. Eng. Data. 1964, 9, 442.
(18) Grunberg, L.; Nissan A. H. Mixture law for viscosity. Nature. 1949, 164, 799.
(19) Kanti, M.; Zhou H.; Ye S.; Boned C.; Lagourette B.; Saint-Guirons H.; Xans P.; Montel F.
Viscosity of liquid hydrocarbons, mixtures and petroleum cuts, as a function of pressure
and temperature. J. Phys. Chem. 1989, 93, 3860.
(20) Assael, M. J.; Dymond J. H.; Papadaki M.; Patterson P. M. Correlation and Prediction of
Dense Fluid Transport Coefficients. I. Alkanes. Int. J. Thermophys. 1992, 13, 269.
(21) Assael, M. J.; Dymond J. H.; Papadaki M.; Patterson P. M. Correlation and prediction of
dense fluid transport coefficients. III. n-Alkane mixtures. Int. J. Thermophys. 1992, 13,

27
659.
(22) Assael, M. J.; Dymond J. H.; Patterson P. M. Correlation and Prediction of Dense Fluid
Transport Coefficients. V. Aromatic Hydrocarbons. Int. J. Thermophys. 1992, 13, 895.
(23) Allal, A.; Moha-Ouchane M.; Boned C. A new free volume model for dynamic viscosity
and density of dense fluids versus pressure and temperature. Phys. Chem. Liquids. 2001,
39, 1.
(24) Allal, A.; Boned C.; Baylaucq A. Free-volume viscosity model for fluids in the dense and
gaseous states. Phys. Rev. E. 2001, 64, 011203/1.
(25) Quiñones-Cisneros, S. E.; Zéberg-Mikkelsen C. K.; Stenby E. H. The friction theory (f-
theory) for viscosity modelling. Fluid Phase Equilib. 2000, 169, 249.
(26) Quiñones-Cisneros, S. E.; Zéberg-Mikkelsen C. K.; Stenby E. H. One parameter friction
theory models for viscosity. Fluid Phase Equilib. 2001, 178, 1.
(27) Daugé, P.; Baylaucq A.; Marlin L.; Boned C. Development of an Isobaric Transfer
Viscometer Operating up to 140 MPa. Application to a Methane + Decane System. J.
Chem. Eng. Data. 2001, 46, 823.
(28) Vogel, E.; Kuchenmeister C.; Bich E.; Laesecke A. Reference Correlation of the Viscosity
of Propane. J. Phys. Chem. Ref. Data. 1998, 27, 947.
(29) Cibulka, I. Saturated liquid densities of 1-alkanols from C1 to C10 and n-alkanes from C5
to C16: a critical evaluation of experimental data. Fluid Phase Equilib. 1993, 89, 1.
(30) Cibulka, I.; Hnedkovsky L. Liquid Densities at Elevated Pressures of n-Alkanes from C5 to
C16: A Critical Evaluation of Experimental Data. J. Chem. Eng. Data. 1996, 41, 657.
(31) Cibulka, I.; Takagi T. P-r-T Data of Liquids: Summarization and Evaluation. 5. Aromatic
Hydrocarbons. J. Chem. Eng. Data. 1999, 44, 411.
(32) Kiran, E.; Sen Y. L. High-pressure viscosity and density of n-alkanes. Int. J. Thermophys.
1992, 13, 411.
(33) Oliveira, C. M. B. P.; Wakeham W. A. The viscosity of five liquid hydrocarbons at

28
pressures up to 250 MPa. Int. J. Thermophys. 1992, 13, 773.
(34) Stephan, K.; Lucas K., Viscosity of Dense Fluids, Plenum Press, New York and London;
1979.
(35) Kashiwagi, H.; Makita T. Viscosity of twelve hydrocarbon liquids in the temperature range
298-348 K at pressures up to 110 MPa. Int. J. Thermophys. 1982, 3, 289.
(36) Assael, M. J.; Oliveira C. P.; Papadaki M.; Wakeham W. A. Vibrating-wire viscometers for
liquids at high pressures. Int. J. Thermophys. 1992, 13, 593.
(37) Santos, F. J. V. d.; Castro C. A. N. d. Viscosity of Toluene and Benzene under High
Pressures. Int. J. Thermophys. 1997, 18, 367.
(38) Comuñas, M. J. P.; Baylaucq A.; Quiñones-Cisneros S. E.; Zéberg-Mikkelsen C. K.; Boned
C.; Fernández J. Viscosity Measurements and Correlations for 1,1,1,2-tetrafluoroethane
(HFC-134a) up to 140 MPa. Fluid Phase Equilib. 2003, 210, 21.
(39) Comuñas, M. J. P.; Fernández J.; Baylaucq A.; Canet X.; Boned C. PρTx Measurements
for HFC-134a + Triethylene Glycol Dimethylether System. Fluid Phase Equilib. 2002,
199, 185.
(40) Comuñas, M. J. P.; Baylaucq A.; Boned C.; Canet X.; Fernández J. High-Pressure
volumetric behaviour of x 1,1,1,2-tetrafluoroethane + (1-x) 2,5,8,11,14-
pentaoxapentadecane (TEGDME) mixtures. J. Chem. Eng. Data. 2002, 47, 233.
(41) Et-Tahir, A.; Boned C.; Lagourette B.; Xans P. Determination of the viscosity of various
hydrocarbons and mixtures of hydrocarbons versus temperature and pressure. Int. J.
Thermophys. 1995, 6, 1309.
(42) Comuñas, M. J. P.; Baylaucq A.; Boned C.; Fernández J. High Pressure Measurements of
the Viscosity and Density of Two Polyethers and Two Dialkyl Carbonates. Int. J.
Thermophys. 2001, 22, 749.
(43) Liu, H.; Wang W. Application of the Hildebrand Fluidity Equation to Liquid Mixtures. Ind.
Eng. Chem. Res. 1991, 30, 1617.

29
(44) Baylaucq, A.; Comuñas M. J. P.; Boned C.; Allal A.; Fernández J. High pressure viscosity
and density modelling of two polyethers and two dialkyl carbonates. Fluid Phase
Equilib. 2002, 199, 249.
(45) Assael, M. J.; Dymond J. H.; Papadaki M.; Patterson P. M. Correlation and prediction of
dense fluid transport coefficients. II. Simple molecular fluids. Fluid Phase Equilib.
1992, 75, 245.
(46) Dymond, J. H.; Awan M. A. Correlation of high-pressure diffusion and viscosity
coefficients for n-alkanes. Int. J. Thermophys. 1989, 10, 941.
(47) Assael, M. J.; Dalaouti N. K.; Dymond J. H.; Feleki F. P. Correlation for Viscosity and
Thermal Conductivity of Liquid Halogenated Ethane Refrigerants. Int. J. Thermophys.
2000, 21, 367.
(48) Chung, T. H.; Ajlan M.; L.L.Lee; Starling K. E. Generalized Multiparameter Correlation
for Nonpolar and Polar Fluid Transport Properties. Ind. Eng. Chem. Res. 1988, 27, 671.

30
Table 1. Data sources for reference fluids Liquid σ(η) Temperature
range / K Pressure range / MPa
Propane28 ± 2% 90-600 0.01-100 Pentane32 ± 3% 318-443 10-70
Pentane33 ± 0.5% 303.15-323.15 0.1-250
Pentane34 ± 2% 280-455 0.1-60
Hexane33* ± 0.5% 303-348 0.1-250
Heptane35 ± 2% 298-348 0.1-170
Heptane36 ± 0.5% 303-348.15 0.1-250
Toluene22 ± 0.5% 298.15-373.15 0.1-200
Toluene37 ± 0.5% 303.15-323.15 0.1-80
σ(η) reported viscometer uncertainty, ΔT and Δp temperature and pressure intervals studied by the authors.* This fluid has been used first to verify the viscosity calibration procedure and after it has been included as reference fluid for viscosity determination of HFC-134a + polyether mixtures.

31
Table 2. Experimental (up to 60 MPa) or Tait-extrapolated densities, ρlab, and predicted densities using the Patel-Teja EoS with a quadratic mixing rule. T/K
293.15 313.15 333.15 353.15 373.15 p/MPa ρlab ρEoS Δρ/ρ (%) ρlab ρEoS Δρ/ρ (%) ρlab ρEoS Δρ/ρ (%) ρlab ρEoS Δρ/ρ (%) ρlab ρEoS Δρ/ρ (%)
88% HFC-134a + 12% TriEGDME
10 1.2401 1.2525 -1.0 1.1888 1.2000 -0.9 1.134 1.1403 -0.6 1.075 1.0721 0.3 1.0088 1.1010 -9.1 20 1.2659 1.2831 -1.4 1.2203 1.2396 -1.6 1.1735 1.1921 -1.6 1.125 1.1402 -1.3 1.0744 1.1585 -7.8 30 1.2877 1.3072 -1.5 1.2462 1.2697 -1.9 1.204 1.2295 -2.1 1.1613 1.1865 -2.2 1.1179 1.1992 -7.3 40 1.3068 1.3270 -1.5 1.268 1.2938 -2.0 1.2294 1.2587 -2.4 1.1906 1.2216 -2.6 1.1514 1.2307 -6.9 50 1.3238 1.3438 -1.5 1.2874 1.3139 -2.1 1.2511 1.2824 -2.5 1.215 1.2496 -2.8 1.1791 1.2563 -6.5 60 1.3392 1.3583 -1.4 1.3046 1.3309 -2.0 1.2703 1.3024 -2.5 1.2363 1.2728 -3.0 1.2028 1.2777 -6.2 70 1.3599 1.3709 -0.8 1.3272 1.3457 -1.4 1.2953 1.3195 -1.9 1.2639 1.2925 -2.3 1.2330 1.2960 -5.1 80 1.3724 1.3821 -0.7 1.3409 1.3587 -1.3 1.3101 1.3345 -1.9 1.2802 1.3095 -2.3 1.2507 1.3120 -4.9 90 1.3841 1.3921 -0.6 1.3536 1.3703 -1.2 1.3239 1.3477 -1.8 1.2952 1.3245 -2.3 1.2669 1.3261 -4.7 100 1.3950 1.4012 -0.4 1.3654 1.3806 -1.1 1.3366 1.3594 -1.7 1.3090 1.3377 -2.2 1.2819 1.3387 -4.4 110 1.4053 1.4094 -0.3 1.3765 1.3900 -1.0 1.3485 1.3700 -1.6 1.3219 1.3496 -2.1 1.2958 1.3500 -4.2 120 1.4151 1.4169 -0.1 1.3870 1.3985 -0.8 1.3598 1.3796 -1.5 1.3340 1.3604 -2.0 1.3088 1.3602 -3.9 130 1.4244 1.4237 0.0 1.3969 1.4063 -0.7 1.3704 1.3884 -1.3 1.3455 1.3701 -1.8 1.3211 1.3696 -3.7 140 1.4333 1.4301 0.2 1.4063 1.4134 -0.5 1.3804 1.3964 -1.2 1.3563 1.3791 -1.7 1.3327 1.3781 -3.4
86% HFC-134a + 14% TEGDME
10 1.2417 1.2509 -0.7 1.1920 1.2018 -0.8 1.1391 1.1462 -0.6 1.0824 1.0828 0.0 1.0193 1.1059 -8.5 20 1.2662 1.2791 -1.0 1.2219 1.2382 -1.3 1.1759 1.1935 -1.5 1.1288 1.1447 -1.4 1.0798 1.1591 -7.3 30 1.2869 1.3014 -1.1 1.2462 1.2661 -1.6 1.2048 1.2281 -1.9 1.1633 1.1875 -2.1 1.1209 1.1973 -6.8 40 1.3051 1.3199 -1.1 1.2671 1.2885 -1.7 1.2290 1.2552 -2.1 1.1910 1.2201 -2.4 1.1529 1.2270 -6.4

32
Table 2. Continued
T/K 293.15 313.15 333.15 353.15 373.15
p/MPa ρlab ρEoS Δρ/ρ (%) ρlab ρEoS Δρ/ρ (%) ρlab ρEoS Δρ/ρ (%) ρlab ρEoS Δρ/ρ (%) ρlab ρEoS Δρ/ρ (%)
86% HFC-134a + 14% TEGDME
50 1.3214 1.3355 -1.1 1.2854 1.3072 -1.7 1.2499 1.2775 -2.2 1.2145 1.2463 -2.6 1.1792 1.2511 -6.1 60 1.3360 1.3490 -1.0 1.3020 1.3232 -1.6 1.2683 1.2962 -2.2 1.2349 1.2680 -2.7 1.2022 1.2713 -5.7 70 1.3558 1.3609 -0.4 1.3238 1.3370 -1.0 1.2924 1.3122 -1.5 1.2615 1.2865 -2.0 1.2311 1.2887 -4.7 80 1.3677 1.3714 -0.3 1.3369 1.3492 -0.9 1.3068 1.3263 -1.5 1.2772 1.3025 -2.0 1.2482 1.3038 -4.5 90 1.3789 1.3808 -0.1 1.3492 1.3601 -0.8 1.3201 1.3387 -1.4 1.2916 1.3166 -1.9 1.2638 1.3172 -4.2 100 1.3894 1.3893 0.0 1.3606 1.3698 -0.7 1.3324 1.3497 -1.3 1.3050 1.3291 -1.8 1.2782 1.3291 -4.0 110 1.3993 1.3970 0.2 1.3713 1.3786 -0.5 1.3440 1.3597 -1.2 1.3175 1.3403 -1.7 1.2916 1.3398 -3.7 120 1.4086 1.4040 0.3 1.3814 1.3866 -0.4 1.3549 1.3687 -1.0 1.3292 1.3504 -1.6 1.3042 1.3495 -3.5 130 1.4175 1.4105 0.5 1.3910 1.3940 -0.2 1.3652 1.3770 -0.9 1.3402 1.3597 -1.5 1.3160 1.3584 -3.2 140 1.4260 1.4165 0.7 1.4001 1.4007 0.0 1.3750 1.3846 -0.7 1.3507 1.3681 -1.3 1.3272 1.3666 -3.0

33
Table 3. Dynamic viscosity, η/mPa⋅s, for HFC-134a + polyether mixtures at different temperatures and pressures. T/K
88% HFC-134a + 12% TriEGDME
p /MPa 293.15 313.15 333.15 353.15 373.15 10 0.404 0.330 0.256 0.203 0.160 20 0.445 0.362 0.288 0.233 0.196 30 0.486 0.395 0.320 0.263 0.228 40 0.529 0.429 0.352 0.291 0.257 50 0.573 0.465 0.384 0.319 0.284 60 0.619 0.502 0.415 0.347 0.309 70 0.664 0.539 0.446 0.373 0.329 80 0.712 0.579 0.477 0.401 0.354 90 0.762 0.620 0.508 0.428 0.376 100 0.813 0.663 0.540 0.454 0.398 110 0.868 0.707 0.575 0.479 0.416 120 0.922 0.754 0.606 0.505 0.437 130 0.980 0.802 0.637 0.530 0.457 140 1.039 0.852 0.669 0.556 0.478
86% HFC-134a + 14% TEGDME
10 0.406 0.321 0.249 0.198 0.163 20 0.449 0.359 0.292 0.241 0.201 30 0.491 0.396 0.329 0.277 0.234 40 0.535 0.434 0.363 0.307 0.263 50 0.580 0.472 0.394 0.335 0.290 60 0.626 0.510 0.424 0.362 0.317 70 0.671 0.553 0.453 0.388 0.337 80 0.720 0.582 0.482 0.416 0.362 90 0.769 0.623 0.516 0.439 0.385 100 0.820 0.661 0.543 0.464 0.409 110 0.875 0.699 0.578 0.488 0.427 120 0.929 0.738 0.610 0.513 0.449 130 0.985 0.778 0.643 0.539 0.471 140 1.042 0.817 0.678 0.565 0.492
34
Table 4. Parameters and obtained deviations for Geller and Davis method for pure compounds
HFC-134a TriEGDME TEGDME
p/MPa B/ mPa-1⋅s -1 V0/cm3⋅mol-1 B/ mPa-1⋅s -1 V0/cm3⋅mol-1 B/ mPa-1⋅s -1 V0/cm3⋅mol-1 20 13.3312 62.4613 10.5285 172.3751 8.1106 211.6079 40 13.0378 62.1438 10.0856 171.1255 7.6823 210.0311 60 12.5540 61.5264 9.6075 169.8969 7.1924 208.4850 80 11.8765 60.7663 9.0784 168.7100 6.7532 207.0663
100 12.0781 60.7365 8.6763 167.6601 6.3425 205.7148 Deviations AAD % 0.5 2.1 2.9 DMAX % 1.0 4.3 6.3 Bias % 0.01 -0.2 -0.4

35
Table 5. Self-referencing model parameters and obtained deviations for pure compounds with T0=293.15 K and p0=20 MPa. Parameters HFC-134a TriEGDME TEGDME
a -0.3143 0.5199 0.6085 b -0.6440 -0.4139 -0.9432 c 0.4831 1.4749 1.7586 d -4.7946 10.5147 10.5393 e 47.8851 -11.8065 -11.7845 f 136.4407 191.1123 191.1260 g 71.5487 -17.9536 -17.9536 h 396.0128 446.2398 446.2398 i 1384.0740 1244.9188 1244.9188 Deviations AAD % 0.8 0.6 0.6 DMAX % 3.0 2.8 2.8 Bias % 0.1 0.0 0.0

36
Table 6. Parameter values and deviations obtained of free volume model for pure compounds. Pure Fluid α /m5⋅mol-1⋅s-2 B l/Å
TriEGDME 194.090 0.00341 0.390 TEGDME 255.546 0.00265 0.322 HFC-134a 23.970 0.01223 0.998
Deviations AAD % Bias % DMAX % TriEGDME 0.7 -0.08 3.2 TEGDME 1.3 -0.7 4.2 HFC-134a 0.8 0.0 2.1

37
Table 7. Parameter values and obtained deviations for pure compounds with the friction-theory + PR EoS Parameters a0 /
μP⋅bar-1 a1/
μP⋅bar-1 a2/
μP⋅bar-1 b0/
μP⋅bar-1 b1/
μP⋅bar-1 b2/
μP⋅bar-1 c2/
μP⋅bar-2 TriEGDME 12.1720 -24.9801 4.5256 6.5219 -18.8717 3.1219 5.1440 10-5 TEGDME 36.4209 -57.2566 9.0587 23.2056 -40.2344 5.2509 8.8046 10-5 HFC-134a 0.9572 5.0591 -1.0432 -0.7534 11.339 -4.2165 1.1352 10-5
Deviations AAD % DMAX % Bias %
TriEGDME 1.2 4.1 0.05
TEGDME 1.8 4.5 0.10
HFC-134a 0.6 4.0 0.06

38
FIGURE CAPTIONS
Figure 1. Deviations between the experimental dynamic viscosity values of hexane
reported by Oliveira and Wakeham33, and the values determined using the three
calibration methods: literature experimental data, ( ), the hard-sphere method, ( )
and the f-theory method, (Δ).
Figure 2. Viscosity values for HFC-134a + polyether mixtures in the temperature
range of 293.15 K to 373.15 K and pressures between 10 MPa and 140 MPa using
the three calibration methods: literature experimental data, (Δ), the hard-sphere
method, ( ) and the f-theory method, (◊). (a) Mixture containing TriEGDME and
(b) mixture with TEGDME.
Figure 3. ηTp diagram for the HFC-134a + polyether (this work), and for pure
HFC-134a38 and pure TriEDGME and TEGDME42.
Figure 4. Hard-Sphere parameters V0(T) versus temperature: ( ) TEGDME42, ( )
TriEGDME42, ( ) HFC-134a (eq. 13), ( ) HFC-134a + TriEGDME and (◊) HFC-
134a + TEGDME.
Figure 5. Deviations between the experimental values and the predicted data for
the analysed models: ( ) AAD, ( ) DMAX, ( ) Bias. (a) HFC-134a + TriEGDME
and (b) HFC-134a + TEGDME.

39
FIGURE 1
-6.0
-4.0
-2.0
0.0
2.0
4.0
6.0
0 20 40 60 80 100 120 140 160
p/ MPa
Δη/η
%

40
FIGURE 2
0.1
0.3
0.5
0.7
0.9
1.1
0 20 40 60 80 100 120 140 160p/ MPa
η/ m
Pa⋅s
(a) 293.15 K
313.15 K
333.15 K
353.15 K
373.15 K
0.1
0.3
0.5
0.7
0.9
1.1
0 20 40 60 80 100 120 140 160p/ MPa
η/ m
Pa⋅s
(b) 293.15 K
313.15 K
333.15 K
353.15 K
373.15 K

41
FIGURE 3
10090
807060504030
p, MPa
363353343333323313303
T, K
0
01
12
2334455667788
η , M
Pa ·s
10090
807060504030
p, MPa
363353343333323313303
T, K
0
01
122334455667788
η , M
Pa ·s
Pure HFC-134a 88 % HFC-134a + 12 % TriEGDME
10090
807060504030
p, MPa
363353343333323313303
T, K
0
01
12
2334455667788
η , M
Pa ·s
10090
807060504030
p, MPa
363353343333323313303
T, K
0
01
122334455667788
η , M
Pa ·s
Pure HFC-134a 88 % HFC-134a + 12 % TriEGDME
10090
807060504030
p, MPa
363353343333323313303
T, K
0
01
12
2334455667788
η , M
Pa· s
10090
807060504030
p, MPa
363353343333323313303
T, K
0
01
12
23
34455667788
η, M
Pa·s
Pure TEGDME Pure TriEGDME
10090
807060504030
p, MPa
363353343333323313303
T, K
0
01
12
2334455667788
η , M
Pa· s
10090
807060504030
p, MPa
363353343333323313303
T, K
0
01
12
23
34455667788
η, M
Pa·s
Pure TEGDME Pure TriEGDME
10090
807060504030
p, MPa
363353343333323313303
T, K
0
01
12
2334455667788
η, M
Pa ·s
86 % HFC-134a + 14 % TEGDME
10090
807060504030
p, MPa
363353343333323313303
T, K
0
01
12
2334455667788
η, M
Pa ·s
86 % HFC-134a + 14 % TEGDME

42
FIGURE 4
0.20
0.40
0.60
0.80
1.00
1.20
1.40
1.60
1.80
283.15 303.15 323.15 343.15 363.15T/ K
V0/
10 -4
m3 m
ol-1

43
FIGURE 5
-20
-100
1020
3040
50
Dev
iatio
n %
(a)
Hard-Sphere
Geller and Davis
Mixing rule eq. (2)
Free-Volume
Friction Theory
Self-reference
-20
-10
0
10
20
30
40
50
Dev
iatio
n %
Hard-Sphere
Geller and Davis
Mixing rule eq. (2)
(b)
Free-Volume
Friction Theory
Self-reference
Copyright © 2022 FDOKUMEN