Knoevenagel condensation reactions catalysed by metal-organic frameworks
International Journal of Heat and Mass Transfer 52 (2009) 5701–5711
Contents lists available at ScienceDirect
International Journal of Heat and Mass Transfer
journal homepage: www.elsevier .com/locate / i jhmt
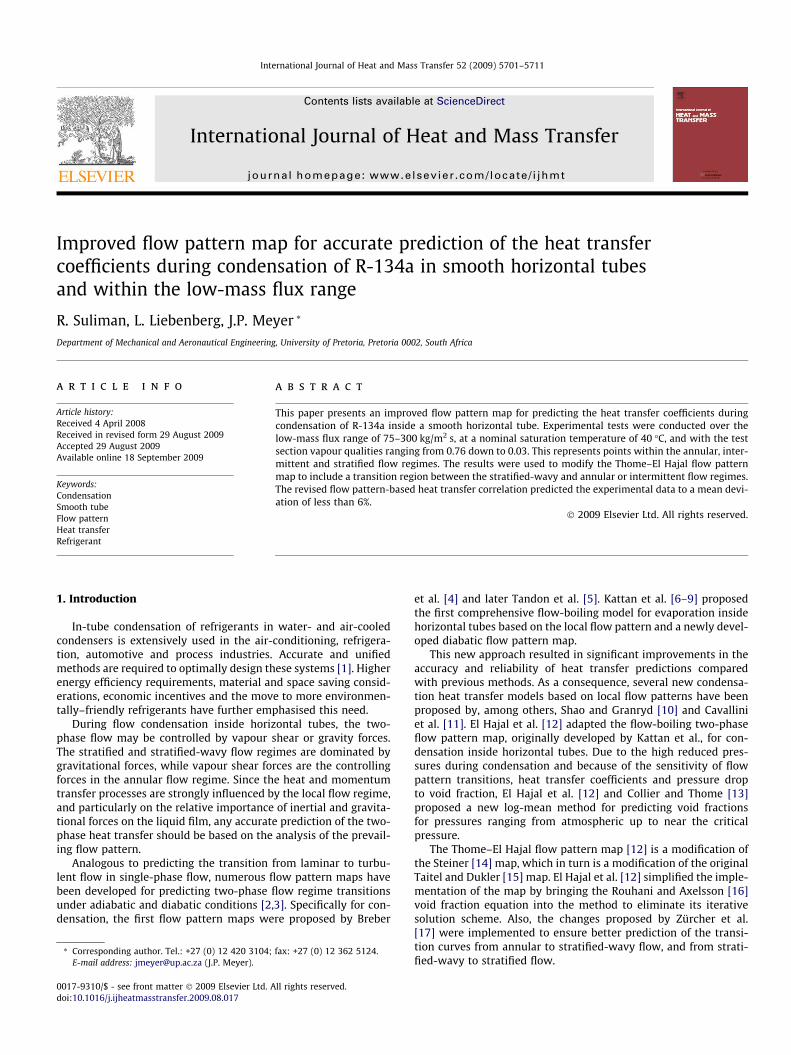
Improved flow pattern map for accurate prediction of the heat transfercoefficients during condensation of R-134a in smooth horizontal tubesand within the low-mass flux range
R. Suliman, L. Liebenberg, J.P. Meyer *
Department of Mechanical and Aeronautical Engineering, University of Pretoria, Pretoria 0002, South Africa
a r t i c l e i n f o a b s t r a c t
Article history:Received 4 April 2008Received in revised form 29 August 2009Accepted 29 August 2009Available online 18 September 2009
Keywords:CondensationSmooth tubeFlow patternHeat transferRefrigerant
0017-9310/$ - see front matter � 2009 Elsevier Ltd. Adoi:10.1016/j.ijheatmasstransfer.2009.08.017
* Corresponding author. Tel.: +27 (0) 12 420 3104;E-mail address: [email protected] (J.P. Meyer).
This paper presents an improved flow pattern map for predicting the heat transfer coefficients duringcondensation of R-134a inside a smooth horizontal tube. Experimental tests were conducted over thelow-mass flux range of 75–300 kg/m2 s, at a nominal saturation temperature of 40 �C, and with the testsection vapour qualities ranging from 0.76 down to 0.03. This represents points within the annular, inter-mittent and stratified flow regimes. The results were used to modify the Thome–El Hajal flow patternmap to include a transition region between the stratified-wavy and annular or intermittent flow regimes.The revised flow pattern-based heat transfer correlation predicted the experimental data to a mean devi-ation of less than 6%.
� 2009 Elsevier Ltd. All rights reserved.
1. Introduction
In-tube condensation of refrigerants in water- and air-cooledcondensers is extensively used in the air-conditioning, refrigera-tion, automotive and process industries. Accurate and unifiedmethods are required to optimally design these systems [1]. Higherenergy efficiency requirements, material and space saving consid-erations, economic incentives and the move to more environmen-tally–friendly refrigerants have further emphasised this need.
During flow condensation inside horizontal tubes, the two-phase flow may be controlled by vapour shear or gravity forces.The stratified and stratified-wavy flow regimes are dominated bygravitational forces, while vapour shear forces are the controllingforces in the annular flow regime. Since the heat and momentumtransfer processes are strongly influenced by the local flow regime,and particularly on the relative importance of inertial and gravita-tional forces on the liquid film, any accurate prediction of the two-phase heat transfer should be based on the analysis of the prevail-ing flow pattern.
Analogous to predicting the transition from laminar to turbu-lent flow in single-phase flow, numerous flow pattern maps havebeen developed for predicting two-phase flow regime transitionsunder adiabatic and diabatic conditions [2,3]. Specifically for con-densation, the first flow pattern maps were proposed by Breber
ll rights reserved.
fax: +27 (0) 12 362 5124.
et al. [4] and later Tandon et al. [5]. Kattan et al. [6–9] proposedthe first comprehensive flow-boiling model for evaporation insidehorizontal tubes based on the local flow pattern and a newly devel-oped diabatic flow pattern map.
This new approach resulted in significant improvements in theaccuracy and reliability of heat transfer predictions comparedwith previous methods. As a consequence, several new condensa-tion heat transfer models based on local flow patterns have beenproposed by, among others, Shao and Granryd [10] and Cavalliniet al. [11]. El Hajal et al. [12] adapted the flow-boiling two-phaseflow pattern map, originally developed by Kattan et al., for con-densation inside horizontal tubes. Due to the high reduced pres-sures during condensation and because of the sensitivity of flowpattern transitions, heat transfer coefficients and pressure dropto void fraction, El Hajal et al. [12] and Collier and Thome [13]proposed a new log-mean method for predicting void fractionsfor pressures ranging from atmospheric up to near the criticalpressure.
The Thome–El Hajal flow pattern map [12] is a modification ofthe Steiner [14] map, which in turn is a modification of the originalTaitel and Dukler [15] map. El Hajal et al. [12] simplified the imple-mentation of the map by bringing the Rouhani and Axelsson [16]void fraction equation into the method to eliminate its iterativesolution scheme. Also, the changes proposed by Zürcher et al.[17] were implemented to ensure better prediction of the transi-tion curves from annular to stratified-wavy flow, and from strati-fied-wavy to stratified flow.
Nomenclature
A area (m2)d diameter (m)EB energy balanceFr Froude numberG mass flux (kg/m2 s)g gravitational acceleration (m/s2)h enthalpy (J/kg)k thermal conductivity (W/m K)L length of test section (m)_m mass flow (kg/s)_Q heat transferred (W)Rw wall thermal resistance (K/W)T temperature (�C)We Weber numberx vapour qualityz axial distance along test section axis (m)
Greek symbolsa heat transfer coefficient (W/m2 K)h stratification angle (rad)q density (kg/m3)
Subscriptsb bulkCu copperc convectived dimensionlessf filmH2O wateri innerIA intermittent–annular transitionin inletl liquido outerpre pre-condenserref refrigerants surfacesat saturationstrat stratifiedtest test sectiontrans transitionv vapourw wallwavy wavy transition
5702 R. Suliman et al. / International Journal of Heat and Mass Transfer 52 (2009) 5701–5711
For flow condensation, saturated vapour enters a condensertube and forms either a thin liquid film around the perimeter ofthe tube as an annular flow or a liquid layer in the bottom of thetube and a gravity-controlled condensing film around the upperperimeter as a stratified or stratified-wavy flow [12,18]. At veryhigh mass fluxes, it is also possible that the flow goes into mistflow, in which liquid droplets are entrained in a largely gaseousflow. This, however, rarely happens, and has not been studiedmuch, due to the low number of processes which encounter con-densation at such high mass fluxes [19].
Several condensation heat transfer models have been proposedover the years. However, each correlation is given with suitablevalidity ranges of parameters within which it can be used for cal-culating the heat transfer coefficient. Very few models are generaland cover the entire range of two-phase regimes. Furthermore, noaccurate analytical model exists and, therefore, it is necessary toexperiment and develop empirical correlations for practical use.The recent models of Cavallini et al. [20] and Thome et al. [18] cov-er all flow regimes. The model of Thome et al. [18] is capable ofpredicting heat transfer coefficients to within ±25%. However, thelines depicting transitions between flow regimes could occur overa mass flux range of about 50 kg/m2 s [18]. The aim of this workwas to improve the accuracy of the Thome et al. [18] flow pat-tern-based heat transfer model based on experiments within thelow-mass flux range, particularly the transition between strati-fied-wavy and annular or intermittent flow.
2. Experimental facility
The experimental facility (Fig. 1) consisted of two main sub-sys-tems: the vapour-compression cycle and the water cycles. The va-pour-compression cycle consisted of a hermetically sealed scrollcompressor with a nominal cooling capacity of 10 kW. The con-denser line split into two lines, the test line and the bypass line.Each line had its own electronic expansion valve (EEV). The testline EEV was used to control the mass flow through the test line,and the bypass EEV was used to control the test pressure. The testline comprised of four water-cooled condensers, namely a pre-con-denser to control the inlet vapour quality, a straight horizontal
tube-in-tube counterflow test heat exchanger, with water in theannulus and refrigerant on the inside, and two extra heat exchang-ers, namely the post-condenser and the sub-cooler. The post-con-denser was used to control the refrigerant state in the post-condenser, which must be saturated liquid at the exit. The bypassline had one large water-cooled heat exchanger. After the expan-sion valves, the lines combined and entered a water-heated evap-orator, followed by a suction-accumulator.
The test line was constructed of a 9.53 mm (3/8 in.) outerdiameter copper tube with an inner diameter of 8.38 mm. At theentrance of the test line, a straight calming section, 50-tube diam-eters long, was utilised to ensure fully developed flow [21]. Cylin-drical sight glasses were positioned at the inlet and exit of the testsection to act as insulators against axial conduction and also to al-low for high-speed visual images of the flow to be taken, using ahigh-speed camera. The outer-wall temperatures of the inner tubealong the 1.546 m test section were measured at seven stationsusing four T-type thermocouples per station, which were placedaround the tube perimeter. These thermocouples were solderedto the outer-wall of the inner tube. The inlet and outlet tempera-tures of the inner tube were measured before the inlet and afterthe outlet sight glasses. All of the thermocouples used in thisexperimental system were calibrated against a high-precision Pt-100 resistance temperature detector. The refrigerant mass flowwas measured using a Coriolis mass flow meter. Another section(50 diameters long) was installed at the exit to ensure that theflow in the test section and exit sight glass was not disturbed.
The oil concentration in the refrigerant was measured using theASHRAE Standard [22], and was determined as 1.8% on average.
The water cycle consisted of a hot and a cold side. The waterwas used to exchange heat with the refrigerant side at the con-densers (cold water) and the evaporator (hot water). Each heat ex-changer’s water supply rate was controlled using electronicallyactuated three-way valves, while the required pressure head wassupplied by centrifugal pumps.
The water was stored in two insulated 5000-l tanks. These twotanks shared a 70 kW heating/50 kW cooling dual function heatpump and were thermostatically-controlled between 13–17 and23–27 �C, respectively. If any of the two tanks were at the set tem-
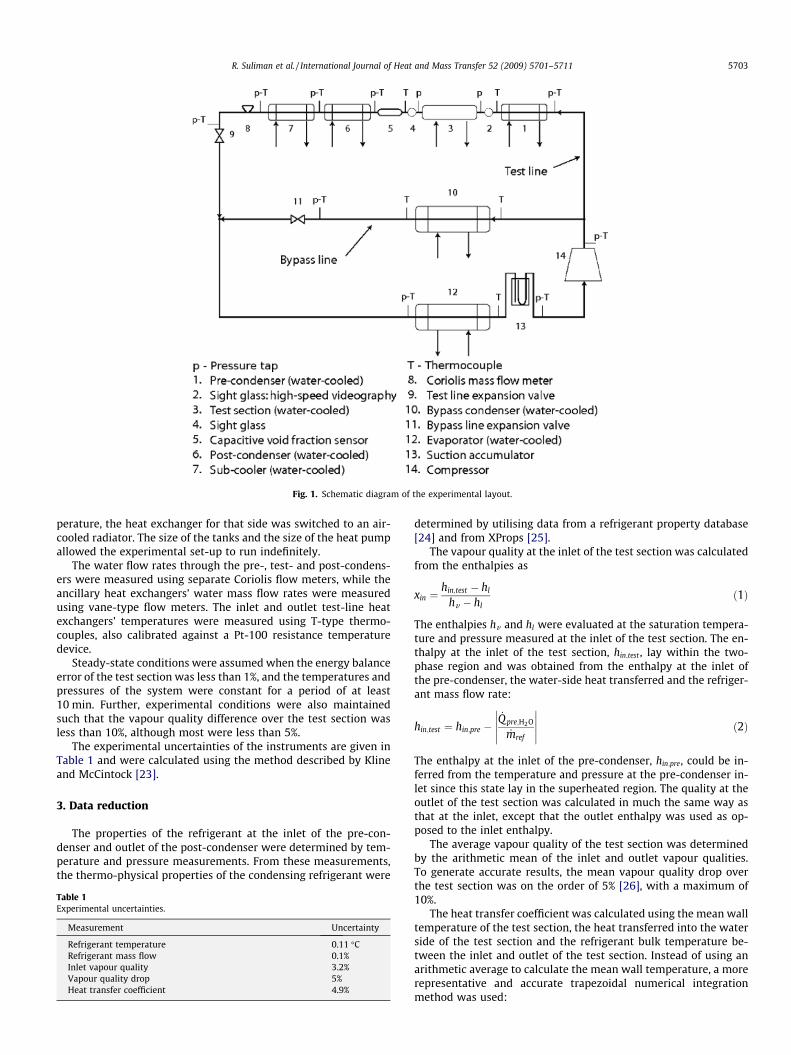
Fig. 1. Schematic diagram of the experimental layout.
R. Suliman et al. / International Journal of Heat and Mass Transfer 52 (2009) 5701–5711 5703
perature, the heat exchanger for that side was switched to an air-cooled radiator. The size of the tanks and the size of the heat pumpallowed the experimental set-up to run indefinitely.
The water flow rates through the pre-, test- and post-condens-ers were measured using separate Coriolis flow meters, while theancillary heat exchangers’ water mass flow rates were measuredusing vane-type flow meters. The inlet and outlet test-line heatexchangers’ temperatures were measured using T-type thermo-couples, also calibrated against a Pt-100 resistance temperaturedevice.
Steady-state conditions were assumed when the energy balanceerror of the test section was less than 1%, and the temperatures andpressures of the system were constant for a period of at least10 min. Further, experimental conditions were also maintainedsuch that the vapour quality difference over the test section wasless than 10%, although most were less than 5%.
The experimental uncertainties of the instruments are given inTable 1 and were calculated using the method described by Klineand McCintock [23].
3. Data reduction
The properties of the refrigerant at the inlet of the pre-con-denser and outlet of the post-condenser were determined by tem-perature and pressure measurements. From these measurements,the thermo-physical properties of the condensing refrigerant were
Table 1Experimental uncertainties.
Measurement Uncertainty
Refrigerant temperature 0.11 �CRefrigerant mass flow 0.1%Inlet vapour quality 3.2%Vapour quality drop 5%Heat transfer coefficient 4.9%
determined by utilising data from a refrigerant property database[24] and from XProps [25].
The vapour quality at the inlet of the test section was calculatedfrom the enthalpies as
xin ¼hin;test � hl
hv � hlð1Þ
The enthalpies hv and hl were evaluated at the saturation tempera-ture and pressure measured at the inlet of the test section. The en-thalpy at the inlet of the test section, hin;test , lay within the two-phase region and was obtained from the enthalpy at the inlet ofthe pre-condenser, the water-side heat transferred and the refriger-ant mass flow rate:
hin;test ¼ hin;pre �_Q pre;H2O
_mref
���������� ð2Þ
The enthalpy at the inlet of the pre-condenser, hin;pre, could be in-ferred from the temperature and pressure at the pre-condenser in-let since this state lay in the superheated region. The quality at theoutlet of the test section was calculated in much the same way asthat at the inlet, except that the outlet enthalpy was used as op-posed to the inlet enthalpy.
The average vapour quality of the test section was determinedby the arithmetic mean of the inlet and outlet vapour qualities.To generate accurate results, the mean vapour quality drop overthe test section was on the order of 5% [26], with a maximum of10%.
The heat transfer coefficient was calculated using the mean walltemperature of the test section, the heat transferred into the waterside of the test section and the refrigerant bulk temperature be-tween the inlet and outlet of the test section. Instead of using anarithmetic average to calculate the mean wall temperature, a morerepresentative and accurate trapezoidal numerical integrationmethod was used:
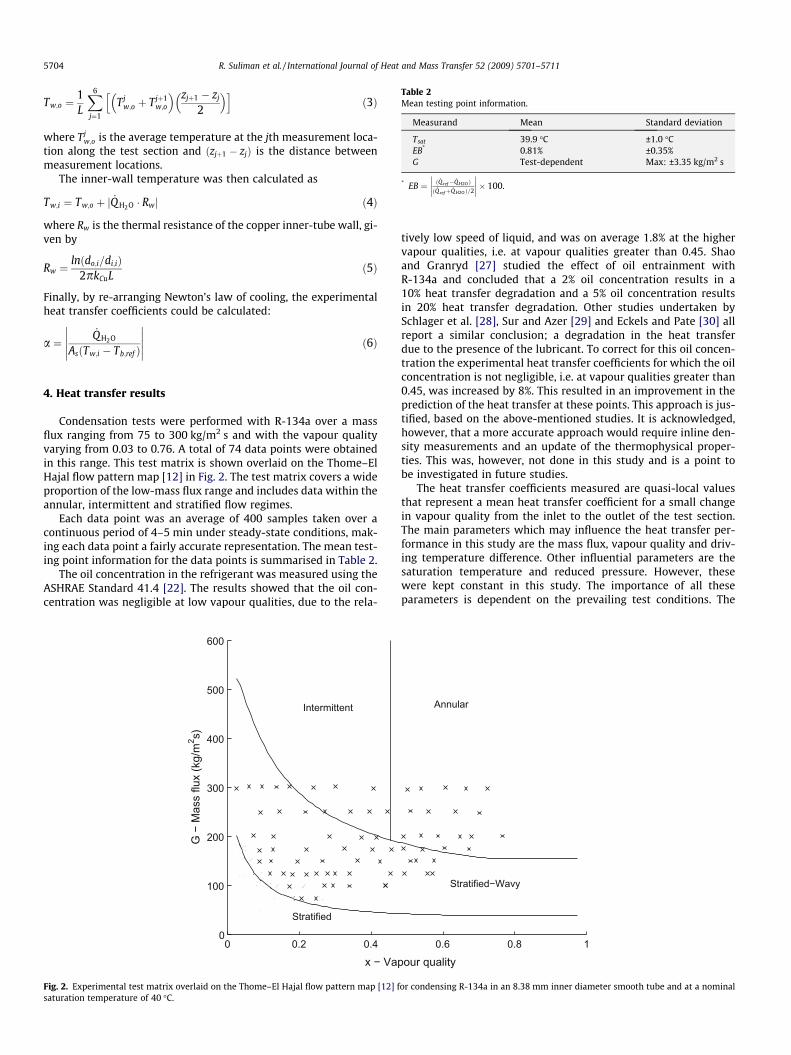
Table 2Mean testing point information.
Measurand Mean Standard deviation
Tsat 39.9 �C ±1.0 �CEB* 0.81% ±0.35%G Test-dependent Max: ±3.35 kg/m2 s
* EB ¼ ð _Qref� _QH2OÞð _Qrefþ _QH2OÞ=2
��������� 100.
5704 R. Suliman et al. / International Journal of Heat and Mass Transfer 52 (2009) 5701–5711
Tw;o ¼1L
X6
j¼1
Tjw;o þ Tjþ1
w;o
� � zjþ1 � zj
2
� �h ið3Þ
where Tjw;o is the average temperature at the jth measurement loca-
tion along the test section and ðzjþ1 � zjÞ is the distance betweenmeasurement locations.
The inner-wall temperature was then calculated as
Tw;i ¼ Tw;o þ j _Q H2O � Rwj ð4Þ
where Rw is the thermal resistance of the copper inner-tube wall, gi-ven by
Rw ¼lnðdo;i=di;iÞ
2pkCuLð5Þ
Finally, by re-arranging Newton’s law of cooling, the experimentalheat transfer coefficients could be calculated:
a ¼_QH2O
AsðTw;i � Tb;ref Þ
���������� ð6Þ
4. Heat transfer results
Condensation tests were performed with R-134a over a massflux ranging from 75 to 300 kg/m2 s and with the vapour qualityvarying from 0.03 to 0.76. A total of 74 data points were obtainedin this range. This test matrix is shown overlaid on the Thome–ElHajal flow pattern map [12] in Fig. 2. The test matrix covers a wideproportion of the low-mass flux range and includes data within theannular, intermittent and stratified flow regimes.
Each data point was an average of 400 samples taken over acontinuous period of 4–5 min under steady-state conditions, mak-ing each data point a fairly accurate representation. The mean test-ing point information for the data points is summarised in Table 2.
The oil concentration in the refrigerant was measured using theASHRAE Standard 41.4 [22]. The results showed that the oil con-centration was negligible at low vapour qualities, due to the rela-
0 0.2 0.40
100
200
300
400
500
600
x − Vap
G −
Mas
s flu
x (k
g/m
2 s)
Intermittent
Stratified
Fig. 2. Experimental test matrix overlaid on the Thome–El Hajal flow pattern map [12] fsaturation temperature of 40 �C.
tively low speed of liquid, and was on average 1.8% at the highervapour qualities, i.e. at vapour qualities greater than 0.45. Shaoand Granryd [27] studied the effect of oil entrainment withR-134a and concluded that a 2% oil concentration results in a10% heat transfer degradation and a 5% oil concentration resultsin 20% heat transfer degradation. Other studies undertaken bySchlager et al. [28], Sur and Azer [29] and Eckels and Pate [30] allreport a similar conclusion; a degradation in the heat transferdue to the presence of the lubricant. To correct for this oil concen-tration the experimental heat transfer coefficients for which the oilconcentration is not negligible, i.e. at vapour qualities greater than0.45, was increased by 8%. This resulted in an improvement in theprediction of the heat transfer at these points. This approach is jus-tified, based on the above-mentioned studies. It is acknowledged,however, that a more accurate approach would require inline den-sity measurements and an update of the thermophysical proper-ties. This was, however, not done in this study and is a point tobe investigated in future studies.
The heat transfer coefficients measured are quasi-local valuesthat represent a mean heat transfer coefficient for a small changein vapour quality from the inlet to the outlet of the test section.The main parameters which may influence the heat transfer per-formance in this study are the mass flux, vapour quality and driv-ing temperature difference. Other influential parameters are thesaturation temperature and reduced pressure. However, thesewere kept constant in this study. The importance of all theseparameters is dependent on the prevailing test conditions. The
0.6 0.8 1
our quality
Stratified−Wavy
Annular
or condensing R-134a in an 8.38 mm inner diameter smooth tube and at a nominal
R. Suliman et al. / International Journal of Heat and Mass Transfer 52 (2009) 5701–5711 5705
measured heat transfer coefficients, after correcting for oil entrain-ment, are analysed against these parameters below.
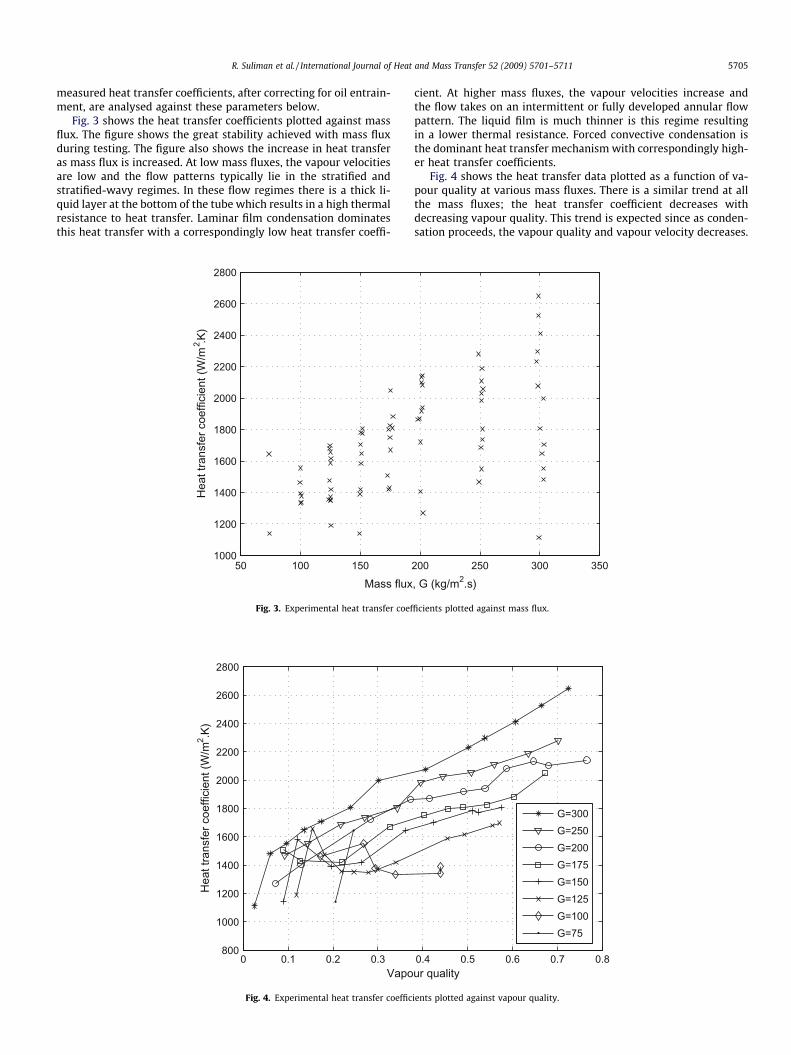
Fig. 3 shows the heat transfer coefficients plotted against massflux. The figure shows the great stability achieved with mass fluxduring testing. The figure also shows the increase in heat transferas mass flux is increased. At low mass fluxes, the vapour velocitiesare low and the flow patterns typically lie in the stratified andstratified-wavy regimes. In these flow regimes there is a thick li-quid layer at the bottom of the tube which results in a high thermalresistance to heat transfer. Laminar film condensation dominatesthis heat transfer with a correspondingly low heat transfer coeffi-
50 100 1501000
1200
1400
1600
1800
2000
2200
2400
2600
2800
Hea
t tra
nsfe
r coe
ffici
ent (
W/m
2 .K)
Mass flux
Fig. 3. Experimental heat transfer coef
0 0.1 0.2 0.3800
1000
1200
1400
1600
1800
2000
2200
2400
2600
2800
Hea
t tra
nsfe
r coe
ffici
ent (
W/m
2 .K)
Vapo
Fig. 4. Experimental heat transfer coeffic
cient. At higher mass fluxes, the vapour velocities increase andthe flow takes on an intermittent or fully developed annular flowpattern. The liquid film is much thinner is this regime resultingin a lower thermal resistance. Forced convective condensation isthe dominant heat transfer mechanism with correspondingly high-er heat transfer coefficients.
Fig. 4 shows the heat transfer data plotted as a function of va-pour quality at various mass fluxes. There is a similar trend at allthe mass fluxes; the heat transfer coefficient decreases withdecreasing vapour quality. This trend is expected since as conden-sation proceeds, the vapour quality and vapour velocity decreases.
200 250 300 350
, G (kg/m2.s)
ficients plotted against mass flux.
0.4 0.5 0.6 0.7 0.8ur quality
G=300G=250G=200G=175G=150G=125G=100G=75
ients plotted against vapour quality.
5706 R. Suliman et al. / International Journal of Heat and Mass Transfer 52 (2009) 5701–5711
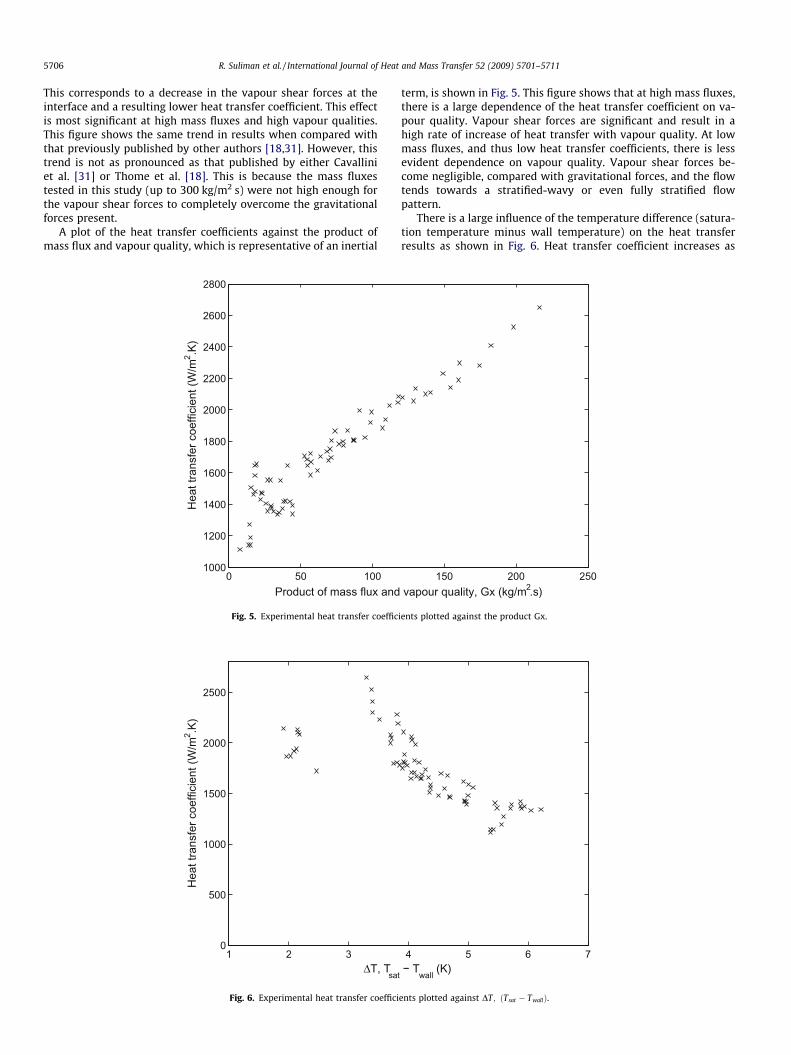
This corresponds to a decrease in the vapour shear forces at theinterface and a resulting lower heat transfer coefficient. This effectis most significant at high mass fluxes and high vapour qualities.This figure shows the same trend in results when compared withthat previously published by other authors [18,31]. However, thistrend is not as pronounced as that published by either Cavalliniet al. [31] or Thome et al. [18]. This is because the mass fluxestested in this study (up to 300 kg/m2 s) were not high enough forthe vapour shear forces to completely overcome the gravitationalforces present.
A plot of the heat transfer coefficients against the product ofmass flux and vapour quality, which is representative of an inertial
0 50 1001000
1200
1400
1600
1800
2000
2200
2400
2600
2800
Product of mass flux and
Hea
t tra
nsfe
r coe
ffici
ent (
W/m
2 .K)
Fig. 5. Experimental heat transfer coeffic
1 2 30
500
1000
1500
2000
2500
Hea
t tra
nsfe
r coe
ffici
ent (
W/m
2 .K)
ΔT, Tsat
Fig. 6. Experimental heat transfer coeffici
term, is shown in Fig. 5. This figure shows that at high mass fluxes,there is a large dependence of the heat transfer coefficient on va-pour quality. Vapour shear forces are significant and result in ahigh rate of increase of heat transfer with vapour quality. At lowmass fluxes, and thus low heat transfer coefficients, there is lessevident dependence on vapour quality. Vapour shear forces be-come negligible, compared with gravitational forces, and the flowtends towards a stratified-wavy or even fully stratified flowpattern.
There is a large influence of the temperature difference (satura-tion temperature minus wall temperature) on the heat transferresults as shown in Fig. 6. Heat transfer coefficient increases as
150 200 250 vapour quality, Gx (kg/m2.s)
ients plotted against the product Gx.
4 5 6 7 − T
wall (K)
ents plotted against DT; ðTsat � TwallÞ.
R. Suliman et al. / International Journal of Heat and Mass Transfer 52 (2009) 5701–5711 5707
the temperature difference decreases. At low mass fluxes, and thuslow heat transfer coefficients, gravity is the dominant force and thetemperature difference is the main driving mechanism. As themass flux and heat transfer coefficient is increased, there is lessdependence on the temperature difference. At even higher massfluxes (not part of this study), there will be no dependence onthe temperature difference and forced convection will be the majordriving mechanism. The results correspond to Nusselt’s falling filmtheory which predicts the heat transfer coefficient to be inverselyproportional to the temperature difference to the power 1/4 duringfilm condensation [32].
It is known that in the annular flow regime the heat transfercoefficient varies with mass flux, vapour quality and saturationtemperature (kept constant in this study) and in the stratified-wavy and fully stratified flow regimes, the heat transfer coefficientis mainly dependent on the temperature difference [33]. The aboveexperimental results show that the majority of the data are DT-dependent, thus suggesting stratified-wavy flow.
5. Comparison with leading correlations
Recent studies on condensation heat transfer have shown thatthe local flow regime strongly influences the heat and momentumtransfer processes and any accurate prediction of the two-phaseheat transfer should be based on the analysis of the prevailing flowpattern. The most recent efforts to take this into account have beenmade by Cavallini et al. [11] and Thome et al. [18] in two differentbut validated ways. Cavallini et al. [20] simplified their previousmodel with the aim of establishing an easy and ready-to-use mod-el. The measured heat transfer coefficients are compared with bothaforementioned models below.
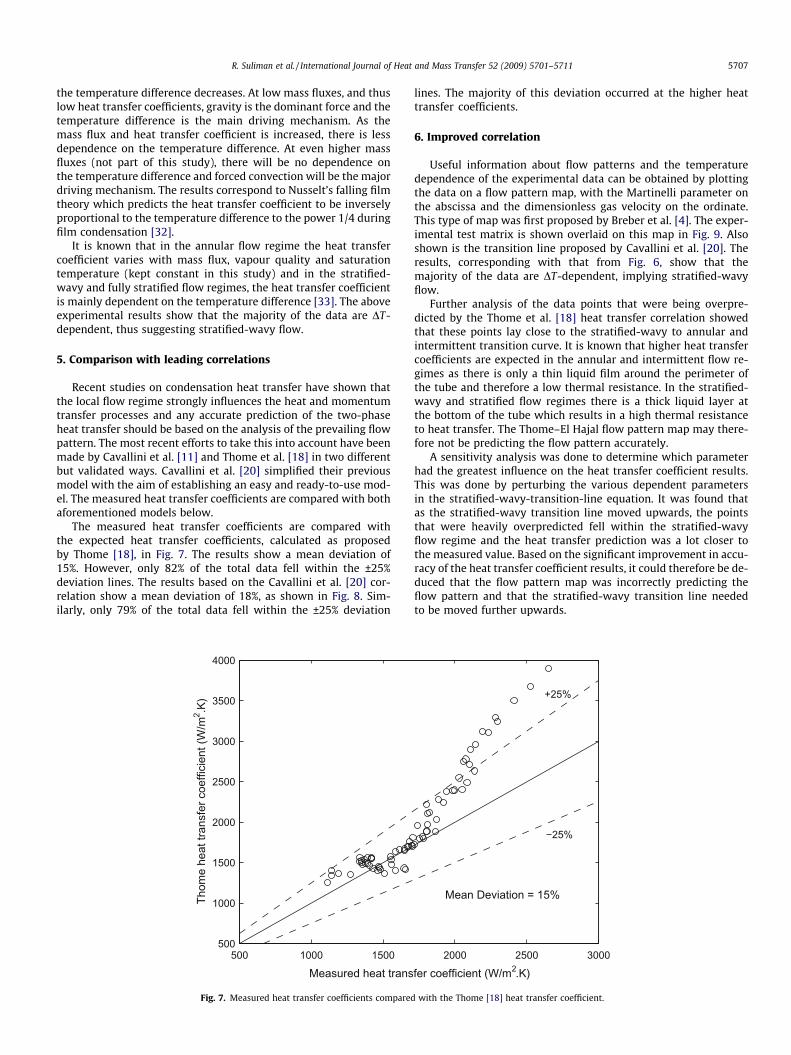
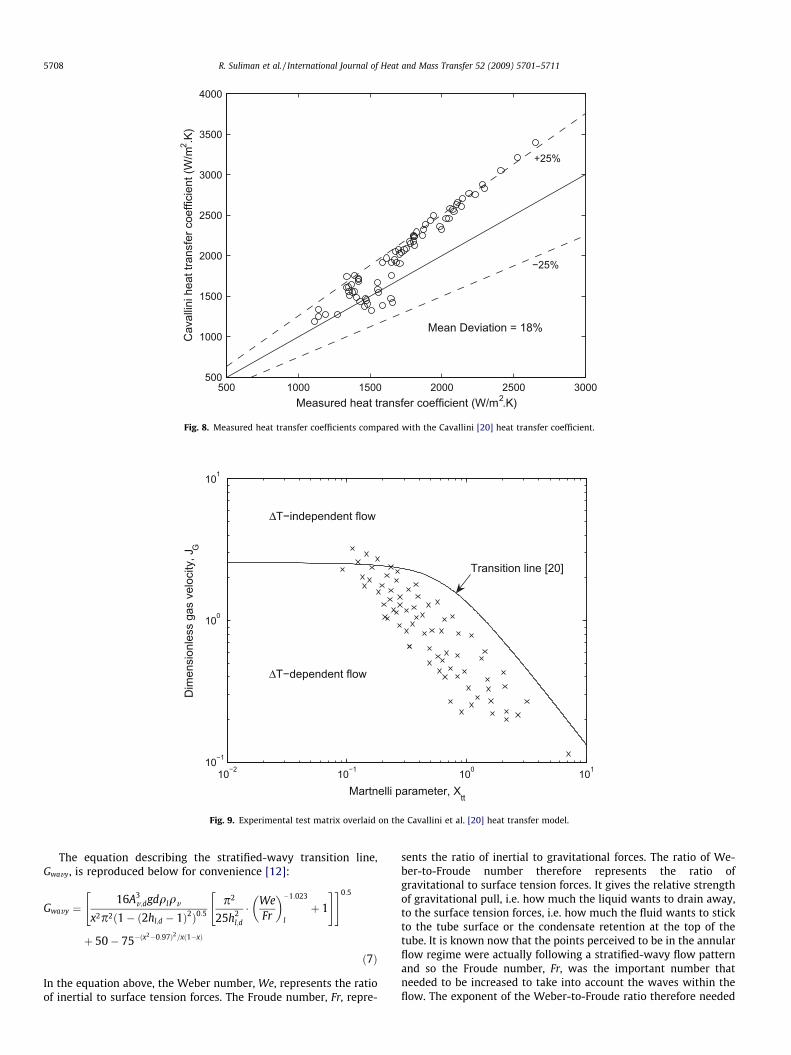
The measured heat transfer coefficients are compared withthe expected heat transfer coefficients, calculated as proposedby Thome [18], in Fig. 7. The results show a mean deviation of15%. However, only 82% of the total data fell within the ±25%deviation lines. The results based on the Cavallini et al. [20] cor-relation show a mean deviation of 18%, as shown in Fig. 8. Sim-ilarly, only 79% of the total data fell within the ±25% deviation
500 1000 1500500
1000
1500
2000
2500
3000
3500
4000
Thom
e he
at tr
ansf
er c
oeffi
cien
t (W
/m2 .K
)
Measured heat trans
Fig. 7. Measured heat transfer coefficients compared
lines. The majority of this deviation occurred at the higher heattransfer coefficients.
6. Improved correlation
Useful information about flow patterns and the temperaturedependence of the experimental data can be obtained by plottingthe data on a flow pattern map, with the Martinelli parameter onthe abscissa and the dimensionless gas velocity on the ordinate.This type of map was first proposed by Breber et al. [4]. The exper-imental test matrix is shown overlaid on this map in Fig. 9. Alsoshown is the transition line proposed by Cavallini et al. [20]. Theresults, corresponding with that from Fig. 6, show that themajority of the data are DT-dependent, implying stratified-wavyflow.
Further analysis of the data points that were being overpre-dicted by the Thome et al. [18] heat transfer correlation showedthat these points lay close to the stratified-wavy to annular andintermittent transition curve. It is known that higher heat transfercoefficients are expected in the annular and intermittent flow re-gimes as there is only a thin liquid film around the perimeter ofthe tube and therefore a low thermal resistance. In the stratified-wavy and stratified flow regimes there is a thick liquid layer atthe bottom of the tube which results in a high thermal resistanceto heat transfer. The Thome–El Hajal flow pattern map may there-fore not be predicting the flow pattern accurately.
A sensitivity analysis was done to determine which parameterhad the greatest influence on the heat transfer coefficient results.This was done by perturbing the various dependent parametersin the stratified-wavy-transition-line equation. It was found thatas the stratified-wavy transition line moved upwards, the pointsthat were heavily overpredicted fell within the stratified-wavyflow regime and the heat transfer prediction was a lot closer tothe measured value. Based on the significant improvement in accu-racy of the heat transfer coefficient results, it could therefore be de-duced that the flow pattern map was incorrectly predicting theflow pattern and that the stratified-wavy transition line neededto be moved further upwards.
2000 2500 3000
fer coefficient (W/m2.K)
−25%
+25%
Mean Deviation = 15%
with the Thome [18] heat transfer coefficient.
500 1000 1500 2000 2500 3000500
1000
1500
2000
2500
3000
3500
4000
Cav
allin
i hea
t tra
nsfe
r coe
ffici
ent (
W/m
2 .K)
Measured heat transfer coefficient (W/m2.K)
−25%
+25%
Mean Deviation = 18%
Fig. 8. Measured heat transfer coefficients compared with the Cavallini [20] heat transfer coefficient.
10−2 10−1 100 10110−1
100
101
Dim
ensi
onle
ss g
as v
eloc
ity, J
G
Martnelli parameter, Xtt
ΔT−dependent flow
ΔT−independent flow
Transition line [20]
Fig. 9. Experimental test matrix overlaid on the Cavallini et al. [20] heat transfer model.
5708 R. Suliman et al. / International Journal of Heat and Mass Transfer 52 (2009) 5701–5711
The equation describing the stratified-wavy transition line,Gwavy, is reproduced below for convenience [12]:
Gwavy ¼16A3
v;dgdqlqv
x2p2ð1� ð2hl;d � 1Þ2Þ0:5p2
25h2l;d
� WeFr
� ��1:023
lþ 1
" #" #0:5
þ 50� 75�ðx2�0:97Þ2=xð1�xÞ
ð7Þ
In the equation above, the Weber number, We, represents the ratioof inertial to surface tension forces. The Froude number, Fr, repre-
sents the ratio of inertial to gravitational forces. The ratio of We-ber-to-Froude number therefore represents the ratio ofgravitational to surface tension forces. It gives the relative strengthof gravitational pull, i.e. how much the liquid wants to drain away,to the surface tension forces, i.e. how much the fluid wants to stickto the tube surface or the condensate retention at the top of thetube. It is known now that the points perceived to be in the annularflow regime were actually following a stratified-wavy flow patternand so the Froude number, Fr, was the important number thatneeded to be increased to take into account the waves within theflow. The exponent of the Weber-to-Froude ratio therefore needed
R. Suliman et al. / International Journal of Heat and Mass Transfer 52 (2009) 5701–5711 5709
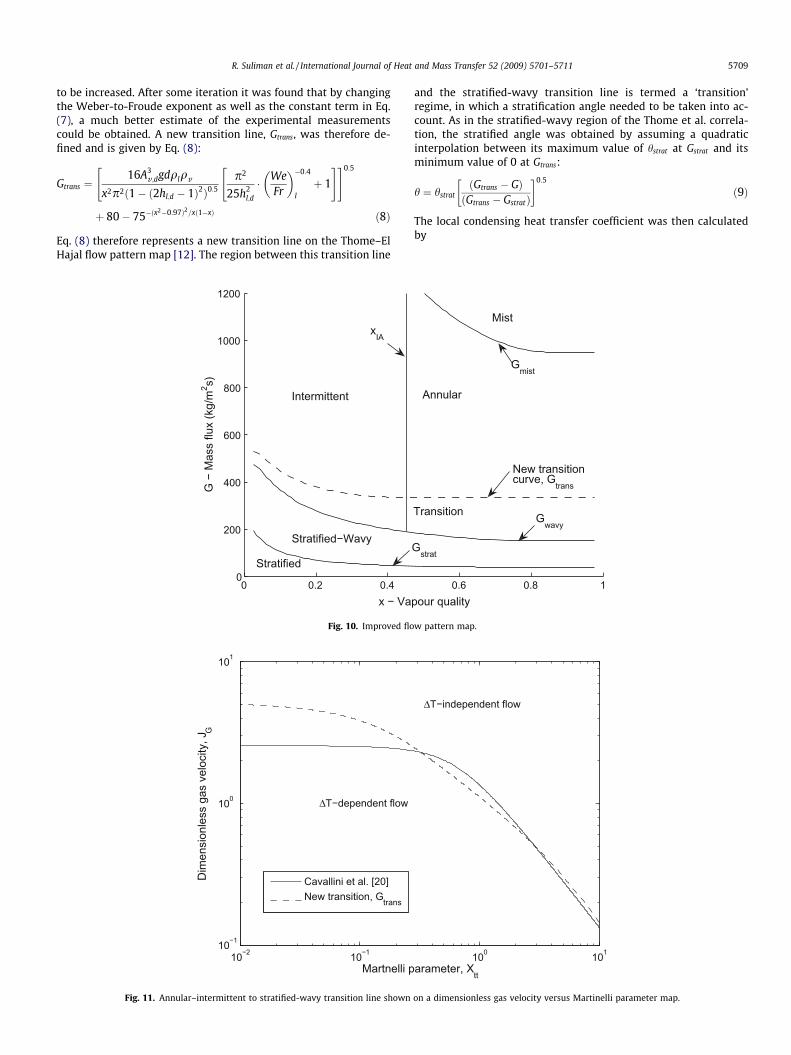
to be increased. After some iteration it was found that by changingthe Weber-to-Froude exponent as well as the constant term in Eq.(7), a much better estimate of the experimental measurementscould be obtained. A new transition line, Gtrans, was therefore de-fined and is given by Eq. (8):
Gtrans ¼16A3
v;dgdqlqv
x2p2ð1� ð2hl;d � 1Þ2Þ0:5p2
25h2l;d
� WeFr
� ��0:4
l
þ 1
" #" #0:5
þ 80� 75�ðx2�0:97Þ2=xð1�xÞ ð8Þ
Eq. (8) therefore represents a new transition line on the Thome–ElHajal flow pattern map [12]. The region between this transition line
0 0.2 0.40
200
400
600
800
1000
1200
x − Va
G −
Mas
s flu
x (k
g/m
2 s)
Stratified−Wavy
Intermittent
Stratified
xIA
Fig. 10. Improved flo
10−2 10−110−1
100
101
Dim
ensi
onle
ss g
as v
eloc
ity, J
G
Martnelli p
Cavallini et al. [20]New transition, Gtrans
ΔT−dependent flow
Fig. 11. Annular–intermittent to stratified-wavy transition line shown
and the stratified-wavy transition line is termed a ‘transition’regime, in which a stratification angle needed to be taken into ac-count. As in the stratified-wavy region of the Thome et al. correla-tion, the stratified angle was obtained by assuming a quadraticinterpolation between its maximum value of hstrat at Gstrat and itsminimum value of 0 at Gtrans:
h ¼ hstratðGtrans � GÞðGtrans � GstratÞ
� �0:5
ð9Þ
The local condensing heat transfer coefficient was then calculatedby
0.6 0.8 1pour quality
Transition
Mist
Annular
Gwavy
New transitioncurve, G
trans
Gstrat
Gmist
w pattern map.
100 101
arameter, Xtt
ΔT−independent flow
on a dimensionless gas velocity versus Martinelli parameter map.
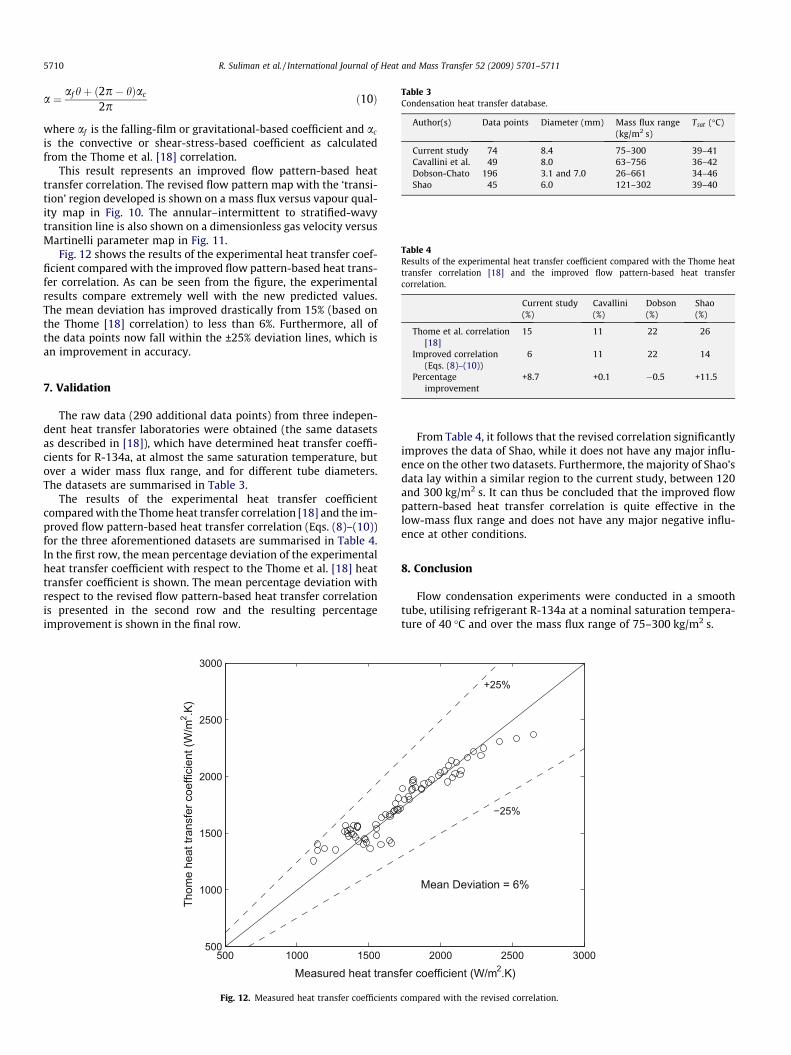
Table 3Condensation heat transfer database.
Author(s) Data points Diameter (mm) Mass flux range(kg/m2 s)
Tsat (�C)
Current study 74 8.4 75–300 39–41Cavallini et al. 49 8.0 63–756 36–42Dobson-Chato 196 3.1 and 7.0 26–661 34–46Shao 45 6.0 121–302 39–40
Table 4Results of the experimental heat transfer coefficient compared with the Thome heattransfer correlation [18] and the improved flow pattern-based heat transfercorrelation.
Current study(%)
Cavallini(%)
Dobson(%)
Shao(%)
Thome et al. correlation[18]
15 11 22 26
Improved correlation 6 11 22 14
5710 R. Suliman et al. / International Journal of Heat and Mass Transfer 52 (2009) 5701–5711
a ¼ af hþ ð2p� hÞac
2pð10Þ
where af is the falling-film or gravitational-based coefficient and ac
is the convective or shear-stress-based coefficient as calculatedfrom the Thome et al. [18] correlation.
This result represents an improved flow pattern-based heattransfer correlation. The revised flow pattern map with the ‘transi-tion’ region developed is shown on a mass flux versus vapour qual-ity map in Fig. 10. The annular–intermittent to stratified-wavytransition line is also shown on a dimensionless gas velocity versusMartinelli parameter map in Fig. 11.
Fig. 12 shows the results of the experimental heat transfer coef-ficient compared with the improved flow pattern-based heat trans-fer correlation. As can be seen from the figure, the experimentalresults compare extremely well with the new predicted values.The mean deviation has improved drastically from 15% (based onthe Thome [18] correlation) to less than 6%. Furthermore, all ofthe data points now fall within the ±25% deviation lines, which isan improvement in accuracy.
(Eqs. (8)–(10))Percentage
improvement+8.7 +0.1 �0.5 +11.5
7. Validation
The raw data (290 additional data points) from three indepen-dent heat transfer laboratories were obtained (the same datasetsas described in [18]), which have determined heat transfer coeffi-cients for R-134a, at almost the same saturation temperature, butover a wider mass flux range, and for different tube diameters.The datasets are summarised in Table 3.
The results of the experimental heat transfer coefficientcompared with the Thome heat transfer correlation [18] and the im-proved flow pattern-based heat transfer correlation (Eqs. (8)–(10))for the three aforementioned datasets are summarised in Table 4.In the first row, the mean percentage deviation of the experimentalheat transfer coefficient with respect to the Thome et al. [18] heattransfer coefficient is shown. The mean percentage deviation withrespect to the revised flow pattern-based heat transfer correlationis presented in the second row and the resulting percentageimprovement is shown in the final row.
500 1000 1500500
1000
1500
2000
2500
3000
Thom
e he
at tr
ansf
er c
oeffi
cien
t (W
/m2 .K
)
Measured heat trans
Fig. 12. Measured heat transfer coefficients
From Table 4, it follows that the revised correlation significantlyimproves the data of Shao, while it does not have any major influ-ence on the other two datasets. Furthermore, the majority of Shao’sdata lay within a similar region to the current study, between 120and 300 kg/m2 s. It can thus be concluded that the improved flowpattern-based heat transfer correlation is quite effective in thelow-mass flux range and does not have any major negative influ-ence at other conditions.
8. Conclusion
Flow condensation experiments were conducted in a smoothtube, utilising refrigerant R-134a at a nominal saturation tempera-ture of 40 �C and over the mass flux range of 75–300 kg/m2 s.
2000 2500 3000
fer coefficient (W/m2.K)
−25%
+25%
Mean Deviation = 6%
compared with the revised correlation.

R. Suliman et al. / International Journal of Heat and Mass Transfer 52 (2009) 5701–5711 5711
The experimental heat transfer coefficients, when analysedagainst mass flux, vapour quality and temperature difference,showed that the majority of the data are DT-dependent, implyingstratified-wavy flow. When compared with the Thome et al. [18]correlation, the heat transfer coefficients showed a mean deviationof 15%. However, a large deviation in results occurred at the higherheat transfer coefficients, where 18% of the data points were over-predicted. Most of these datapoints were found to be in the annularand intermittent regimes.
An improved flow pattern map with a ‘transition’ region be-tween stratified-wavy and annular or intermittent flows wasdeveloped. The revised correlation improved the results to a meandeviation of less than 6%, with all of the data points falling withinthe ±25% deviation lines. The improved correlation was also testedwith data from three international heat transfer laboratories. It re-sulted in a significant improvement in one of the laboratories’ re-sults and it did not have any negative effect on the other results.Overall, the revised flow pattern-based heat transfer correlationimproves the prediction of heat transfer within the low-mass fluxrange.
Acknowledgements
Mr. Marcel Christians and Mr. Eugene van Rooyen designed andbuilt the experimental facility for their master’s studies and theauthors also greatly appreciate their guidance and assistancethroughout this project.
Special thanks go to Professor John Thome for supplying datafrom other international laboratories.
References
[1] J.R. Thome, Boiling of new refrigerants: a state-of-the-art review, Int. J. Refrig.19 (7) (1996) 435–457.
[2] L. Liebenberg, A.E. Bergles, J.P. Meyer, A review of refrigerant condensation inhorizontal micro-fin tubes, in: Proceedings of the ASME Advanced EnergySystems Division, 2001, pp. 155–168.
[3] L. Liebenberg, J.P. Meyer, Refrigerant condensation flow regimes in enhancedtubes and their effect on heat transfer coefficients and pressure drops, HeatTransfer Eng. 29 (6) (2008) 506–520.
[4] G. Breber, J.W. Palen, J. Taborek, Prediction of horizontal tube-sidecondensation of pure components using flow regime criteria, J. Heat Transfer102 (3) (1980) 471–476.
[5] T.N. Tandon, H.K. Varma, C.P. Gupta, A new flow regime map for condensationinside horizontal tubes, J. Heat Transfer 104 (N4) (1982) 763–768.
[6] N. Kattan, J.R. Thome, D. Favrat, Measurement and prediction of two-phaseflow patterns for new refrigerants inside horizontal tubes, ASHRAE Trans. 101(1995) 1251–1257.
[7] N. Kattan, J.R. Thome, D. Favrat, Boiling of R-134a and R-123 in a microfin tube,in: Proceedings of the 19th Int. Congr. of Refrigeration, The Hague,Netherlands, 1995, pp. 337–344.
[8] N. Kattan, J.R. Thome, D. Favrat, Flow boiling in horizontal tubes. Part 1:Development of a diabatic two-phase flow pattern map, J. Heat Transfer 120(1) (1998) 140–147.
[9] N. Kattan, J.R. Thome, D. Favrat, Flow boiling in horizontal tubes. Part 3:Development of a new heat transfer model based on flow patterns, J. HeatTransfer 120 (1) (1998) 156–165.
[10] D.W. Shao, E. Granryd, Flow pattern, heat transfer and pressure drop in flowcondensation; Part I: Pure and azeotropic refrigerants, Int. J. HVAC&R Res. 6 (2)(2000) 175–195.
[11] A. Cavallini, G. Censi, D. Del Col, L. Doretti, G.A. Longo, L. Rossetto, In-tubecondensation of halogenated refrigerants, ASHRAE Trans. 108 (2002)146–161.
[12] J. El Hajal, J.R. Thome, A. Cavallini, Condensation in horizontal tubes, part 1:two-phase flow pattern map, Int. J. Heat Mass Transfer 46 (18) (2003) 3349–3363.
[13] J.G. Collier, J.R. Thome, Convective Boiling and Condensation, Clarendon Press,Oxford, 1994.
[14] D. Steiner, Heat transfer to boiling saturated liquids, in: Verein DeutscherIngenieure (Ed.), VDI-Warmeatlas (VDI Heat Atlas), VDI-GesellschaftVerfahrenstechnik und Chemieingenieurswesen (GCV), Düsseldorf, 1993.
[15] Y. Taitel, A.E. Dukler, A model for predicting flow regime transitions inhorizontal and near-horizontal gas–liquid flow, Am. Inst. Chem. Eng. (AIChE) J.22 (1) (1976) 47–55.
[16] S.Z. Rouhani, E. Axelsson, Calculation of volume void fraction in the subcooledand quality region, Int. J. Heat Mass Transfer 13 (2) (1970) 383–393.
[17] O. Zürcher, J.R. Thome, D. Favrat, Evaporation of ammonia in a smoothhorizontal tube: heat transfer measurements and predictions, J. Heat Transfer121 (1) (1999) 89–101.
[18] J.R. Thome, J. El Hajal, A. Cavallini, Condensation in horizontal tubes, part 2:new heat transfer model based on flow regimes, Int. J. Heat Mass Transfer 46(18) (2003) 3365–3387.
[19] J.R. Thome, Update on advances in flow pattern based two-phase heat transfermodels, Exp. Therm. Fluid Sci. 29 (3) (2005) 341–349.
[20] A. Cavallini, D.D. Col, L. Doretti, M. Matkovic, L. Rosetto, C. Zilio, Condensationin horizontal smooth tubes: a new heat transfer model for heat exchangerdesign, Heat Transfer Eng. 27 (8) (2006) 31–38.
[21] K. Cho, S.J. Tae, Condensation heat transfer for R-22 and R-407C refrigerant–oilmixtures in a microfin tube with a U-bend, Int. J. Heat Mass Transfer 44 (11)(2001) 2043–2051.
[22] ASHRAE, ASHRAE Standard 41.4: method for measurement of proportion oflubricant in liquid refrigerant, American Society for Heating, Refrigeration, andAir-conditioning Engineers, 2006.
[23] S.J. Kline, F.A. McCintock, Describing uncertainties in single-sampleexperiments, Mech. Eng. 75 (1953) 3–8.
[24] REFPROP, NIST thermodynamic properties of refrigerants and refrigerantmixtures (REFPROP), Version 8.0, NIST Standard Reference Database 23,National Institute of Standards and Technology, Gaithersburg, MD, 2005.
[25] XProps, Thermal Analysis Partners, University of Maryland, MD, 2006.Available from: <http://www.thermalanalysispartners.com>.
[26] J.A. Olivier, L. Liebenberg, J.R. Thome, J.P. Meyer, Heat transfer, pressure drop,and flow pattern recognition during condensation inside smooth, helicalmicro-fin and herringbone tubes, Int. J. Refrig. 30 (4) (2007) 609–623.
[27] D.W. Shao, E. Granryd, Heat transfer and pressure drop of R-134a–oil mixturesin a horizontal condensing tube, Int. J. Refrig. 18 (8) (1995) 524–533.
[28] L.M. Schlager, M.B. Pate, A.E. Bergles, Evaporation and condensation ofrefrigerant–oil mixtures in a smooth tube and micro-fin tube, ASHRAE Trans.94 (1988) 149–166.
[29] B. Sur, N.Z. Azer, Effect of oil on heat transfer and pressure drop duringcondensation of refrigerant-113 inside smooth and internally finned tubes,ASHRAE Trans. 97 (1991) 365–373.
[30] S.J. Eckels, M.B. Pate, In-tube evaporation and condensation of refrigerant–lubricant mixtures of HFC134a and CFC12, ASHRAE Trans. 97 (1991)62–70.
[31] A. Cavallini, D. Del Col, G.A. Longo, L. Rossetto, Experimental investigation oncondensation heat transfer and pressure drop of new HFC refrigerants (R134a,R125, R32, R410A, R236ea) in a horizontal tube, Int. J. Refrig. 24 (1) (2001) 73–87.
[32] W. Nusselt, Die oberachenkondensation des wasserdampfes, Z. Ver. Dt. Ing. 60(1916) 541–546. 569–575.
[33] A. Cavallini, G. Censi, D. Del Col, L. Doretti, G.A. Longo, L. Rossetto, C. Zilio,Condensation inside and outside smooth and enhanced tubes – a review ofrecent research, Int. J. Refrig. 26 (4) (2003) 373–392.
Copyright © 2022 FDOKUMEN