Quartet condensation and isovector pairing correlations in N=Z nuclei
Upload
khangminh22Category
view
1download
0
Chapter 12
Condensation and Boiling
INTRODUCTION
It should be noted that phase-change processes involve changes (sometimes signifi-cantly) in density, viscosity, heat capacity, and thermal conductivity of the fluid inquestion. The heat transfer process and the applicable heat transfer coefficients forboiling and condensation is more involved and complicated than that for a single-phase process. It is therefore not surprising that most real-world applications involvingboiling and condensation require the use of empirical correlations.
The transfer of heat, which accompanies a change of phase, is often characterizedby high rates. Heat fluxes as high as 50 million Btu/h . ft2 have been obtained in someboiling systems. This mechanism of transferring heat has become important in rockettechnology and nuclear-reactor design where large quantities of heat are usually pro-duced in confined spaces. Although condensation rates have not reached a similarmagnitude, heat transfer coefficients for condensation as high as 20,000 Btu/h . ft2 .
8F have been reported in the literature.(1) Due to the somewhat complex nature ofthese two phenomena, simple pragmatic calculations and numerical details are pro-vided later in this chapter.
This chapter addresses phenomena associated with the change in phase of a fluid.The processes almost always occur at a solid–liquid interface and are referred to asboiling and condensation. The change from liquid to vapor due to boiling occursbecause of heat transfer from the solid surface; alternatively, condensation of vaporto liquid occurs due to heat transfer to the solid surface.
Phase changes of substances can only occur if heat transfer is involved in the pro-cess. The phase change processes that arise include:
1. Boiling (or evaporation)
2. Condensation
3. Melting (or thawing)
4. Freezing (or fusion)
5. Sublimation.
Heat Transfer Applications for the Practicing Engineer. Louis Theodore# 2011 John Wiley & Sons, Inc. Published 2011 by John Wiley & Sons, Inc.
201

The corresponding heat of transformation arising during these processes are:
1. Enthalpy of vaporization (or condensation)
2. Enthalpy of fusion (or melting)
3. Enthalpy of sublimation.
These common phase change operations are listed in Table 12.1. Other phase changesbesides these are possible. During any phase change, it is usual (but not necessary) tohave heat transfer without an accompanying change in temperature.
The applications of phase change involving heat transfer are numerous andinclude utility units where water is boiled, evaporators in refrigeration systemswhere a refrigerant may be either vaporized or boiled, or both, and condensers thatare used to cool vapors to liquids. For example, in a power cycle, pressurized liquidis converted to vapor in a boiler. After expansion in a turbine, the vapor is restoredto its liquid state in a condenser; it is then pumped to the boiler to repeat the cycle.Evaporators, in which the boiling process occurs, and condensers are also essentialcomponents in vapor-compression refrigeration cycles. Thus, the practicing engineerneeds to be familiar with phase change processes.
Applications involving the solidification or melting of materials are also impor-tant. Typical examples include the making of ice, freezing of foods, freeze-drying pro-cesses, solidification and melting of metals, and so on. The freezing of food and otherbiological matter usually involves the removal of energy in the form of both sensibleheat (enthalpy) and latent heat of freezing. A large part of biological matter is liquidwater, which has a latent enthalpy of freezing, hsf, of approximately 335 kJ/kg (144Btu/lb or 80 cal/g). When meat is frozen from room temperature, it is typicallyplaced in a freezer at 2308C, which is considerably lower than the freezing point.The sensible heat to cool any liquids from the initial temperature to the freezingpoint is first removed, followed by the latent heat, hsf, to accomplish the actual freez-ing. Once frozen, the substance is often cooled further by removing some sensible heatof the solid.
Dimensionless parameters arise in boiling and condensation. The Nusselt andPrandtl numbers, presented earlier in convection analyses appear once again. Thenew dimensionless parameters are the Jakob number, Ja, the Bond (no relation toJames) number, Bo, and the condensation number, Co. The Jakob number is theratio of the maximum sensible energy absorbed by the liquid (vapor) to the latentenergy absorbed by the liquid (vapor). However, in many applications, the sensible
Table 12.1 Phase Change Operations
Process Description
Solidification Change from liquid to solidMelting Change from solid to liquidBoiling Change from liquid to vaporCondensation Change from vapor to liquidSublimation Change from solid to vapor
202 Chapter 12 Condensation and Boiling

energy is much less than the latent energy and Ja has a small numerical value. TheBond number is the ratio of the buoyancy force to the surface tension force andfinds application in some nucleate boiling equations. The condensation number, asone might suppose, is employed in condensation calculations.
ILLUSTRATIVE EXAMPLE 12.1
It was noted earlier in the section that “other phase changes besides these are possible” (seeTable 12.1). Provide an example of a solid-to-solid phase change.
SOLUTION: Iron–carbon undergoes a solid-to-solid phase change at a temperatureof 7278C. B
The objectives of this chapter are to develop an understanding of the physical con-ditions associated with boiling and condensation and to provide a basis for performingrelated heat transfer calculations. The remaining chapter contents are highlighted withfour sections:
Condensation Fundamentals
Condensation Principles
Boiling Fundamentals
Boiling Principles
CONDENSATION FUNDAMENTALS
Although several earlier chapters dealt with situations in which the fluid mediumremained in a single phase, a significant number of real-world engineering appli-cations involve a phase change that occurs simultaneously with the heat transferprocess. As discussed earlier, the process of condensation of a vapor is usuallyaccomplished by allowing it to come into contact with a surface where the temperatureis maintained at a value lower than the saturation temperature of the vapor for thepressure at which it exists. The removal of thermal energy from the vapor causes itto lose its latent heat of vaporization and, hence, to condense onto the surface.
The appearance of the liquid phase on the cooling surface, either in the form ofindividual drops or in the form of a continuous film, offers resistance to the removalof heat from the vapor. In most applications, the condensate is removed by the actionof gravity. As one would expect, the rate of removal of condensate (and the rate of heatremoval from the vapor) is greater for vertical surfaces than for horizontal surfaces.Most condensing equipment consists of an assembly of tubes around which thevapor to be condensed is allowed to flow. The cool temperature of the outer tubesurface is maintained by circulating a colder medium, often water, through theinside of the tube.
Condensation Fundamentals 203

There are primarily three types of condensation processes:
1. Surface Condensation. This type of condensation occurs when vapor is incontact with a cool surface. This process is common in industrial applicationsand is discussed below.
2. Homogeneous Condensation. Homogeneous condensation occurs when thevapor condenses out as droplets in the gas phase.
3. Direct Contact Condensation. This process occurs when vapor is in contactwith a cold liquid.
Surface condensation may occur in one of two modes depending upon theconditions of the surface.
1. Film Condensation. When the surface is clean and uncontaminated, the con-densed vapor forms a liquid film that covers the entire condensing surface;this film contributes an additional resistance to heat transfer.
2. Dropwise Condensation. When the surface is coated with a substance thatinhibits wetting, the condensed vapor forms drops in cracks and cavities onthe surface. The drops often grow and coalesce and “drop” from the surfaceavailable for heat transfer. Thus, the additional resistance to heat transfercan be either reduced or eliminated. Up to 90% of the surface can be coveredby drops. This topic receives a superficial treatment later in the chapter, withfilm condensation receiving the bulk of the analysis.
Liquid condensate provides resistance to heat transfer between the vapor and thesurface. This resistance naturally increases as the thickness of the condensate laterincreases. For design purposes, it is usually desirable to have the condensationoccur on surfaces that discourage the formation of thick liquid layers (e.g., short ver-tical surfaces or horizontal cylinders, or tube bundles, through which a coolant liquidflows). Dropwise condensation has a lower thermal resistance (and therefore a higherheat transfer rate) than filmwise condensation. In industrial practice, surface coatingsthat inhibit wetting are often used. Examples of such coatings include Teflon, sili-cones, waxes, and fatty acids. The drawback is that these coatings lose their effective-ness over time, which results in the condensation mode eventually changing fromdropwise to filmwise. Obviously, all other things being equal, dropwise condensationis preferred to film condensation. In fact, steps are often put in place to induce this“dropwise” effect on heat transfer surfaces.
Finally, it should be noted that the local heat transfer coefficient varies along a flatsurface and along the length of a vertical tube and around the perimeter of a horizontaltube (i.e., the local coefficient of heat transfer for a vapor condensing in a horizontaltube is a function of position, just like a vertical tube). As one would suppose, the high-est coefficient is located at the top of a tube where the condensate film is thinnest. Thecondensing temperature in the application of the equations to be presented in the nextsection involving film coefficients is taken as the temperature at the vapor–liquidinterface.
204 Chapter 12 Condensation and Boiling

Phase Equilibrium(2)
The degrees of freedom, F, or the variance of a system is defined as the smallestnumber of independent variables (such as pressure, temperature, concentration) thatmust be specified in order to completely define (the remaining variables of) thesystem. The significance of the degrees of freedom of a system may be drawn fromthe following examples. In order to specify the density of gaseous (vapor) steam, itis necessary to state both the temperature and pressure to which this density corre-sponds. For example, the density of steam has a particular value at 1508C and 1atm pressure. A statement of this density at 1508C without mention of pressure doesnot clearly define the state of the steam, for at 1508C the steam may exist at manyother possible pressures. Similarly, mention of the pressure without the temperatureleaves ambiguity. Therefore, for the complete description of the state of the steam,two variables must be given, and this phase, when present alone in a system, possessestwo degrees of freedom, or the system is said to be bivariant. When liquid water andsteam exist in equilibrium, however, the temperature and the densities of the phases aredetermined only by the pressure, and a statement of some arbitrary value of the latter issufficient to define all the other variables. The same applies to the choice of tempera-ture as the independent variable. At each arbitrarily chosen temperature (within therange of existence of the two phases), equilibrium is possible only at a given pressure,and once again the system is defined in terms of one variable. Under these conditions,the system possesses only one degree of freedom or it is monovariant.
There is a definite relation in a system between the number of degrees of freedom,the number of components, and the number of phases present. This relationship wasfirst established by J. Willard Gibbs in 1876.(3) This relation, known as the GibbsPhase Rule, is a principle of the widest generality. It is one of the most often usedrules in thermodynamic analyses, particularly in the representation of equilibriumconditions existing in heterogeneous systems.
To arrive at a mathematical description of the phase rule, consider a system of Ccomponents in which P phases are present. The problem is to determine the totalnumber of variables upon which such a system depends. First, the state of thesystem will depend upon the pressure and the temperature. Again, in order to definethe composition of each phase, it is necessary to specify the concentration of C 2 1constituents of the phase, the concentration of the remaining component being deter-mined by difference. Since there are P phases, the total number of concentration vari-ables will be P(C 2 1), and these along with the temperature and pressure constitute atotal of [P(C 2 1) þ 2] variables.
Recall from algebra that when a system possesses n independent variables, n inde-pendent equations are necessary in order to solve for the value of each of these.Similarly, in order to define the [P(C 2 1) þ 2] variables of a system, this numberof equations relating these variables would have to be available. The next questionis then: How many equations involving these variables can possibly be written fromthe conditions describing the system? To answer this, recourse must be had to thermo-dynamics. Equilibrium thermodynamic principles makes it possible to write one
Condensation Fundamentals 205

equation among the variables for each constituent distributed between any twophases.(2) When P phases are present, P 2 1 equations are available for each constitu-ent, and for C constituents a total of C(P 2 1) equations arise. If this number ofequations is equal to the number of variables, the system is completely defined.However, this will generally not be the case, and the number of variables willexceed the number of equations by F, where
F ¼ number of variables � number of equations
¼ [P(C � 1)þ 2]� [C(P� 1)]
¼ C � Pþ 2 (12:1)
Equation (12.1) is the celebrated Gibbs Phase Rule (GPR). The F term is the number ofdegrees of freedom of a system and provides the number of variables whose valuesmust be specified (arbitrarily) before the state of the system can be completely andunambiguously characterized. According to the phase rule, the number of degreesof freedom of a system whose pressure and temperature are specified is thereforegiven by the difference between the number of components and the number ofphases present (i.e., by C 2 P).
It is assumed in the above derivation that each component is present in everyphase. If a component is missing from a particular phase, however, the number of con-centration variables is decreased by one. But, at the same time, the number of possibleequations is also decreased by one. Hence the value of C 2 P, and therefore F, remainsthe same whether each constituent is present in every phase or not. This effectivelymeans that the phase rule is not restricted by this assumption and is generally validunder all conditions of distribution provided that equilibrium exists in the system.
The simplest case of GPR is one in which only a single component in a singlephase is present, as with ice or steam. When more than one component and/orphase is present in a system, the number of degrees of freedom correspondinglyincreases in accordance with Equation (12.1). Most (but not all) of the applicationsin this chapter involve one-component one-phase systems.
ILLUSTRATIVE EXAMPLE 12.2
Calculate the number of degrees of freedom for a one-component, one-phase system.
SOLUTION: Refer to Equation (12.1)
F ¼ C � Pþ 2
Since C ¼ 1 and P ¼ 1,
F ¼ 1� 1þ 2
¼ 2
Thus, two independent variables must be specified to completely define the system. B
206 Chapter 12 Condensation and Boiling

From a thermodynamic point-of-view, condensation of a condensable vapor in acondensable vapor–noncondensable vapor mixture can be induced by either increas-ing the pressure or decreasing the temperature, or both. Condensation most oftenoccurs when a vapor mixture contacts a surface at a temperature lower than the satur-ation (dew point) temperature of the mixture. The dew point(2) of a vapor mixture is thetemperature at which the vapor pressure exerted by the condensable component(s) isequal to the(ir) partial pressure in the vapor. For example, consider an air–water mix-ture at 758F that is 80% saturated with water (or has a relative humidity, RH, of 80%):
% Sat ¼ % RH ¼pH2O
p0(100) (12:2)
where pH2O
p0¼
¼
partial pressure of watervapor pressure of water ¼ 0.43 psia at 758F (see Steam Tables,Appendix, Table C.1)
For this condition, pH2O ¼ (0.8)(0.43) ¼ 0.344 psia.Pure vapors condense (or vaporize) at their vapor pressure at a given temperature.
For example, water at 2128F and 1 atm will vaporize to steam (or steam will condenseto water). A vapor or a mixture of vapors in a non-condensable gas is more difficult toanalyze. A typical example is steam (water) in air or a high molecular weight organicin air.
There are two key vapor–liquid mixtures of interest to the practicing engineer:air–water and steam–water (liquid). Information on the former is available on a psy-chometric chart while steam tables provide information on the later. A discussion onboth follows.
Psychrometric Chart
A vapor–liquid phase equilibrium example involving raw data is the psychrometric orhumidity chart.(2) A humidity chart is used to determine the properties of moist air andto calculate moisture content in air. The ordinate of the chart is the absolute humidityH, which is defined as the mass of water vapor per mass of bone-dry air. (Some chartsbase the ordinate on moles instead of mass.) Based on this definition, Equation (12.3)gives H in terms of moles and also in terms of partial pressure:
H ¼ 18nH2O
29(nT � nH2O)¼
18pH2O
29(P� pH2O)(12:3)
where nH2O
nT
pH2O
P
¼
¼
¼
¼
number of moles of water vaportotal number of moles in gaspartial pressure of water vaportotal system pressure
Curves showing the relative humidity (ratio of the mass of the water vapor in theair to the maximum mass of water vapor that the air could hold at that temperature, i.e.,
Condensation Fundamentals 207

if the air were saturated) of humid air also appear on the charts. The curve for 100%relative humidity is also referred to as the saturation curve. The abscissa of the humid-ity chart is air temperature, also known as the dry-bulb temperature (TDB). The wet-bulb temperature (TWB) is another measure of humidity; it is the temperature atwhich a thermometer with a wet wick wrapped around the bulb stabilizes. As waterevaporates from the wick to the ambient air, the bulb is cooled; the rate of coolingdepends on how humid the air is. No evaporation occurs if the air is saturated withwater; hence, TWB and TDB are the same. The lower the humidity, the greater the differ-ence between these two temperatures. On the psychrometric chart, constant wet-bulbtemperature lines are straight with negative slopes. The value of TWB corresponds tothe value of the abscissa at the point of intersection of this line with the saturation curve.
Given the dry bulb and wet bulb temperatures, the relative humidity (along withany other quantity on the chart) may be determined by finding the point of intersectionbetween the dry bulb abscissca and wet bulb ordinate. The point of intersectiondescribes all humidity properties of the system.
Steam Tables
The steam tables comprise a tabular representation of the thermodynamic properties ofwater. These tables are divided into three separate categories:
1. The saturated-steam tables provide the value of the enthalpy, specific volume,and entropy of saturated steam and saturated water as functions of pressuresand/or temperatures (condensation or boiling points). Changes in these exten-sive properties during the evaporation of 1 lb of the saturated liquid are alsotabulated. The tables normally extend from 32 to 7058F, the temperaturerange where saturated liquid and vapor can coexist.
2. The superheat tables list the same properties in the superheated-vapor region.Degrees superheat or number of degrees above the boiling point (at thepressure in question) are also listed.
3. The Mollier chart (enthalpy–entropy diagram) for water is so frequently usedin engineering practice that it also deserves mention. This diagram is usefulsince the entropy function stays constant during any reversible adiabaticexpansion or compression.(2)
The steam tables are located in the Appendix.
ILLUSTRATIVE EXAMPLE 12.3
A large enclosed main contains steam at 500 psia and 2338F superheat. Find the temperature andpressure in the main after half the steam has condensed.
SOLUTION: From the saturated steam tables in the Appendix, the condensation temperatureis 4678F at 500 psia. Therefore, the steam temperature is 467 þ 233 ¼ 7008F. The
208 Chapter 12 Condensation and Boiling

corresponding initial specific volume is approximately 1.30 ft3/lb. After condensation, only halfof the steam vapor remains. Therefore, the final specific volume will be(4) (1.30)/0.5 ¼ 2.60 ft3/lb. Since two phases exist at equilibrium, Gibbs phase rule indicates that
F ¼ ðC � PÞ þ 2 ¼ ð1� 2Þ þ 2 ¼ 1
Employing the saturated tables, one notes (by interpolation)(4) that T ¼ 3708F andP ¼ 175 psia as the final state. The specific volume of the liquid is approximately0.018 ft3/lb. B
ILLUSTRATIVE EXAMPLE 12.4
Refer to the previous illustrative example. How much heat is removed from the system duringthis process?
SOLUTION: This is a constant volume system since the main is enclosed. From the first law(2)
Q ¼ DU ¼ U2 � U1; U ¼ internal energy
From the steam tables(4)
U1 ¼ 1237:1 Btu=lb
U2,g ¼ 1112:2 Btu=lb
U2,l ¼ 343:15 Btu=lb
Substituting,
Q ¼ 0:5(1112:2þ 343:15)� (1)(1237:1)
¼ 727:7� 1237:1
¼ �509:4 Btu=lb (heat is removed) B
Regarding solid–vapor equilibrium, a solid, like a liquid, has a definite vapor pressureat each temperature (some solids cannot exist in contact with vapor). Examples arehelium below the critical temperature and various forms of ice; this pressure may beextremely small but it is nevertheless finite. The vapor pressure of a solid increaseswith temperature and the variation can be represented by a curve similar to that fora liquid; it is generally called a sublimation curve, with the term sublimation used toindicate the direct conversion of solid to vapor without the intervention of liquid. Thechange from solid to vapor is accompanied, like the analogous change from liquid tovapor, by an absorption of heat; this is referred to as the latent enthalpy of sublimation.
CONDENSATION PRINCIPLES
As noted earlier, condensation occurs when the temperature of a vapor is reducedbelow its saturation temperature and results from contact between the vapor and acooler surface. The latent enthalpy of the vapor is released, heat is transferred to thesurface, and the condensate forms.
Condensation Principles 209

As noted in the Introduction to this chapter, there are three basic types of conden-sation: surface condensation, homogeneous condensation, and direct contact conden-sation. The corresponding modes are: film condensation and dropwise condensation.Although it is desirable to achieve dropwise condensation in real-world applications, itis often difficult to maintain this condition. Although convection coefficients for filmcondensation are smaller than those for the dropwise case, condenser design calcu-lations may be and usually are based on the assumption of film condensation. It isfor this reason that the paragraphs to follow in this section focus on film condensation.
Filmwise condensation may be laminar or turbulent, depending on the Reynoldsnumber of the condensate. The condensate Reynolds number is defined as
Re ¼4rLvmLd
mL¼
4 _m0
mL¼
4 _m
WmL(12:4)
where m0 is the mass flow rate of condensate per unit width of the surface; m, the massflow rate of condensate; vmL, the mean velocity of the condense liquid film; W, thewidth of the condensing surface; d, the average thickness of the condensed liquidfilm; rL, the density of the liquid condensate; and mL, the absolute viscosity of theliquid condensate.
Laminar condensation occurs when Re , 1800, while turbulent condensationoccurs when the Re . 1800. Since the flow may not occur in a circular conduit,the hydraulic diameter, Dh, must be used. The hydraulic diameter, Dh (as definedearlier), is:
Dh ¼4AC
PW¼
4 _m
rLvmLPW(12:5)
where AC is the area of the conduit and PW is the wetted perimeter. Assuming that thevapor is at its saturation temperature, Tsat, and letting TS represent the surface tempera-ture, the rate of heat transfer, Q, can be related to the rate of condensation, m0, throughan energy balance, as shown in the following equations:
_Q ¼ hA(Tsat � TS) ¼ _mhvap (12:6)
with A representing the heat transfer area. Rearranging Equation (12.6) leads to
_m0 ¼_m
PW¼
hA(Tsat � TS)PW hvap
(12:7)
Substituting Equation (12.7) for m0 in the condensate Reynolds number definition inEquation (12.4) gives
Re ¼4 _m0
mL¼
4hA(Tsat � TS)PWhvapmL
(12:8)
The values of A, PW and the ratio of A/PW for several geometries are summarized inTable 12.2.
210 Chapter 12 Condensation and Boiling

The following correlations are available for calculating the heat transfer coeffi-cient during condensation.
1. For laminar film condensation on a vertical plate or vertical cylinder:
Co ¼ 1:874 Re�1=3f (12:9)
where Co is the average condensation number and is given by
Co ¼�h
k
n2L
g(1� [rv=rL])
� �1=3
; g ¼ acceleration due to gravity (12:10)
This equation can also be written in the dimensional form:
�h ¼ 1:13rL(rL � rv)ghvapk3
L
(Ah=PW )mL(Tsat � TS)
� �0:25
(12:11)
where kL is the thermal conductivity of the liquid and rL is the density of theliquid.
2. For laminar film condensation on horizontal tubes of diameter D, the Nusseltequation is:
Co ¼ 1:514 Re�1=3f (12:12)
In dimensional form:
�h ¼ 0:725rL(rL � rv)ghvapk3
L
DmL(Tsat � TS)
� �0:25
(12:13)
3. For turbulent film condensation, the Kirkbride equation is:
Co ¼ 0:0077 Re0:4f (12:14)
with Co once again given by Equation (12.10).
A superheated vapor occurs when the temperature of the vapor is higher than thatof the boiling point at the corresponding pressure. When a superheated vapor enters acondenser, the sensible heat of superheat and the latent heat of condensation must be
Table 12.2 Condensation Geometries
Geometry Wetted perimeter, PW Heat transfer area, A A/PW
Vertical plate (W � Z ) W WZ ZVertical tube pD pDZ ZHorizontal tube Z pDZ pDHorizontal tube bank
n1 rows � n2 columnsn2Z n1n2pDZ pn1D
Note: W ¼ width; Z ¼ height; D ¼ diameter.
Condensation Principles 211
transferred through the cooling surface. The condensation mechanism is thereforesomewhat different if the condensing vapor is superheated rather than saturated.Experimental results have shown that, in most cases, the effect of superheat may beignored and the equations for saturated vapors may be used with negligible error. Itshould be noted that
Tsat � T ¼ DT (12:15)
is still the temperature difference driving force, and that the actual superheated vaportemperature does not enter into the calculations.
For mixed vapors (i.e., if the vapor contains two or more volatile components), thecondensation temperature is no longer constant at a given pressure unless the mixtureis azeotropic. If the cooling surface temperature is low, the vapor may condense andthe condensate may be assumed to be the same as that of the original vapor. If the cool-ing surface temperature is straddled by the condensation temperatures of the com-ponents, part of the vapor will condense and some vapor must be vented from thecondenser.
Regarding dropwise condensation, heat transfer coefficients are an order of mag-nitude larger than those for film condensation. If other thermal resistances in thesystem are significantly larger than that due to condensation, the condensation resist-ance may be neglected. The following expressions are recommended for estimationpurposes for dropwise condensation:
�h ¼ 51,000þ 2000Tsat 228C , Tsat , 1008C (12:16)
�h ¼ 255,000 1008C , Tsat (12:17)
where the heat transfer coefficient h has units of W/m2 . K.
ILLUSTRATIVE EXAMPLE 12.5
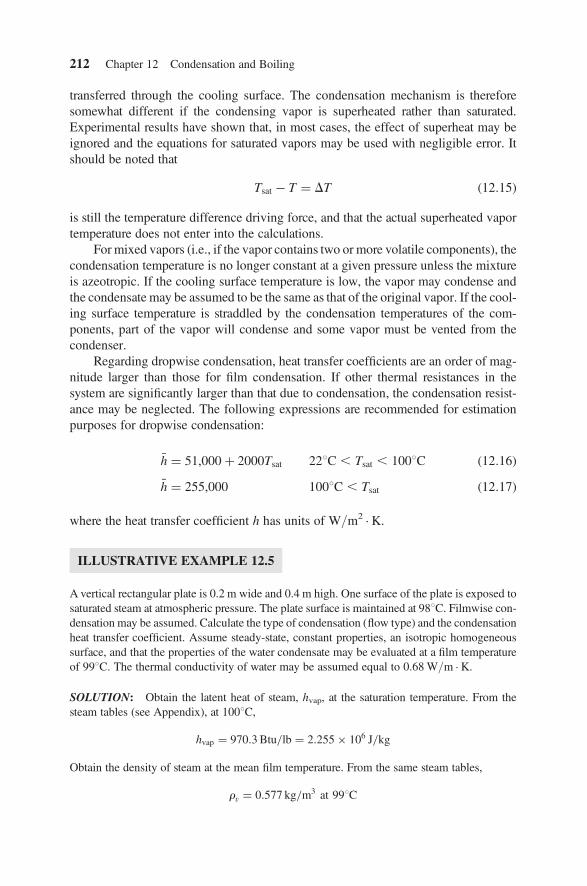
A vertical rectangular plate is 0.2 m wide and 0.4 m high. One surface of the plate is exposed tosaturated steam at atmospheric pressure. The plate surface is maintained at 988C. Filmwise con-densation may be assumed. Calculate the type of condensation (flow type) and the condensationheat transfer coefficient. Assume steady-state, constant properties, an isotropic homogeneoussurface, and that the properties of the water condensate may be evaluated at a film temperatureof 998C. The thermal conductivity of water may be assumed equal to 0.68 W/m . K.
SOLUTION: Obtain the latent heat of steam, hvap, at the saturation temperature. From thesteam tables (see Appendix), at 1008C,
hvap ¼ 970:3 Btu=lb ¼ 2:255� 106 J=kg
Obtain the density of steam at the mean film temperature. From the same steam tables,
rv ¼ 0:577 kg=m3 at 998C
212 Chapter 12 Condensation and Boiling

Also, obtain the properties of liquid water condensate (rL, mL, kL) at the mean film temperature.From the Appendix, at 998C (some interpolation required),
rL ¼ 960 kg=m3
mL ¼ 2:82� 10�4 kg=m � s
kL ¼ 0:68 W=m2 � K
Obtain the ratio, A/PW for a vertical plate from Table 12.2:
Z ¼ height ¼ 0:4 m
PW ¼ W ¼ 0:2 m
A=PW ¼ Z ¼ 0:4 m
Generate an expression for the condensation number, Co, in terms of the average heat transfercoefficient using Equation (12.10):
nL ¼mL
rL¼
2:82� 10�4
960¼ 2:94� 10�7 m2=s
Co ¼�h
k
n2L
g(1� rv=rL)
� �1=3
¼�h
0:68(2:94� 10�7)2
9:807(1� 0:577=960)
� �1=3
¼ 3:038� 10�5 �h
Also, generate the Reynolds number in terms of the average heat transfer coefficient usingEquation (12.8), noting that A/PW ¼ 0.4:
Re ¼4�h(0:4)(100� 98)
(2:82� 10�4)(2:255� 106)¼ 5:03� 10�3 �h
Assume a flow type (laminar or turbulent) and determine Co in terms of ReL. First, assume tur-bulent condensation on a vertical plate so that Equation (12.14) applies:
Co ¼ 0:0077 Re0:4
Obtain a value for �h by substituting into the equations above:
3:038� 10�5 �h ¼ (0:0077)(5:03� 10�3)0:4(�h)0:4
�h ¼ 298 W=m2 � K
Check the Reynolds number to verify the assumption of flow type:
Re ¼ (5:03� 10�3)�h ¼ (5:03� 10�3)(298) ¼ 1:50 , 1800
Condensation Principles 213

The assumption of turbulent condensation is not valid. Therefore, assume laminar flow andemploy the expression for Co in terms of Re in Equation (12.9):
Co ¼ 1:874 Re�1=3
Once again, obtain a value for �h by substituting into the equation above
3:038� 10�5 �h ¼ (1:874)(5:03� 10�3)�1=3(�h)�1=3
�h ¼ 14,700 W=m2 � K
Check the Reynolds number to verify the assumption of flow type:
Re ¼ (5:03� 10�3)�h ¼ (5:03� 10�3)(14,700) ¼ 73:9 , 1800
The assumption of laminar flow is valid. B
ILLUSTRATIVE EXAMPLE 12.6
Refer to Illustrative Example 12.5. Calculate
1. the mass flow rate of condensate, _m0
2. the heat transfer rate Q.
SOLUTION: First calculate m0:
Re ¼4 _m0
mL(12:4)
_m0 ¼RemL
4
Substituting,
_m0 ¼(73:9)(2:82� 10�4)
4
¼ 0:0052 kg=m � s
Calculate m employing Equation (12.7):
_m ¼ PW _m0 ¼ W _m0
¼ (0:2)(0:0052)
¼ 0:00104 kg=s
Calculate Co using the result from the previous illustrative example:
Co ¼ (3:0377� 10�5)�h ¼ (3:0377� 10�5)(14,700) ¼ 0:4465
214 Chapter 12 Condensation and Boiling

Finally, calculate Q:
_Q ¼ hA(Tsat � TS)
¼ (14,700)(0:2)(0:4)(100� 98)
¼ 2350 W
¼ 2:35 kW B
ILLUSTRATIVE EXAMPLE 12.7
A horizontal 4-inch OD tube is surrounded by saturated steam at 2.0 psia. The tube is maintainedat 648F. What is the average heat-transfer coefficient? Assume laminar flow.
SOLUTION: Assuming laminar flow, the average heat-transfer coefficient is given byEquation (12.13). The liquid properties are evaluated at the mean film temperature, Tf ¼
(Tsat þ T )/2 ¼ (126 þ 64)/2 ¼ 958F. The approximate values (at 1008F) of key properties are:
hvap ¼ 1022 Btu=lb (at Tsat)
rv ¼ 0:00576 lb=ft3 (at Tsat)
rL ¼ 62:03 lb= ft3
kL ¼ 0:364 Btu=h � ft � 8F
mL ¼ 4:26� 10�4 lb= ft � s
Solving,
�h ¼ 0:725rL(rL � rv)ghvapk3
L
mLD(Tsat � TS)
� �1=4
(12:13)
¼ 0:725(62:03)(62:03� 0:00576)(32:2)(1022)(0:364)3
(4:26� 10�4) 4=12ð Þ(126� 64)=(3600)
� �1=4
¼ 911:6 Btu=h � ft2 � 8FB
BOILING FUNDAMENTALS
The process of converting a liquid into a vapor is also of importance to practicingengineers. The production of steam for electrical power generation is a prime example.Many other processes, particularly in the refining of petroleum and the manufacture ofchemicals, require the vaporization of a liquid.
Boiling is the opposite of condensation. Boiling occurs when a liquid at its satur-ation temperature, Tsat, is in contact with a solid surface at a temperature, TS, which isabove Tsat. The excess temperature, DTe, is defined as:
DTe ¼ TS � T sat (12:18)
Boiling Fundamentals 215

The DTe driving force causes heat to flow from the surface into the liquid, whichresults in the formation of vapor bubbles that move up through the liquid. Becauseof bubble formation, the surface tension of the liquid has an impact on the rate ofheat transfer.
Boiling may be classfied as pool boiling or forced convection boiling. In poolboiling, the liquid forms a “pool” in a container while submerged surfaces supplythe heat. The liquid motion is induced by the formation of bubbles as well as densityvariations. In forced convection, the liquid motion is induced by external means (e.g.,pumping of liquids through a heated tube).
Another common classification for types of boiling is based on the relationship ofthe liquid temperature to its saturated temperature. Boiling is subcooled (also known aslocal) when the liquid temperature is below the saturation temperature (i.e., T , Tsat).When the liquid is at the saturation temperature, the boiling is saturated boiling.
The explanation of the strange behavior of boiling systems lies in the fact that boil-ing heat transfer occurs by several different mechanisms and the mechanism is oftenmore important in determining the heat rate than the temperature-difference drivingforce. Consider, for example, the heating of water in an open pot. Heat is initially trans-ferred within the water by natural convection. As the heat rate is further increased, thesurface temperature at the base of the pot increases to and above 2128F. Bubbles beginto form and then rise in columns from the heating surface creating a condition favor-able to heat transfer. As the temperature increases further, more sites become availableuntil the liquid can no longer reach the heating surface at a sufficient rate to formthe required amount of vapor. This ends the nucleate boiling stage (to be discussedlater). At this point, the mechanism changes to film boiling since the heating surfaceis now covered with a film of vapor. The temperature of the base of the pot rises(even though the heat rate is constant). Vaporization takes place at the liquid–vaporinterface and the vapors disengage from the film in irregularly-shaped bubbles atrandom locations.
Although the phenomena of superheating occurs in most boiling systems, thetemperature of the boiling liquid, measured some distance from the heated surface,is higher than the temperature of the vapor above the liquid (which is at the saturationtemperature). The liquid superheat adjacent to the heated surface may be as high as 25to 508F. Most of the temperature change occurs in a narrow thin film from the surface.This superheat occurs because the internal pressure in the vapor bubble is higher dueto surface tension effects.
The formation, growth, and release of bubbles is an extremely rapid sequence ofevents. The rapid growth and departure of vapor bubbles causes turbulence in theliquid, especially in the aforementioned zone of superheat near the heated surface.This turbulence assists the transport of heat from the heated surface to the liquid eva-porating at the bubble surface. The rapid growth of bubbles and the turbulence in theliquid complement each other, resulting in high heat transfer coefficients.
As the superheat of a boiling liquid is further increased, the concentration of activecenters on the heating surface increases and the heat rate correspondingly increases.The mass rate of the vapor rising from the surface must be equal to the mass rate ofliquid proceeding toward the surface if steady-state conditions prevail. As the boiling
216 Chapter 12 Condensation and Boiling

rate increases, the rate of liquid influx must increase since the area available for flowdecreases with the increasing number of bubble columns; in addition, the liquid vel-ocity must also increase. At this limiting condition, the liquid flow toward the heatedsurface cannot increase and the surface becomes largely blanketed with vapor. If theheat rate to the surface is held constant, the surface temperature will rise to a high valueat which point heat is transmitted to the fluid by the mechanism of film boiling. Filmboiling occurs when the superheat is sufficiently high to keep the heated surface com-pletely blanketed with vapor. Heat may then be transmitted through the gas film byconduction, convection, and radiation.
Finally, the Leidenfrost phenomenon is one of the many complex properties ofboiling. If a liquid is dropped on a surface that has a temperature significantlyhigher than the liquids boiling point, the liquid will skitter across the surface and evap-orate at a slower rate than expected. This is due to an instantaneous layer of vapor, sus-pending the liquid, which acts as insulation between the hot surface and the drop ofliquid. At temperatures closer to boiling, the liquid will evaporate at a much faster rate.
Interestingly, there is a unique relationship between a liquid’s normal boilingpoint and critical point. The describing equation is given by:
Tb
Tc� 0:6 (12:19)
The relationship is demonstrated in Table 12.3.Boiling point elevation is another interesting phenomenon. When a solute (e.g.,
NaOH) is dissolved in water, the vapor pressure of the aqueous solution is less thanthat of water at the same temperature. Thus, at a given pressure, the solution boils ata higher temperature than water. This increase is termed the boiling point elevation(BPE) of the solution. Dilute solutions of organic compounds exhibit small (negli-gible) BPEs. For aqueous solutions of inorganic compounds, the BPE may be as
Table 12.3 Ratio of Boiling Point to Critical Temperature
Substance Tb, K Tc, K Tb/Tc Ratio
Nitrogen 77.3 126.0 0.61Oxygen 90.1 154.3 0.58Carbon dioxide 194.6 304.2 0.64Ammonia 239.7 405.5 0.59Water 373.2 647 0.58Ethane 185 305 0.61n-Pentane 309 470 0.66Benzene 353 562 0.63Carbon tetrachloride 350 556 0.63Ethyl alcohol 351 516 0.68Acetic acid 391 594 0.66
Boiling Fundamentals 217

high as 1508F. This BPE represents a loss in the thermal driving force and has to beaccounted for in some calculations.
ILLUSTRATIVE EXAMPLE 12.8
The rate of heat flow per unit area of heat transfer surface to a boiling liquid
(a) increases with the temperature of the heating medium.
(b) decreases with the temperature of the heating medium.
(c) increases with the temperature of the boiling liquid.
(d) decreases with the temperature of the boiling liquid.
(e) may increase or decrease with the temperature of the heating medium.
(f) None of the above.
Which statement is correct?
SOLUTION: The answer is (e) due to the aforementioned “bubble” effect. B
BOILING PRINCIPLES
It has been found that the heat trasfer coefficient, h, in boiling systems depends on theexcess temperature, DTe. For free convection boiling (DTe , 58C):
h/ (DTe)n (12:20)
where n ¼
¼
14 laminar free convection conditions13 turbulent free convection conditions
The boiling heat flux, _Q0s, is calculated as:
_Q0s ¼ h(TS � Tsat) (12:21)
and
DTe ¼ TS � Tsat (12:22)
The dimensionless number of importance in boiling heat transfer is the liquid Jakobnumber, JaL. It is defined as
JaL ¼cpDTe
hvap(12:23)
The mechanism of pool boiling heat transfer depends on the excess temperature,DTe, where, once again, DTe is the difference between surface temperature and thefluid saturation temperature. A plot of the boiling heat transfer flux, _Q0S, versus theexcess temperature, is shown in Figure 12.1. When DTe . 58C, bubbles start to
218 Chapter 12 Condensation and Boiling

form at the onset of nucleate boiling (ONB). As noted earlier, the bubbles rise and aredissipated in the liquid; the resulting stirring causes an increase in the heat flux. Thisregime was termed nucleate boiling. The heat transfer coefficient in this regime varieswith DTe as follows:
h/ (DTe)n (12:20)
where n varies between 3 or 4. As DTe increases, the rate of bubble formationincreases. This causes h to increase, but at higher rates of bubble formation somebubbles cannot diffuse quickly enough and form a blanket around the heating element.This blanket increases the heat transfer resistance and slows down the increase in bothh and the heat flux. These two factors balance out at approximately DTe ¼ 308C wherethe flux (introduced below) reaches its maximum. The peak flux is termed the criticalheat flux, _Q0S,c. For boiling water, _Q0S,c is greater than 1 MW/m2. As DTe increases stillfurther, the gas film formed by the coalescing bubbles around the element prevents theliquid from coming in and causes a further increase in the heat transfer resistance. Thismechanism is defined as film boiling.
107
106
105
104 A
1 5 10 30 120 1000
B
P
D
C Critical heat flux, Q ′S,max = Q ′S,c
Leidenfrost point, Q ′S,min
ONB
ΔTe,A
ΔTe = TS – Tsat (°C)
ΔTe,B ΔTe,C ΔTe,D
Q′ s
(W/m
2 )
103
Free convection Nucleate Transition Film
Boiling regimes
Isolatedbubbles
Q ′max
Q ′min
Jets andcolumns
Figure 12.1 Boiling curve. (Adapted from Incroprera and De Witt, Fundamentals of Heat and Mass
Transfer, John Wiley & Sons, 1981.)
Boiling Principles 219

For the approximate 308C , DTe , 1208C range, the mechanism becomesunstable film boiling, also known as transition film boiling, or partial film boiling.The heat transfer coefficient decreases with increasing DTe until a stable value isreached. At these high surface temperatures, Ts, thermal radiation contributes signifi-cantly to the heat transfer. This contribution causes the heat flux to increase again. Theminimum in the curve is referred to as the Leidenfrost point (see previous section) andthe heat flux is given by _Q0S, min.
At the point of peak (or critical) flux, _Q0S,c, a small increase in DTe causes _Q0S todecrease. However, with the lower heat flux, the energy from the heating surfacecannot be completely dissipated, causing a further increase in DTe. Eventually, thefluid temperature can exceed the melting point of the heating medium. The criticalheat flux (at point C on Figure 12.1) is therefore also termed the boiling crisis pointor the burnout point.
Boiling equipment should be operated in the nucleate boiling region, close to thecritical flux, but never exceeding it. To calculate the boiling heat flux in the nucleateboiling regime, one may use the Rohsenow equation:(5)
_Q0s ¼ mLhvap
ffiffiffiffiffiffiffiffiffiffiffiffiffiffiffiffiffiffiffiffig(rL � rv)
s
rJaL
Csf PrnL
� �3
(12:24)
where s is the liquid surface tension (lbf/ft or N/m), mL is the dynamic viscosity of theliquid (lb/ft . h or kg/m . s), Csf is the correlation coefficient that depends on thesurface–fluid combination, n is the Prandtl number exponent that depends on the sur-face–fluid combination and JaL is the liquid Jakob number, as presented in Equation(12.23). Numerical values of Csf and n can be obtained from Table 12.4. Note that n ¼1 for water and 1.7 for other liquids.
The critical heat flux (or burnout flux) is calculated from the Zuber equation:(6,7)
_Q0S,c ¼p
24hvaprv 1þ
rv
rL
� �1=2sg(rL � rv)
r2v
� �1=4
(12:25)
If rv � rL, the Zuber equation simplifies to:
_Q0S;max ¼_Q0S;c ¼
p
24hvap(sgrL=r
2v )1=4 (12:26)
At the so-called Leidenfrost point, the heating surface is covered by a stable vaporblanket and the heat flux reaches its minimum condition, _Q0S, min. Zuber developedthe following relationship to calculate the minimum heat flux from a large horizontalplate:
_Q0S, min ¼ 0:09hvaprv
sg(rL � rv)
(rL þ rv)2
� �1=4
(12:27)
220 Chapter 12 Condensation and Boiling

If rv � rL, the Zuber minimum flux equation simplifies to:
_Q0S, min ¼ 0:09hvaprv
sg
rL
� �1=4
(12:28)
Water is the most common fluid used in boiling applications. To facilitate calcu-lations involving water, approximate heat transfer relations have been developed tocalculate the surface flux, _Q0S, for the boiling of water during both pool boiling andforced convection. The surface flux, _Q0S, is given by:
_Q0S ¼ h(Ts � Tw) (12:29)
For forced convection boiling inside vertical tubes, the heat transfer coefficient isapproximated by the dimensional relation:
h ¼ 2:54(DTe)ne(P=1:55) (12:30)
and for pool boiling:
h ¼ C(DTe)n(P=Pa)0:4 (12:31)
where h is the heat transfer coefficient from the surface to the boiling water, P is theabsolute pressure in mega pascals (MPa), and Pa is the ambient absolute pressure(e.g., 1 atm ¼ 0.1013 MPa). The coefficients C and n are constants that depend onthe orientation of the surface and the magnitude of the surface heat flux, _Q0S.Numerical values of C and n are given in Table 12.5.
Table 12.4 Values of Csf for Various Fluid–SurfaceCombinations to be Used with the Rohsenow Equation
Fluid–surface combination Csf n
Water–copperScored 0.0068 1.0Polished 0.0130 1.0
Water–stainless steelChemically etched 0.0130 1.0Mechanically polished 0.0130 1.0Ground and polished 0.0060 1.0
Water–brass 0.0060 1.0Water–nickel 0.0060 1.0n-Pentane–copper
Polished 0.0154 1.7Lapped 0.0049 1.7
Benzene–chromium 0.0101 1.7Ethyl alcohol–chromium 0.0027 1.7
Boiling Principles 221

Since the surface flux is often unknown, the calculation of h involves trial-and-error. A typical procedure is to:
1. assume the range of the surface flux, _Q0s2. read C and n from Table 12.5
3. calculate h using Equation (12.30) or Equation (12.31)
4. calculate _Q0s from Equation (12.29), and
5. determine if the assumption made in (1) is valid.
For heat transfer coefficients involving boiling water, the effect of pressure on theheat transfer coefficient may be estimated from
h ¼ h1 atmP
Pa
� �0:4
(12:32)
This pressure correction is recommended for other liquids if another correlation is notavailable.
ILLUSTRATIVE EXAMPLE 12.9
Boiling water at 1008C and 1 atm is supplied with heat from a surface at 1028C. The heat flux is9800 W/m2. If the surface temperature is raised to 1038C, determine the new heat flux.
At 1 atm, the saturation temperature of the water is 1008C. The liquid water properties (SIunits) are: density ¼ 957.9 kg/m3, heat capacity ¼ 4217 J/kg . K, latent heat of vaporization ¼2.26 � 106 J/kg. Assume steady-state operation, constant properties, and laminar conditions.
SOLUTION: Calculate the heat transfer coefficient at 1028C using Equation (12.21)
h ¼_Q0s
TS � TL¼
_Q0
s
TS � Tsat¼
9800102� 100
¼ 4900 W=m2 � K
Table 12.5 Constants for Use with the Approximate Pool Boiling Heat Transfer CoefficientCorrelation for Water
Surface orientation Surface flux, _Q0s, kW/m2 C n
Horizontal _Q0s , 15.8 1040 13
15.8 , _Q0s , 236 5.56 3Vertical _Q0s , 3.15 539 7
3.15 , _Q0s , 63.1 7.95 3
222 Chapter 12 Condensation and Boiling

The new heat transfer coefficient may now be calculated, see Equation (12.20). Since h/(DTe)
n and n ¼ 0.25, for laminar flow;
h2 ¼ h1DTe1
DTe2
� �1=4
¼ 490032
� �1=4
¼ 5421 W=m2 � K
The new heat flux is:
_Q0s ¼ h(TS � TL) ¼ 5421(103� 100) ¼ 16,260 W=m2B
ILLUSTRATIVE EXAMPLE 12.10
With respect to Illustrative Example 12.9, determine the mechanism of boiling heat transfer.Is the earlier assumed boiling mechanism still valid?
SOLUTION: Calculate the original excess temperature:
DTe ¼ TS � Tsat ¼ 102� 100 ¼ 28C
Calculate the new excess temperature (for TS ¼ 1038C).
DTe ¼ TS � Tsat ¼ 103� 100 ¼ 38C
The assumption of the free convection mechanism is valid since DTe , 58C. B
ILLUSTRATIVE EXAMPLE 12.11
Refer to Illustrative Example 12.9 and calculate the liquid Jakob number.
SOLUTION: The liquid Jakob number may be calculated from Equation (12.22):
JaL ¼cpDTe
hvap¼
4127(3)2:26� 106
¼ 0:00548B
ILLUSTRATIVE EXAMPLE 12.12
An electric heater 0.3 m in diameter at 1068C is used to heat water. The water is at 1 atm and1008C. Determine
1. the boiling regime, and
2. The heat transfer coefficient.
Assume steady-state operation and constant properties.
Boiling Principles 223

SOLUTION: Calculate the excess temperature, DTe,
DTe ¼ TS � Tsat ¼ 106� 100 ¼ 68C
See Figure 12.1. Since DTe is between 58C and 308C, nucleate boiling applies.Assume a range for the surface flux, _Q0S, and obtain the corresponding values of C and n.
Assuming that 15.8 , _Q0S , 236 kW/m2, then, from Table 12.5, C ¼ 5.56 and n ¼ 3. Forpool, rather than forced convection, the water boiling heat transfer coefficient is given byEquation (12.31):
h ¼ C(DTe)n(P=Pa)0:4
¼ 5:56(6)3(1)0:4
¼ 1200 W=m2
Calculate the surface flux using Equation (12.29) and check the assumption made above:
_Q0S ¼ hDTe ¼ (1200)(6)
¼ 7200 W=m2
¼ 7:2 kW=m2
Since _Q0S , 15.8, the assumption above is not correct. Therefore, assume a new range for the
surface flux (e.g., that _Q0S , 15.8 kW/m2). From Table 12.5, C ¼ 1040 and n ¼ 13.
Once again, calculate h and _Q0S:
h ¼ 1040(6)1=3(1)0:4 ¼ 1890 W=m2 � K
_Q0S ¼ h(DTe)
¼ (1890)(6)
¼ 11,340 W=m2
¼ 11:34 kW=m2
The second assumption is valid. B
ILLUSTRATIVE EXAMPLE 12.13
Refer to the previous example. Calculate the rate of heat transfer.
SOLUTION: To calculate the heat transfer rate, Q0S,
_QS ¼_Q0SA ¼ _Q0S
pD2
4
� �¼ (11,340)
p (0:3)2
4
� �¼ 801 W
B
224 Chapter 12 Condensation and Boiling

REFERENCES
1. C. BENNETT and J. MEYERS, Momentum, Heat and Mass Transfer, McGraw-Hill, New York City, NY,1962.
2. L. THEODORE, F. RICCI, and T. VAN VLIET, Thermodynamics for the Practicing Engineer, John Wiley &Sons, Hoboken, NJ, 2009.
3. J. GIBBS, mathematical physicist, 1839–1903.4. J. SMITH, H. VAN NESS, and M. ABBOTT, Introduction to Chemical Engineering Thermodynamics, 6th edi-
tion, McGraw-Hill, New York City, NY, 2001.5. W. ROHSENOW, Trans ASME, 74: 969, New York City, NY, 1952.6. H. FORSTER and N. ZUBER, AIChE Journal, 1, 531, New York City, NY, 1955.7. N. ZUBER, Trans ASME, On the Stability of Boiling Heat Transfer, 80: 711, New York City, NY, 1958.
References 225
Copyright © 2022 FDOKUMEN