Performance analysis of a condensation-extraction steam ...
17
Keyword: Cogeneration; Condensation-extraction steam turbine; Sugar-alcohol factory. Published Date: 8/31/2019 Page.275-290 Vol 7 No 8 2019 Abstract In this work a thermodynamic analysis for a condensation-extraction steam turbine capable of driving a 40 MVA electric generator in a sugar-alcohol factory was carried out. Sensibility analyses were performed to evaluate the behavior of the overall energy efficiency of a plant with the condensation- extraction steam turbine in function of the boiler efficiency, the specific consumption of steam in the processes as well as the condensation rate in the turbine. The analysis results have shown that this turbine in the cogeneration system contribute to increasing the power generation, although the condensation reduces the overall efficiency of the plant. It has also been observed that the plant efficiency is very sensitive to the condensation rate variation and increases with the demand for steam in the processes. Performance analysis of a condensation-extraction steam turbine operating in a sugar-alcohol factory cogeneration system Prof. Dr. Paulo Sérgio Barbosa dos Santos;Prof. Dr. Ricardo Alan Verdú Ramos;Me. Eng. Marcelo Caldato Fiomari;Prof. Dr. Emanuel Rocha Woiski;Drª Engª Thaisa Calvo Fugineri Moreti DOI: https://doi.org/10.31686/ijier.Vol7.Iss8.1675
-
Upload
khangminh22 -
Category
Documents
-
view
0 -
download
0
Transcript of Performance analysis of a condensation-extraction steam ...

Keyword: Cogeneration; Condensation-extraction steam turbine; Sugar-alcohol factory.
Published Date: 8/31/2019 Page.275-290 Vol 7 No 8 2019
Abstract
In this work a thermodynamic analysis for a condensation-extraction steam turbine capable of driving
a 40 MVA electric generator in a sugar-alcohol factory was carried out. Sensibility analyses were
performed to evaluate the behavior of the overall energy efficiency of a plant with the condensation-
extraction steam turbine in function of the boiler efficiency, the specific consumption of steam in the
processes as well as the condensation rate in the turbine. The analysis results have shown that this
turbine in the cogeneration system contribute to increasing the power generation, although the
condensation reduces the overall efficiency of the plant. It has also been observed that the plant
efficiency is very sensitive to the condensation rate variation and increases with the demand for steam
in the processes.
Performance analysis of a condensation-extraction
steam turbine operating in a sugar-alcohol factory
cogeneration system
Prof. Dr. Paulo Sérgio Barbosa dos Santos;Prof. Dr. Ricardo Alan Verdú Ramos;Me.
Eng. Marcelo Caldato Fiomari;Prof. Dr. Emanuel Rocha Woiski;Drª Engª Thaisa Calvo
Fugineri Moreti
DOI: https://doi.org/10.31686/ijier.Vol7.Iss8.1675
International Journal for Innovation Education and Research www.ijier.net Vol:-7 No-8, 2019
International Educative Research Foundation and Publisher © 2019 pg. 275
Performance analysis of a condensation-extraction steam turbine
operating in a sugar-alcohol factory cogeneration system
Prof. Dr. Paulo Sérgio Barbosa dos Santos, Prof. Dr. Ricardo Alan Verdú Ramos, Me. Eng. Marcelo
Caldato Fiomari, Prof. Dr. Emanuel Rocha Woiski, Drª Engª Thaisa Calvo Fugineri Moreti
UNESP / Câmpus de Ilha Solteira - SP
Abstract
In this work a thermodynamic analysis for a condensation-extraction steam turbine capable of driving a
40 MVA electric generator in a sugar-alcohol factory was carried out. Sensibility analyses were performed
to evaluate the behavior of the overall energy efficiency of a plant with the condensation-extraction steam
turbine in function of the boiler efficiency, the specific consumption of steam in the processes as well as
the condensation rate in the turbine. The analysis results have shown that this turbine in the cogeneration
system contribute to increasing the power generation, although the condensation reduces the overall
efficiency of the plant. It has also been observed that the plant efficiency is very sensitive to the
condensation rate variation and increases with the demand for steam in the processes.
Keywords: Cogeneration; Condensation-extraction steam turbine; Sugar-alcohol factory.
1. Introduction and Objectives
Brazilian sugar-alcohol factories had been deploying low-efficiency single-stage back-pressure steam
turbines [1] as well as low pressure and low temperature boilers (below 2,200 kPa and 300 ºC, respectively).
There was no special concern towards obtaining high energy production efficiencies since the demand for
mechanical driving and processes steam, as well as their own electricity consumption, was entirely met [2].
The brazilian electric system is much dependent on hydroelectricity. However, as a consequence of
the seasonal water crises facing the country, the energy cogeneration system is a viable option and for this
reason the sugar and alcohol sector has gained a lot of prominence because in addition to the primary
productions of this sector, ethanol and sugar, beyond the electricity production [3]. Learning the hard way
from such crisis, governmental incentives emerged with the creation of a Brazilian program for electricity
generation from alternative sources (PROINFA), including biomass [4,5].
Facing the prospects of an expanding market for electrical energy, several Brazilian sugar cane
industries have resolved to improve the efficiency of their equipment and processes by taking measures
such as decreasing the process of steam consumption biomass [6]; substituting the steam driven mills by
electric ones; employing more efficient boilers as well as condensation-extraction steam turbines [1]. The
latter in particular allows for much more flexibility to satisfy the ever-changing relationship between
thermal and electrical energy production in the plant [7].
Although at first the proposed floor price for electricity sale established by the PROINFA has
International Journal for Innovation Education and Research www.ijier.net Vol:-7 No-8, 2019
International Educative Research Foundation and Publisher © 2019 pg. 276
disappointed investors, they have taken to heart the opportunity offered by PROINFA conditions to
refurbish their more than 20 year-old plants. An actual example is Pioneiros Bioenergia, a mid-size sugar-
alcohol factory located in the Northwest of São Paulo State, which has expanded its cogeneration system
with an eager eye to electricity commercialization through PROINFA.
The present paper is part of a complete work in which the expansion process of the cogeneration
system of the previously mentioned sugar-alcohol factory was studied. In this work a thermodynamic
analysis of the condensation-extraction steam turbine selected for use in Pioneiros Bioenergia was
performed, by analyzing the behavior of the plant global efficiency and power production, considering
some relevant parameters such as the boiler efficiency, the specific steam consumption in the processes and
the condensation rate in the turbine.
2. Material and Methods
2.1 Details of the Plant and Turbine
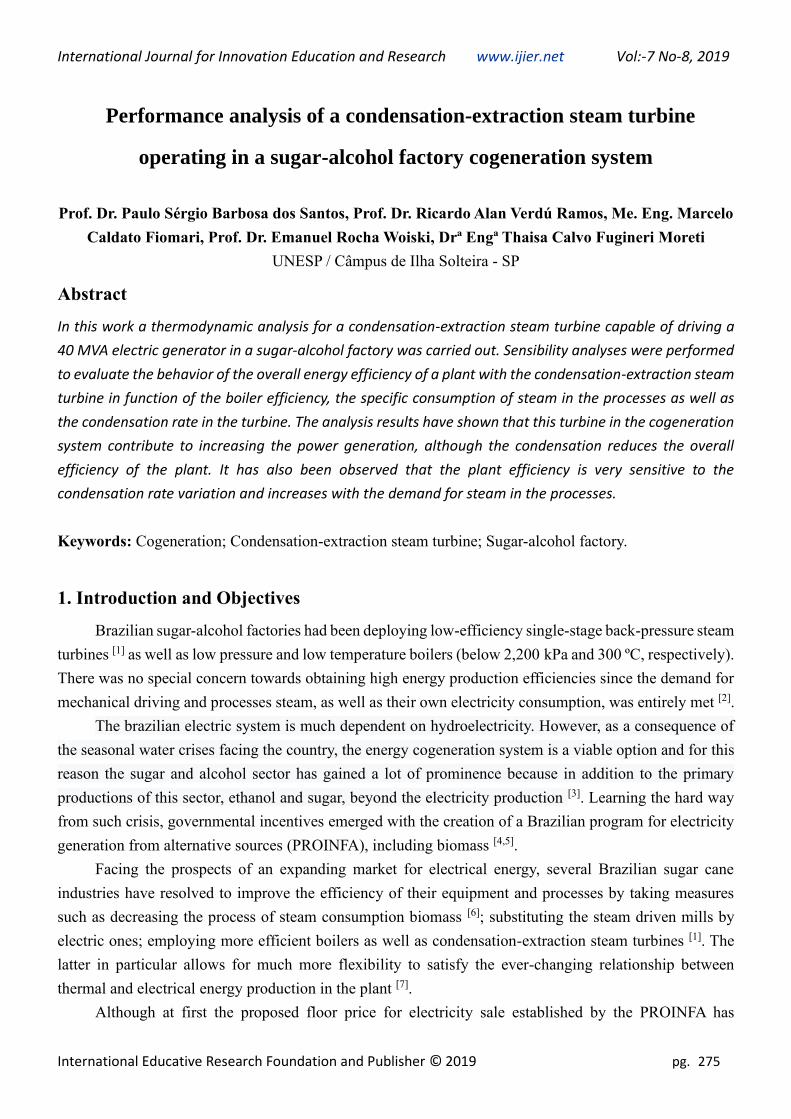
The Figure 1 depicts a very schematic view of the condensation-extraction steam turbine which drives
a 40 MVA electric generator, with nominal production capacity of 32 MW of electric power. This turbine
has been designed to operate with admission of 140 t/h of steam at 6,468 kPa and 530 ºC.
Figure 1. Scheme of condensation-extraction steam turbine
Manufacturer data sheet is shown in Table 1 for minimum and maximum mass flow rate, temperature
and pressure values in the points of admission, extraction and condensation, keeping in mind that extraction
1 valve must necessarily be fully closed or open [8] .
Despite the constant changes implemented to improve performance, Figure 2 shows the simplified
thermal power plant of the Pioneiros Bioenergia that operated until recently. In this plant all the mechanical
equipment are driven by electric motors, with the demanded electricity supplied by the generators GA and

International Journal for Innovation Education and Research www.ijier.net Vol:-7 No-8, 2019
International Educative Research Foundation and Publisher © 2019 pg. 277
GT. The condensation-extraction steam turbine ST A drives the generator GA, while generator GT is driven
by a back-pressure steam turbine ST T working at 2,156 kPa and 330 ºC.
Table 1. Steam turbine [4].
Local m (t/h) P (kPa) T (ºC)
min max min max min max
Admission - 140 - 6,600 - 530.0
Extraction 1 0 36 2,650 3,020 425.0 438.0
Extraction 2 64 120 2,370 237 134.5 147.2
Condensation 8 40 5 11.5 34.6 48.6
Data sheet for the condensation- extraction.
Figure 2. Simplified thermal plant of Pioneiros Bioenergia.
In the heat exchangers HE1 and HE2 the steam temperatures are brought down to the design-established
levels by means of water injection. Through HE1 the steam temperature is reduced to 135 ºC, suitable for
the industrial process input (point 15), while in HE2 the steam temperature is reduced to 330 ºC, adequate
for the ST T turbine input (point 11).
Most of the steam extracted (point 15) is used for the broth evaporation process EV, through which
steam is condensed and pumped (point 20) to the deaerator DE, which also receives the steam from
extraction (point 18) and condensation (point 13). After preheating in the deaerator, the water is pumped
back (point 24) to the boiler BO, beginning the cycle all over again.

International Journal for Innovation Education and Research www.ijier.net Vol:-7 No-8, 2019
International Educative Research Foundation and Publisher © 2019 pg. 278
Condensation flow rate in the turbine within the range established in Table 1 depends on the steam
consumption process. Therefore, according to the process needs, different operating points are possible and,
consequently, several distinct thermodynamic performances. Table 2 illustrates recent operational data for
the plant.
Table 2. Operational data of Pioneiros Bioenergia thermal plant
Energetic and Exergetic Analyses of a Sugar-Alcohol Factory of the Cogeneration System in Expansion
Table 3 lists the mass flow rate, pressure and temperature in the numbered locations of Figure 2. Notice
that the extraction 1 valve of the turbine ST A is kept closed, justifying the null mass flow rate in points 5
and 9.
Table 3. Mass flow rate, pressure and temperature at the numbered points of the plant in Fig. 2.
Points m (t/h) P (kPa) T (°C)
1 150.0.. 6,468.0 530.0
2 10.0.. 6,468.0 530.0
3 10.0.. 2,156.0 510.2
4 140.0.. 6,468.0 530.0
5 0.0.. -.… -....
6 120.0.. 245.0 134.5
7 20.0.. 7.2 39.6
8 20.0.. 7.2 39.5
9 0.0.. -.… -.…
10 10.0.. 2,156.0 510.2
11 11.5.. 2,156.0 330.0
12 11.5.. 245.0 164.5
13 3.5.. 245.0 134.5
14 128.0.. 245.0 137.2
15 128.2.. 245.0 135.0
16 20.0.. 490.0 39.6
17 0.2.. 490.0 39.6
Operational Data Value
Sugar cane consumption 1,400,000 t
Hours of operation in the year 4,914 h
Sugar cane flow rate in the mills 284.9 t/h
Bagasse consumption-Steam production Ratio 0.47
Fiber in the sugar cane 13.5 %
Fiber in the bagasse 47.4 %
Bagasse flow rate in the boiler 70.5 t/h
Bagasse flow rate consumption 70.5 t/h
Bagasse flow rate production 81.1 t/h
Bagasse flow rate surplus 10.6 t/h
Annual bagasse surplus 52,297 t

International Journal for Innovation Education and Research www.ijier.net Vol:-7 No-8, 2019
International Educative Research Foundation and Publisher © 2019 pg. 279
18 19.8.. 490.0 39.6
19 128.2.. 245.0 100.0
20 128.2.. 490.0 100.1
21 148.0.. 490.0 92.0
22 151.5.. 245.0 105.0
23 151.5.. 8,820.0 106.8
24 150.0.. 8,820.0 106.8
25 1.5.. 8,820.0 106.8
26 1.5.. 2,156.0 107.9
27 116.5.. 245.0 134.5
28 0.2.. 245.0 39.7
2.1 Formulation
Considering steady-state process and neglecting kinetic and potential energy, the first law of
Thermodynamics for a control volume that involves the condensation-extraction steam turbine presented
in Figure 1 can be written as [9] :
ST ST E E E E CO CO1 1 2 2CVW m h m h m h m h= − − − (1)
The equation for mass conservation in this control volume is given by:
ST E E CO1 2
m m m m 0− − − = (2)
In this case, the efficiency based on the first law of Thermodynamics can be defined as:
isoisoiso COCOE2E2E1E1STST
CV
hmhmhmhm
Wη
−−−= (3)
Note that this efficiency depends on the mass flow rate associated to the specific enthalpy of each output
of the turbine, which for non-condensing fluid is related solely to the pressure and temperature.
The specific steam consumption in the turbine (RSTPO) can be defined as a relationship between the
steam consumption and the electrical or mechanical power production, as follows:
mRSTPO
W= (4)
An alternative way for the thermodynamic analysis can be performed considering three independent
control volumes, as three different turbines (Figure 3), with the same steam property values. Thus, it is
possible to determine the specific steam consumption for each control volume or part of the turbine. The
sum of the power generated by each control volume must be equal to the total power as if a single control
volume involving the turbine had been considered.
International Journal for Innovation Education and Research www.ijier.net Vol:-7 No-8, 2019
International Educative Research Foundation and Publisher © 2019 pg. 280
Figure 3. Control volumes for each extraction functioning sequentially.
The power generated in each control volume of Fig. 3 is again obtained by the application of the first
law of the thermodynamics, resulting, respectively:
( )ICV ST ST E1W m h h= − (5)
( )( )IICV ST E1 E1 E2W m m h h= − − (6)
( )( )IIICV ST E1 E2 E2 COW m m m h h= − − − (7)
In this case, the specific steam consumption for each control volume considered is given by:
( )ICV ST E1RSTPO 1 h h= − (8)
( )IICV E1 E2RSTPO 1 h h= − (9)
( )IIICV E2 CORSTPO 1 h h= − (10)
There is another alternative to perform a thermodynamic analysis of the condensation-extraction steam turbine.
It is by considering that the steam admitted in each control volume of the turbine is driven to just one exit that controls
the volume. Thus, it is possible to determine the specific consumption of steam in each point of extraction or
condensation, considering separately each one of the control volumes presented in Figure 4.

International Journal for Innovation Education and Research www.ijier.net Vol:-7 No-8, 2019
International Educative Research Foundation and Publisher © 2019 pg. 281
Figure 4. Control volumes for each extraction functioning simultaneously.
In this case (Figure 4), the specific steam consumption for each control volume considered is given,
respectively, by:
( )ACV ST E1RSTPO 1/ h h= − (11)
( )BCV ST E2RSTPO 1 h h= − (12)
( )COSTCV hh1RSTPOC
−= (13)
In order to obtain an energetic analysis of the plant presented in Figure 2, mass and energy balances
should be performed, as well as properly defining the first thermodynamics law of efficiency, considering
a control volume for each equipment, and the first law efficiency for the whole plant can be defined as a
function of the mechanical and electrical power produced ( mecW and eleW ) and consumed in pumping
( pumpW ), the useful heat transfer rate consumed in the processes of distillation and evaporation ( evapQ and
distQ ) and lost in the condensation ( condQ ) in addition to taking into account the energy of the bagasse
( bag bagLHV m ):
ele mec evap dest pump cond
global
bag bag
W W Q Q W Qη
LHV m
+ + + − −= (14)
After implementing the thermodynamic model for the whole plant, the resulting system of equations
has been solved by means of EES® (Engineering Equation Solver) [10] , adopting the temperature of 25 ºC
and pressure of 101.3 kPa as reference state, and considering LHVbag = 7,736 kJ/kg.

International Journal for Innovation Education and Research www.ijier.net Vol:-7 No-8, 2019
International Educative Research Foundation and Publisher © 2019 pg. 282
3. Results and Discussions
Table 1 describes four cases selected for analysis (complemented by Table 5), based on the turbine
restrictions. The first law efficiency, the power production and the specific steam consumption in the
control volumes of the turbine depicted in Figure 3 are presented in Table 5 for each case.
Table 4. Definition of the cases selected according to Table 1 constraints.
Parameters Case 1 Case 2 Case 3 Case 4
STm (t/h) 140.0 140.0 140.0 140.0
E1m (t/h) 36.0 36.0 0.0 0.0
E2m (t/h) 84.0 64.0 120.0 100.0
COm (t/h) 20.0 40.0 20.0 40.0
Table 5. Efficiency, power production and specific steam consumption for each case of Table 4, based on
the control volumes presented in Figure 3.
Parameters Case 1 Case 2 Case 3 Case 4
ICVη (%) 69.1 69.1 69.1 69.1
IICVη (%) 92.2 92.2 95.1 95.1
IIICVη (%) 34.1 35.0 30.9 31.4
TotalCVη (%) 82.1 79.0 86.3 83.2
ICVW (kW) 6,681 6,681 6,681 6,681
IICVW (kW) 16,333 16,339 22,693 22,693
IIICVW (kW) 993 1,805 892 1605
TotalCVW (kW) 24,007 24,825 30,266 30,979
ICVRSTPO (kg/kWh) 21.0 21.0 21.0 21.0
IICVRSTPO (kg/kWh) 6.4 6.4 6.2 6.2
IIICVRSTPO (kg/kWh) 20.1 22.2 22.4 24.9
TotalCVRSTPO (kg/kWh) 5.8 5.6 4.6 4.5
In all cases it can be noticed that the mass flow rate in the condenser is smaller than the second
extraction flow rate. However, the efficiency for each control volume can better express the behavior of
each part of the turbine while operating sequentially, such that the flow state at each exit is the same at the
entrance for the next stage.
Taking as example Case 1, assuming that IIICV has the same mass flow rate of
ICV (140 t/h) and
considering the efficiency obtained, the power generation in IIICV (
IIICVW ) would be 6,951 kW, this is

International Journal for Innovation Education and Research www.ijier.net Vol:-7 No-8, 2019
International Educative Research Foundation and Publisher © 2019 pg. 283
larger than the power generation in ICV (
ICVW ).
Therefore, to compare the behavior of the control volumes, the specific consumption of steam in each
one of them must be used, because for the same situation this parameter allows evaluating different
conditions of mass flow, pressure and temperature of the steam. This does not stand with the power and
the efficiency; because they depend on the mass flow rate and the enthalpy variation in the isentropic
process.
In Table 5, the total values for efficiency, power and the specific consumption of steam, were defined
considering only a control volume involving the turbine. The maximum total power generation occurs in
Case 4, in which the extraction 1 is closed and the condensation rate is the maximum.
The control volumes ICV and
IIICV have larger specific steam consumption in function of the small
enthalpy difference. On the other hand, the control volume IICV has lower specific consumption.
Although the control volumes ICV and
IIICV have almost the same specific steam consumption, they
present a great difference in the efficiency; 69.1 % and 34.1 %, respectively. This occurs because the
enthalpy difference for the isentropic process is different in these control volumes.
Table 6 shows the specific steam consumption for minimum and maximum mass flow rate in each
control volume of the turbine shown in Figure 4, according to the data of Table 1.
Table 6. Specific steam consumption
Parameters Minimum Maximum
ACVRSTPO (kg/kWh) 18.4 21.0
BCVRSTPO (kg/kWh) 4.8 4.9
CCVRSTPO (kg/kWh) 3.9 4.0
Minimum and maximum mass flow rate in each control volume presented in Figure 4.
Note that the specific steam consumption (Table 6) can vary for a same control volume because the
conditions of pressure and temperature change in function of the mass flow rate at each exit. Had the steam
the same invariable conditions, the specific steam consumption in each control volume would have been
the same, like in the back-pressure turbines which have only one steam exit.
It can be verified that the lower specific consumption of steam (3.9 kg/kWh) occurs when the steam is
directed to the condenser. However, the condensate amount has influence on the efficiency and power
generation, so that when there is an increase in the condensation rate, the power generation increases and
there is a decrease in the efficiency.
Table 7 shows the power generation and the efficiency, considering the maximum admission of steam,
for the condensation rate variation that is between 8 and 20 t/h. Note that the first extraction, for this
situation, must be fully open due to the constructive restrictions presented in Table 1.

International Journal for Innovation Education and Research www.ijier.net Vol:-7 No-8, 2019
International Educative Research Foundation and Publisher © 2019 pg. 284
Table 7. Power and efficiency as a function of condensation rate from 8 to 20 t/h.
COm (t/h) E1m (t/h) E2m (t/h) CVW (kW) η (%)
8 36 96 23,437 84.8
12 36 92 23,636 83.8
16 36 88 23,827 82.9
20 36 84 24,012 82.1
As shown in Table 7, the power behavior is contrary to the efficiency with respect to the variation of
the condensation rate, therefore, the point where the inversion in the turbine behavior occurs can be defined
by means of a normalization of the values of efficiency and power. Thus, the maximum values of these
parameters are 24,012 kW and 84.8 %, respectively. Then, the curves shown in Figure 5 are obtained and
it can be observed that the curves intersection occurs in the point (12.9; 0.986). Thus, for a condensation
rate smaller than 12.9 t/h the turbine is more efficient and when this rate is increased the power generation
is improved.
Figure 5. Normalized power and efficiency as a function of condensation rate from 8 to 20 t/h.
Table 8 shows the power generation and the efficiency considering the maximum admission of steam,
for the variation of the condensation rate between 20 and 40 t/h. In this case the first extraction is closed,
since only by means of the second extraction and condensation will the maximum extraction of the steam
admitted (140 t/h) be possible.
Table 8. Power and efficiency as a function of condensation rate from 20 to 40 t/h.
COm (t/h) E2m (t/h) CVW (KW) η (%)
20 120 30,266 86.3
26 114 30,494 85.3
33 107 30,742 84.2
40 100 30,979 83.2

International Journal for Innovation Education and Research www.ijier.net Vol:-7 No-8, 2019
International Educative Research Foundation and Publisher © 2019 pg. 285
Normalizing the variables by the respective maximum values (30,979 kW and 86.3 %) the curves of
Figure 6 are obtained, from which the intersection of the curves in the point (27.2; 0.986) is found. Thus,
for condensation rates up to 27.2 t/h the turbine is more efficient and the power generation is improved
when this rate is increased. In the following the Figure 2 depicts the analysis of the influences of the boiler
efficiency, steam consumption in the processes and condensation rate on the power production and on the
global efficiency of the plant.
Figure 6. Normalized power and efficiency as a function of condensation rate from 20 to 40 t/h.
The first analysis takes into account the influence of the variation of the boiler efficiency between 71
and 87 %, representing a compatible range for modern high-pressure boilers which are much more efficient
that the traditional low-pressure boilers. The results are shown in Figure 7 that illustrates that the global
efficiency is directly proportional to the boiler efficiency, so that for each 1.3% of change in the boiler
efficiency there is 1 % of change in the global efficiency.

International Journal for Innovation Education and Research www.ijier.net Vol:-7 No-8, 2019
International Educative Research Foundation and Publisher © 2019 pg. 286
Figure. 7. Global efficiency of the plant as a function of the boiler efficiency.
The second analysis takes into account the influence of the change in the steam consumption in the
processes from 400 to 515 kg/t of sugar cane that is the maximum value possible in function of the
restrictions for steam production in the boiler and for the mass flow rate in the turbine. In this case, the total
power and global efficiency of the plant can vary from 27,577 to 31,698 kW and from 54.5 to 76.4 %,
respectively, Figure 8 shows the behavior of these parameters normalized by its maximum values (31,698
kW and 76.4 %, respectively) is depicted in Figure 8.
Figure 8. Normalized total power and global efficiency as a function of the steam consumption.
The first part of the curves in Figure 8, for specific steam consumption varying between 400 and 450
kg/t, are obtained when the turbine is operating without extraction 1, while the second part of these curves,
for specific steam consumption greater than 450 kg/t, the extraction 1 is operating. The intersection point
(475; 0.885) corresponds to the generation of 28,038 kW and an efficiency of 67.6 %. Thus, for specific
steam consumption smaller than 475 kg/t, the plant is less efficient but produces more power, if compared
with a situation in which the consumption is greater than 475 kg/t.
The third analysis takes into account the influence of the change in the condensation rate in the turbine
from 8 to 40 t/h. In this case, the total power and global efficiency of the plant can vary from 27,627 to
31,939 kW and from 48.5 to 76.4 %, respectively, the behavior of these parameters normalized by its
maximum values (31,939 kW and 76.4 %, respectively) can be studied in Figure 9.
International Journal for Innovation Education and Research www.ijier.net Vol:-7 No-8, 2019
International Educative Research Foundation and Publisher © 2019 pg. 287
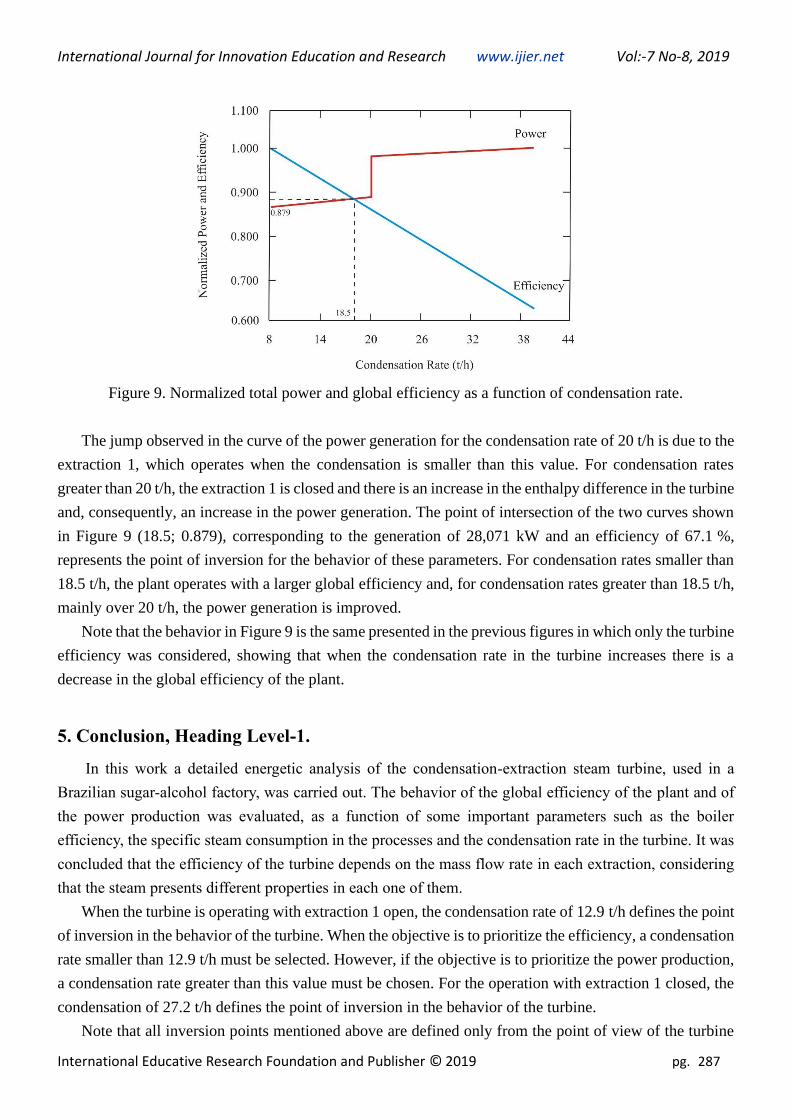
Figure 9. Normalized total power and global efficiency as a function of condensation rate.
The jump observed in the curve of the power generation for the condensation rate of 20 t/h is due to the
extraction 1, which operates when the condensation is smaller than this value. For condensation rates
greater than 20 t/h, the extraction 1 is closed and there is an increase in the enthalpy difference in the turbine
and, consequently, an increase in the power generation. The point of intersection of the two curves shown
in Figure 9 (18.5; 0.879), corresponding to the generation of 28,071 kW and an efficiency of 67.1 %,
represents the point of inversion for the behavior of these parameters. For condensation rates smaller than
18.5 t/h, the plant operates with a larger global efficiency and, for condensation rates greater than 18.5 t/h,
mainly over 20 t/h, the power generation is improved.
Note that the behavior in Figure 9 is the same presented in the previous figures in which only the turbine
efficiency was considered, showing that when the condensation rate in the turbine increases there is a
decrease in the global efficiency of the plant.
5. Conclusion, Heading Level-1.
In this work a detailed energetic analysis of the condensation-extraction steam turbine, used in a
Brazilian sugar-alcohol factory, was carried out. The behavior of the global efficiency of the plant and of
the power production was evaluated, as a function of some important parameters such as the boiler
efficiency, the specific steam consumption in the processes and the condensation rate in the turbine. It was
concluded that the efficiency of the turbine depends on the mass flow rate in each extraction, considering
that the steam presents different properties in each one of them.
When the turbine is operating with extraction 1 open, the condensation rate of 12.9 t/h defines the point
of inversion in the behavior of the turbine. When the objective is to prioritize the efficiency, a condensation
rate smaller than 12.9 t/h must be selected. However, if the objective is to prioritize the power production,
a condensation rate greater than this value must be chosen. For the operation with extraction 1 closed, the
condensation of 27.2 t/h defines the point of inversion in the behavior of the turbine.
Note that all inversion points mentioned above are defined only from the point of view of the turbine

International Journal for Innovation Education and Research www.ijier.net Vol:-7 No-8, 2019
International Educative Research Foundation and Publisher © 2019 pg. 288
and not of the thermal power plant.
With respect to the behavior of the global plant in function of the condensation rate in the turbine, it
was concluded that, if the goal is to maximize the efficiency of the plant, then a condensation rate smaller
than 18.5 t/h must be used. However, if the goal is power production, a condensation rate greater than this
value should be chosen. On the other hand, specific steam consumptions in the processes smaller than 475
kg/t will prioritize the power generation, while greater specific consumptions will prioritize the efficiency
of the plant.
The efficiency of the condensation-extraction steam turbine contributed to increase the power
production; although the condensation reduced the global efficiency of the plant.
Finally, it has been observed that the plant efficiency is very sensitive to the condensation rate variation,
increasing with the demand of steam for processes.
6. References
[1] Á. A. D. Pérez, J.C. Escobar Palacio, O. J. Venturini, A. M. Martínez Reyes, D. J. Rúa Orozco, E. E.
Silva Lora, O. A. Almazán del Omo, ‘’Thermodynamic and economic evaluation of reheat and regeneration
alternatives in cogeneration systems of the Brazilian sugarcane and alcohol sector’’, Energy, 2018, p. 247-
262.
[2] T.J.M.P. Souto, A.C.D. Coelho, R. M. de Holanda, A.S. Moraes, Y. M. Paz, R.A. J. da Silva,’’Viabilidade
da bioeletricidade a partir da cana-de-açúcar’’, Revista em Agronegócio e Meio Ambiente, Maringá, Paraná,
Brazil, 2018, p. 409-429.
[3] B. H. Barbosa, C. S. dos Santos, S. de Oliveira, ‘’Energy efficiency analysis of sugarcane bagasse in
steam generation in a sugar plant’’. Revista Metropolitana de Sustentabilidade, São Paulo, Brazil, 2018, p.
106-121.
[4] PROINFA – Incentive Program for Use of Alternative Energy Sources, Ministry of Mines and Energy,
Brazil. Available at: www.mme.gov.br/proinfa.(In Portuguese).
[5] M.C.B. Nascimento, E. P. Freire, F.D.A.S. Dantas, M. B. Giasante, ‘’State of the art of municipal solid
waste landfills that use biogas for power generation and biomethane in Brazil’’, Engenharia Sanitaria e
Ambiental, Rio de Janeiro, Brasil, 2019, p. 143-155.
[6] I.Malico, R.N. Pereira, A. C. Gonçalves, A. M. O. Sousa, ‘’Current status and future perspectives for
energy production from solid biomass in the European industry’’, Renewable and Sustainable Energy
Reviews, 2019, p. 960–977.
[7] S. Ahmad, M. A. Ali, G. M. Aita, M. T. Khan, I. A. Khan, ‘’Source-Sink Relationship of Sugarcane
Energy Production at the Sugar Mills’, Sugarcane Biofuel, Springer, Cham, Chapter 16, 2019, p. 349-388.
International Journal for Innovation Education and Research www.ijier.net Vol:-7 No-8, 2019
International Educative Research Foundation and Publisher © 2019 pg. 289
[8] Alstom Power Industrial Turbines, Steam Turbine Data Sheet, Proposal AA.SP.’1.01 Rev01, Taubaté,
Brazil, 2001.
[9] G. Van Wylen, R. Sonntag, C. Borgnakke, Fundamentals of Classical Thermodynamics, Ed. Edgard
Blücher, Sao Paulo, Brazil, 594p., 1995.
[10] S.A. Klein, F.L. Alvarado, Engineering Equation Solver, F-Chart Software, Middleton, WI, USA,
1995.
Appendix
Appendix 1- Latin Symbols
BO Boiler
BP Back-pressure
CO Condenser
DE Deaerator
EC Extraction-condensation
EV Evaporator
h Specific enthalpy (kJ/kg)
HE Heat exchanger
G Electric generator
LHV Lower Heating Value (kJ/kg)
m Mass flow rate (kg/s)
P Pressure (kPa) or Pump
Q Heat flow rate (kW)
RSTPO Ratio between steam consumption and power generated (kg/kWh)
ST Steam turbine
T Temperature (°C)
W Power (kW)
Appendix 2-Greek Symbols
First thermodynamics law efficiency (%)
h Enthalpy difference (kJ/kg)
Appendix 3- Subscripts
0 Reference state
1, 2, 3 Equipment number

International Journal for Innovation Education and Research www.ijier.net Vol:-7 No-8, 2019
International Educative Research Foundation and Publisher © 2019 pg. 290
A, B, C Control volume index
bag Sugar cane bagasse
cond Condensation
CV Control volume
CO Condenser
dest Distillation
ele Electric
evap Evaporation
E1 Extraction 1
E2 Extraction 2
in Input
iso Isoentropic
I, II, III Control volume index
mec Mechanical
out Output
ST Steam turbine