Toward reservoir oil viscosity correlation
16
Toward reservoir oil viscosity correlation Abdolhossein Hemmati-Sarapardeh a , Mahdi Khishvand b , Ali Naseri c , Amir H. Mohammadi d,e,n a Department of Chemical and Petroleum Engineering, Sharif University of Technology, Tehran, Iran b Chemical and Petroleum Engineering Department, University of Wyoming, Laramie, WY, USA c EOR Department, Research Institute of Petroleum Industry (RIPI), Tehran, Iran d Institut de Recherche en Ge´nie Chimique et Pe ´trolier (IRGCP), Paris Cedex, France e Thermodynamics Research Unit, School of Chemical Engineering, University of KwaZulu-Natal, Howard College Campus, King George V Avenue, Durban 4041, South Africa HIGHLIGHTS c Reliable viscosity correlations for dead and live oil systems have been developed. c We report few sets of oil viscosity data measured using a Rolling Ball viscometer. c A large database consisting of more than 1000 data have been used to develop them. c Their reliability is successfully examined against independent data. article info Article history: Received 18 October 2012 Received in revised form 2 December 2012 Accepted 5 December 2012 Available online 12 December 2012 Keywords: Crude oil Viscosity Correlation Reservoir fluid PVT Prediction abstract Oil viscosity plays a key role in reservoir simulation and production forecasting, as well as planning thermal enhanced oil recovery methods and these make its accurate determination necessary. In this communication, the most frequently used oil viscosity correlations are evaluated using a large databank of Iranian oil reservoirs which were measured using a Rolling Ball viscometer (Ruska, series 1602). To evaluate the performance and accuracy of these correlations, statistical and graphical error analyses have been used simultaneously. Three of the most accurate correlations for each region, including dead oil viscosity, viscosity below bubble point, viscosity at bubble point and the under- saturated oil viscosity, are recommended for Iranian oil reservoirs. In the last step, four correlations are developed for Iranian oil reservoirs which have simplified functional format. Furthermore, the input data of the latter correlations are those ones that are easily measured in oil fields. The ranges of data used to develop these new correlations cover almost all Iranian oil reservoirs PVT data and consequently they could be reliable for prediction of other Iranian oil reservoirs viscosity. These new correlations are consistent across a wide range of parameters and offer increased accuracy than previously published correlations for viscosity prediction of Iranian oil reservoirs. & 2012 Elsevier Ltd. All rights reserved. 1. Introduction Viscosity of crude oil is an important parameter for reservoir evaluation in performance calculation, simulating reservoirs, forecasting production and designing production facilities as well as planning thermal enhanced oil recovery methods (Al-Marhoun, 2004; Ali and Thomas, 1996; Elsharkawy and Alikhan, 1999; Ikiensikimama and Ogboja, 2009; Naseri et al., 2005). Therefore, accurate determination of this property is necessary for petro- leum industry. This property is traditionally measured through laboratory analysis on bottom hole samples or by recombination of liquids and gases collected from the separators. In the absence of laboratory PVT data and for saving time and money, fluid properties are mostly predicted from empirical correlations as well as equation of states (EOS). Oil viscosity correlations could be categorized generally in two types (Naseri et al., 2005). The first type is those that use oil field data that are normally available, for instance oil API gravity, reservoir temperature, saturation pressure and solution gas/oil ratio. The second type which refers to those empirical and/or semi empirical models which use some parameters that were not Contents lists available at SciVerse ScienceDirect journal homepage: www.elsevier.com/locate/ces Chemical Engineering Science 0009-2509/$ - see front matter & 2012 Elsevier Ltd. All rights reserved. http://dx.doi.org/10.1016/j.ces.2012.12.009 n Corresponding author at: Institut de Recherche en Ge ´ nie Chimique et Pe ´ trolier (IRGCP), Paris Cedex, France. E-mail addresses: [email protected], [email protected] (A.H. Mohammadi). Chemical Engineering Science 90 (2013) 53–68
-
Upload
independent -
Category
Documents
-
view
0 -
download
0
Transcript of Toward reservoir oil viscosity correlation
Chemical Engineering Science 90 (2013) 53–68
Contents lists available at SciVerse ScienceDirect
Chemical Engineering Science
0009-25
http://d
n Corr
(IRGCP)
E-m
amir_h_
journal homepage: www.elsevier.com/locate/ces
Toward reservoir oil viscosity correlation
Abdolhossein Hemmati-Sarapardeh a, Mahdi Khishvand b, Ali Naseri c,Amir H. Mohammadi d,e,n
a Department of Chemical and Petroleum Engineering, Sharif University of Technology, Tehran, Iranb Chemical and Petroleum Engineering Department, University of Wyoming, Laramie, WY, USAc EOR Department, Research Institute of Petroleum Industry (RIPI), Tehran, Irand Institut de Recherche en Genie Chimique et Petrolier (IRGCP), Paris Cedex, Francee Thermodynamics Research Unit, School of Chemical Engineering, University of KwaZulu-Natal, Howard College Campus, King George V Avenue,
Durban 4041, South Africa
H I G H L I G H T S
c Reliable viscosity correlations for dead and live oil systems have been developed.c We report few sets of oil viscosity data measured using a Rolling Ball viscometer.c A large database consisting of more than 1000 data have been used to develop them.c Their reliability is successfully examined against independent data.
a r t i c l e i n f o
Article history:
Received 18 October 2012
Received in revised form
2 December 2012
Accepted 5 December 2012Available online 12 December 2012
Keywords:
Crude oil
Viscosity
Correlation
Reservoir fluid
PVT
Prediction
09/$ - see front matter & 2012 Elsevier Ltd. A
x.doi.org/10.1016/j.ces.2012.12.009
esponding author at: Institut de Recherche en
, Paris Cedex, France.
ail addresses: [email protected],
[email protected] (A.H. Mohammadi)
a b s t r a c t
Oil viscosity plays a key role in reservoir simulation and production forecasting, as well as planning
thermal enhanced oil recovery methods and these make its accurate determination necessary. In this
communication, the most frequently used oil viscosity correlations are evaluated using a large
databank of Iranian oil reservoirs which were measured using a Rolling Ball viscometer (Ruska, series
1602). To evaluate the performance and accuracy of these correlations, statistical and graphical error
analyses have been used simultaneously. Three of the most accurate correlations for each region,
including dead oil viscosity, viscosity below bubble point, viscosity at bubble point and the under-
saturated oil viscosity, are recommended for Iranian oil reservoirs. In the last step, four correlations are
developed for Iranian oil reservoirs which have simplified functional format. Furthermore, the input
data of the latter correlations are those ones that are easily measured in oil fields. The ranges of data
used to develop these new correlations cover almost all Iranian oil reservoirs PVT data and
consequently they could be reliable for prediction of other Iranian oil reservoirs viscosity. These new
correlations are consistent across a wide range of parameters and offer increased accuracy than
previously published correlations for viscosity prediction of Iranian oil reservoirs.
& 2012 Elsevier Ltd. All rights reserved.
1. Introduction
Viscosity of crude oil is an important parameter for reservoirevaluation in performance calculation, simulating reservoirs,forecasting production and designing production facilities as wellas planning thermal enhanced oil recovery methods (Al-Marhoun,2004; Ali and Thomas, 1996; Elsharkawy and Alikhan, 1999;Ikiensikimama and Ogboja, 2009; Naseri et al., 2005). Therefore,
ll rights reserved.
Genie Chimique et Petrolier
.
accurate determination of this property is necessary for petro-leum industry. This property is traditionally measured throughlaboratory analysis on bottom hole samples or by recombinationof liquids and gases collected from the separators. In the absenceof laboratory PVT data and for saving time and money, fluidproperties are mostly predicted from empirical correlations aswell as equation of states (EOS).
Oil viscosity correlations could be categorized generally in twotypes (Naseri et al., 2005). The first type is those that use oil fielddata that are normally available, for instance oil API gravity,reservoir temperature, saturation pressure and solution gas/oilratio. The second type which refers to those empirical and/or semiempirical models which use some parameters that were not
A. Hemmati-Sarapardeh et al. / Chemical Engineering Science 90 (2013) 53–6854
included in the first one such as reservoir fluid composition, pourpoint temperature, molar mass, normal boiling point and acentricfactor as well as critical temperature (Ahrabi et al., 1987; Littleand Kennedy, 1968; Xu and Khurana, 1996).
In this study, a comprehensive detailed analysis of previousreported correlations performance have been conducted onIranian oil viscosity data which indicated the inaccuracies ofthese correlations for Iranian oil samples. This is due to highdependency of oil viscosity on oil nature and source; as it isknown most of these correlations are based on specific regions/crude oils (Elsharkawy and Alikhan, 1999; Naseri et al., 2005;Sutton and Farshad, 1990). Moreover, these correlations weredeveloped base on limited data. Afterward, based on more than1000 Iranian oil reservoirs data which are always available, fournew correlations have been proposed for prediction of viscositybelow bubble point, at bubble point, above bubble point as well asdead oil. Performance evaluation of most of previously publishedcorrelations is based on data which were used to their develop-ment and no independent measurement of correlations perfor-mance has been presented. In this study, the data points includinginputs and outputs randomly split in to two sets in order to obtainthe most efficient correlation for each individual region: 80% havebeen used for developing new correlations and adjusting theirparameters and the last 20% have been used for testing andstudying their reliability. The Average Absolute Percent RelativeError (AAPRE) has been used as the objective function for devel-oping these correlations. In addition, to evaluate their perfor-mance and accuracy, both statistical and graphical error analysishave been used simultaneously.
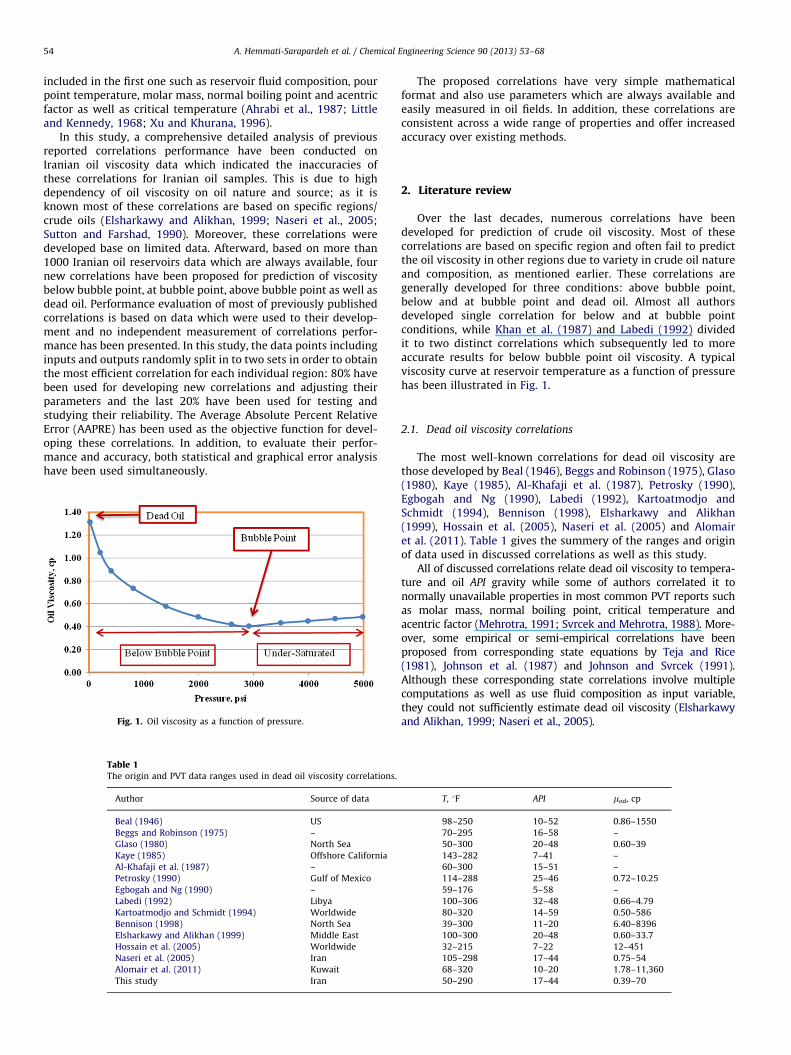
Fig. 1. Oil viscosity as a function of pressure.
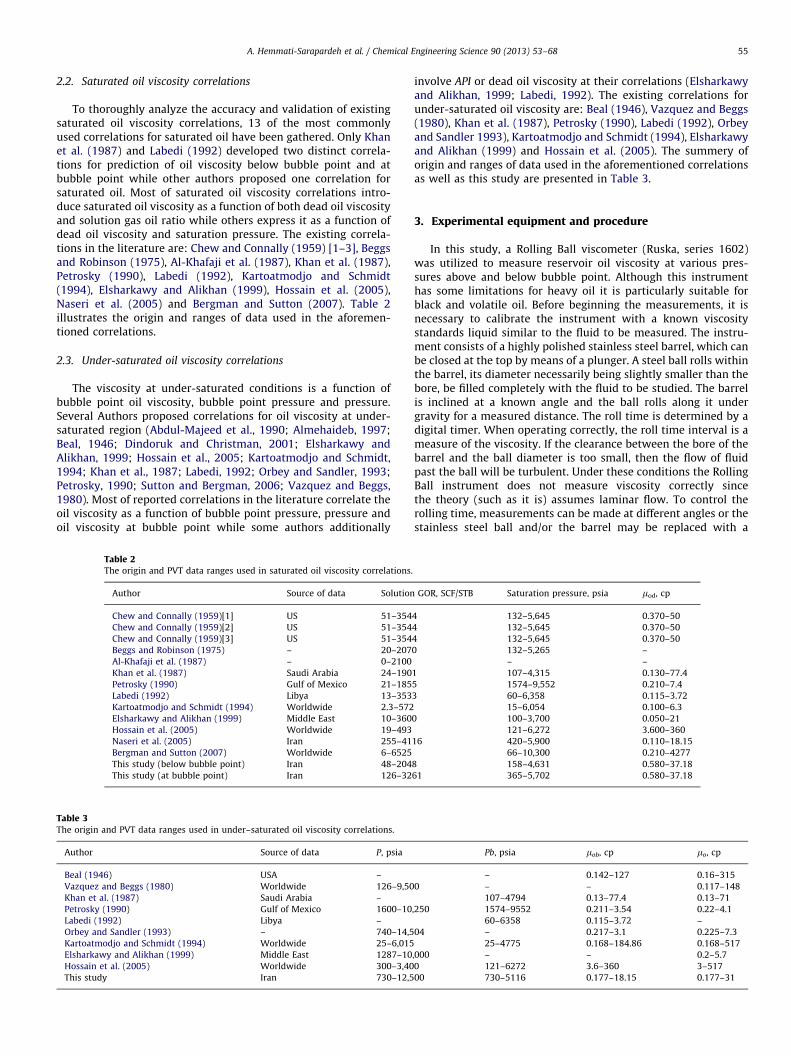
Table 1The origin and PVT data ranges used in dead oil viscosity correlations.
Author Source of data
Beal (1946) US
Beggs and Robinson (1975) –
Glaso (1980) North Sea
Kaye (1985) Offshore California
Al-Khafaji et al. (1987) –
Petrosky (1990) Gulf of Mexico
Egbogah and Ng (1990) –
Labedi (1992) Libya
Kartoatmodjo and Schmidt (1994) Worldwide
Bennison (1998) North Sea
Elsharkawy and Alikhan (1999) Middle East
Hossain et al. (2005) Worldwide
Naseri et al. (2005) Iran
Alomair et al. (2011) Kuwait
This study Iran
The proposed correlations have very simple mathematicalformat and also use parameters which are always available andeasily measured in oil fields. In addition, these correlations areconsistent across a wide range of properties and offer increasedaccuracy over existing methods.
2. Literature review
Over the last decades, numerous correlations have beendeveloped for prediction of crude oil viscosity. Most of thesecorrelations are based on specific region and often fail to predictthe oil viscosity in other regions due to variety in crude oil natureand composition, as mentioned earlier. These correlations aregenerally developed for three conditions: above bubble point,below and at bubble point and dead oil. Almost all authorsdeveloped single correlation for below and at bubble pointconditions, while Khan et al. (1987) and Labedi (1992) dividedit to two distinct correlations which subsequently led to moreaccurate results for below bubble point oil viscosity. A typicalviscosity curve at reservoir temperature as a function of pressurehas been illustrated in Fig. 1.
2.1. Dead oil viscosity correlations
The most well-known correlations for dead oil viscosity arethose developed by Beal (1946), Beggs and Robinson (1975), Glaso(1980), Kaye (1985), Al-Khafaji et al. (1987), Petrosky (1990),Egbogah and Ng (1990), Labedi (1992), Kartoatmodjo andSchmidt (1994), Bennison (1998), Elsharkawy and Alikhan(1999), Hossain et al. (2005), Naseri et al. (2005) and Alomairet al. (2011). Table 1 gives the summery of the ranges and originof data used in discussed correlations as well as this study.
All of discussed correlations relate dead oil viscosity to tempera-ture and oil API gravity while some of authors correlated it tonormally unavailable properties in most common PVT reports suchas molar mass, normal boiling point, critical temperature andacentric factor (Mehrotra, 1991; Svrcek and Mehrotra, 1988). More-over, some empirical or semi-empirical correlations have beenproposed from corresponding state equations by Teja and Rice(1981), Johnson et al. (1987) and Johnson and Svrcek (1991).Although these corresponding state correlations involve multiplecomputations as well as use fluid composition as input variable,they could not sufficiently estimate dead oil viscosity (Elsharkawyand Alikhan, 1999; Naseri et al., 2005).
T, 1F API mod, cp
98–250 10–52 0.86–1550
70–295 16–58 –
50–300 20–48 0.60–39
143–282 7–41 –
60–300 15–51 –
114–288 25–46 0.72–10.25
59–176 5–58 –
100–306 32–48 0.66–4.79
80–320 14–59 0.50–586
39–300 11–20 6.40–8396
100–300 20–48 0.60–33.7
32–215 7–22 12–451
105–298 17–44 0.75–54
68–320 10–20 1.78–11,360
50–290 17–44 0.39–70
A. Hemmati-Sarapardeh et al. / Chemical Engineering Science 90 (2013) 53–68 55
2.2. Saturated oil viscosity correlations
To thoroughly analyze the accuracy and validation of existingsaturated oil viscosity correlations, 13 of the most commonlyused correlations for saturated oil have been gathered. Only Khanet al. (1987) and Labedi (1992) developed two distinct correla-tions for prediction of oil viscosity below bubble point and atbubble point while other authors proposed one correlation forsaturated oil. Most of saturated oil viscosity correlations intro-duce saturated oil viscosity as a function of both dead oil viscosityand solution gas oil ratio while others express it as a function ofdead oil viscosity and saturation pressure. The existing correla-tions in the literature are: Chew and Connally (1959) [1–3], Beggsand Robinson (1975), Al-Khafaji et al. (1987), Khan et al. (1987),Petrosky (1990), Labedi (1992), Kartoatmodjo and Schmidt(1994), Elsharkawy and Alikhan (1999), Hossain et al. (2005),Naseri et al. (2005) and Bergman and Sutton (2007). Table 2illustrates the origin and ranges of data used in the aforemen-tioned correlations.
2.3. Under-saturated oil viscosity correlations
The viscosity at under-saturated conditions is a function ofbubble point oil viscosity, bubble point pressure and pressure.Several Authors proposed correlations for oil viscosity at under-saturated region (Abdul-Majeed et al., 1990; Almehaideb, 1997;Beal, 1946; Dindoruk and Christman, 2001; Elsharkawy andAlikhan, 1999; Hossain et al., 2005; Kartoatmodjo and Schmidt,1994; Khan et al., 1987; Labedi, 1992; Orbey and Sandler, 1993;Petrosky, 1990; Sutton and Bergman, 2006; Vazquez and Beggs,1980). Most of reported correlations in the literature correlate theoil viscosity as a function of bubble point pressure, pressure andoil viscosity at bubble point while some authors additionally
Table 2The origin and PVT data ranges used in saturated oil viscosity correlations.
Author Source of data Solution
Chew and Connally (1959)[1] US 51–354
Chew and Connally (1959)[2] US 51–354
Chew and Connally (1959)[3] US 51–354
Beggs and Robinson (1975) – 20–207
Al-Khafaji et al. (1987) – 0–2100
Khan et al. (1987) Saudi Arabia 24–190
Petrosky (1990) Gulf of Mexico 21–185
Labedi (1992) Libya 13–353
Kartoatmodjo and Schmidt (1994) Worldwide 2.3–572
Elsharkawy and Alikhan (1999) Middle East 10–360
Hossain et al. (2005) Worldwide 19–493
Naseri et al. (2005) Iran 255–41
Bergman and Sutton (2007) Worldwide 6–6525
This study (below bubble point) Iran 48–204
This study (at bubble point) Iran 126–32
Table 3The origin and PVT data ranges used in under–saturated oil viscosity correlations.
Author Source of data P, psia
Beal (1946) USA –
Vazquez and Beggs (1980) Worldwide 126–9,50
Khan et al. (1987) Saudi Arabia –
Petrosky (1990) Gulf of Mexico 1600–10
Labedi (1992) Libya –
Orbey and Sandler (1993) – 740–14,5
Kartoatmodjo and Schmidt (1994) Worldwide 25–6,015
Elsharkawy and Alikhan (1999) Middle East 1287–10
Hossain et al. (2005) Worldwide 300–3,40
This study Iran 730–12,5
involve API or dead oil viscosity at their correlations (Elsharkawyand Alikhan, 1999; Labedi, 1992). The existing correlations forunder-saturated oil viscosity are: Beal (1946), Vazquez and Beggs(1980), Khan et al. (1987), Petrosky (1990), Labedi (1992), Orbeyand Sandler 1993), Kartoatmodjo and Schmidt (1994), Elsharkawyand Alikhan (1999) and Hossain et al. (2005). The summery oforigin and ranges of data used in the aforementioned correlationsas well as this study are presented in Table 3.
3. Experimental equipment and procedure
In this study, a Rolling Ball viscometer (Ruska, series 1602)was utilized to measure reservoir oil viscosity at various pres-sures above and below bubble point. Although this instrumenthas some limitations for heavy oil it is particularly suitable forblack and volatile oil. Before beginning the measurements, it isnecessary to calibrate the instrument with a known viscositystandards liquid similar to the fluid to be measured. The instru-ment consists of a highly polished stainless steel barrel, which canbe closed at the top by means of a plunger. A steel ball rolls withinthe barrel, its diameter necessarily being slightly smaller than thebore, be filled completely with the fluid to be studied. The barrelis inclined at a known angle and the ball rolls along it undergravity for a measured distance. The roll time is determined by adigital timer. When operating correctly, the roll time interval is ameasure of the viscosity. If the clearance between the bore of thebarrel and the ball diameter is too small, then the flow of fluidpast the ball will be turbulent. Under these conditions the RollingBall instrument does not measure viscosity correctly sincethe theory (such as it is) assumes laminar flow. To control therolling time, measurements can be made at different angles or thestainless steel ball and/or the barrel may be replaced with a
GOR, SCF/STB Saturation pressure, psia mod, cp
4 132–5,645 0.370–50
4 132–5,645 0.370–50
4 132–5,645 0.370–50
0 132–5,265 –
– –
1 107–4,315 0.130–77.4
5 1574–9,552 0.210–7.4
3 60–6,358 0.115–3.72
15–6,054 0.100–6.3
0 100–3,700 0.050–21
121–6,272 3.600–360
16 420–5,900 0.110–18.15
66–10,300 0.210–4277
8 158–4,631 0.580–37.18
61 365–5,702 0.580–37.18
Pb, psia mob, cp mo, cp
– 0.142–127 0.16–315
0 – – 0.117–148
107–4794 0.13–77.4 0.13–71
,250 1574–9552 0.211–3.54 0.22–4.1
60–6358 0.115–3.72 –
04 – 0.217–3.1 0.225–7.3
25–4775 0.168–184.86 0.168–517
,000 – – 0.2–5.7
0 121–6272 3.6–360 3–517
00 730–5116 0.177–18.15 0.177–31
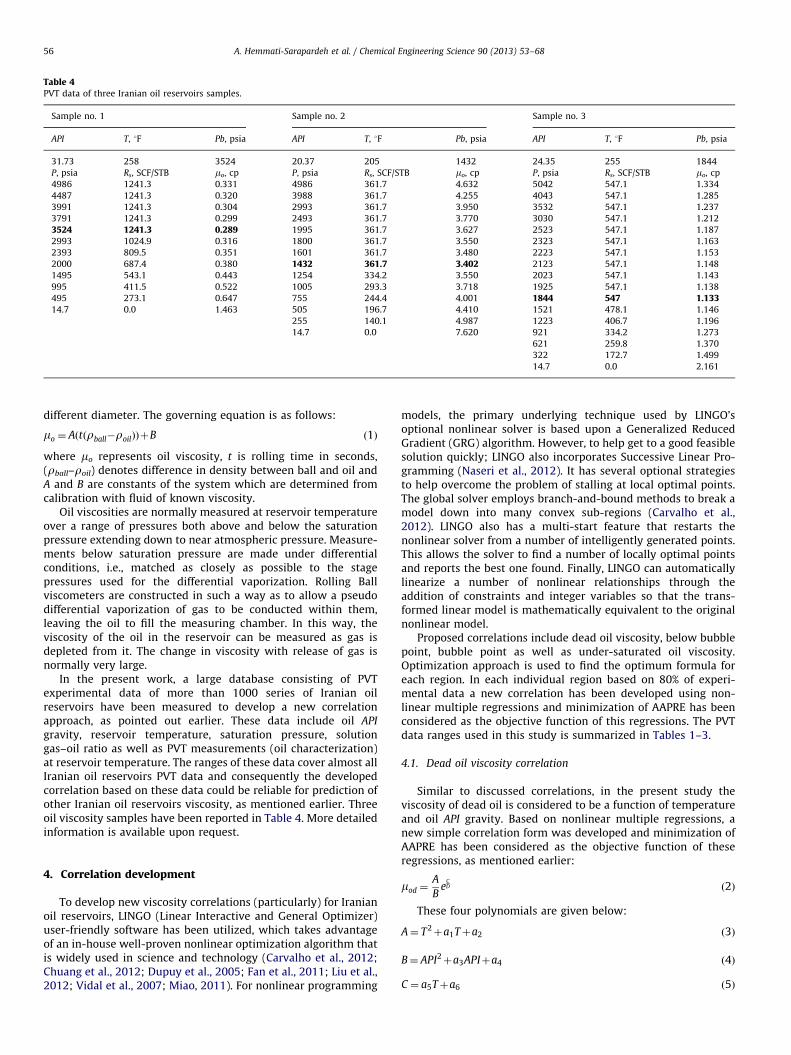
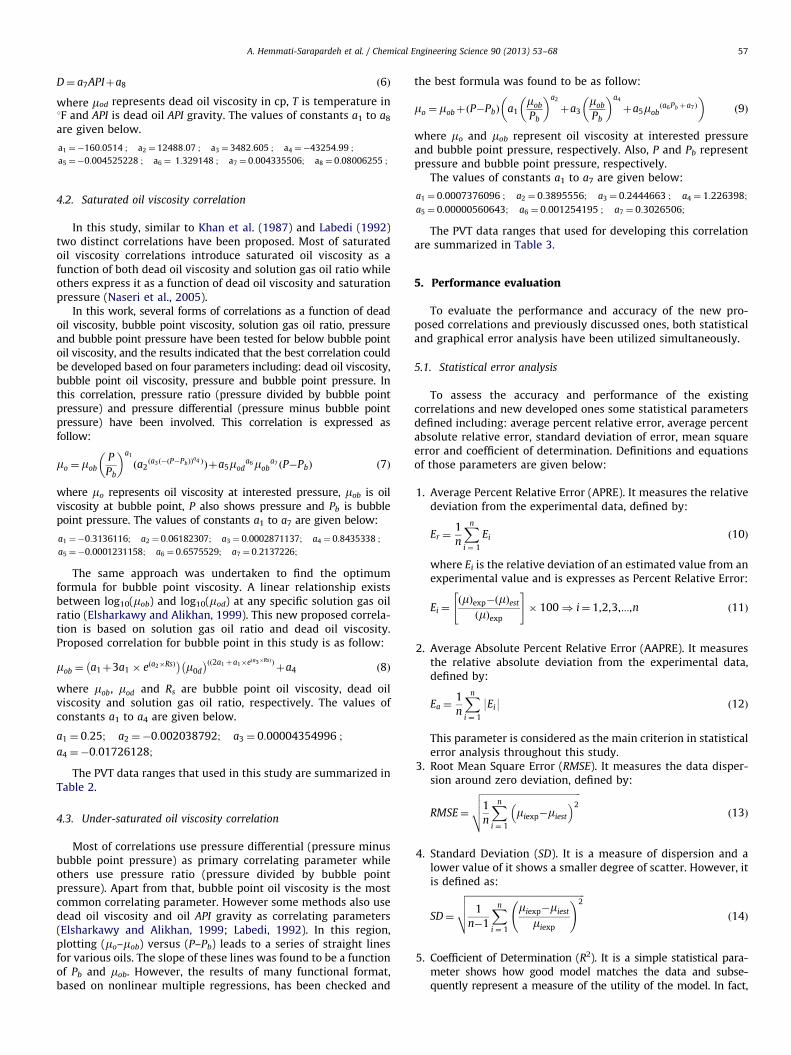
Table 4PVT data of three Iranian oil reservoirs samples.
Sample no. 1 Sample no. 2 Sample no. 3
API T, 1F Pb, psia API T, 1F Pb, psia API T, 1F Pb, psia
31.73 258 3524 20.37 205 1432 24.35 255 1844
P, psia Rs, SCF/STB mo, cp P, psia Rs, SCF/STB mo, cp P, psia Rs, SCF/STB mo, cp
4986 1241.3 0.331 4986 361.7 4.632 5042 547.1 1.334
4487 1241.3 0.320 3988 361.7 4.255 4043 547.1 1.285
3991 1241.3 0.304 2993 361.7 3.950 3532 547.1 1.237
3791 1241.3 0.299 2493 361.7 3.770 3030 547.1 1.212
3524 1241.3 0.289 1995 361.7 3.627 2523 547.1 1.187
2993 1024.9 0.316 1800 361.7 3.550 2323 547.1 1.163
2393 809.5 0.351 1601 361.7 3.480 2223 547.1 1.153
2000 687.4 0.380 1432 361.7 3.402 2123 547.1 1.148
1495 543.1 0.443 1254 334.2 3.550 2023 547.1 1.143
995 411.5 0.522 1005 293.3 3.718 1925 547.1 1.138
495 273.1 0.647 755 244.4 4.001 1844 547 1.13314.7 0.0 1.463 505 196.7 4.410 1521 478.1 1.146
255 140.1 4.987 1223 406.7 1.196
14.7 0.0 7.620 921 334.2 1.273
621 259.8 1.370
322 172.7 1.499
14.7 0.0 2.161
A. Hemmati-Sarapardeh et al. / Chemical Engineering Science 90 (2013) 53–6856
different diameter. The governing equation is as follows:
mo ¼ Aðtðrball�roilÞÞþB ð1Þ
where mo represents oil viscosity, t is rolling time in seconds,(rball–roil) denotes difference in density between ball and oil andA and B are constants of the system which are determined fromcalibration with fluid of known viscosity.
Oil viscosities are normally measured at reservoir temperatureover a range of pressures both above and below the saturationpressure extending down to near atmospheric pressure. Measure-ments below saturation pressure are made under differentialconditions, i.e., matched as closely as possible to the stagepressures used for the differential vaporization. Rolling Ballviscometers are constructed in such a way as to allow a pseudodifferential vaporization of gas to be conducted within them,leaving the oil to fill the measuring chamber. In this way, theviscosity of the oil in the reservoir can be measured as gas isdepleted from it. The change in viscosity with release of gas isnormally very large.
In the present work, a large database consisting of PVTexperimental data of more than 1000 series of Iranian oilreservoirs have been measured to develop a new correlationapproach, as pointed out earlier. These data include oil API
gravity, reservoir temperature, saturation pressure, solutiongas–oil ratio as well as PVT measurements (oil characterization)at reservoir temperature. The ranges of these data cover almost allIranian oil reservoirs PVT data and consequently the developedcorrelation based on these data could be reliable for prediction ofother Iranian oil reservoirs viscosity, as mentioned earlier. Threeoil viscosity samples have been reported in Table 4. More detailedinformation is available upon request.
4. Correlation development
To develop new viscosity correlations (particularly) for Iranianoil reservoirs, LINGO (Linear Interactive and General Optimizer)user-friendly software has been utilized, which takes advantageof an in-house well-proven nonlinear optimization algorithm thatis widely used in science and technology (Carvalho et al., 2012;Chuang et al., 2012; Dupuy et al., 2005; Fan et al., 2011; Liu et al.,2012; Vidal et al., 2007; Miao, 2011). For nonlinear programming
models, the primary underlying technique used by LINGO’soptional nonlinear solver is based upon a Generalized ReducedGradient (GRG) algorithm. However, to help get to a good feasiblesolution quickly; LINGO also incorporates Successive Linear Pro-gramming (Naseri et al., 2012). It has several optional strategiesto help overcome the problem of stalling at local optimal points.The global solver employs branch-and-bound methods to break amodel down into many convex sub-regions (Carvalho et al.,2012). LINGO also has a multi-start feature that restarts thenonlinear solver from a number of intelligently generated points.This allows the solver to find a number of locally optimal pointsand reports the best one found. Finally, LINGO can automaticallylinearize a number of nonlinear relationships through theaddition of constraints and integer variables so that the trans-formed linear model is mathematically equivalent to the originalnonlinear model.
Proposed correlations include dead oil viscosity, below bubblepoint, bubble point as well as under-saturated oil viscosity.Optimization approach is used to find the optimum formula foreach region. In each individual region based on 80% of experi-mental data a new correlation has been developed using non-linear multiple regressions and minimization of AAPRE has beenconsidered as the objective function of this regressions. The PVTdata ranges used in this study is summarized in Tables 1–3.
4.1. Dead oil viscosity correlation
Similar to discussed correlations, in the present study theviscosity of dead oil is considered to be a function of temperatureand oil API gravity. Based on nonlinear multiple regressions, anew simple correlation form was developed and minimization ofAAPRE has been considered as the objective function of theseregressions, as mentioned earlier:
mod ¼A
Be
CD ð2Þ
These four polynomials are given below:
A¼ T2þa1Tþa2 ð3Þ
B¼ API2þa3APIþa4 ð4Þ
C ¼ a5Tþa6 ð5Þ
A. Hemmati-Sarapardeh et al. / Chemical Engineering Science 90 (2013) 53–68 57
D¼ a7APIþa8 ð6Þ
where mod represents dead oil viscosity in cp, T is temperature in1F and API is dead oil API gravity. The values of constants a1 to a8
are given below.
a1 ¼�160:0514 ; a2 ¼ 12488:07 ; a3 ¼ 3482:605 ; a4 ¼�43254:99 ;
a5 ¼�0:004525228 ; a6 ¼ 1:329148 ; a7 ¼ 0:004335506; a8 ¼ 0:08006255 ;
4.2. Saturated oil viscosity correlation
In this study, similar to Khan et al. (1987) and Labedi (1992)two distinct correlations have been proposed. Most of saturatedoil viscosity correlations introduce saturated oil viscosity as afunction of both dead oil viscosity and solution gas oil ratio whileothers express it as a function of dead oil viscosity and saturationpressure (Naseri et al., 2005).
In this work, several forms of correlations as a function of deadoil viscosity, bubble point viscosity, solution gas oil ratio, pressureand bubble point pressure have been tested for below bubble pointoil viscosity, and the results indicated that the best correlation couldbe developed based on four parameters including: dead oil viscosity,bubble point oil viscosity, pressure and bubble point pressure. Inthis correlation, pressure ratio (pressure divided by bubble pointpressure) and pressure differential (pressure minus bubble pointpressure) have been involved. This correlation is expressed asfollow:
mo ¼ mob
P
Pb
� �a1
ða2ða3ð�ðP�PbÞÞ
a4 ÞÞþa5moda6mob
a7 P�Pbð Þ ð7Þ
where mo represents oil viscosity at interested pressure, mob is oilviscosity at bubble point, P also shows pressure and Pb is bubblepoint pressure. The values of constants a1 to a7 are given below:
a1 ¼�0:3136116; a2 ¼ 0:06182307; a3 ¼ 0:0002871137; a4 ¼ 0:8435338 ;
a5 ¼�0:0001231158; a6 ¼ 0:6575529; a7 ¼ 0:2137226;
The same approach was undertaken to find the optimumformula for bubble point viscosity. A linear relationship existsbetween log10(mob) and log10(mod) at any specific solution gas oilratio (Elsharkawy and Alikhan, 1999). This new proposed correla-tion is based on solution gas oil ratio and dead oil viscosity.Proposed correlation for bubble point in this study is as follow:
mob ¼ a1þ3a1 � e a2�Rsð Þ� �
m0d
� �ðð2a1þa1�eða3�RsÞÞþa4 ð8Þ
where mob, mod and Rs are bubble point oil viscosity, dead oilviscosity and solution gas oil ratio, respectively. The values ofconstants a1 to a4 are given below.
a1 ¼ 0:25; a2 ¼�0:002038792; a3 ¼ 0:00004354996 ;
a4 ¼�0:01726128;
The PVT data ranges that used in this study are summarized inTable 2.
4.3. Under-saturated oil viscosity correlation
Most of correlations use pressure differential (pressure minusbubble point pressure) as primary correlating parameter whileothers use pressure ratio (pressure divided by bubble pointpressure). Apart from that, bubble point oil viscosity is the mostcommon correlating parameter. However some methods also usedead oil viscosity and oil API gravity as correlating parameters(Elsharkawy and Alikhan, 1999; Labedi, 1992). In this region,plotting (mo–mob) versus (P–Pb) leads to a series of straight linesfor various oils. The slope of these lines was found to be a functionof Pb and mob. However, the results of many functional format,based on nonlinear multiple regressions, has been checked and
the best formula was found to be as follow:
mo ¼ mobþ P�Pbð Þ a1mob
Pb
� �a2
þa3mob
Pb
� �a4
þa5moba6Pbþa7ð Þ
� �ð9Þ
where mo and mob represent oil viscosity at interested pressureand bubble point pressure, respectively. Also, P and Pb representpressure and bubble point pressure, respectively.
The values of constants a1 to a7 are given below:
a1 ¼ 0:0007376096 ; a2 ¼ 0:3895556; a3 ¼ 0:2444663 ; a4 ¼ 1:226398;
a5 ¼ 0:00000560643; a6 ¼ 0:001254195 ; a7 ¼ 0:3026506;
The PVT data ranges that used for developing this correlationare summarized in Table 3.
5. Performance evaluation
To evaluate the performance and accuracy of the new pro-posed correlations and previously discussed ones, both statisticaland graphical error analysis have been utilized simultaneously.
5.1. Statistical error analysis
To assess the accuracy and performance of the existingcorrelations and new developed ones some statistical parametersdefined including: average percent relative error, average percentabsolute relative error, standard deviation of error, mean squareerror and coefficient of determination. Definitions and equationsof those parameters are given below:
1.
Average Percent Relative Error (APRE). It measures the relativedeviation from the experimental data, defined by:Er ¼1
n
Xn
i ¼ 1
Ei ð10Þ
where Ei is the relative deviation of an estimated value from anexperimental value and is expresses as Percent Relative Error:
Ei ¼ðmÞexp�ðmÞest
ðmÞexp
" #� 100) i¼ 1,2,3,:::,n ð11Þ
2.
Average Absolute Percent Relative Error (AAPRE). It measuresthe relative absolute deviation from the experimental data,defined by:Ea ¼1
n
Xn
i ¼ 1
9Ei9 ð12Þ
This parameter is considered as the main criterion in statisticalerror analysis throughout this study.
3.
Root Mean Square Error (RMSE). It measures the data disper-sion around zero deviation, defined by:RMSE¼
ffiffiffiffiffiffiffiffiffiffiffiffiffiffiffiffiffiffiffiffiffiffiffiffiffiffiffiffiffiffiffiffiffiffiffiffiffiffiffiffiffiffiffi1
n
Xn
i ¼ 1
miexp�miest
� �2
vuut ð13Þ
4.
Standard Deviation (SD). It is a measure of dispersion and alower value of it shows a smaller degree of scatter. However, itis defined as:SD¼
ffiffiffiffiffiffiffiffiffiffiffiffiffiffiffiffiffiffiffiffiffiffiffiffiffiffiffiffiffiffiffiffiffiffiffiffiffiffiffiffiffiffiffiffiffiffiffiffiffiffiffi1
n�1
Xn
i ¼ 1
miexp�miest
miexp
!2vuut
ð14Þ
5.
Coefficient of Determination (R2). It is a simple statistical para-meter shows how good model matches the data and subse-quently represent a measure of the utility of the model. In fact,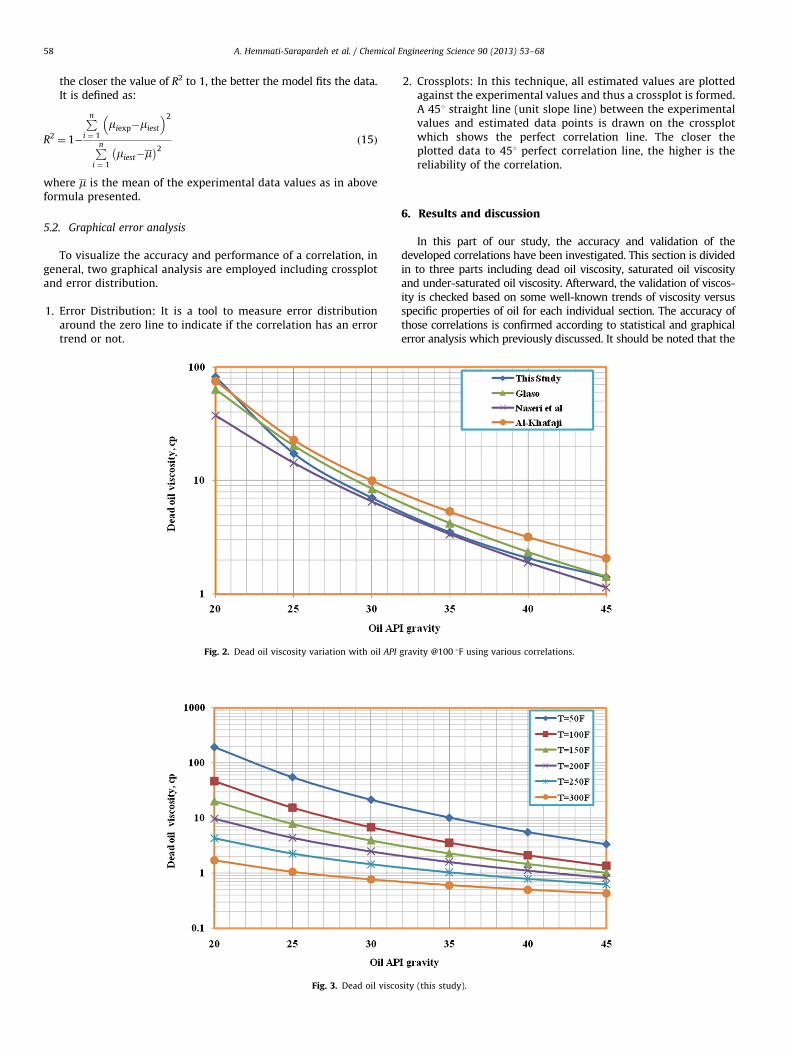
A. Hemmati-Sarapardeh et al. / Chemical Engineering Science 90 (2013) 53–6858
the closer the value of R2 to 1, the better the model fits the data.It is defined as:
R2¼ 1�
Pni ¼ 1
miexp�miest
� �2
Pni ¼ 1
miest�m� �2
ð15Þ
where m is the mean of the experimental data values as in aboveformula presented.
5.2. Graphical error analysis
To visualize the accuracy and performance of a correlation, ingeneral, two graphical analysis are employed including crossplotand error distribution.
1.
Error Distribution: It is a tool to measure error distributionaround the zero line to indicate if the correlation has an errortrend or not.Fig. 2. Dead oil viscosity variation with oil API
Fig. 3. Dead oil visco
2.
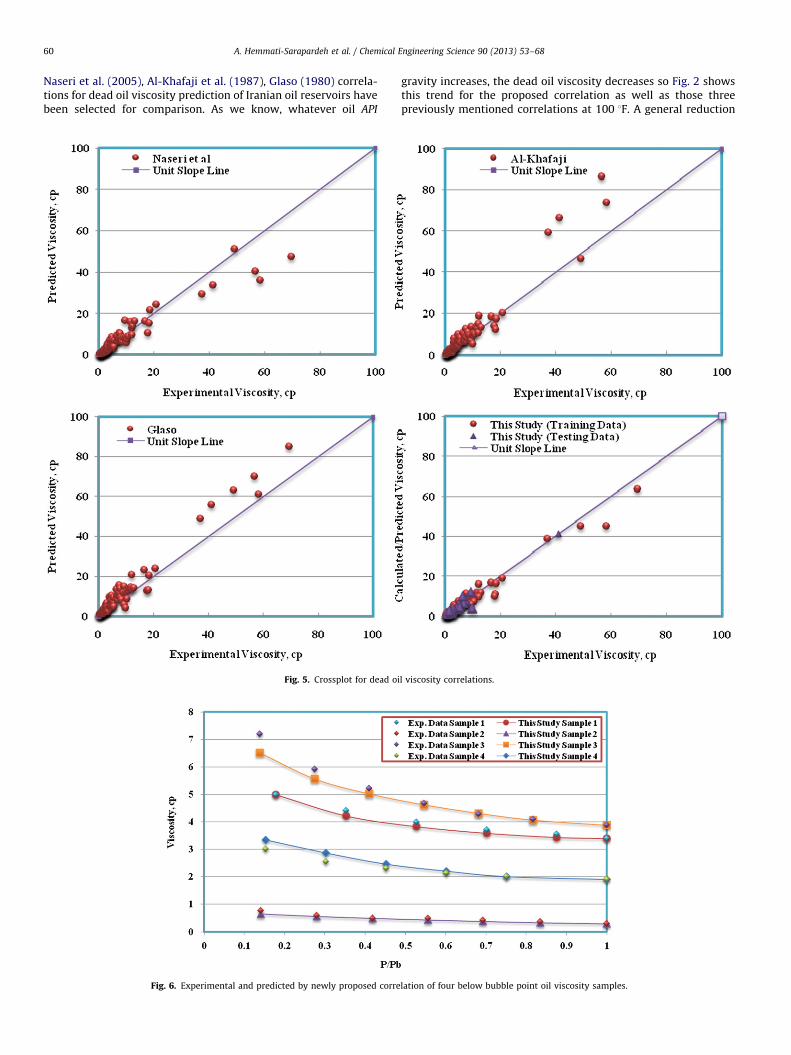
Crossplots: In this technique, all estimated values are plottedagainst the experimental values and thus a crossplot is formed.A 451 straight line (unit slope line) between the experimentalvalues and estimated data points is drawn on the crossplotwhich shows the perfect correlation line. The closer theplotted data to 451 perfect correlation line, the higher is thereliability of the correlation.6. Results and discussion
In this part of our study, the accuracy and validation of thedeveloped correlations have been investigated. This section is dividedin to three parts including dead oil viscosity, saturated oil viscosityand under-saturated oil viscosity. Afterward, the validation of viscos-ity is checked based on some well-known trends of viscosity versusspecific properties of oil for each individual section. The accuracy ofthose correlations is confirmed according to statistical and graphicalerror analysis which previously discussed. It should be noted that the
gravity @100 1F using various correlations.
sity (this study).
A. Hemmati-Sarapardeh et al. / Chemical Engineering Science 90 (2013) 53–68 59
application of these new proposed correlations are in ranges thatthese correlations have been derived from them. In addition, applica-tion of these new correlations to other regions located around theworld should be checked.
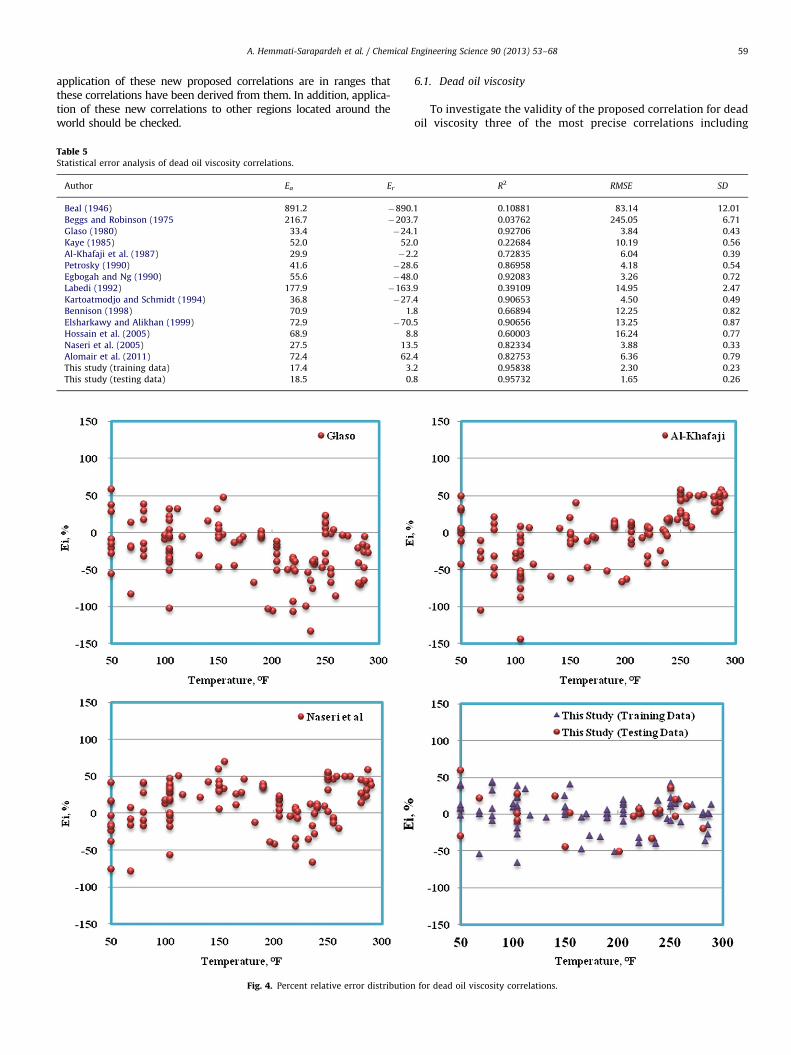
Table 5Statistical error analysis of dead oil viscosity correlations.
Author Ea Er
Beal (1946) 891.2 �890
Beggs and Robinson (1975 216.7 �203
Glaso (1980) 33.4 �24.
Kaye (1985) 52.0 52.
Al-Khafaji et al. (1987) 29.9 �2
Petrosky (1990) 41.6 �28.
Egbogah and Ng (1990) 55.6 �48.
Labedi (1992) 177.9 �163
Kartoatmodjo and Schmidt (1994) 36.8 �27.
Bennison (1998) 70.9 1
Elsharkawy and Alikhan (1999) 72.9 �70
Hossain et al. (2005) 68.9 8
Naseri et al. (2005) 27.5 13.
Alomair et al. (2011) 72.4 62.
This study (training data) 17.4 3
This study (testing data) 18.5 0
Fig. 4. Percent relative error distribution
6.1. Dead oil viscosity
To investigate the validity of the proposed correlation for deadoil viscosity three of the most precise correlations including
R2 RMSE SD
.1 0.10881 83.14 12.01
.7 0.03762 245.05 6.71
1 0.92706 3.84 0.43
0 0.22684 10.19 0.56
.2 0.72835 6.04 0.39
6 0.86958 4.18 0.54
0 0.92083 3.26 0.72
.9 0.39109 14.95 2.47
4 0.90653 4.50 0.49
.8 0.66894 12.25 0.82
.5 0.90656 13.25 0.87
.8 0.60003 16.24 0.77
5 0.82334 3.88 0.33
4 0.82753 6.36 0.79
.2 0.95838 2.30 0.23
.8 0.95732 1.65 0.26
for dead oil viscosity correlations.
A. Hemmati-Sarapardeh et al. / Chemical Engineering Science 90 (2013) 53–6860
Naseri et al. (2005), Al-Khafaji et al. (1987), Glaso (1980) correla-tions for dead oil viscosity prediction of Iranian oil reservoirs havebeen selected for comparison. As we know, whatever oil API
Fig. 5. Crossplot for dead oi
Fig. 6. Experimental and predicted by newly proposed corre
gravity increases, the dead oil viscosity decreases so Fig. 2 showsthis trend for the proposed correlation as well as those threepreviously mentioned correlations at 100 1F. A general reduction
l viscosity correlations.
lation of four below bubble point oil viscosity samples.
A. Hemmati-Sarapardeh et al. / Chemical Engineering Science 90 (2013) 53–68 61
in dead oil viscosity is expected with increasing temperature andthis effect is more sensible at lower temperature. This trend iscaptured by the new proposed correlation for dead oil viscosity(see Fig. 3).
Statistical error analysis for the dead oil viscosity correlationsare illustrated in Table 5. As previously mentioned in this section,the last 20% of experimental data have been used for testingwhich have no effect on development of the new correlations and
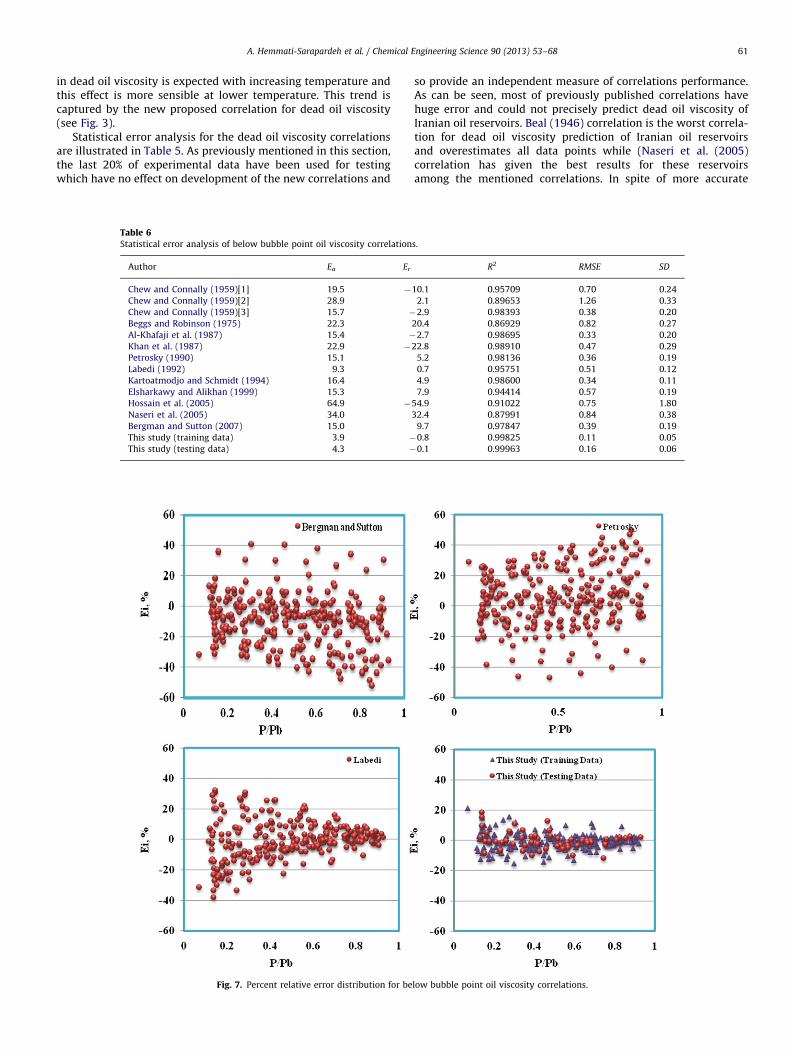
Table 6Statistical error analysis of below bubble point oil viscosity correlation
Author Ea Er
Chew and Connally (1959)[1] 19.5 �
Chew and Connally (1959)[2] 28.9
Chew and Connally (1959)[3] 15.7 �
Beggs and Robinson (1975) 22.3
Al-Khafaji et al. (1987) 15.4 �
Khan et al. (1987) 22.9 �
Petrosky (1990) 15.1
Labedi (1992) 9.3
Kartoatmodjo and Schmidt (1994) 16.4
Elsharkawy and Alikhan (1999) 15.3
Hossain et al. (2005) 64.9 �
Naseri et al. (2005) 34.0
Bergman and Sutton (2007) 15.0
This study (training data) 3.9 �
This study (testing data) 4.3 �
Fig. 7. Percent relative error distribution for be
so provide an independent measure of correlations performance.As can be seen, most of previously published correlations havehuge error and could not precisely predict dead oil viscosity ofIranian oil reservoirs. Beal (1946) correlation is the worst correla-tion for dead oil viscosity prediction of Iranian oil reservoirsand overestimates all data points while (Naseri et al. (2005)correlation has given the best results for these reservoirsamong the mentioned correlations. In spite of more accurate
s.
R2 RMSE SD
10.1 0.95709 0.70 0.24
2.1 0.89653 1.26 0.33
2.9 0.98393 0.38 0.20
20.4 0.86929 0.82 0.27
2.7 0.98695 0.33 0.20
22.8 0.98910 0.47 0.29
5.2 0.98136 0.36 0.19
0.7 0.95751 0.51 0.12
4.9 0.98600 0.34 0.11
7.9 0.94414 0.57 0.19
54.9 0.91022 0.75 1.80
32.4 0.87991 0.84 0.38
9.7 0.97847 0.39 0.19
0.8 0.99825 0.11 0.05
0.1 0.99963 0.16 0.06
low bubble point oil viscosity correlations.
A. Hemmati-Sarapardeh et al. / Chemical Engineering Science 90 (2013) 53–6862
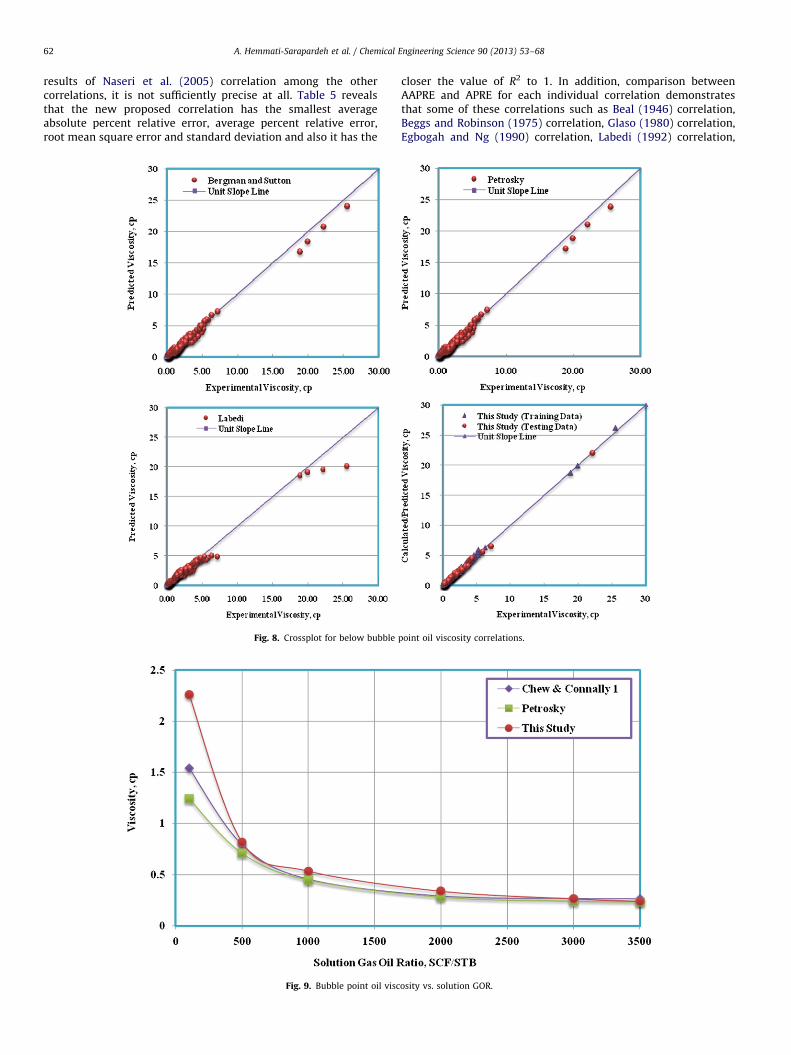
results of Naseri et al. (2005) correlation among the othercorrelations, it is not sufficiently precise at all. Table 5 revealsthat the new proposed correlation has the smallest averageabsolute percent relative error, average percent relative error,root mean square error and standard deviation and also it has the
Fig. 8. Crossplot for below bubble
Fig. 9. Bubble point oil visc
closer the value of R2 to 1. In addition, comparison betweenAAPRE and APRE for each individual correlation demonstratesthat some of these correlations such as Beal (1946) correlation,Beggs and Robinson (1975) correlation, Glaso (1980) correlation,Egbogah and Ng (1990) correlation, Labedi (1992) correlation,
point oil viscosity correlations.
osity vs. solution GOR.
A. Hemmati-Sarapardeh et al. / Chemical Engineering Science 90 (2013) 53–68 63
Kartoatmodjo and Schmidt (1994) correlation and Elsharkawyand Alikhan (1999) correlation overestimate dead oil viscosity ofIranian oil reservoirs while Kaye, 1985 correlation underestimatethis property.
Furthermore, three of the most accurate correlations includingNaseri et al. (2005), Al-Khafaji et al. (1987) and Glaso (1980)correlations have been selected to visualize the accuracy andperformance of these correlations as well as the new proposedcorrelation. For this purpose, two graphical analysis have beenemployed including crossplot and error distribution. Fortunately,none of these correlations shows trend error (Figs. 4 and 5). It isevident that almost all data of the new correlation lay on unit slopeline and this shows its high accuracy (Fig. 5). Apart from that, thenew proposed correlation has the smaller error range and leastscatter around the zero error line (Fig. 4).
6.2. Saturated oil viscosity correlation
As previously mentioned, bubble point pressure has thesmallest oil viscosity value and pressure reduction below thispoint causes gas release and subsequently leads to increase in oilviscosity as well as oil density (Fig. 1). Two distinct correlationsfor below bubble point and at bubble point have been proposed.
To check the validity of the new proposed correlation forbelow bubble point region, four samples of Iranian oil reservoirs
Table 7Statistical error analysis of bubble point oil viscosity correlations.
Author Ea Er
Chew and Connally (1959)[1] 18.1
Chew and Connally (1959)[2] 31.1
Chew and Connally (1959)[3] 37.2
Beggs and Robinson (1975) 34.0
Petrosky (1990) 23.7
Labedi (1992) 93.1 �
Kartoatmodjo and Schmidt (1994) 28.9
Elsharkawy and Alikhan (1999) 27.1
Hossain et al. (2005) 1612.4 �16
Naseri et al. (2005) 21.9
Bergman and Sutton (2007) 25.9
This study (training data) 13.7
This study (testing data) 15.1
Fig. 10. Bubble point oil v
have been selected and the experimental data and predictedvalues by this proposed correlation were plotted on the samefigure (see Fig. 6). It is evident by increasing pressure, thiscorrelation correctly predicts lower viscosity and also it ismarvelously in acceptable agreement with the experimental data.
Statistical error analysis for below bubble point oil viscositycorrelations are demonstrated in Table 6. Comparison betweenAAPRE and APRE for each individual correlation reveals that someof these correlations such as Khan et al. (1987) and Hossain et al.(2005) correlations overestimate below bubble point oil viscosityof Iranian oil reservoirs while Beggs and Robinson (1975), Naseriet al. (2005) and Bergman and Sutton (2007) correlations under-estimate this property.
Furthermore, three of the most accurate correlations includingLabedi (1992), Bergman and Sutton (2007) and Petrosky (1990)correlations have been selected to visualize the accuracy andperformance of these correlations as well as the new proposedone. For this purpose, similar to previous section two graphicalanalysis have been employed including crossplot and errordistribution. Error distribution of Labedi (1992) correlation showslower relative error at higher pressures gradient while errordistribution of Bergman and Sutton (2007) and Petrosky (1990)correlations is almost uniformly with pressure gradient (Fig. 7).Moreover, Fig. 7 illustrates that this new proposed correlation hasthe smaller error range and least scatter around the zero error
R2 RMSE SD
11.98 0.86769 0.82 0.23
17.09 0.77383 1.35 0.36
�4.49 0.89212 0.65 0.94
33.68 0.71387 0.78 0.37
22.28 0.89862 0.56 0.27
88.43 0.47667 3.40 1.15
27.13 0.89815 0.62 0.32
26.45 0.88960 0.56 0.30
00.52 0.00443 56.11 132.97
16.60 0.89228 0.47 0.25
25.21 0.88384 0.55 0.29
4.49 0.94901 0.29 0.17
5.77 0.98292 0.32 0.19
iscosity (this study).
A. Hemmati-Sarapardeh et al. / Chemical Engineering Science 90 (2013) 53–6864
line. Crosspolts of these correlations show that all predicted dataof the new correlation lay on unit slope line and this confirms itsperfect accuracy while the three other correlations underestimateviscosity at higher values (Fig. 8).
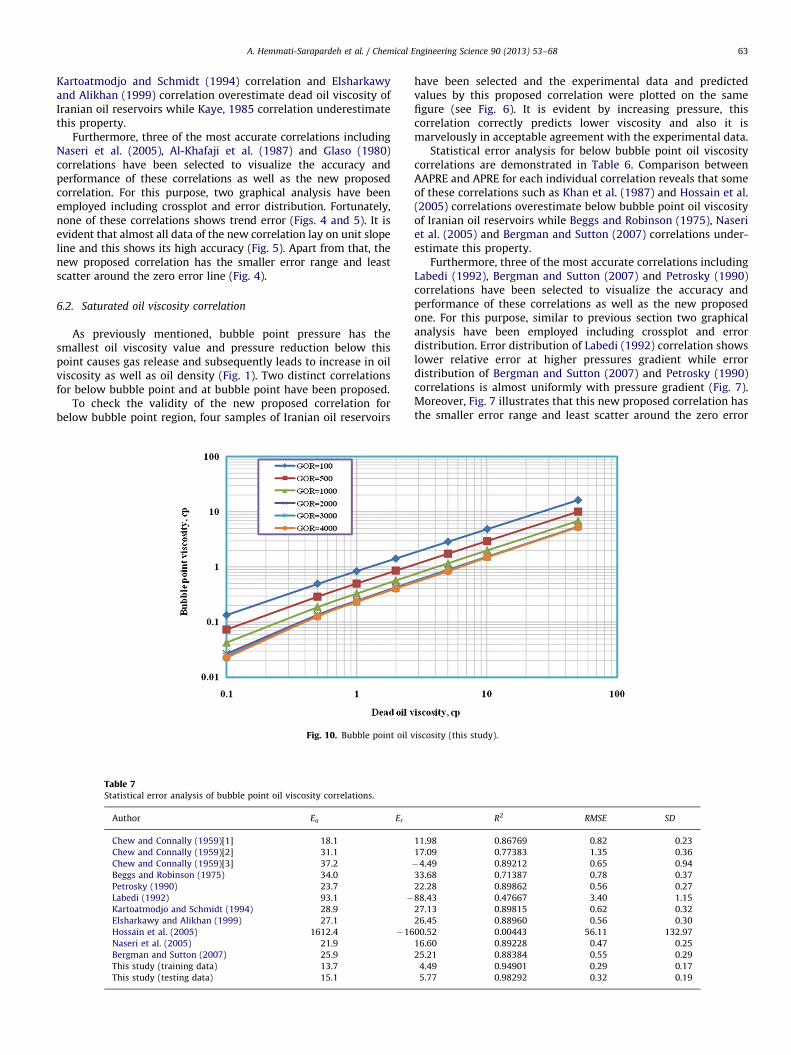
Fig. 9 illustrates the behavior of bubble point oil viscositycorrelation developed in this study as well as two of the mostaccurate ones including, Petrosky (1990), and Chew and Connally(1959)[1] correlations. This figure correctly displays for thesecorrelations, that increasing solution gas oil ratio reduces bubblepoint oil viscosity and also the greatest oil viscosity decreasingoccurs at low solution gas oil ratio. Fig. 10 indicates that bubblepoint oil viscosity increases as dead oil viscosity increases. Inaddition, this figure demonstrates that as solution gas oil ratioincreases up to a certain point, bubble point oil viscositydecreases considerably.
Statistical error analysis for bubble point oil viscosity correla-tions are shown in Table 7. Comparison between AAPRE and APREfor each individual correlation illustrates that Hossain et al.(2005) and Labedi (1992) correlations overestimate bubble pointoil viscosity of Iranian oil reservoirs while Beggs and Robinson(1975), Kartoatmodjo and Schmidt (1994), Elsharkawy andAlikhan (1999), Naseri et al. (2005) and Bergman and Sutton(2007) correlations underestimate this property.
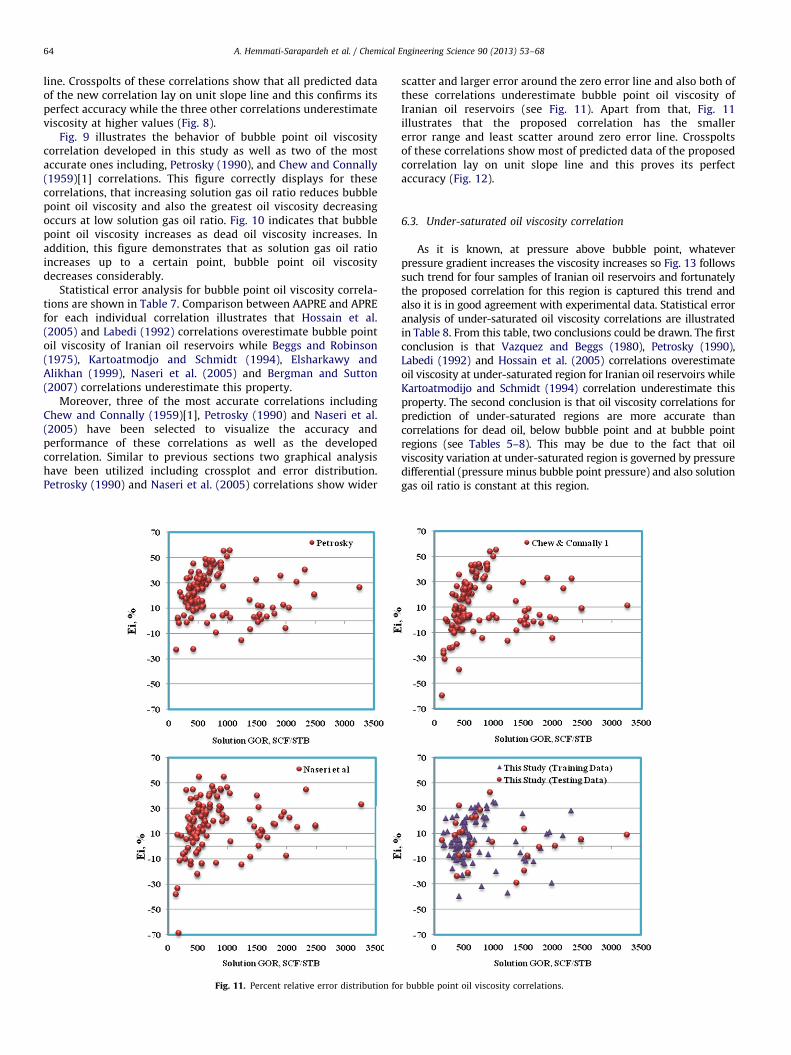
Moreover, three of the most accurate correlations includingChew and Connally (1959)[1], Petrosky (1990) and Naseri et al.(2005) have been selected to visualize the accuracy andperformance of these correlations as well as the developedcorrelation. Similar to previous sections two graphical analysishave been utilized including crossplot and error distribution.Petrosky (1990) and Naseri et al. (2005) correlations show wider
Fig. 11. Percent relative error distribution fo
scatter and larger error around the zero error line and also both ofthese correlations underestimate bubble point oil viscosity ofIranian oil reservoirs (see Fig. 11). Apart from that, Fig. 11illustrates that the proposed correlation has the smallererror range and least scatter around zero error line. Crosspoltsof these correlations show most of predicted data of the proposedcorrelation lay on unit slope line and this proves its perfectaccuracy (Fig. 12).
6.3. Under-saturated oil viscosity correlation
As it is known, at pressure above bubble point, whateverpressure gradient increases the viscosity increases so Fig. 13 followssuch trend for four samples of Iranian oil reservoirs and fortunatelythe proposed correlation for this region is captured this trend andalso it is in good agreement with experimental data. Statistical erroranalysis of under-saturated oil viscosity correlations are illustratedin Table 8. From this table, two conclusions could be drawn. The firstconclusion is that Vazquez and Beggs (1980), Petrosky (1990),Labedi (1992) and Hossain et al. (2005) correlations overestimateoil viscosity at under-saturated region for Iranian oil reservoirs whileKartoatmodijo and Schmidt (1994) correlation underestimate thisproperty. The second conclusion is that oil viscosity correlations forprediction of under-saturated regions are more accurate thancorrelations for dead oil, below bubble point and at bubble pointregions (see Tables 5–8). This may be due to the fact that oilviscosity variation at under-saturated region is governed by pressuredifferential (pressure minus bubble point pressure) and also solutiongas oil ratio is constant at this region.
r bubble point oil viscosity correlations.
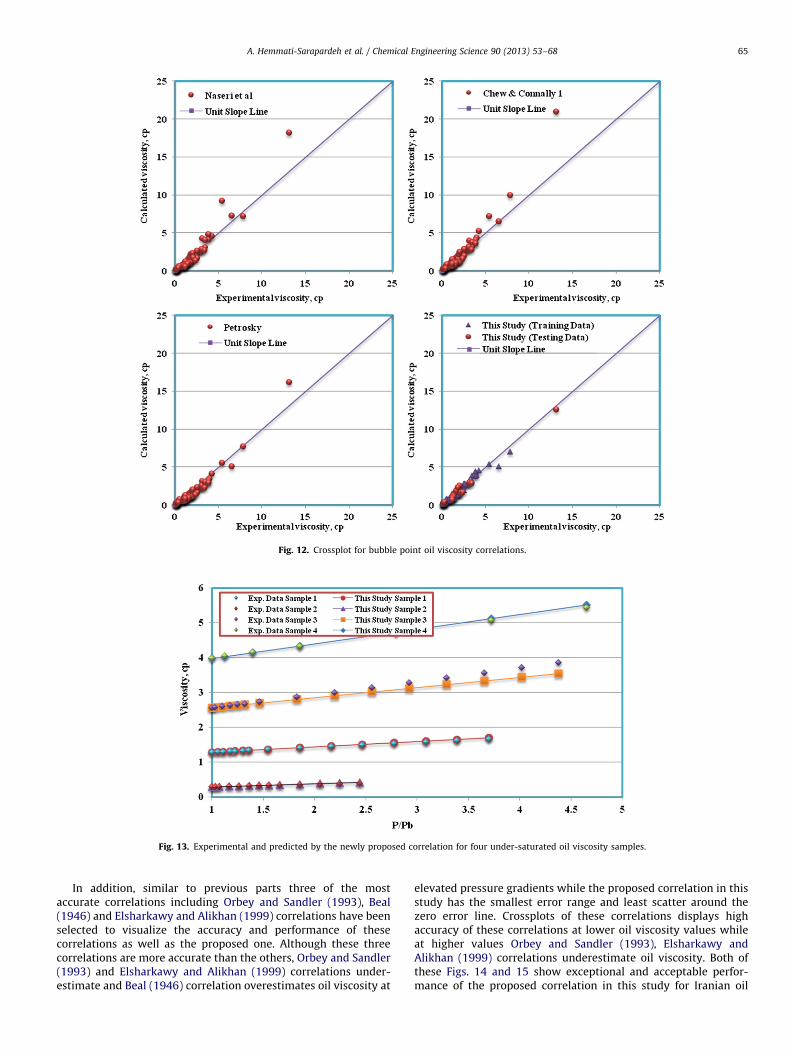
Fig. 12. Crossplot for bubble point oil viscosity correlations.
Fig. 13. Experimental and predicted by the newly proposed correlation for four under-saturated oil viscosity samples.
A. Hemmati-Sarapardeh et al. / Chemical Engineering Science 90 (2013) 53–68 65
In addition, similar to previous parts three of the mostaccurate correlations including Orbey and Sandler (1993), Beal(1946) and Elsharkawy and Alikhan (1999) correlations have beenselected to visualize the accuracy and performance of thesecorrelations as well as the proposed one. Although these threecorrelations are more accurate than the others, Orbey and Sandler(1993) and Elsharkawy and Alikhan (1999) correlations under-estimate and Beal (1946) correlation overestimates oil viscosity at
elevated pressure gradients while the proposed correlation in thisstudy has the smallest error range and least scatter around thezero error line. Crossplots of these correlations displays highaccuracy of these correlations at lower oil viscosity values whileat higher values Orbey and Sandler (1993), Elsharkawy andAlikhan (1999) correlations underestimate oil viscosity. Both ofthese Figs. 14 and 15 show exceptional and acceptable perfor-mance of the proposed correlation in this study for Iranian oil
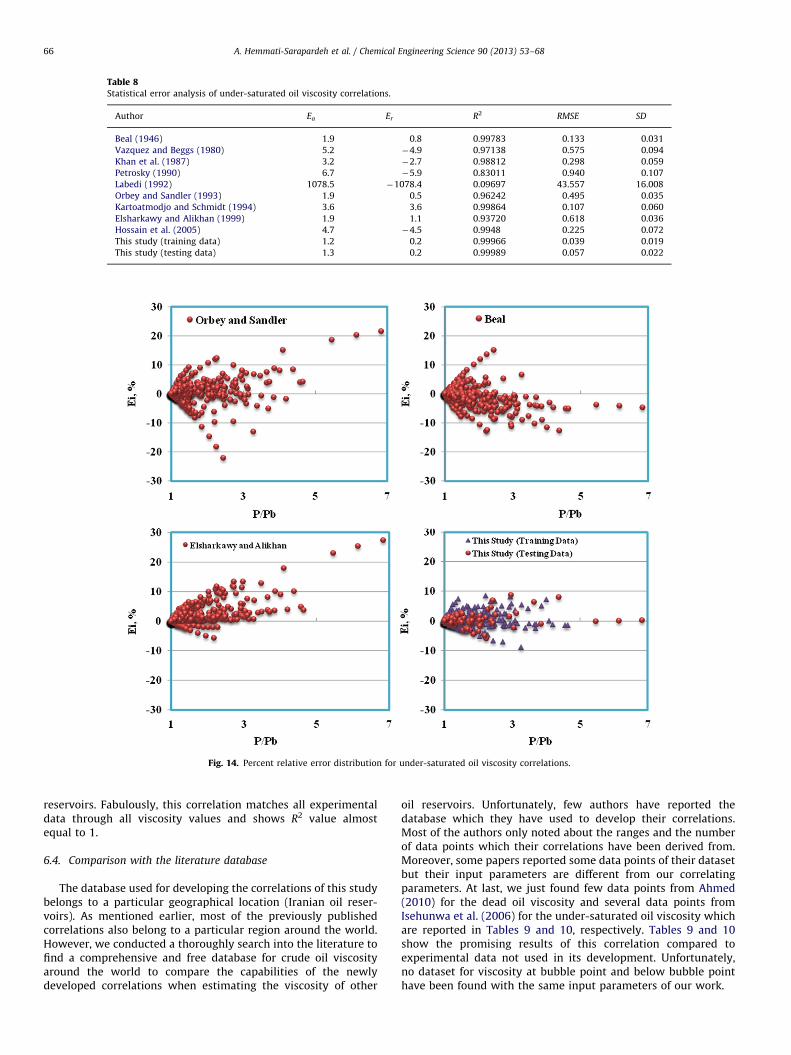
Table 8Statistical error analysis of under-saturated oil viscosity correlations.
Author Ea Er R2 RMSE SD
Beal (1946) 1.9 0.8 0.99783 0.133 0.031
Vazquez and Beggs (1980) 5.2 �4.9 0.97138 0.575 0.094
Khan et al. (1987) 3.2 �2.7 0.98812 0.298 0.059
Petrosky (1990) 6.7 �5.9 0.83011 0.940 0.107
Labedi (1992) 1078.5 �1078.4 0.09697 43.557 16.008
Orbey and Sandler (1993) 1.9 0.5 0.96242 0.495 0.035
Kartoatmodjo and Schmidt (1994) 3.6 3.6 0.99864 0.107 0.060
Elsharkawy and Alikhan (1999) 1.9 1.1 0.93720 0.618 0.036
Hossain et al. (2005) 4.7 �4.5 0.9948 0.225 0.072
This study (training data) 1.2 0.2 0.99966 0.039 0.019
This study (testing data) 1.3 0.2 0.99989 0.057 0.022
Fig. 14. Percent relative error distribution for under-saturated oil viscosity correlations.
A. Hemmati-Sarapardeh et al. / Chemical Engineering Science 90 (2013) 53–6866
reservoirs. Fabulously, this correlation matches all experimentaldata through all viscosity values and shows R2 value almostequal to 1.
6.4. Comparison with the literature database
The database used for developing the correlations of this studybelongs to a particular geographical location (Iranian oil reser-voirs). As mentioned earlier, most of the previously publishedcorrelations also belong to a particular region around the world.However, we conducted a thoroughly search into the literature tofind a comprehensive and free database for crude oil viscosityaround the world to compare the capabilities of the newlydeveloped correlations when estimating the viscosity of other
oil reservoirs. Unfortunately, few authors have reported thedatabase which they have used to develop their correlations.Most of the authors only noted about the ranges and the numberof data points which their correlations have been derived from.Moreover, some papers reported some data points of their datasetbut their input parameters are different from our correlatingparameters. At last, we just found few data points from Ahmed(2010) for the dead oil viscosity and several data points fromIsehunwa et al. (2006) for the under-saturated oil viscosity whichare reported in Tables 9 and 10, respectively. Tables 9 and 10show the promising results of this correlation compared toexperimental data not used in its development. Unfortunately,no dataset for viscosity at bubble point and below bubble pointhave been found with the same input parameters of our work.
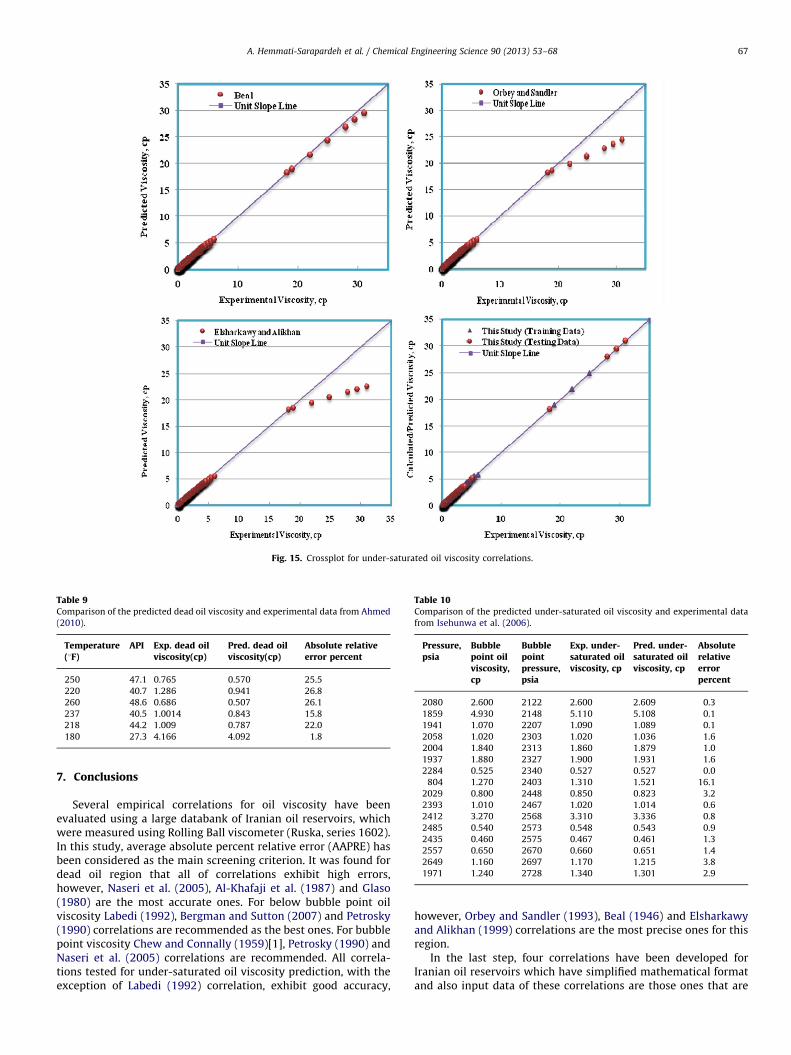
Fig. 15. Crossplot for under-saturated oil viscosity correlations.
Table 9Comparison of the predicted dead oil viscosity and experimental data from Ahmed
(2010).
Temperature(1F)
API Exp. dead oilviscosity(cp)
Pred. dead oilviscosity(cp)
Absolute relativeerror percent
250 47.1 0.765 0.570 25.5
220 40.7 1.286 0.941 26.8
260 48.6 0.686 0.507 26.1
237 40.5 1.0014 0.843 15.8
218 44.2 1.009 0.787 22.0
180 27.3 4.166 4.092 1.8
Table 10Comparison of the predicted under-saturated oil viscosity and experimental data
from Isehunwa et al. (2006).
Pressure,psia
Bubblepoint oilviscosity,cp
Bubblepointpressure,psia
Exp. under-saturated oilviscosity, cp
Pred. under-saturated oilviscosity, cp
Absoluterelativeerrorpercent
2080 2.600 2122 2.600 2.609 0.3
1859 4.930 2148 5.110 5.108 0.1
1941 1.070 2207 1.090 1.089 0.1
2058 1.020 2303 1.020 1.036 1.6
2004 1.840 2313 1.860 1.879 1.0
1937 1.880 2327 1.900 1.931 1.6
2284 0.525 2340 0.527 0.527 0.0
804 1.270 2403 1.310 1.521 16.1
2029 0.800 2448 0.850 0.823 3.2
2393 1.010 2467 1.020 1.014 0.6
2412 3.270 2568 3.310 3.336 0.8
2485 0.540 2573 0.548 0.543 0.9
2435 0.460 2575 0.467 0.461 1.3
2557 0.650 2670 0.660 0.651 1.4
2649 1.160 2697 1.170 1.215 3.8
1971 1.240 2728 1.340 1.301 2.9
A. Hemmati-Sarapardeh et al. / Chemical Engineering Science 90 (2013) 53–68 67
7. Conclusions
Several empirical correlations for oil viscosity have beenevaluated using a large databank of Iranian oil reservoirs, whichwere measured using Rolling Ball viscometer (Ruska, series 1602).In this study, average absolute percent relative error (AAPRE) hasbeen considered as the main screening criterion. It was found fordead oil region that all of correlations exhibit high errors,however, Naseri et al. (2005), Al-Khafaji et al. (1987) and Glaso(1980) are the most accurate ones. For below bubble point oilviscosity Labedi (1992), Bergman and Sutton (2007) and Petrosky(1990) correlations are recommended as the best ones. For bubblepoint viscosity Chew and Connally (1959)[1], Petrosky (1990) andNaseri et al. (2005) correlations are recommended. All correla-tions tested for under-saturated oil viscosity prediction, with theexception of Labedi (1992) correlation, exhibit good accuracy,
however, Orbey and Sandler (1993), Beal (1946) and Elsharkawyand Alikhan (1999) correlations are the most precise ones for thisregion.
In the last step, four correlations have been developed forIranian oil reservoirs which have simplified mathematical formatand also input data of these correlations are those ones that are
A. Hemmati-Sarapardeh et al. / Chemical Engineering Science 90 (2013) 53–6868
easily measured in oil fields. The ranges of data used to developthese new correlations cover almost all Iranian oil reservoirs PVTdata and consequently the developed correlations based on thesedata could be reliable for prediction of other Iranian oil reservoirsviscosity. However, for application of these correlations thelimitations of parameters which these correlations have beenderived from them should be considered. These new correlationscan be easily implemented in any reservoir simulation softwareand also they provide better accuracy and performance forviscosity of Iranian oil reservoirs than previously publishedcorrelations.
Nomenclature
API oil API gravityP pressure, psiPb bubble point pressure, psiRs solution gas oil ratio, SCF/STBGOR gas oil ratio, SCF/STBT temperature, 1Fmo oil viscosity, cpmob bubble point oil viscosity, cpmod dead oil viscosity, cpEi percent relative errorEr average percent relative errorEa average absolute percent relative errorRMSE root mean square errorSD standard deviationR2 coefficient of determinationn number of data points
Acknowledgement
Research Institute of Petroleum Industry (RIPI) is acknowl-edged for providing the database and supporting this study.
References
Abdul-Majeed, G.H., Clark, K.K., Salman, N.H., 1990. New correlation for estimatingthe viscosity of undersaturated crude oils. J. Can. Pet. Technol., 29.
Ahmed, T., 2010. Chapter 2—Reservoir-Fluid Properties, Reservoir EngineeringHandbook, fourth ed. Gulf Professional Publishing, Boston 29–135.
Ahrabi, F., Ashcroft, S.J., Shearn, R.B., 1987. High pressure volumetric, phasecomposition and viscosity data for a north sea crude oil and Ngl. Chem. Eng.Res. Des. 65, 63–73.
Al-Khafaji, A., Abdul-Majeed, G., Hassoon, S., 1987. Viscosity correlation for dead,live and undersaturated crude oils. J. Pet. Res. 6, 1–16.
Al-Marhoun, M.A., 2004. Evaluation of empirically derived PVT properties forMiddle East crude oils. J. Pet. Sci. Eng. 42, 209–221.
Ali, S.M.F., Thomas, S., 1996. The promise and problems of enhanced oil recoverymethods. J. Can. Pet. Technol., 35.
Almehaideb, R.A., 1997. Improved PVT correlations for UAE crude oils. Middle EastOil Show Conf. Bahrain.
Alomair, O.A., Elsharkawy, A.M., Alkandari, H.A., 2011. Viscosity Prediction ofKuwaiti Heavy Crudes at Elevated Temperatures, SPE Heavy Oil Conferenceand Exhibition. Society of Petroleum Engineers, Kuwait City, Kuwait.
Beal, C., 1946. Viscosity Air, Water, Nat. Gas, Crude Oil Assoc. Gases Oil Field TempPressures.
Beggs, H.D., Robinson, J.R., 1975. Estimating the viscosity of crude oil systems. SPEJ. Pet. Technol. 27, 1140–1141.
Bennison, T., 1998. Prediction of heavy oil viscosity, IBC Heavy Oil Field Develop-ment Conference, London.
Bergman, D.F., Sutton, R.P., 2007. An Update to Viscosity Correlations for Gas-Saturated Crude Oils, SPE Annual Technical Conference and Exhibition. Societyof Petroleum Engineers, Anaheim, California, U.S.A..
Carvalho, M., Lozano, M.A., Serra, L.M., Wohlgemuth, V., 2012. Modeling simpletrigeneration systems for the distribution of environmental loads. Environ.Modell. Softw. 30, 71–80.
Chew, J., Connally, C., 1959. A viscosity correlation for gas-saturated crude oils.Trans. Am. Inst. Electr. Eng. 216, 23–25.
Chuang, Y.-F., Lee, H.-T., Lai, Y.-C., 2012. Item-associated cluster assignment modelon storage allocation problems. Comput. Ind. Eng. 63, 1171–1177.
Dindoruk, B., Christman, P., 2001. PVT properties and viscosity correlations forGulf of Mexico oils, SPE ATCE in New Orleans, LA.
Dupuy, C., Botta-Genoulaz, V., Guinet, A., 2005. Batch dispersion model to optimisetraceability in food industry. J. Food Eng. 70, 333–339.
Egbogah, E.O., Ng, J.T., 1990. An improved temperature-viscosity correlation forcrude oil systems. J. Pet. Sci. Eng. 4, 197–200.
Elsharkawy, A., Alikhan, A., 1999. Models for predicting the viscosity of MiddleEast crude oils. Fuel 78, 891–903.
Fan, X.-h., Yi, J., Bao, Z.-q., 2011. Research on safety input research model forpreventing coal gas explosion. Procedia Eng. 26, 2012–2017.
Glaso, O., 1980. Generalized pressure–volume–temperature correlations. SPE J.Pet. Technol. 32, 785–795.
Hossain, M.S., Sarica, C., Zhang, H.Q., Rhyne, L., Greenhill, K., 2005. Assessment and
Development of Heavy Oil Viscosity Correlations. SPE International ThermalOperations and Heavy Oil Symposium, Calgary, Canada.
Ikiensikimama, S.S., Ogboja, O., 2009. Evaluation of empirically derived oilviscosity correlations for the Niger Delta crude. J. Pet. Sci. Eng. 69, 214–218.
Isehunwa, O.S., Olamigoke, O., Makinde, A.A., 2006. A correlation to predict theviscosity of light crude oils. Nigeria Annu. Int. Conf. Exhibition. Soc. Pet. Eng.,
Abuja, Nigeria.Johnson, S.E., Svrcek, W.Y., Mehrotra, A.K., 1987. Viscosity prediction of athabasca
bitumen using the extended principle of corresponding states. Ind. Eng. Chem.
Res. 26, 2290–2298.Johnson, S.E., Svrcek, W.Y., 1991. J. Can. Pet. Technol. 26 (5), 60.Kartoatmodjo, T., Schmidt, Z., 1994. Large data bank improves crude physical
property correlations. Oil Gas J. 92, 51–55.Kaye, S.E., 1985. Offshore California viscosity correlations, COFRC. SPE/PS-CIM/
CHOA International Thermal Operations and Heavy Oil Symposium,
TS85000940.Khan, S., Al-Marhoun, M., Duffuaa, S., Abu-Khamsin, S., 1987. Viscosity Correla-
tions for Saudi Arabian Crude Oils. SPE Middle East Oil Show, Manama,Bahrain.
Labedi, R., 1992. Improved correlations for predicting the viscosity of light crudes.J. Pet. Sci. Eng. 8, 221–234.
Little, J.E., Kennedy, H.T., 1968. Calculating the viscosity of hydrocarbon systemswith pressure temperature and composition. Soc. Pet. Eng. J. 6, 157–162.
Liu, T., Bu, R., Huang, J., 2012. A cost-efficiency equilibrium problem of regionalsingle emergency resource guarantee with multi-objective programming. Syst.Eng. Procedia 5, 29–36.
Mehrotra, A.K., 1991. Generalized one-parameter viscosity equation for light andmedium liquid hydrocarbons. Ind. Eng. Chem. Res. 30, 1367–1372.
Miao, Z., 2011. Discussion of optimize method of fire alarm dispatching based onoperation research principle. Procedia Eng. 11, 689–694.
Naseri, A., Yousefi, S.H., Sanaei, A., Gharesheikhlou, A.A., 2012. A neural networkmodel and an updated correlation for estimation of dead crude oil viscosity.Brezilian J. Pet. Gas 6, 31–41.
Naseri, A., Nikazar, M., Mousavi Dehghani, S.A., 2005. A correlation approach forprediction of crude oil viscosities. J. Pet. Sci. Eng. 47, 163–174.
Orbey, H., Sandler, S.I., 1993. Prediction of the viscosity of liquid hydrocarbons andtheir mixtures as a function of temperature and pressure. Can. J. Chem. Eng.
71, 437–446.Petrosky, G.E.J., 1990. PVT Correlations for Gulf of Mexico Crude Oils. MSC Thesis,
University of Sowthwestern Louisiana, Lufayette, Louisiana, USA.Sutton, R.P., Bergman, D.F., 2006. Undersaturated oil viscosity correlation for
adverse conditions. SPE Annu. Tech. Conf. Exhibition. Soc. Pet. Eng., SanAntonio, Texas, USA.
Sutton, R.P., Farshad, F., 1990. Evaluation of empirically derived PVT properties forgulf of Mexico crude oils. SPE Reservoir Eng. (Soc. Pet. Eng.) 5 (79–86), 13172.
Svrcek, W., Mehrotra, A., 1988. One parameter correlation for bitumen viscosity.Chem. Eng. Res. Des. 66, 323–327.
Teja, A., Rice, P., 1981. Generalized corresponding states method for the viscositiesof liquid mixtures. Ind. Eng. Chem. Fundam. 20, 77–81.
Vazquez, M., Beggs, H.D., 1980. Correlations for fluid physical property prediction.
SPE J. Pet. Technol. 32, 968–970.Vidal, D., Blobel, J., Perez, Y., Thormann, M., Pons, M., 2007. Structure-based
discovery of new small molecule inhibitors of low molecular weight proteintyrosine phosphatase. Eur. J. Med. Chem. 42, 1102–1108.
Xu, D.-H., Khurana, A.K., 1996. A Simple and Efficient Approach for Improving thePrediction of Reservoir Fluid Viscosity, SPE Asia Pacific Oil and Gas Conference.
1996 Copyright 1996. Society of Petroleum Engineers, Inc., Adelaide, Australia.