DiFX Correlation & Post-Correlation Analysis
62
1 i gg DiFX Correlation & Post-Correlation Analysis Alessandra Bertarini IGG University of Bonn & MPIfR Bonn
-
Upload
khangminh22 -
Category
Documents
-
view
0 -
download
0
Transcript of DiFX Correlation & Post-Correlation Analysis
1
igg
DiFX Correlation & Post-Correlation Analysis
Alessandra Bertarini
IGG University of Bonn & MPIfR Bonn

2
igg DiFX
• DiFX -> Distributed FX correlator.
• DiFX is a software correlator.
• DiFX is a free downloadable software from:
http://cira.ivec.org/dokuwiki/doku.php/difx/installation
• DiFX needs IPP libraries (IPP requires licence).

3
igg DiFX at Bonn
RAIDs RAIDs + fxmanager
nodes + frontend and frontend2
nodes
60 compute nodes
8 cores per node
20 Gbps InfinBand
Network cards
10 RAIDs (220 TB)
1 service node (with keybord & monitor)
2 user interaction nodes (frontend & frontend2)

4
igg DiFX
DiFX is software running on various computer clusters. Every cluster performance is different, but...
the fundamental operations performed by the correlator are the same.
DiFX: receives digitized signals
applies the correlator model
pads the data from 2 bits to 16 bits
aligns the data within +/- 1 sample
performs an FFT
performs a fractional-sample delay correction
performs a complex multiplication & integrates
writes the complex visibilities (in freq. domain)

5
igg DiFX: Architecture
Mark 5 connected to DiFX via Ethernet or InfiniBand
FxManager controls operation: send data from data manager nodes (DataStream) to processing nodes (Cores).
Processed data from Cores sent back to FxManager.
Deller A. T., et al., 2007

6
igg DiFX File Requirements
DiFX reads data in: Mark 4/VLBA format,
Mark 5B format,
VDIF format (single thread),
LBA format
DiFX needs one valid VEX file and a v2d file (vex-to-DiFX).
Data quality control: AIPS (too complex for the purpose)
HOPS fourfit

7
iggDiFX - VEX Files
VEX = (VLBI EXperiment) file
VEX files are used from the stations for:
• Sky Frequency
• LO tuning
• Recording speed
• Polarization
• No. of BBCs
• Sources to be observed
• Length of the scans
• Track assignment

8
iggDiFX - VEX Files
VEX files are used by the correlators for:
• Sky Frequency � relevant for fringe rotator
• LO tuning � relevant for fringe rotator
• Recording speed � relevant for playback speed
• Polarization � relevant for channel assignment
• No. of BBCs � relevant for channel assignment
• Sources to be observed � coordinates for corr. model
• Length of the scans � relevant for playback
• Track assignment � relevant for channel assignment
• Antenna coordinates (not required for observing)

9
iggDiFX - VEX Files
Correlator’s VEX files need extra information:
Earth rotation parameters (x-wobble, y-wobble and UT1)
Clock information (gps-fmout from field system logs)
Data source (Mark 5 module, files on RAID)
Correlator’s VEX files need (sometimes) to be changed:
Track assignment (only tape-like tracks are present in VEX)

10
iggDiFX - VEX Files - EOP
Earth Orientation Parameters(x-wobble, y-wobble and UT1)
The predicted values are published from US Naval Observatory:
http://128.183.20.176/solve_save/usno_finals.erp
DiFX ancilliary program geteop.pl read the USNO file, reformat it and creates a file called EOP.txt

11
igg DiFX – VEX File - EOP
$EOP;
def EOP0;
TAI-UTC= 35 sec;
A1-TAI= 0 sec;
eop_ref_epoch=2013y033d;
num_eop_points=1;
eop_interval=24 hr;
ut1-utc = 0.237134 sec;
x_wobble = 0.042530 asec;
y_wobble = 0.313450 asec;
enddef; def EOP4;
[…]
enddef;
EOP: VEX example for observation on DOY 035.
Note: DiFX needs EOPs for 5 days of which two prior to the observation !

12
iggDiFX - VEX Files - Clock
CLOCK: estimates the time difference between the data time stamps (from formatter/M5B/ FiLa 10G) and UTC coming from GPS.
GPS DBBC
Counter GPS-FMOUT
Maser10 MHz
µs
s from start
0.58E-6 0.122E-12
But 10 MHz driftslinear fit
mean (s) drift (s/s)
GPS-FMOUT from FS log
1 PPS
1 PPS MON

13
iggDiFX - VEX Files - Clock
$CLOCK;
def Ny;
clock_early=2012y142d17h00m : X usec :2012y142d17h00m0s : x ;
enddef;
def Wz;
clock_early=2012y142d17h00m : Y usec :2012y142d17h00m0s : y;
enddef;
[…]
The X and Y µs are the mean gps-fmout “clock ” values.
The x and y s/s are the clock drifts.

14
iggDiFX - VEX Files – Data Source
DiFX needs to know whether the data are on a Mark 5 module and need to know which module.
$TAPELOG_OBS;
def Kk ;
VSN=1 : HOB+0025 : 2013y043d17h00m00s :2013y044d16h57m46s ;
enddef ;
def Tc ;
VSN=1 : HART-014 : 2013y043d17h00m00s :2013y044d16h17m56s ;
enddef ;
Note: E-tranferred stations do not appear in the VEX !

15
igg DiFX – VEX File - Tracks
Check “track” assignment: VEX speaks (still) tape language!
Mk 4 VSI=geo VSI=astro
1US 0 0
1UM 1 1
2US 2 2
2UM 3 3
3US 4 4
3UM 5 5
4US 6 6
4UM 7 7
5US 8 8
5UM 9 9
6US 10 10
6UM 11 11
7US 12 12
7UM 13 13
8US 14 14
8UM 15 15
Mk 4 VSI=geo VSI=astro
1LS 16 16
1LM 17 17
2LS - 18
2LM - 19
3LS - 20
3LM - 21
4LS - 22
4LM - 23
5LS - 24
5LM - 25
6LS - 26
6LM - 27
7LS - 28
7LM - 29
8LS 18 30
8LM 19 31

16
igg DiFX – VEX File - Tracks
Check “track” assignment: VEX speaks (still) tape language!
Mk 4 VSI=geo VSI=astro
9US 21 -
9UM 22 -
10US 23 -
10UM 24 -
11US 25 -
12UM 26 -
12US 27 -
13UM 28 -
13US 29 -
14UM 30 -
14US 31 -
In VEX enter VSI output + 2 !
i.e. 1US: VSI output = 0 � VEX TRACK = 0 + 2 = 2

17
igg DiFX – VEX File - Tracks
TRACKS sorting in VEX:$FREQ;
def GEOSX-SX01;
chan_def = &X:8212.99 MHz:U:8.000 MHz:&CH01:&BBC01:&U_cal;
[..]
enddef;
[..]
$TRACK;
def Mark5B;
fanout_def = A : &CH01 : sign : 1 : 02 ;
[..]
enddef;
Mk 4 VSI=geo VSI=astro
1US 0 0(BBC01)
From tables above:
VSI output = 0, i.e. TRACK = 02
USB

18
iggDiFX – vex2difx Program
DiFX requires different files, based on VEX
vex2difx creates those files:
clock, frequency,
tracks,integration time,baseline to cross-correlate …
station coord., EOPs,
antenna mounting type,source coord. ….
More info: http://cira.ivec.org/dokuwiki/doku.php/difx/vex2difx
Calc file
Input file
calcif2 Im file (Interferometer Model, i.e. correlator model)

19
iggDiFX - v2d File
vex2difx requires a v2d file.
Layout of v2d file:
vex = vex file name
antennas = two letter code of the participating stations (e.g. antennas = WF, ON, WZ …)
singleScan = True/False
SETUP r1600
{tInt = integration time in second (e.g. 0.2 s, 1 s …)doPolar = True/FalsenChan = no. spectral channels (e.g. 128, 512, 1024)
} (max for fourfit)
suggested value for trial-correlation

20
iggDiFX - v2d File
Layout of v2d file cont.:
RULE clock{
scan = scan name (e.g. 222-1700)
setup = r1600
}
ANTENNA AB{filelist = ab.filelist(or) file = path/filename
}
In trial-correlation mostly only one scan

21
iggDiFX - v2d File - Filelist
How to create filelist:
Directory2filelist : DiFX program to create filelists
directory2filelist /path-to-data/ Mode > output.filelist e.g.:
directory2filelist /raid1/exp1/ Mark5B-512-8-2 > on.filelist
format Mbps bbc no.nbit
/raid1/exp1/No0001 56054.708345 56054.708935
/raid1/exp1/No0002 56054.709479 56054.710058
MJD
NOTE: Mk5B MJD in filelist is offset by 1000 days �filelist needs editing (use linux editors!).

22
iggRun DiFX
1) run the program vex2difx
vex2difx r1600.v2d
vex2difx creates the files .input, .calc, ….
2) run the correlator using the script startdifx :
startdifx r1600_1.input or
calcif2 –a � to create the im file
genmachines <input file> -> to create the machines and thread files
mpirun –np nn –machinefile <machine file> mpifxcorr <input file>
no. of process to start (found using wc –l machine file)
created from vd2

23
iggRun DiFX – Machine File
fxmanager 0 0
mark5fx01 0 1
[..]
Mark5fxnn 0 1
node55 7 0
node56 7 0
[..]
nodenn 7 0
The machine file looks like this:
Control the operation
Mark 5 Units available (1)
Compute nodes available (0)
no. of cores used
r1600.machinesfxmanager slots=1 max-slots=1
node41 slots=1 max-slots=2
node42 slots=1 max-slots=2
[..]
NUMBER OF CORES: 10
7
7
[..]
r1600.threads

24
iggRun DiFX
3) errormon2 shows the correlation details and if all run …
DiFX creates a directory called r1600_1.difx and a file r1600_1.difxlog
4) run difx2mark4 to create the files for fourfit:
difx2mark4 r1600_1.difx (will create a directory 1234)
5) run fourfit:
fourfit –pt –c cf_1234 222-1700
… but why we need to fringe fit the data?

25
igg Post Correlation Software
time (h)19h17m30s 19h21m00s
phase (deg)
-180
270
time (h)19h17m30s 19h21m00s
phase (deg)
-180
270
Phase slope vs time is “fringe rate”
Fringe Fit refines the model removing the fringe rate
Due to errors in the model, the correlator phases still show a slope vs time:

26
igg Post Correlation Software
Phase slope in frequency is delay.
Fringe Fit corrects the delay pivoting around a reference frequency
frequency channels
phase
(deg)140
220
10 20 30 40 50 60
phase
(deg)
10 20 30 40 50 60frequency channels
140
220
Due to errors in the model, the correlator phases still show a slope vs frequency:

27
igg Fringe Fit: Real Fringe SearchCorr. amplitud
e
Fringe rate (Hz)
(FT fringe visibility with respect to time)
singleband delay (µs)
Image courtesy of K. Kingham
2D FFT in delay, delay-rate spaceand search for the max amplitude
Fringes are located at this position in SBD, DR space

28
igg Fringe Fit: Fourfit Overview
S-Band: X-Band:

29
iggFourfit
Single band delay (µs)
FT of lag spectrum
Delay rate.
Fringe rate (Hz) = Delay Rate •Sky freq.
Phase (red) & amp (blue) vs time for every BBC
Sky freq.
Multiband delay (µs)
Pcal phases

30
iggFourfit: Lag Spectrum
-1 -0.5 0 0.5 1singleband delay (µs)
amplitud
e0 20 Lag spectrum: output of the
correlator integrated over the scan duration.
Lag spectrum shown is lag spectra of all BBC stacked.
8 MHz/BBC => 16 Msample/s => sample period = 1 / 16 Msample/s = 0.0625 µs = > 0.0625 µs * 32 lags = 2 µs SBD window width.
Indicates residual correlator model errors, part of which can be absorbed in the clock offset.

31
igg Fringe Fit: Visibility Phase vs Frequency
Fringe fitted:
Raw:
frequency channels
phase
(deg)140
220
10 20 30 40 50 60
phase
(deg)
10 20 30 40 50 60 frequency channels
140
220

32
igg Fringe Fit: from Lag to Frequency
-1 -0.5 0 0.5 1singleband delay (µs)
amplitud
e0 20
phase
(deg)
180
-180
Avgd. Xpower Spectrum (MHz)-5 0 5
amplitud
e
0 1 2 3 4
LSB USB
V (u,v,τ) = ∫ V (u,v,ν)e2πiτνdν
Fourier Transform
The data are already fringe fitted.

33
iggFourfit: Delay Rate (DR)
Fringe rate (FR) is the Fourier transform of fringe visibility with respect to time.
DR = FR / Observing frequency.
DR window = [1 /(2 * AP)] / Obs. Freq.
DR tells how fast the fringes move away from the phase centre due to correlator model error. It can be absorbed in the clock rate.
amplitud
e
0 10 20
delay rate (ns/s)-0.03 -0.02 -0.01 0 0.01 0.02 0.03

34
igg Post Correlation Software
time (h)19h17m30s 19h21m00s
phase (deg)
-180
270
time (h)19h17m30s 19h21m00s
phase (deg)
-180
270
Phase slope vs time is “fringe rate”
Fringe Fit refines the model removing the fringe rate
Due to errors in the model, the correlator phases still show a slope vs time:

35
igg Fringe Fit: Amp. & Phase vs Time
Amp. & Phase vs time for each frequency
phase
amplitud
e
-180
18020
0
X1-g X2-h X3-i X4-j X5-k X6-l X7-m X8-n all
• Every dot represents the phase (red) and amplitude (blue) of the visibility for every segment (~ AP).
• Data are already fringe fitted and pcal has been applied.
• Every BBC/VC channel is represented.

36
igg Fringe Fit: Phase Cal Phaseam
plitud
e 800
0
phase
-180
180
amplitud
e
0
800
-180
180
phase
Corrects phase offset of each BBC/VC.
Phase offsets within the BBCs/VCs still present.
Phase cal phase flattens the phases across the band.

37
igg Fringe Fit:Phase Cal Phase Plot
100
Phase cal phase are plotted whilst only the value of the mean coherent pcal amplitude (PC amp.) is written for each channel.
Reference Station
Remote Station
phase θ
-100

38
igg Fringe Fit: Multiband Delay (MBD)
VC1 VC2 VC3
f1 f2 f3
multiband delay (µs)-0.05 0 0.05
amplitud
e
200
0
(FT)-1
(FT)-1
(FT)-1
+
+
f1
f1 f3
f2
f2 f3

39
igg Fringe Fit: SBD vs MBD
• SBD = slope of phase across each frequency channels.
• MBD = slope of phase vs whole RF band (e.g. 720 MHz).
• SBD is not corrected by pcal (since fourfit uses only one tone).
• MBD is corrected by pcal.
phase
freq.0
SBD
MBD
MBD is more precise than the SBD

40
iggFourfit: Wordy Part
Ref-Rem, Band, Polarization
Depends on amp. & phase rms vs frequency and vs time.
Mean visibility amp. & phase
Residual SBD (µs)
Residual MBD (µs)
Residual FR (Hz)
Accumulation Period length, Fourfit Reference Time, …
Prob. of false detection. i.e. that a noise spike exceeds the signal amp.
SNR =
Peak amp / σ

41
iggFourfit: Wordy Part II
42
igg
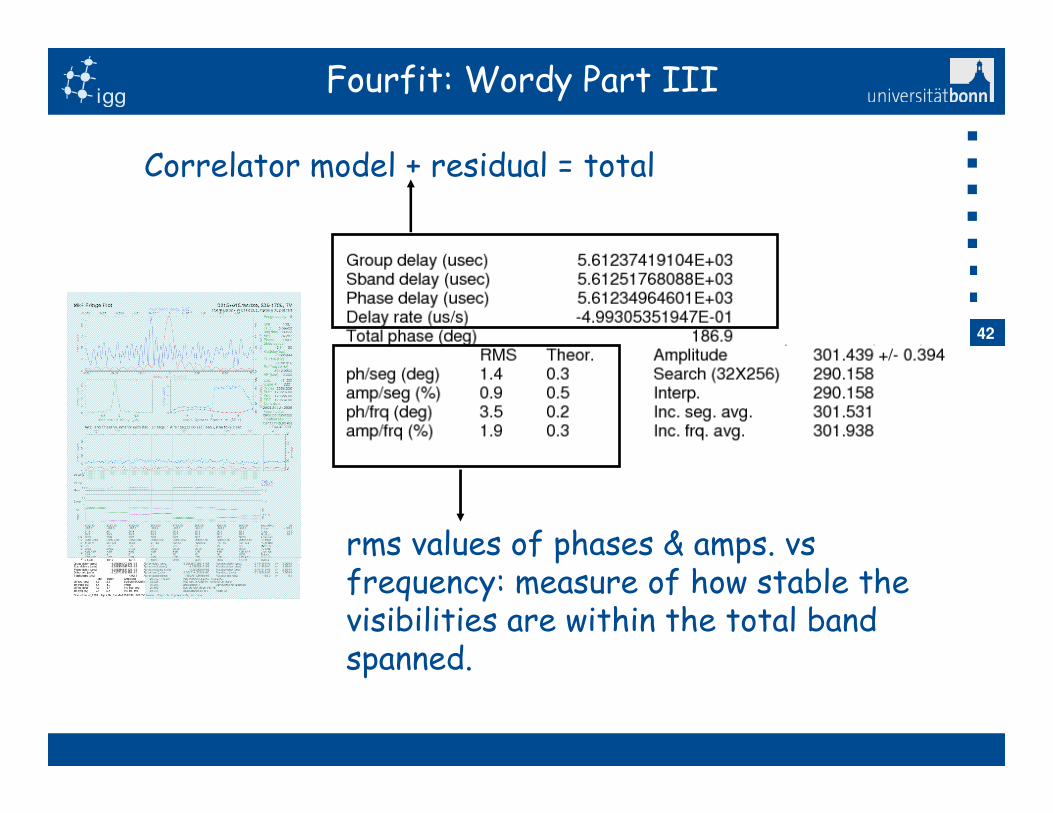
Correlator model + residual = total
Fourfit: Wordy Part III
rms values of phases & amps. vs frequency: measure of how stable the visibilities are within the total band spanned.

43
iggFourfit: Wordy Part IV
Residual correlator model errors calculated by fringe fit.
Correlator model applied to the scan

44
igg
Fourfit’s parameters are controlled through a control file:
• Scan start and stop time offset for the data to be considered valid.
• DR, MBD and SBD search window.
• Lower sideband offset: additive phase between LSB and USB when correlating VLBA data against Mark4 data.
• Phase cal frequency tone to be extracted.
• Phase cal mode: manual or normal or AP by AP.
• Phase cal phases specify a list of phases to be added to the visibility phases in each BBC/VC channel (if phase cal mode is normal).
Fringe Fit: Control File

45
igg Fringe Fit: Control File
cf_1234 is fourfit control file.
It tells fourfit what to do.
Basic layout:
pc_mode normal (pcal applied)
sb_win -256.0 256.0 mb_win -2.0 2.0 dr_win -30.e-4 30.e-5
sbd search window bounds (µs)
mbd search window bounds (µs)
delay rate search window bounds
Keep the parameters as above to have a huge window. If not specified fourfit defaults to a small window !

46
igg Fringe Fit: Control File
if station K
lsb_offset 260.
if f_group X
ref_freq 8212.99
pc_freqs ghijklmn 5010 5010 5010 5010 5010 5010 5010 5010
LSB/USB offset for different backends
Phase cal tones extracted for X-band in kHz:
if f_group S
ref_freq 2225.99
pc_freqs abcdef 3010 3010 3010 3010 3010 3010
Phase cal tones extracted for S-band in kHz:
pivot frequency for fringe fit
phase
phase
LSB
no lsb_offset
USBUSB LSB
with lsb_offset

47
igg Fringe Fit: Control File
if station J and f_group S
pc_mode manual
pc_phases abcdef -110 -127 -130 -69 -155 -100
if station J and f_group X
pc_mode manual
pc_phases ghijklmn 78 123 148 78 115 116 70 104
if station L and f_group S
pc_phases abcdef -3.2 0.6 3.6 0.4 0.5 -1.5
if station L and f_group X
pc_phases ghijklmn -4.0 4.3 4.4 1.1 -0.5 0.8 -6.2 2.0
Manual phase cal:
phase
-180˚
180˚X1 X2 X3 X4 X5 X6 X7 X8
Additive phase (self cal)
Manual pcal required!

48
iggOther Tools to Check Data
Copy raw data (~ 3 MB) onto file and check the data with linux command od:
od –tx4 file name
output is like:
0000000 abaddeed bead0001 0974ad5f f00abf01
0000016 0d645d49 57143f17 3a19c152 a0ec5b58
…
ABADDEED => header sync word (every 10016 bytes)
if lots of hex are zeroes -> no input to DBBC
frame no.time stamp:MJD & second of day
fractional second & header error check
dataod byte no. in file

49
iggOther Tools to Check Data
Use mark5access library (part of DiFX, but should be possible to install them as stand-alone):
m5d: decode data (valid for all data kinds that DiFX reads).
m5test: decode data headers and data (valid for all data kinds that DiFX reads).
m5bstate: state counts summary (valid for all data kinds that DiFX reads).
m5spec: forms total power for each baseband channel in the file (never used by me!).

50
iggOther Tools to Check Data
m5d /path/file.m5b Mark5B-256-16-1 10 �
Mark5 stream: 0x89e130
stream = File-1/1=/data10/r1/nyalesund/r1538_ny_171-1212a
format = Mark5B-256-16-1 = 2
start mjd/sec = 97 43922.000000000
frame duration = 312500.00 ns
framenum = 0
sample rate = 16000000 Hz
offset = 0
framebytes = 10016 bytes
datasize = 10000 bytes
sample granularity = 1
frame granularity = 1
gframens = 312500
payload offset = 16
read position = 0
data window size = 1048576 bytes
-1 1 1 1 -1 1 -1 -1 -1 -1 1 -1 -1 -1 1 -1
[…]
10 / 10 samples unpacked

51
iggOther Tools to Check Data
m5test /path/file.m5b Mark5B-256-16-1 �
Mark5 stream: 0x89e130
stream = File-1/1=/data10/r1/nyalesund/r1538_ny_171-1212a
format = Mark5B-256-16-1 = 2
start mjd/sec = 97 43922.000000000
frame duration = 312500.00 ns
framenum = 0
sample rate = 16000000 Hz
offset = 0
framebytes = 10016 bytes
datasize = 10000 bytes
sample granularity = 1
frame granularity = 1
gframens = 312500
payload offset = 16
read position = 0
data window size = 1048576 bytes
frame_num=2 mjd=97 sec=43922 ns=000625000.0 n_valid=2 n_invalid=0
[..]
frame_num=335990 mjd=97 sec=44026 ns=996875000.0 n_valid=335990
1679990000 / 1679990000 samples unpacked

52
iggOther Tools to Check Data
m5bstate /path/file.m5b Mark5B-2048-16-2 �

53
iggOther Tools to Check Data
Programs downloadable from Haystack:
vlbi2 only for 16-channels 2 bit sampling
bstate only for 16-channels 2 bit sampling
vlbi0 only for DBE (or equivalent channel assignment)
Fringes No fringes
phase
phase
amplitud
e
amplitud
e

54
igg
• Import the fringe fitted data
• Check the data quality by plotting
• Check pcal phase and amplitude
• Check SBD
• Check closure quantities for the SBD, MBD and DR
• Export the visibility phases to calculate phase offsets (mostly due to compensate the error between the feed and the pcal injection unit).
• Others… depending in the purpose of the analysis (polarization, source…)
Post Correlation: Aedit

55
igg Aedit: Psplot

56
igg
QC = 0 Fringes not detected (PFD > 1e-4).
= 1-9 Fringes detected, no error condition. Higher number => better quality.
= B Interpolation error in fourfit.
= D No data in one or more freq. channels.
= E Max fringe amplitude at the edge of SBD, MBD or DR window.
= F “Fork” problem in processing.
= G Fringe amp. in one or more channels is < 0.5 mean amp. (for SNR > 20).
= H Low pcal-amplitude.
= N No valid correlator data.
Aedit: Quality Code

57
igg
pcal amplitud
e (V)
0
0.10
time
BBC10/S2BBC09/S1
• Every station pcal amplitude vs time is checked
• Amplitude variations should be proportional to the inverse square root of Tsys. If not, the variation within one BBC/VC or different BBC/VC might indicate a problem: RFI, unlock BBC/VC…
Aedit: Phase Cal Data – Amplitude vs Time

58
igg
Pcal amp. (V)
pcal phase (deg)-200 200
0.020
0.00
0.08
0.00
0.00
0.00
0.020
0.025
BBC01/X1
BBC03/X3
BBC05/X5
BBC07/X7
• From these plots we find the spurious signals (sinusoid).
• Spur are narrowband signals coherent with the true pcal and have its same frequency.
• Corrupt the visibility phases.
Aedit: Phase Cal Data – Amplitude vs Phase

59
igg
time (UT)
SBD (µs)
0
-1
1
Aedit: Singleband Delay
Check that there are no clock jumps within the observation.

60
iggclosure M
BD (µs)
0
40
-40
time (UT)
Aedit: Closure Quantities
Check for station based errors in the data.

61
igg
• The data are re-fringe fitted using the additive phases and bad channels (e.g. RFI) flagged.
• The data are re-checked using aedit.
• Correlator report is written.
• Stations with problems are notified.
• Database is submitted to analysts.
Database Submission

62
igg Summary
FX correlator outputs are visibility (real and imaginary components) in the frequency domain.
Lag correlator outputs are correlator coefficients (real and imaginary components) in the time domain.
After correlation, correlator analysts check the data quality (e.g. using fourfit).
Sometimes recorrelation is required and performed.
Correlator is a very expensive spectrum analyzer => correlator analysts can help debugging problems at stations.
Correlators deliver to analysts the databases or the FITS file to the astronomers.