
Multivariate search for differentially expressed gene combinations
Upload
independentCategory
view
0download
0
Correlation Based Multivariate Analysis of the
Genetic Influence on Brain Volume
David R. Hardoon†∗, Ulrich Ettinger‡,Janaina Mourao-Miranda‡, Elena Antonova‡, David Collier◦,
Veena Kumari⋆, Steven C.R. Williams‡, Michael Brammer‡
†Computational Statistics & Machine Learning Centre
Dept. of Computer ScienceUniversity College London
London, WC1E 6BTE-mail: [email protected]
‡Centre for Neuroimaging Sciences
Institute of Psychiatry, De Crespigny ParkKings College London
◦Social, Genetic and Developmental Psychiatry CentreInstitute of Psychiatry, De Crespigny Park
King’s College London
⋆Department of PsychologyInstitute of Psychiatry, De Crespigny Park
King’s College London
9th July 2008
1

Abstract
Considerable research effort has focused on achieving a better un-derstanding of the genetic correlates of individual differences in vol-umetric and morphological brain measures. The importance of theseefforts is underlined by evidence suggesting that brain changes in anumber of neuropsychiatric disorders are at least partly genetic inorigin. The currently used methods to study these relationships aremostly based on single-genotype univariate analysis techniques. Thesemethods are limited as multiple genes are likely to interact with eachother in their influences on brain structure and function. In this paperwe present a feasibility study where we show that by using kernel cor-relation analysis, with a new genotypes representation, it is possibleto analyse the relative associations of several genetic polymorphismsinteraction with brain structure. The implementation of the methodis demonstrated on genetic and structural magnetic resonance imag-ing data acquired from a group of 16 healthy subjects by showing themultivariate genetic influence on grey and white matter.Keywords: Canonical Correlation Analysis, Kernel Methods, Multi-variate Genetic Analysis, Multivariate sMRI Analysis
1 Introduction
Macroscopic features of brain morphology and volume are known tobe highly heritable (Peper, Brouwer, Boomsma, Kahn & Pol, 2007).Given the observation of volumetric and structural brain changes ina number of neuropsychiatric conditions (Honea, Crow, Passingham& Mackay, 2005; Kempton, Geddes, Ettinger, Williams & Grasby,2008), considerable research effort has focussed on elucidating thesechanges in vivo using structural magnetic resonance imaging (MRI).The importance of these efforts is underlined by evidence suggestingthat brain changes in a number of disorders are at least partly ge-netic in origin, as suggested by family and twin studies (Bearden, vanErp, Thompson, Toga & Cannon, 2007; Ettinger, Picchioni, Landau,Matsumoto, van Haren, Marshall, Hall, Schulze, Toulopoulou, Davies,Ribchester, McGuire & Murray, 2007).
Recently, MRI studies have begun to identify specific moleculargenetic candidates for these brain changes. In a typical genetic MRI
∗Correspondence author
2
paradigm, participants are classified on the basis of DNA analysis ac-cording to a certain genotype (e.g. allelic groups AA, AB, BB; or A-allele carriers vs. non- carriers). Statistical analysis, such as a t-test oranalysis of variance (ANOVA), of MRI data is then carried out to iden-tify differences between the groups which are assumed to reflect theinfluence of the investigated genotype. These single-gene associationstudies have been useful in characterising the likely mechanisms of riskgenes on brain structure and function and, therefore, the pathophysiol-ogy of neuropsychiatric conditions (Ho, Wassink, O’Leary, Sheffield &Andreasen, 2005; McIntosh, Baig, Hall, Job, Whalley, Lymer, Moor-head, Owens, Miller, Porteous, & Johnstone, 2007).
However, the analysis of single-gene effects is limited as complexphenotypes are likely influenced by multiple genetic polymorphismsand given that genes are likely to interact in their influences on brainstructure and function. The complexity of statistical analysis of suchinteractions calls for the development of novel statistical techniquesthat can identify which combination of genotypes can best explainstatistical variance in brain structure and function.
Machine learning/pattern recognition methods are increasingly be-ing used to analyze fMRI data. The most commonly employed method,the Support Vector Machine (SVM), a supervised method, associatesproperties of the imaging data with simple specific categorical labels(e.g., −1, 1 indicating experimental conditions 1 and 2). The aim isthen to find the hyperplane that gives optimal separation betweendata belonging to the two classes, using data from the whole brain ineach subject, for examples see Mourao-Miranda, Bokde, Born, Ham-pel & Stetter (2005); Mourao-Miranda, Reynaud, McGlone, Calvert &Brammer (2006). In some situations, the use of categorical labels maynot be optimal and in an earler study (Hardoon, Mourao-Miranda,Brammer & Shawe-Taylor, 2007), we introduced a new unsupervisedfMRI analysis method based on Kernel Canonical Correlation Anal-ysis (KCCA) to overcome this problem. KCCA replaces the simplecategorical labels used in SVM (+1/− 1) with a label vector for eachstimulus containing details of the features of that stimulus, e.g a sim-ple image label of pleasant/unpleasant is replaced by a vector of imagefeatures.
In this paper we extend the unsupervised application of KCCAto the analysis of genotypic effects on brain structure and function.We show that by using KCCA, with a new orthogonalised represen-tation to express the genotype labeling, it is possible to examine the
3

influences of the interactions of multiple genes on brain structure.
2 Genetic and sMRI Data
2.1 Participants
16 healthy participants (14 males) took part. All participants wereright-handed, Caucasian, and psychiatrically, medically and neuro-logically healthy. Ages ranged from 18 to 36 years (mean=23.69,SD=4.33) and participants had spent an average (SD) of 16.81 (2.64)years in full-time education. Participants provided written, informedconsent. The study had permission from the local research ethicscommittee.
2.2 Genetic Acquisition
DNA was obtained from either buccal swabs or whole blood. Thecheek swab method typically provides excellent yield and quality ofDNA; cheek swab samples were sent to the laboratory at the Social,Genetic, and Developmental Psychiatry Centre (SGDP) at the Insti-tute of Psychiatry, where DNA was extracted from the samples us-ing established procedures (Freeman, Smith, Curtis, Huckett, Mill &Craig, 2003). DNA was extracted from whole blood by isolation of thewhite cells followed by a modified phenlol-chloroform procedure. Afterextraction the DNA was re-suspended in TRIS-EDTA (10mM tris pH7.4, 0.1mM EDTA) buffer and quantified by spectroscopy before stor-age at −80C◦. We selected genes that were found to be associated inthe previous literature with brain volume. All samples were genotypedon an Illumina 317K genotyping array by Decode Genetics in Iceland,as part of a separate genetic project (SGENE, European CommissionFP6). For the present analysis, SNPs were selected from the arraygenotype data only from the following genes, and other markers werenot analysed:
• ASPM (rs3762271, rs10801589, rs12034362, rs1127661, rs12137359)
• IGF1 (rs10860862, rs6219, rs6214, rs978458, rs2288378, rs7136446,rs10735380, rs1019731, rs2162679, rs35766, rs35765, rs855211)
• IGF2 (rs734351)
• MAOA (rs909525, rs3027409, rs6609257, rs3027415, rs1799836)
4

• BDNF (rs925946, rs10501087, rs2203877, rs6265, rs11030104,rs10835211, rs7934165, rs12273363, rs908867, rs1491850)
• APOE (rs405509)
• SHH (rs1233556)
• Plexin B3 (rs4898439, rs762650, rs762651)
• MCPH1 (rs2920616, rs4840940, rs1057187, rs6995735, rs2442546,rs894888, rs17076812, rs1968586, rs1129703, rs1129706, rs2034143,rs2442502, rs2440399, rs12674488, rs2920689, rs2440445, rs2922806,rs2442473, rs2979666, rs2442632, rs3780088, rs3020213, rs1961222,rs2515464, rs2515466, rs2515477, rs2959812, rs4841224, rs2959809,rs2922876, rs2897911, rs2922873, rs4478599, rs2515493, rs921291,rs2515507, rs3020242, rs2922861, rs2922859, rs2442579, rs2442573,rs2442572, rs4841336, rs2442567, rs10100002, rs2959802, rs1257,rs2959799, rs2013938, rs1057090, rs2959797, rs2911968, rs2912065,rs2980654, rs2433146, rs1057091)
2.3 MRI Acquisition
Participants underwent MRI scanning using a General Electric SignaAdvantage scanner at 1.5 Tesla. A 3-dimensional T1-weighted, coro-nal, spoiled gradient (SPGR) of the whole head was obtained. Acqui-sition followed realigning along the inter-hemispheric fissure and theAC-PC line. The sequence used an echo time of 5.1ms, a repetitiontime of 18ms, a flip angle of 20◦ and a field of view of 240×240×192mmfor a resulting voxel dimension of 0.9375×0.9375×1.5 mm. Grey/whitematter discrimination was achieved by means of an inversion time of450ms.
2.4 MRI Preprocessing
First, each structural image was reoriented to the antero-posteriorcommissure line of the Montreal Neurological Institute (MNI) tem-plate. Second, structural data were preprocessed following the pro-cedure used for voxel-based morphometry method with the SPM5software1. SPM5 implements a unified segmentation/ normalisationframework, which is a single probabilistic model combining tissue clas-sification approach in native space, non-uniformity correction, and
1http:/www.fil.ion.ucl.ac.uk/spm/
5

nonlinear registration to the standard (MNI) space in one procedure(Ashburner & Friston, 2005). Third, segmented and normalised im-ages were modulated with Jacobian determinates, which involves scal-ing each image by the amount of contraction incurred during non-linear warping. This step allows preserving the total amount of tissuein the modulated grey or white matter image as in the original image,yielding the estimate of grey or white matter volume. Finally, sincenormalization procedure in SPM5 is of much higher accuracy than inSPM2 and modulation step somewhat smoothes the images, the greyand white matter tissue segments were smoothed with 8 mm FWHMGaussian kernel, which approximates smoothness of 12 mm obtainedusing SPM2 software2. The grey and white matter probability im-ages were resliced with 2 × 2 × 2 voxel size, since higher resolution of1 × 1 × 1 would considerably increase the dimensionality of the clas-sification problem, distributing any pattern in the data over a muchbroader area in term of search space for the classifier.
3 Multivariate Analysis Methodology
CCA is a technique, proposed by Hotelling (1936) for finding pairs ofbasis vectors that maximise the correlation of a set of paired variables.These pairs can be considered as two “views” of the same object. Thistechnique is applicable in cases where each “view” contains, as a sub-space, all “relevant” information plus some “irrelevant” information.CCA identifies a projection space containing the relevant subspaces inboth views. This projection space is often refered to as the semanticspace. In the following study we consider the SNPs of the geneticsequence and the segmented white or grey matter of structural MRIbrain scans to be two “views” of the same object. CCA seeks a pair oflinear transformations one for each of the paired variables such thatwhen the variables are transformed the corresponding coordinates aremaximally correlated.
Consider the linear combination
x = w′
ax
y = w′
by.
Let x and y be two random variables from a multi-dimensional distri-bution, with zero mean. The maximisation of the correlation between
2http://dbm.neuro.uni-jena.de/vbm/segmentation/modulation/
6

x and y corresponds to solving
maxwa,wb
ρ = w′
aCabwb
subject to w′
aCaawa = w′
bCbbwb = 1. Caa and Cbb are the non-singular “within-set” covariance matrices and Cab is the “between-sets” covariance matrix.
We suggest using the kernel variant of CCA (Fyfe & Lai, 2001;Bach & Jordan, 2002) to overcome a potential limitation of the lin-earity of CCA, namely that useful descriptors may not be extractedfrom the data if they exist in terms of some non-linear relationship.The kernelising of CCA (KCCA) offers an alternate solution by firstprojecting the data into a higher dimensional feature space
φ : x = (x1, . . . , xn) → φ(x) = (φ1(x), . . . ,φN (x)) (N ≥ n)
before performing CCA in the new feature space. Given the kernelfunctions κa and κb let
Ka = XaX′
a
Kb = XbX′
b
be the kernel matrices corresponding to the two representations ofthe data, where Xa is the matrix whose rows are the vectors φa(xi),i = 1, . . . , ℓ from the first representation (SNPs) while Xb is the matrixwith rows φb(xi) from the second representation (structural MRI).The weights wa and wb can be expressed as a linear combination ofthe training examples
wa = Xaα
wb = Xbβ.
Substituting into the primal CCA equation gives the optimisation
maxα,β
ρ = α′KaKbβ (1)
subject to α′K2aα = β′K2
bβ = 1. This is the dual form of the pri-
mal CCA optimisation problem given above, which can be cast as ageneralised eigenvalue problem and for which the first k generalisedeigenvectors can be found efficiently. Both CCA and KCCA can beformulated as an eigenproblem (Hardoon, Szedmak & Shawe-Taylor,
7

2004). Despite the potential benefit of moving into a non-linear kerneldefined feature space we limit ourselves to a linear kernel. This self-imposed restriction allows us to compute the corresponding weightsin the input space, i.e to compute the weightings of SNPs or voxelsin grey or white matter following KCCA. One might ask what is thebenfit of KCCA using a linear kernel over CCA. The answer is thatthe same results are achieved but that KCCA is significantly less com-putationally intensive as we only need to consider a kernel matrix ofthe size of the subjects whereas in CCA a covariance matrix of thesize of sMRI voxels needs to be computed.
The naıve application of CCA in kernel space will be likely to pro-duce perfect correlations between the two views. These correlationscan therefore fail to distinguish between spurious features and thosethat capture the underlying semantics (Bach & Jordan, 2002; Kuss& Graepel, 2002; Hardoon et al., 2004; Shawe-Taylor & Cristianini,2004; Fukumizu, Bach & Gretton, 2006). To control this issue, we re-quire a regularisation on the derived directions to remove the spuriouscorrelation found via the naive application. We use the regularisationformulation given in Hardoon et al. (2004), which has a lower andupper bound of 0 ≤ τ ≤ 1, where we define τ to be the regularisationparameter. The regularised KCCA optimisation is the same as givenin equation (1) but now subject to
α′Ka ((1 − τ)Ka + τI) α = 1
β′Kb ((1 − τ)Kb + τI) β = 1.
Note that when using τ > 0 it is important to a-posteriori re-normalise
α =α
α′K2aα
β =β
β′K2
bβ
so that the original KCCA3 conditions α′K2aα = β′K2
bβ = 1 hold,
this will ensure that the corresponding ρ is in fact a correlation value.
4 Experiment
In the following section we elaborate on our experimental set-up, anal-yses and results. Our data set consisted of 16 subjects. Genotyping
3The KCCA Matlab package was obtained from http://academic.davidroihardoon.com
8

of the sample yielded 94 SNPs in each subject. Each SNP consistsof 3 genotypes, i.e. a subject is for any given SNP we examined ahomozygote for allele A, an AB heterozygote, or a homozygote forallele B. Each subject also completed a structural MRI scan of thebrain as described above. In our analysis we masked the voxels in thestructural MR images using grey and white matter masks thresholdedat voxel intensity values of 0.2 for both grey and white tissue images.This value was derived by visual inspection of the individual images.The regularisation parameter, from Section 3, is heuristically fixed toτ = 0.03 for the present preliminary study. The rigorous optimisationof this regularisation parameter will be addressed in a future study.
In the multivariate analysis we are unable to use the conventionalunivariate label representation of the SNP genotype of 1, 2 and 3 dueto the fact that we do not know a-priori the direction of each of theSNPs vector, i.e. whether the genotype representation 1 < 2 < 3 or1 > 2 > 3 is true throughout the subjects 94 SNPs, although thedirection for each SNP across the subjects is the same. We overcomethis issue by representing the SNP genotypes in a 3-dimensional or-thogonalised label such that 1 ⊥ 2
∧1 ⊥ 3
∧2 ⊥ 3. In other words we
use the following representation of the genotypes
1 → [0, 0, 1]
2 → [0, 1, 0]
3 → [1, 0, 0]
as our corresponding label representation of the 3 genotypes.Following the KCCA procedure, as detailed in Section 3, we wish
to analyse the effect of all the SNP’s genotypes have on the entire,masked, brain. The inherited structure of KCCA entails that we im-plicitly incorporate the effect of the voxels on each other. This wouldhave also been true for the effect of the SNP’s on each other but ourorthogonalised representation entails that each SNP’s mean weightvalue will be zero. In other words, what we examined was the relativeinfluence of the three different genotypes within the SNPs on grey andwhite matter. The resulting output weights from the proposed tech-nique represent, on the one hand, the changes in brain matter volumeand on the other, the corresponding relative influence of the genotypeswithin the SNP’s on the change in brain matter volume.
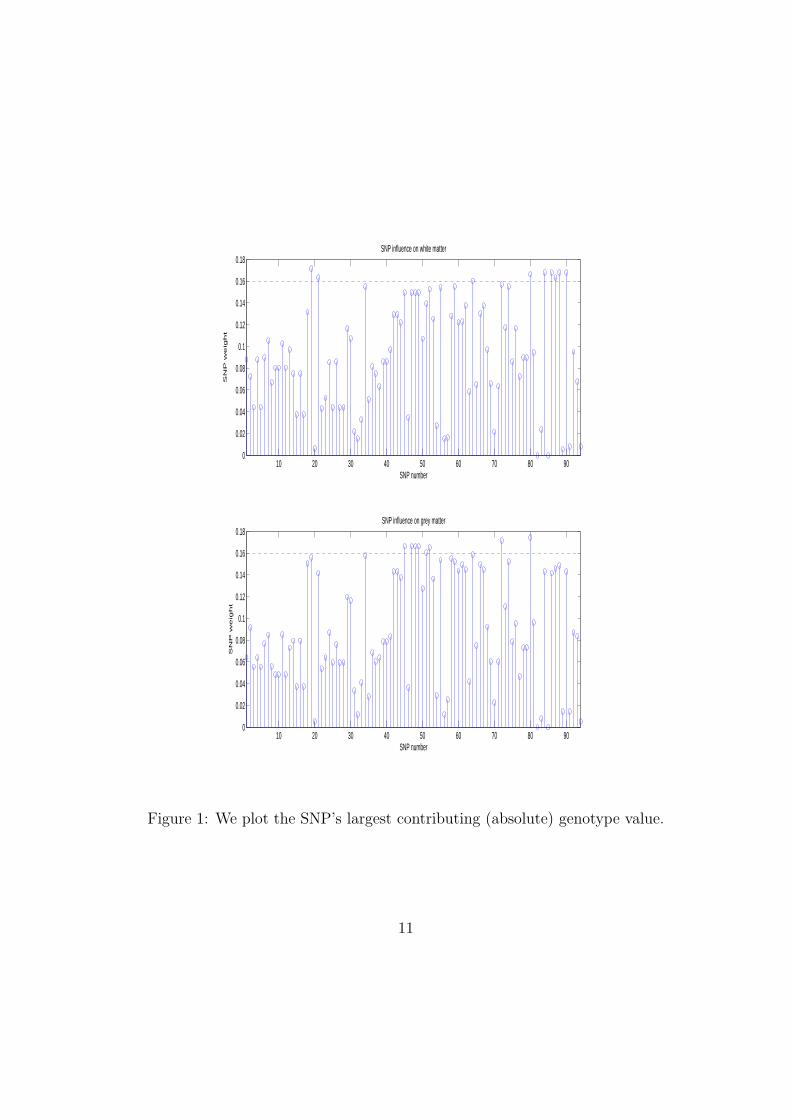
We wish to avoid overinterpreting our results due to the small sam-ple size, therefore we confine ourselves to plot in Figure 1 representing
9
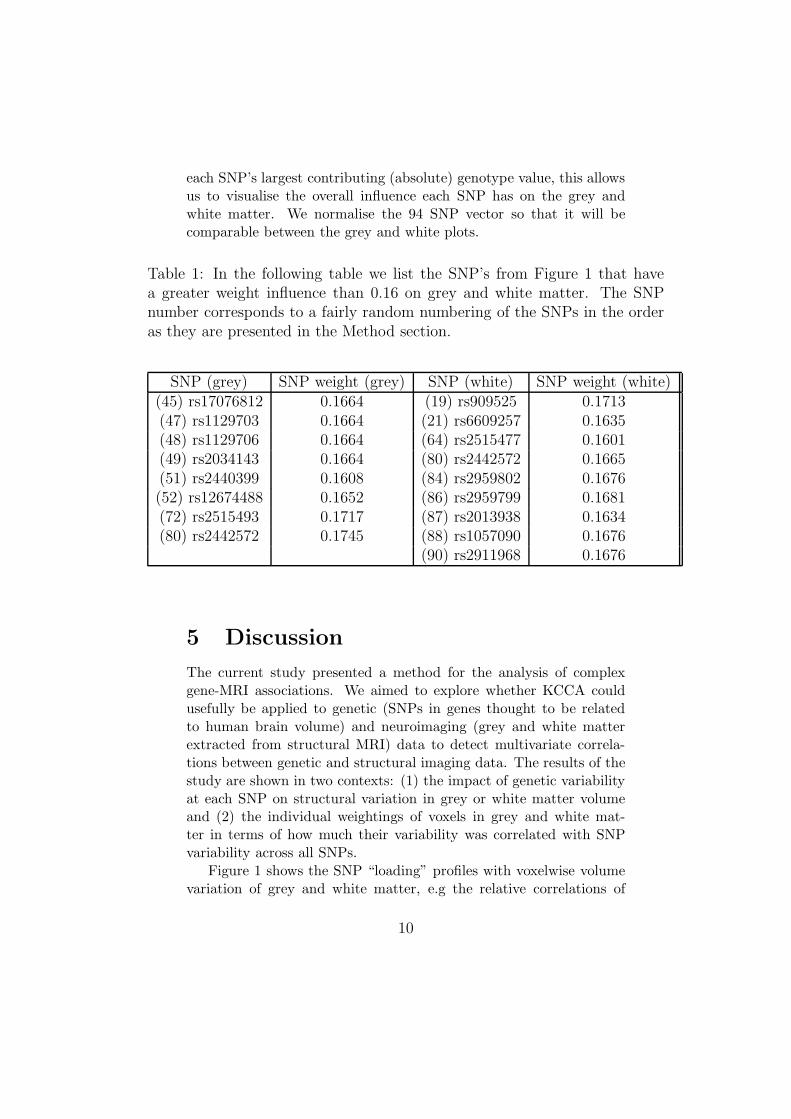
each SNP’s largest contributing (absolute) genotype value, this allowsus to visualise the overall influence each SNP has on the grey andwhite matter. We normalise the 94 SNP vector so that it will becomparable between the grey and white plots.
Table 1: In the following table we list the SNP’s from Figure 1 that havea greater weight influence than 0.16 on grey and white matter. The SNPnumber corresponds to a fairly random numbering of the SNPs in the orderas they are presented in the Method section.
SNP (grey) SNP weight (grey) SNP (white) SNP weight (white)(45) rs17076812 0.1664 (19) rs909525 0.1713(47) rs1129703 0.1664 (21) rs6609257 0.1635(48) rs1129706 0.1664 (64) rs2515477 0.1601(49) rs2034143 0.1664 (80) rs2442572 0.1665(51) rs2440399 0.1608 (84) rs2959802 0.1676(52) rs12674488 0.1652 (86) rs2959799 0.1681(72) rs2515493 0.1717 (87) rs2013938 0.1634(80) rs2442572 0.1745 (88) rs1057090 0.1676
(90) rs2911968 0.1676
5 Discussion
The current study presented a method for the analysis of complexgene-MRI associations. We aimed to explore whether KCCA couldusefully be applied to genetic (SNPs in genes thought to be relatedto human brain volume) and neuroimaging (grey and white matterextracted from structural MRI) data to detect multivariate correla-tions between genetic and structural imaging data. The results of thestudy are shown in two contexts: (1) the impact of genetic variabilityat each SNP on structural variation in grey or white matter volumeand (2) the individual weightings of voxels in grey and white mat-ter in terms of how much their variability was correlated with SNPvariability across all SNPs.
Figure 1 shows the SNP “loading” profiles with voxelwise volumevariation of grey and white matter, e.g the relative correlations of
10
10 20 30 40 50 60 70 80 900
0.02
0.04
0.06
0.08
0.1
0.12
0.14
0.16
0.18SNP influence on grey matter
SNP number
SN
P w
eig
ht
10 20 30 40 50 60 70 80 900
0.02
0.04
0.06
0.08
0.1
0.12
0.14
0.16
0.18SNP influence on white matter
SNP number
SN
P w
eig
ht
Figure 1: We plot the SNP’s largest contributing (absolute) genotype value.
11

Figure 2: Weighted MRI of grey matter volume influence. The blue and redrepresent opposite change influence where blue is the negative values and redis the positive values.
12

Figure 3: Weighted MRI of white matter volume influence. The blue andred represent opposite change influence where blue is the negative values andred is the positive values.
13

different SNPs with voxelwise volumetric variation within grey andwhite matter areas of the brain. We heuristically threshold at 0.16 soto give the top ≈ 10% of SNP with the largest influence. The SNP’swith the largest apparent correlations with volumetric variation areshown in Table 1. Figures 2 and 3 show the voxel-wise loadings ingrey and white matter volume of SNP correlations, e.g how muchthese voxels are under the combined genetic influence of all the SNPsstudied.
We should be very conservative in our interpretations of the resultsfrom a small, preliminary study. However, it appears (a) the methodenables us to place some ranking on the possible importance of SNPsin driving structural brain change and (b) that the brain areas underapparent SNP-related influence fall into a number of broad regions.The regions shown in red and blue are affected in opposite directionsbut we do not at present read these as increases and decreases in greyor white matter volume. Considered our voxel size and a relativelycoarse smoothing kernel in the present analysis, the results shouldbe applied as representing associations between genes and large-scalevolumetric variations. For fine-grained volumetric variations a higherimage resolution (i.e. 1 × 1 × 1) with smaller smoothing kernel (e.g.6mm) should be applied.
Broadly speaking, the red areas include cerebellum, occipital cor-tex, anterior cingulate and some lateral frontal regions. The blueregions include posterior cingulate, parietal cortex and some temporalregions. We refrain at present from placing firm interpretations onthese results pending replication and extension to larger groups.
We conclude by saying that KCCA with a linear kernel is capable ofinvestigating the interactional effects of multiple genetic influences onbrain structure. We hope that the possibilities raised by this methodwill be usefully exploited to clarify the nature of multiple gene influ-ences on brain structure and function in large samples of healthy anddiseased subjects.
Acknowledgements
We are grateful for partial support from an EC FP6 grant, Project037761, “SGENE”. David R. Hardoon is supported by the EPSRCproject Le Strum, EP-D063612-1.
14

References
Ashburner, J. & Friston, K. (2005). Unified segmentation. Neu-roimage, 26(3), 839–851.
Bach, F. & Jordan, M. (2002). Kernel independent componentanalysis. Journal of Machine Leaning Research, 3, 1–48.
Bearden, C. E., van Erp, T. G., Thompson, P. M., Toga, A. W.& Cannon, T. D. (2007). Cortical mapping of genotype-phenotype relationships in schizophrenia. Human BrainMapping, 28, 519–532.
Ettinger, U., Picchioni, M., Landau, S., Matsumoto, K., vanHaren, N. E., Marshall, N., Hall, N. H., Schulze, K.,Toulopoulou, T., Davies, N., Ribchester, T., McGuire, P.& Murray, R. M. (2007). Magnetic resonance imagingof the thalamus and adhesio interthalamica in twins withschizophrenia. Arch Gen Psychiatry, 64, 401–409.
Freeman, B., Smith, N., Curtis, C., Huckett, L., Mill, J. & Craig,I. W. (2003). Dna from buccal swabs recruited by mail:evaluation of storage effects on long-term stability and suit-ability for multiplex polymerase chain reaction genotyping.Behav Genet, 33, 67–72.
Fukumizu, K., Bach, F. R. & Gretton, A. (2006). Consistency ofkernel canonical correlation analysis. Journal of MachineLearning Research, 8, 361–383.
Fyfe, C. & Lai, P. L. (2001). Kernel and nonlinear canonical cor-relation analysis. International Journal of Neural Systems,10, 365–377.
Hardoon, D. R., Mourao-Miranda, J., Brammer, M. & Shawe-Taylor, J. (2007). Unsupervised analysis of fmri data usingkernel canonical correlation. NeuroImage, 37 (4), 1250–1259.
Hardoon, D. R., Szedmak, S. & Shawe-Taylor, J. (2004). Canon-ical correlation analysis: an overview with application tolearning methods. Neural Computation, 16, 2639–2664.
Ho, B., Wassink, T. H., O’Leary, D. S., Sheffield, V. C. &Andreasen, N. C. (2005). Catechol-o-methyl transferaseval158met gene polymorphism in schizophrenia: workingmemory, frontal lobe mri morphology and frontal cerebral
15

blood flow. Mol Psychiatry, 10, 287–229.Honea, R., Crow, T. J., Passingham, D. & Mackay, C. E. (2005).
Regional deficits in brain volume in schizophrenia: a meta-analysis of voxel-based morphometry studies. Am J Psy-chiatry, 162, 2233–2245.
Hotelling, H. (1936). Relations between two sets of variates.Biometrika, 28, 312–377.
Kempton, M. J., Geddes, J. R., Ettinger, U., Williams, S. C. &Grasby, P. M. (2008). Meta-analysis, database and meta-regression of 98 structural imaging studies in bipolar disor-der. ArchGenPsychiatry,, In Press, –.
Kuss, M. & Graepel, T. (2002). The geometry of kernel canonicalcorrelation analysis. Technical report, Max Planck Institutefor Biological Cybernetics.
McIntosh, A. M., Baig, B. J., Hall, J., Job, D., Whalley, H. C.,Lymer, G. K., Moorhead, T. W., Owens, D. G., Miller, P.,Porteous, D., , S. M. L. & Johnstone, E. C. (2007). Re-lationship of catechol-o-methyltransferase variants to brainstructure and function in a population at high risk of psy-chosis. BiolPsychiatry, 61, 1127–1134.
Mourao-Miranda, J., Bokde, A. L. W., Born, C., Hampel, H. &Stetter, S. (2005). Classifying brain states and determin-ing the discriminating activation patterns: support vectormachine on functional mri data. NeuroImage, 28, 980–995.
Mourao-Miranda, J., Reynaud, E., McGlone, F., Calvert, G. &Brammer, M. (2006). The impact of temporal compressionand space selection on svm analysis of single-subject andmulti-subject fmri data. NeuroImage, 33:4, 1055–1065.
Peper, J. S., Brouwer, R. M., Boomsma, D. I., Kahn, R. S. & Pol,H. E. H. (2007). Genetic influences on human brain struc-ture: a review of brain imaging studies in twins. HumBrainMapp, 28, 464–473.
Shawe-Taylor, J. & Cristianini, N. (2004). Kernel Methods forPattern Analysis. Cambridge University Press.
16
Copyright © 2022 FDOKUMEN