Multivariate hazard identification and ranking system
14
Identification and Multivariate Hazard Ranking System Fail I. Khan and S. A. AMMsi Computer Aided Environmental Management Unit, Centre for Pollution Control & Energy Technology,PondichenyUniversity, Pondicheny-605 014, India Risk analysis in chemicalprocess industries is an elabG rate exercise involving several steps from preliminary hazard identuication to development of credible acci- dent scenarios, to preparation of strategies for preven- tion or control of damage. All this requires substantial inputs of time and money. In order to get an approximateyet workable assessment of risk at much lesser costs, indices have been deuelopd which link typicalfindings of elaborate risk analysis to scales of risk. The scales, in turn, provide workable measures of hazards/rkh/safety. In the past, indices have been reported for swap risk assessment- the noteworthy among them include Dow fire and eqOlosion index, Mondfire, explosion and toxi- city index, ZFAL index, and mortality index. A few rapid ranking techniques have also been proposed. Thispaperpresents a new system of methodologies for Hazard Identecation and Ranking (HIM. The system consists of two indices: one forfire and explosion haz- ards and another for the hazard due to likely release of toxic chemical. The magnitudes of these indices indi- cate the severity of the likely accident in ternas of the size of the impacted area. HIM has been applied to a typical chemical process industry-a sulfolane plant-and its pe@omzance has been compared with that of the Dow3 and the Mond’s indices. The study reveals that HIM is more sensitive and accurate than the other indices. INTRODUCTION The first step of any risk assessment procedure involves hazard identification, or answering the question: what can go wrong? This is also the most important step because hazards that are not identified will not be quantified, lead- ing to the overlooking or underestimation of risk. There- fore it is very important to devote adequate resources to this step so as to ensure comprehensives. Hazard identification, however, is easier said than done, and it is becoming increasingly difficult as the depth of technology continues to grow. The hazards, as well as the strategy for reducing them, are both traceable to the man- machine management system that runs most chemical plants. It is not always easy to discover the weaknesses in such a system as the hazards do not lie on the surface, ac- cessible to simple visual inspection. With the gradual in- Process Safety Progress (Vol. 17, No. 3) crease in the complexity of the man-machine system, it is becoming increasingly difficult to locate the soft spots. At the same time a number of new tools are now available for hazard identification to facilitate risk analysis. Table 1 lists some of these stages and the corresponding hazard identi- fication techniques. No single procedure is ideal or uni- formly applicable (Anderson, [Z]); systems suit different types of industries and processes. For example, a firm in- volved in the manufacture of a large number of organic chemicals is likely to be much more interested in tech- niques that screen chemicals for toxicity than a petroleum refinery in which the emphasis is on explosions and fires. The choice of hazard identification technique also de- pends on the purpose for which the study is done. For ex- ample if the aim is to identify hazards and operating prob- lems in a plant, a HAZOP ( W a r d and Operability) study would be required. However, if identification of likely sources of toxic release is the objective, a hazard assess- ment would be necessary to carry out a specific review of such sources. In other words, methods for screening and testing would be useful in hazardous runaway reactions and decompositions, while HAZOP studies would identify how often familiar hazards may show up in a new plant. We believe hazard indices are more suitable than other screening techniques for hazard identification. Their virtues are: a) they can be worked out quickly, providing a swift means of hazard identification; b) they provide net scores which enable easy interpreta- tion of results: one can just compare the net score with the designated risk levels (very high/high/moderate/ low etc.) to get an idea of the hazards posed by the chemical or the unit under study; c) net scores also enable comparison of hazards posed by available alternatives, thus helping in decision-making; d) they do not require high level of expertise from the user. PREVIOUSLY AVAILABLE HAZARD INDICES Indices have been proposed from time to time for haz- ard identification. Noteworthy among them are the Dow fire and explosion index [I, 10, 11, 12, 1.31, Dow chemical exposure index (Dow, [I.?]), the Mond fire, explosion and toxicity index (1321) and the IFAL index ([4a), Mortality in- dex (b4]). A few rapid ranking techniques/database have also been proposed. The important ones are: substance Fall 1998 157
Transcript of Multivariate hazard identification and ranking system

Identification and Multivariate Hazard Ranking System Fai l I. Khan and S. A. AMMsi
Computer Aided Environmental Management Unit, Centre for Pollution Control & Energy Technology, Pondicheny University, Pondicheny-605 014, India
Risk analysis in chemicalprocess industries is an elabG rate exercise involving several steps from preliminary hazard identuication to development of credible acci- dent scenarios, to preparation of strategies for preven- tion or control of damage.
All this requires substantial inputs of time and money. In order to get an approximate yet workable assessment of risk at much lesser costs, indices have been deuelopd which link typicalfindings of elaborate risk analysis to scales of risk. The scales, in turn, provide workable measures of hazards/rkh/safety.
In the past, indices have been reported for swap risk assessment- the noteworthy among them include Dow fire and eqOlosion index, Mondfire, explosion and toxi- city index, ZFAL index, and mortality index. A few rapid ranking techniques have also been proposed.
This paperpresents a new system of methodologies for Hazard Identecation and Ranking ( H I M . The system consists of two indices: one forfire and explosion haz- ards and another for the hazard due to likely release of toxic chemical. The magnitudes of these indices indi- cate the severity of the likely accident in ternas of the size of the impacted area.
HIM has been applied to a typical chemical process industry-a sulfolane plant-and its pe@omzance has been compared with that of the Dow3 and the Mond’s indices. The study reveals that HIM is more sensitive and accurate than the other indices.
INTRODUCTION
The first step of any risk assessment procedure involves hazard identification, or answering the question: what can go wrong? This is also the most important step because hazards that are not identified will not be quantified, lead- ing to the overlooking or underestimation of risk. There- fore it is very important to devote adequate resources to this step so as to ensure comprehensives.
Hazard identification, however, is easier said than done, and it is becoming increasingly difficult as the depth of technology continues to grow. The hazards, as well as the strategy for reducing them, are both traceable to the man- machine management system that runs most chemical plants. It is not always easy to discover the weaknesses in such a system as the hazards do not lie on the surface, ac- cessible to simple visual inspection. With the gradual in-
Process Safety Progress (Vol. 17, No. 3)
crease in the complexity of the man-machine system, it is becoming increasingly difficult to locate the soft spots. At the same time a number of new tools are now available for hazard identification to facilitate risk analysis. Table 1 lists some of these stages and the corresponding hazard identi- fication techniques. No single procedure is ideal or uni- formly applicable (Anderson, [Z]); systems suit different types of industries and processes. For example, a firm in- volved in the manufacture of a large number of organic chemicals is likely to be much more interested in tech- niques that screen chemicals for toxicity than a petroleum refinery in which the emphasis is on explosions and fires.
The choice of hazard identification technique also de- pends on the purpose for which the study is done. For ex- ample if the aim is to identify hazards and operating prob- lems in a plant, a HAZOP ( W a r d and Operability) study would be required. However, if identification of likely sources of toxic release is the objective, a hazard assess- ment would be necessary to carry out a specific review of such sources. In other words, methods for screening and testing would be useful in hazardous runaway reactions and decompositions, while HAZOP studies would identify how often familiar hazards may show up in a new plant.
We believe hazard indices are more suitable than other screening techniques for hazard identification. Their virtues are:
a) they can be worked out quickly, providing a swift means of hazard identification;
b) they provide net scores which enable easy interpreta- tion of results: one can just compare the net score with the designated risk levels (very high/high/moderate/ low etc.) to get an idea of the hazards posed by the chemical or the unit under study;
c) net scores also enable comparison of hazards posed by available alternatives, thus helping in decision-making;
d) they do not require high level of expertise from the user.
PREVIOUSLY AVAILABLE HAZARD INDICES
Indices have been proposed from time to time for haz- ard identification. Noteworthy among them are the Dow fire and explosion index [ I , 10, 11, 12, 1.31, Dow chemical exposure index (Dow, [I.?]), the Mond fire, explosion and toxicity index (1321) and the IFAL index ([4a), Mortality in- dex (b4]). A few rapid ranking techniques/database have also been proposed. The important ones are: substance
Fall 1998 157

TABLE 1. Hazard Identification Techniques Applicable to Different Stages of Project
Hazard Identification Project Techniques Stage
Management and safety system audits
Checklists Feedback from workforce
Screening and testing for Chemicals, toxicity, instability, explosibility Reactions explosibility Impurities Pilot plant
Hazard indices Insurance assessments
Process design checks Unit processes Unit operations Plant equipments Pressure systems Instrument systems
Hazard and operability studies Failure modes and effects
Fault trees and event trees Hazard analysis Reliability assessments Operator task analysis and
operating instructions
Checks against design, inspection, examination, testing Non-destructive testing, condition monitoring Plant safety audits Emergency planning Inspection, testing
Inspection, testing Non-destructive testing, condition monitoring, corrosion monitoring, malfunction detection, plant degradation audits Plant safety audits
analysis
All stages
Research and development
Pre-design
Design
Commissioning
Commissioning
Operation
hazard index (ki’]); extraordinary hazardous substances classification (TCPA, 14311, and NFPA ranking (NFPA, 135, 36, 37, 381).
Dow flre and explosion index (Dow FEI)
This is the most widely used hazard index and is com- monly referred to as Dow Index. It was first reported in 1964 [lo]. Since then it has been evolving into progres- sively advanced version (Dow, [ZI, 12, 13, 141; AIChE [I]; Scheffler, [41].
The Index relies on the calculation of the Fire and Ex- plosion Index which is then used to determine fire protec- tion measures and, in combination with a Damage Factor,
to derive the base maximum probable property damage
In the first three editions of Dow index the methods of determining the index were developed and refined. Changes in the fourth edition were that the index was sim- plified and that two new features were introduced: the maximum probable property damage (MPPD) and a toxic- ity index. In the fifth edition several new features were added: a new framework for making the risk evaluation, improvements in the method of calculating the index, Loss Control Credits, and Maximum Probable Days Outage. The toxicity index was taken out. In the sixth edition, a risk analysis package including business interruption and a tox- icity penalty to reflect emergency responses, was intro- duced (Dow, [Ill). In the seventh edition some of the codes of good practice were updated but no major conceptual changes were made.
The Dow FEI is calculated as follows. First a material factor (MF) is obtained. It is a measure of the potential en- ergy released from the material. It is determined by consid- ering the flammability and reactivity of the material and falls in the range 1-40. Then two penalty factors (F1 and F2), one for general process hazards (GPHs) and one for spe- cial process hazards (SPHs), respectively, are determined. Next the process unit hazards factor (PUHF) (F3), which is the product of these, is calculated. The Dow FEI is ob- tained as the product of the MF and PUHF (Scheffler, [41]).
General Process Hazards (GPHs), are sum of the penal- ties due to the type of reaction/process, type of chemical handled in the process unit, and drainage and spill control of chemical. SPHs account for the penalty due to operation under hazardous conditions, quantity of chemical handled in the unit, and characteristic of chemical. Using these three parameters (MF, SPH, GPH) MPPD is estimated, and utiliz- ing credits for hazard control strategies and safety system, the “actual probable property damage” (APPD) is calcu- lated. The damaging radius is derived empirically from FEI by using the following equation:
(MPPD).
damaging radii = 0.84 * Dow FEI (1)
The Mond Rre, explosion and toxicity index wand FETI)
This is an extension of the Dow Index. Mond FETI was developed at the Mond division of ICI and the original ver- sion has been described (Lewis D2]). The alterations in Dow FEI which lead to the Mond FETI involve (Tyler, [44]; Less, 1311):
1.
2.
3.
4.
5. 6.
study of a wider range of processes and storage installa- tions; covering the processing of chemicals which are recog- nized as having explosive properties; offsetting difficulties raised by high heat of combustion per unit mass of hydrogen and enabling distinctions to be made between processes where a given fuel is re- acted with different reactants; inclusion of a number of additional special process types of hazard considerations that have been shown by a study of incidents to affect the level of hazard signifi- cantly; enabling toxicity to be included in the assessment; inclusion of a range of offsetting factors for good design of plant and control/safety instrumentation systems to
158 Fall 1998 Process Safety Progress (Vol. 17, No. 3)

enable realistic hazard levels to be assessed for plant units under varying levels of safety features;
7. indication of how the results of the method can be ap- plied logically in the design of plants having a greater degree of “inherent safety.”
The Mond FETI involves making an initial assessment of hazard in a manner similar to that used in the Dow FEI, but taking into account additional hazard considerations. The potential hazard is expressed in terms of the initial value of a set of indices for fire, explosion and toxicity.
The material factor is determined as in the Dow method, but in addition special material hazard factors are intro- duced. Again as in the Dow method, use is made of factors for GPHs and SPHs although the particular factors are dif- ferent. A quantity factor, based on the inventory of mate- rial, and layout hazard factors are also introduced. There are also factors for toxicity hazard.
The toxicity index is calculated using health factor, quantity of chemical in use and the toxicological proper- ties of chemical. Recently, Tyler et al. [45] have introduced some modifications in toxicity index calculation procedure. He has proposed a toxicity index calculation procedure which is similar to Mond FETI but includes consideration of the effect of acute concentration and layout of the area. He has proposed ranking of toxicity index on a seven point scale, from low to severe.
The instantaneous fractional a n n d loss index
The IFAL index was developed by the Insurance Techni- cal Bureau, UK, primarily for insurance assessment pur- poses (Singh and Munday, [42]; Insurance Technical Bu- reau, [l8]; Whitehouse [461).
The method of calculation of IFAL index involves exam- ining each major item of process equipment to assess its contribution to the index. The main hazards accounted for the index are:
1. pool fires, 2. vapor fires, 3. unconfined vapor cloud explosions, 4. confined vapor cloud explosions, 5. internal explosions.
In contrast to the Dow and Mond indices, the IFAL index is too complex for manual calculation and is carried out us- ing a computer program.
Dow chemical exposure index (Dow CEI)
The Dow CEI ([ 241; AIChE, [ I ] ) is a measure of the rela- tive acute toxicity risks. It may be used for initial process hazard analysis (PHA), calculation of a Distribution Rank- ing Index (DRI), and in emergency response planning.
The information needed for the calculation of the Dow CEI includes a) includes physical and chemical properties of the material; b) a simplified process flow sheet; c) show- ing vessels and major pipe work with inventories; and d) an accurate plan of the industry and its surroundings.
Mortalityindex
This index, proposed by Marshall 1341 is a measure of the lethality of the hazardous materials. It is computed on
the basis of the number of deaths per tonne of material in- volved.
Rapid ranking techniques
Various agencies have proposed “rapid ranking tech- niques” (RRT) and databases for hazard identification which are mainly based on the three main characteristics of chemicals: toxicity, reactivity, and flammability. These techniques and databases are used in different forms in hazard assessment to identify the type of hazard present in the unit.
Substance Hazard Index (SHI)
A hazard system ranking proposed by American Petroleum Institute (MI, b7]), is based on the vapor pres- sure and the toxicity of the chemical being assessed. It postulates that a high vapor pressure substance disperses more rapidly and an acutely toxic substance can pose damage even at low emission level. The substance hazard index, SHI is calculated as:
SHI = EVC/ATC
Where EVC denotes equilibrium vapor concentration (sub- stance vapor pressure in mm Hg at 20°C multiplied by 106 and divided by 760) and ATC denotes acute toxic concen- tration in ppm. A SHI value of greater than 5000 is consid- ered to represent hazardous substance. This procedure en- ables ranking of a chemical only at normal operating con- ditions. It does not incorporate any other effects such as effect of temperature/pressure on the operation, operating conditions, type of unit operation process, site characteris- tics, etc.
Extraordinary bazardous substances (EHS)
In the “toxic catastrophe prevention act” USA (TCPA, [43]), a list of such substances has been notified based on toxicity which, on human contact, may cause permanent adverse effect, including death. This list has been prepared on the basis of experimental evidence of toxicity as well as phyisco-chemical properties of the chemicals. In compari- son to SHI. EHS is less common and effective.
N a t i d f l r e protection association (NFPA) ranking system
National Fire Protection Association (NFPA)-704M has developed a system of hazard identification and ranking (NFPA, b5, 36, 37, 381). The chemicals are ranked using three different indices for toxicity, flammability and reactiv- ity on 0 to 4 (least to most hazardous) scales.
It is presently the most recommended technique for ranking hazardous chemicals. However, its application has been restricted to specific hazard associated with chemi- cals; the effect of other relevant parameters (such as oper- ating conditions and site characteristics) has to be ac- counted externally. Consequently, the use of NFPA ranking system is restricted to assessing hazards under normal con- ditions.
Process Safety Progress (Vol. 17, No. 3) Fall 1998 159

THE PROPOSED SYSTEM
Hazard Identification and RAnking &mW system
On the basis of the foregoing review we deduce: i) Good ranking procedures and databases are available to
assess the hazards inherent in the chemicals used in process industries-flammability, toxicity, corrosivity and explosivity-under normal condition. However, when such chemicals are used under elevated tempera- ture and/or pressure-which is quite often-their haz- ard potential is significantly increased. Further, the risk posed by a chemical (or a process using a chemical) is also a function of its surroundings (such as proximity to other sensitive units, populous neighborhoods, fragile ecosystems) and such transient environmental factors as atmospheric stability and wind direction.
ii) The Dow and the Mond indices have been popular and have served useful purpose. We feel there is scope of improving them in terms of: a) The main basis of the Dow and the Mond indices is
the material factor (defined under “introduction”). It is estimated empirically based on the reactivity of the chemical and its vapor pressure. We believe that re- liance on a single parameter (material factor), which too, is empirically derived, may not give reliable measure of hazards. It accounts only for chemical energy (due to reactivity), major hazards are also present due to physical energy (pressure energy).
b) The “material factor” as used in the indices is inde- pendent of the type of operation/process and proc- ess conditions. But each process may have hazards specific to it. For example in a unit involving a chemical reaction, hazards would exist due to chem- ical energy (reactivity of chemicals), as well as phys- ical energy (pressure and temperature). In other units, such as the ones associated with storage, the hazard is mainly due to physical energy (pressure, temperature, and state of chemical). Moreover, these hazards can be easily quantified using common for- mulae of thermodynamics and fluid dynamics.
c) It follows that the system of assigning penalties to the two indices also suffers due to the lack of complete- ness in quantifying hazards. As the penalties are as- signed on the basis of the risks posed, wherever the extent of risk is assessed inadequately the penalties assigned are also inadequate.
d) In Mond and Dow indices estimation of penalties for general process hazard and special process hazard steps are independent of process unit/operation. In this regard authors feel that penalties should be esti- mated depending upon process/operation type, which will reduce the working load by eliminating the unimportant penalties and giving due emphasis to important penalties.
Keeping these points in view we have proposed a sys- tematic, comprehensive, but easy to implement system, called hazard identification and ranking (HIM).
i) The fire and explosion damage index (FEDI), ii) The toxicity damage index (TDI).
cussed below (Figure 1).
HIM is essentially a combination of two indices
The procedure for development of each of these is dis-
+l take onr unit
. \ /
V I
Both
Wilatr Ltb fin I r torion d u p i!&x md
toxic (uuge index
1 h i m tk rmk to tk
unit
FIGURE 1 Algorithm of hazard identification and ranking (HIM) system.
THE FIRE AND EXPLOSION DAMAGE INDEX (FED0
For the purpose of developing FEDI, the various units of an industry are classified as follows:
i) storage units, ii) units involving physical operations such as heat
transfer, mass transfer, phase charge, pumping and compression,
iii) units involving chemical reactions iv) transportation units v) other hazardous units such as furnace, boilers, di-
Estimation of FEDI involves the following steps (Figure
i) classification of the various units in an industry into
ii) evaluation of energy factors; iii) assignment of penalties; iv) estimation of damage potential; v) estimation of FEDI.
Each of these steps is described below.
rect-fired heat exchangers, etc.
2):
the five categories mentioned above,
Storage units
These units involve storage, and intermediate-process inventories of chemicals (chemical hold-up). To estimate the FEDI due to these units, three energy factors (F l , F2,
160 Fall 1938 Process Safety Progress (Vol. 17, No. 3)
, Physical properties
. Chemical properties
, Operation conditions
, State of chemical
.Operation conditions
,Chemicals properties
.Qpaci t y
.Type of operat ion
Divide conplete p l a t in to manage~le r units
. Identify 111 hazardous cherricals
.----- 11, F2 and I3
I
Istimate penal t ies .--------
.Surrounding p a m e ters
unl t s
Yes V else
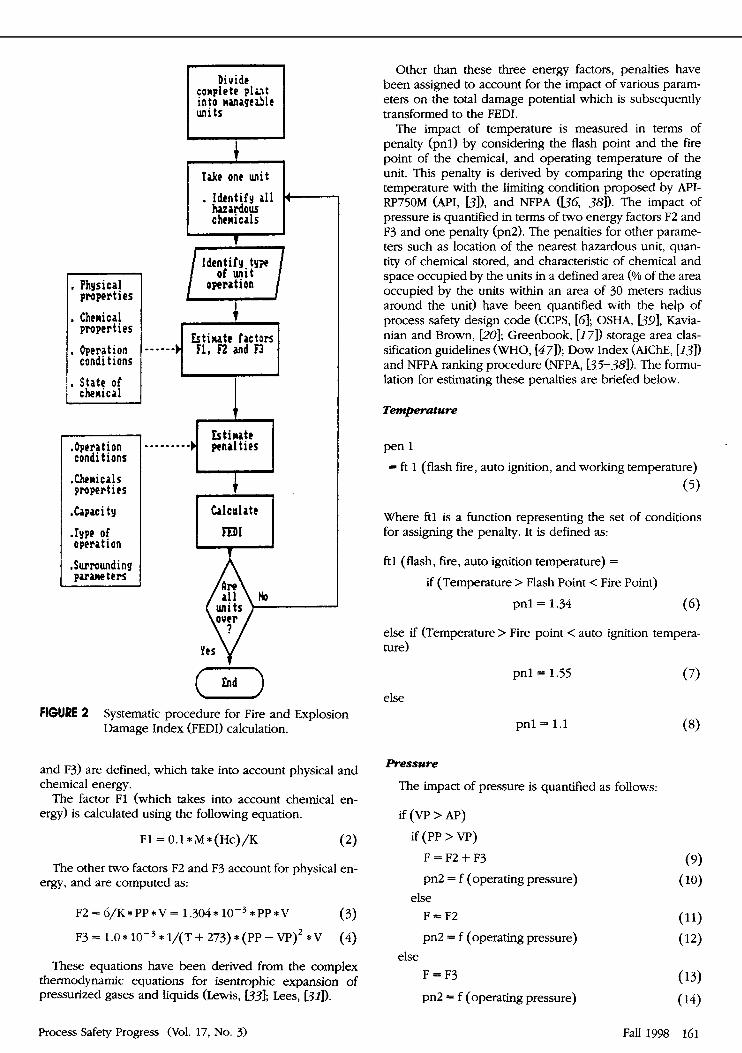
Other than these three energy factors, penalties have been assigned to account for the impact of various param- eters on the total damage potential which is subsequently transformed to the FEDI.
The impact of temperature is measured in terms of penalty (pnl) by considering the flash point and the fire point of the chemical, and operating temperature of the unit. This penalty is derived by comparing the operating temperature with the limiting condition proposed by API- RP750M (API, D]), and NFPA (136, 381). The impact of pressure is quantified in terms of two energy factors F2 and F3 and one penalty (pn2). The penalties for other parame- ters such as location of the nearest hazardous unit, quan- tity of chemical stored, and characteristic of chemical and space occupied by the units in a defined area (% of the area occupied by the units within an area of 30 meters radius around the unit) have been quantified with the help of process safety design code (CCPS, [a; OSHA, Dg], Kavia- nian and Brown, [ZO]; Greenbook, [ I 71) storage area clas- sification guidelines (WHO, [471); Dow Index (AIChE, [I311 and NFPA ranking procedure (NFPA, L?5-381). The formu- lation for estimating these penalties are briefed below.
Temperature
pen 1
= ft 1 (flash fire, auto ignition, and working temperature) (5)
Where ftl is a function representing the set of conditions for assigning the penalty. It is defined as:
ftl (flash, fire, auto ignition temperature) =
if (Temperature > Flash Point < Fire Point)
pnl = 1.34
else if (Temperature > Fire point < auto ignition tempera- ture)
( 6 )
FIGURE 2 Systematic procedure for Fire and Explosion Damage Index (FEDI) calculation.
and F3) are defined, which take into account physical and chemical energy.
The factor F1 (which takes into account chemical en- ergy) is calculated using the following equation.
FI = 0.1 *M*(HC)/K (2)
The other two factors F2 and F3 account for physical en- ergy, and are computed as:
(3) F2 = 6/K* PP * V = 1.304 * F3 = 1 .O *
* PP *V
* 1/(T + 273) * (PP - VP)' *V (4)
These equations have been derived from the complex thermodynamic equations for isentrophic expansion of pressurized gases and liquids (Lewis, 1731; Lees, 1711).
pnl = 1.55
pnl = 1.1
Pressure
The impact of pressure is quantified as follows:
if (VP > AP) if (PP > VP)
F = F2 + F3 pn2 = f (operating pressure)
F = F2
pn2 = f (operating pressure)
F = F3
pn2 = f (operating pressure)
else
else
Process Safety Progress (Vol. 17, No. 3) Fall 1998 161
I 2
I
1 . I , , 1
1.8
I
1 1 6 11 16 21 26 31 36 41 46 51
Pressura, atm
-Nf or Nr > 2 + Nf or Nr < 2
Penalty due to severity of pressure. FIGURE 3
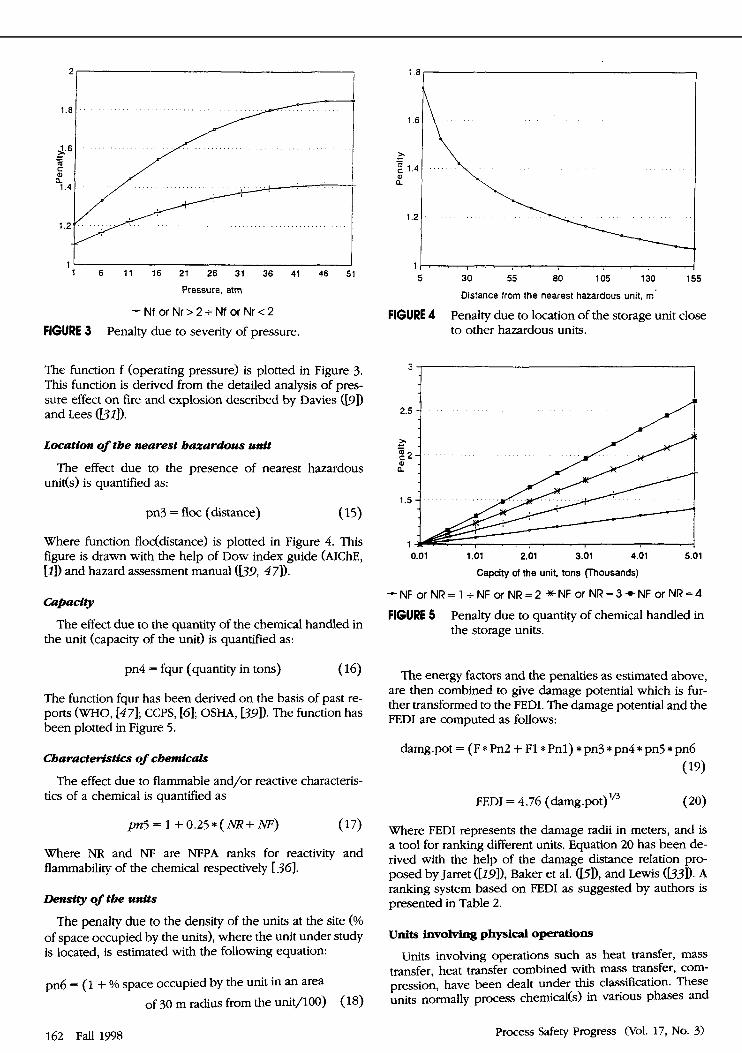
The function f (operating pressure) is plotted in Figure 3. This function is derived from the detailed analysis of pres- sure effect on fire and explosion described by Davies (w]) and Lees (1311).
Location of tbe nearest bazardous unit
unit(s) is quantified as: The effect due to the presence of nearest hazardous
pn3 = floc (distance) (15)
Where function floddistance) is plotted in Figure 4. This figure is drawn with the help of Dow index guide (AIChE, [I]) and hazard assessment manual (b9, 471).
Capactty
the unit (capacity of the unit) is quantified as: The effect due to the quantity of the chemical handled in
pn4 = fqur (quantity in tons) (16)
The function fqur has been derived on the basis of past re- ports ( W O , [47]; CCPS, [a; OSHA, I391). The function has been plotted in Figure 5.
Characteristics of cbemicals
tics of a chemical is quantified as The effect due to flammable and/or reactive characteris-
pn5 = 1 + 0.25*( M7+ AF) (17)
Where NR and NF are NFPA ranks for reactivity and flammability of the chemical respectively [3a.
Density of the units
The penalty due to the density of the units at the site (% of space occupied by the units), where the unit under study is located, is estimated with the following equation:
pn6 = (1 + % space occupied by the unit in an area of 30 m radius from the unit/100) (18)
1 6
5, - - z 1 4 m c
1 2
2.5 -1 I > /I
0.01 1.01 2.01 3.01 4.01 5.01
Capcity of the unit, tons (Thousands)
-NF or NR = 1 + NF or NR = 2 *NF or NR = 3 +NF or NR = 4
FIGURE 5 Penalty due to quantity of chemical handled in the storage units.
The energy factors and the penalties as estimated above, are then combined to give damage potential which is fur- ther transformed to the FEDI. The damage potential and the FEDI are computed as follows:
damg.pot = (F * Pn2 + F1* Pnl) * pn3 * pn4 * pn5 * pn6
(19)
FEDI = 4.76 (damg.p~t) '~ (20)
Where FEDI represents the damage radii in meters, and is a tool for ranking different units. Equation 20 has been de- rived with the help of the damage distance relation pro- posed by Jarret ([191), Baker et al. (1511, and Lewis (L?31). A ranking system based on FEDI as suggested by authors is presented in Table 2.
Units invohring physical operation^
Units involving operations such as heat transfer, mass transfer, heat transfer combined with mass transfer, com- pression, have been dealt under this classification. These units normally process chemical($ in various phases and
162 Fall 1998 Process Safety Progress (Vol. 17, No. 3)

TABLE 2. Hazard Ranking According to the Fire, Explosion and Toxic Damage Index
Fire and
Damage Damage Hazard Explosion Toxic
Index (FED11 Index (TDI) Characterization FEDI > 500 TDI > 700 Extremely hazardous
500 > FEDI > 400 700 > TDI > 500 Highly hazardous 400 > FEDI > 200 500 > TDI > 200 Hazardous 200 > FEDI > 100 200 > TDI > 50 Moderately hazardous 100 > FEDI > 20 50 > TDI > 05 Less Hazardous
else else No Hazard
under conditions of very high or low temperature and pressure.
For these units, too, three types of energy factors and six types of penalties have been considered. The method of calculating energy factors for these units is same as for storage units but the formulation for calculating penalties are different. The effect of temperature (pnl) is assessed by comparing the operating temperature with flash fire and auto ignition temperature. The level of penalty here is higher because most of the operations are temperature sensitive. The pnl (penalty due to temperature) has been assigned a maximum value 1.95 when operating tempera- ture is greater than fire point temperature of the chemical. This penalty is derived with the help of ranking proce- dures reported by API-RP750 (MI, 1311, and NFPA-325M (NFPA, b7]). The intermediate value of penalty is quanti- fied as:
pn2 = ft2 (flash, fire, auto ignition, working temperature) (21)
where ft2 is a function defined as:
if (Temperature > Flash Point < Fire Point)
ft2 = 1.45 (22) else if (Temperature > Fire Point <
0.75 Auto ignition temperature)
ft2 = 1.75 (23)
ft2 = 1.95 (24)
ft2 = 1.1 (25)
else if (Temperature > 0.75 Auto ignition temperature)
else
The effect of pressure is assessed in two ways:
i) deciding combination of energy factors F2 and F3; ii) estimating penalties by comparing the operating pres-
sure with vapor pressure.
if (VP > AP and PP > VP)
pn2 = fpl(PP, M , W)
F = F2 + F3 else
pn2 = fp2( PP, AP , VP)
F = F2
if (AP > VP and PP > AP)
pn2 = fp3(PP, AP, VP)
F = F3
otherwise pn2 = 1 .I (a limiting value) ( 32)
F = F3 (33)
The functions fpl, fp2, and fp3 are defined as:
f p l = l +((PP-VP)/PP)*O.G (34)
fp2=1+((PP-VP)/PP)*0.4 (35)
fp3=1 +((PP-VP)/PP)*O.2 ( 36)
If the process is under vacuum the penalty (pn2) is as- signed a value ranging from 1.2 to 1.65 depending upon the extent of vacuum (1 atm to 0.001 am).
The weightage due to the quantity of chemical handled in the unit (pn3) is assessed using Figure 6. This figure has been plotted in a manner similar to the one for storage units except that a more pronounced impact has been taken into account. The effect of chemical characteristics (reactivity and flammability) is assessed with the following equation:
pn4=1+0.25*(NF+NR); (37)
Where NF and NR are NFPA ranks for flammability and re- activity (NFPA, Dd).
The effect of the location of the nearest hazardous unit (pn5) may be quantified with the help of Figure 7 . This fig- ure is plotted in a manner similar to the one for the storage units. The penalty for the density of the units (pn6) is ac- counted by the same functions as has been defined for the storage units.
pn6 = (1 + % space occupied by the unit in an area
of 30 m radius from the unit/100) (38)
3i 2.5 1 I
74
10 30 50 70 90 110 130 150
Quantity of chemical, tons
-NF or NR= 1 +NF or NR=2 *NF or NR=3+NF or NR=4
FIGURE 6 Penalty due to quantity of chemical handled in the unit involving physical changes.
Process Safety Progress (Vol. 17, No. 3) Fall 1998 163

2 , I
1 ‘ I ” ” , I 5 30 55 80 105 130 155
Distance from the nearest hazardous unit, m
FIGURE 7 Penalty due to location of the unit involving physical changes close to other hazardous units.
Finally the damage potential is calculated using the follow- ing equation before it is transformed into FEDI (using Equation 20)
damg .pot = (F1* pnl + F * pn2) * pn3 * pn4 * pn5 * pn6
(39)
Units involving chemical reactions
This class considers units associated with chemical reac- tions. Such units form the bulwark of chemical process in- dustries. Such units are also the source of most hazards as they often handle mixture of chemicals at extreme condi- tions of temperature and pressure. Besides the hazards posed by the reactivity and/or flammability of the chemi- cals, there is additional hazards of sudden shifts in temper- ature or pressure due to runaway reactions. To take cogni- sance of the latter hazard, a new energy factor F4 is incor- porated which represents the energy released due to chemical reactions. This factor is estimated as:
F4 = M * H m / K (40)
In addition to the types of penalties assigned for other units, the following two kinds are taken into account: a) re- lated to the nature of the reactions (Pn7) and b) related to the probability of “side reactions” or “runaway reactions.” The penalties of the first kind are assigned as per the guidelines presented in Table 3. The maximum value is as- signed to nitration and the minimum to reduction. The quantification has been based on reactive hazard index (Austin, [41; Crousal and Lowver, 181) and considerations of risks from hazardous reactions (Fowcett and Wood, [Id; Raghavan and Swaminathan, [40]).
The possibility and the impact of side reaction is quanti- fied in terms of penalty (Pn81, which depend upon the likelihood and the type of the side reaction. The penalty has been based on the studies of Austin (C41); Crousal and Lower ([g]), Dow ( [ I I ] ) , and Kavianian and Brown ([201). Higher values have been assigned to the side reactions likely to occur at above normal operating conditions (Ta- ble 3). It is because the probability Of OCCuKence and dam-
TABLE 3. Guidelines to Assign the Penalty Due to the Type of Reaction and Undesirable Side Reaction
Type of Reaction Penalty Oxidation 1.60 Electrolysis 1.20 Nitration 1.95 Esterification 1.25 Reduction 1.10 Aminolysis 1.40 Halogenation 1.45 Sulfonation 1.30
Alkylation 1.25 Polymerization 1.50 Pyrolysis 1.45
Undesirable side reaction
Autocatalytic reaction 1.65 Non-auto-catalytic side reaction 1.45
Hydrogenation i.35
probable to occur at above normal reaction conditions
probable to occur at below normal reaction conditions
Non-auto-catalytic side reaction 1.20
age consequences of side reactions occurring above nor- mal operating conditions are higher (Kletz, [28, 29, 301).
Finally, the damage potential and FEDI for these units are calculated:
damg.pot = (F1* pnl + F * pn2 + F4 * pn7 * pn8)
* pn3 * pn4 * pn5 * pn6 (41)
The damage potential is later converted to FEDI (using Equation 20).
Transportation units
The transportation of chemicals from one unit to another is associated with hazards of different types and magni- tudes. When the transportation involves chemicals under such extreme conditions as highly pressurized or super- heated state, the hazards are very great. Thus it is essential to provide adequate weightage to such conditions as tem- perature, pressure and flow rate. We have therefore as- signed penalties relating to transportation temperature (pnl), transportation pressure (pn2), quantity transported (pn3), characteristic of the chemical such as flammability, reactivity (pn4), physical state of the transported chemical (pn51, location of the nearest hazardous unit (pnb), and density of the units in the area (pn7). The energy factors F1, F2, and F3 are similar to the ones used for other units.
The effect of temperature is estimated with:
pnl = ft2 (flash, fire, auto ignition transportation temperature) (42)
The penalty due to severity of transportation pressure is es- timated as follows:
TP>AP < 3*AP; pn2 = 1.2 (43)
164 Fall 1998 Process Safety Progress (Vol. 17, No. 3)
TP>3*AP<5*AP;
TP > 5 * N ; pn2 = 1.4 (44)
pn2 = 1.6 (45)
For transportation under subatmospheric pressure the penalty (pn2) is quantified based on the extent of vacuum (pn2 = 1.2-1.8). The penalty for transportation by road is estimated using Figure 5, and by transportation through pipe line is estimated using the equation
(46) quantity transported (Kg/min)
1000 pn3 = 1.0 +
The effect of chemical characteristic is estimated as:
Pn4 = minimum (1,0.20 * (NF + NR)) (47)
and the penalty due to the physical state of the chemical is estimated as:
Pn5 = function (physical state) (48)
Gaseous pn5 = 1.45 (49) Liquefied gas pn5 = 1.65 ( 50) Liquid pn5 = 1.25 (51) Fine solid particles pn5 = 1.30 (52)
The penalties due to the location of nearest hazardous unit (pn6) and density of the units (pn7) are estimated us- ing functions similar to the ones described for storage units.
Pn6 = loca (distance) ; using Figure (4)
Pn7 = (1 + % space occupied by the units in a radius of 30 m from the unit/100) (53)
The energy factors and penalties are combined to esti- mate damage potential:
damg.pot = (F1* pnl + F2 pn2) * pn3 * pn4 * pn5 * pn6 * pn7 (54)
Finally, as before, damage potential is transformed into FEDI using Equation 20.
Other hazardous units
This class covers ancillary units such as boilers, direct- fired heat exchangers, flares, furnaces, etc. which do not fall under the other four classes. In such units physical en- ergy (due to the internal pressure of the unit) is not impor- tant. Therefore, factors F2 and F3 are not considered. In- stead a few more penalties have been added to account for the effect of type of fuel (pnl), physical state of the fuel (pn2), and rate of the use of the fuel (pn3). Penalties have also been assigned for the location of nearest hazardous unit (pn4), density of the units (pn5) and temperature of the unit (pn6).
The penalty due to flammability is estimated with the equation
Pnl = minimum (1,0.25*(NF + NR)) (55)
The penalty due to physical state of the chemical is esti- mated with
Pn2 = f (physical state) ( 56)
where function f (physical state) is defined as:
Solid solid dust particle size > 150 micro meter
pn = 1.25 (57)
pn = 1.40 ( 58)
( 59)
pn2 = 1.65 (60)
pn2 = 1.80 (61)
solid particle size < 150 micro meter
Liquid pn2 = 1.35
Gaseous
Liquefied gas
The penalty due to the quantity of the fuel used in the unit is estimated using the following expression:
NF 1000 Pn3 = 1 .O + - *quantity in use per hour (tons/hr)
(62)
The quantification of other penalties pn4, pn5, and pn6 is done using same functions as proposed for units involv- ing physical changes.
The damage potential for these units is computed by multiplying energy factor with all the penalties. This is sub- sequently transformed to FEDI using Equation 20.
damg.pot = F1* Pnl * Pn2 * Pn3 * Pn4 * Pn5 * pn6 (63)
TOXIC DAMAGE INDEX (TDI) METHODOLOGY
Toxic damage index (TDI) is a representation of lethal toxic load over an area. It is measured in terms of radius of the area (in meters) getting affected lethally by toxic load (50% probability of causing fatality). This index is derived using transport phenomena and empirical models based on the quantity of chemical(s) involved in the unit, the physi- cal state of the chemical(& the toxicity of the chemical(s), the operating conditions, and the site characteristics (Fowcett, [15]; Tyler et al., [45]). The dispersion is assumed to occur under slightly stable atmospheric conditions. We have opted for “slightly stable atmospheric conditions” as these represent a median of high instability and high stabil- ity. Furthermore, such conditions are often prevalent dur- ing accidents-as had happened at Bhopal, Basel, Panipat and other places (Cristen et al., [71; Lees, bZ1; Khan and Abbasi, [ZZ]).
The estimation of TDI is done with one core factor named as “G factor” and several penalties. The G factor takes into account the following:
i) during the accidental release of super-heated liquid (liquid stored or processed above its normal boiling point) from the unit, a part of the liquid would flash to
Process Safety Progress (Vol. 17, No. 3) Fall 1998 165

vapors and the remaining part would form a liquid pool which would subsequently evaporate;
ii) the release of gases would directly lead to dispersion in the atmosphere and would cause build-up of lethal toxic load;
iii) liquefied gases would have two-phase release, fol- lowed by dispersion and build-up of toxic load;
iv) pyrophilic solids would give toxic vapors which would generate toxic load in the air.
The G factor is quantified as:
G = A * m (64)
the value of A is dependent on the release conditions (Ta- ble 4), and m is anticipated release rate in kg/s.
The G factor forms the base or the “core weight” which provides dimensions to the various types of penalties. The penalties take into account i) operating temperature, ii) op- erating pressure, iii) vapor density, iv) toxicity of chemical, and v) site characteristics.
The effects of temperature and pressure are estimated through penalty pnrl and pnr2, respectively. These penal- ties are derived with the help of TCPA ([431), OSHA (L391), Tyler et al. ([451), and API-750RPM ranking technique (API, [2]). The set of conditions used in estimating pnrl and pnr2 are as follows;
Tenrperature
if (chemical is flammable)
if (Temperature > Flash Point < Fire Point)
pnrl = 1.45 (65)
if (Temperature > Fire Point
< 0.75 auto ignition temperature)
pnrl = 1.75 (66)
pnrl = 1.95 (67)
if (Temperature > 0.75 auto ignition temperature)
else if (chemical is toxic or corrosive)
if (Temperature > 4 * ambient temperature)
pnrl = 1.55 (68)
pnrl = 1.35 (69)
else if (Temperature > 2 * ambient temperature)
else pnrl = 1.1
TABLE 4. Table to Estimate Factor A
NFPA Liquefied Rank Liquid Gas Gas Solid
4 4.00 8.0 13.40 0.1300 3 0.40 0.8 1.34 0.0130 2 0.20 0.4 0.67 0.0060 1 0.07 0.1 0.25 0.0025
Pressure
if (VP > AP) if(PP > 3.0*AP)
else pnr2 = h l (PP) (71)
pnr2 = 1.3 (72) else if (PP < VP)
pnr2 = - h2 (PP) , (provided, PP < 0.3 * AP) (73) else
pnr2 = 1.2 (74)
The functions hl(pp) and h2(pp) have been plotted in Figures 8 and 9, respectively; the values of penalties can be directly computed from these Figures.
Vapor density
Gases of vapors having density higher than air take more time to disperse and their plumes tend to be closer to the
-.- I I 3
2.5
- 2 n LL = 1 5
1
05
- 3.2 4.0 4.5 5.0 5.5 6 7.0 9 15
Processing pressure (atm)
FIGURE 8 Penalty due to severity of pressure (above at- mospheric pressure) for toxicity damage index estimation.
3
2 5
2 p̂ 0,
1.5
0 5
- I
0.25 0.20 0.15 0.10 0.10 0.0
Processing Pressure (arm)
FIGURE 9 Penalty due to pressure severity (under vac- uum) for toxicity damage index estimation.
166 Fall 1998 Process Safety Progress Wol. 17, No. 3)

ground due to gravitational effect. Thus, such gases would cause build up of lethal toxic load closer to the ground and for longer duration than lighter gases. This effect has been quantified with the help of the model developed by us ear- lier (Khan and Abbasi, 123, 24, 251).
Pnr3 = 1.2 * Vapor density/air density (75)
Toxicity of cbemical
The penalty due to the toxicity of the chemical is as- sessed using NFPA-49 (NFPA, [3d) health factor (NH) as
where NH represents NFPA ranking for health hazard (NFPA, bd).
Site characteristics
The effect of site characteristics has been accounted on the basis of population density at the site. The penalty is quantified with the help of criteria mentioned by Less 13211, Christen et al. ([i']), and Khan and Abbasi ([25]), and is plotted in Figure 10.
pnr5 = fpop (population density) (77)
Finally, the G factor and the penalties are combined to give TDI using the following equation.
TDI = a( G * pnrl * pnr2 * pnr3 * pnr4 * ~ n r 5 ) ~ (78)
where, a and b are constant and are estimated by studying release and dispersion of a range of chemicals (super heated liquids, liquefied gases, gases, etc.). The most ap- propriate values of a and b are estimated as:
a = 25.35 and b = 0.425.
1 .i
1
0.0 e P
8
0.6 L - m E
0.4
0.2
0
I
Population density (Person/SqKm) (Thousands)
FIGURE 10 Penalty for population density.
ILLUSTRATIVE EXAMPLE SHOWING APPLICATION OF HIRA
To illustrate the applicability of the HIRA methodology, we present a hazard identification study of a typical sul- folane manufacturing plant, situated at Raigarh, Maharasha- tra, India. The plant consists of six main units-storage vessels, reactors (reactor 1 and 2), evaporator, recycle and compressor (Khan et al., [21]; Khan and Abbasi, [Zd). The four most hazardous chemicals used in the plant are: 1) butadiene, 2) sulfur dioxide, 3) hydrogen, and 4) sulfolane. As per the HIRA methodology elaborated by us earlier,
the different components of the plants were classified into: storage unit, sulfonation reaction unit, evaporation unit, hydrogenation reaction unit, recycle, and compression unit. These units were then processed as per the HIRA system and the FEDI and the TDI were computed. The results are presented in Table 5. A typical set of calculations involved in HIRA is presented in Table 6. It is seen from Table 5 that the units handling chemicals which are toxic as well as flammable have high FEDI as well as TDI. The values of these indices are also seen to change from unit to unit in-
~~ ~ ~
TABLE 5. Fire, Explosion and Toxic Damage Index Values for Different Units of Sulfolane Plant
Fire and Toxic
Units Specification Chemical Hazard Damage Index Index Storage 1 Storage Butadiene Fire & Explosion 440.3 118.5
HIRA's Units Type of Explosion Damage
Storage 2 Storage Sulfur dioxide Toxic release 75.4 477.5 Storage 3 Storage Hydrogen Fire & Explosion 277.1 88.0 Line 11 Transportation Butadiene Fire & Explosion 83.2 46.5 Line 12 Transportation Sulfur dioxide Toxic release 45.3 337.5 Line 14 Transportation Sulfolene Fire and toxic release 65.4 71 .O Line 19 Transportation Hydrogen Fire, explosion & toxic release 105.4 57.0 Reactor 1 Reaction unit Sulfur butadiene Fire, explosion & toxic release 271.6 128.5 Reactor 2 Reaction unit Hydrogen, sulfolen Fire, explosion & toxic release 205.4 97.0 Evaporator Processing unit Sulfurdioxide Fire and toxic release 179.6 321.5
Pump 3 Processing unit Sulfurdioxide Toxic release 9.5 198.0 Pump 5 Processing unit Butadiene Fire & explosion 34.5 77.0 Pump 7 Processing unit Hydrogen Fire, explosion & toxic release 41.7 106.5
sulfolene
Process Safety Progress (Vol. 17, No. 3) Fall 1998 167
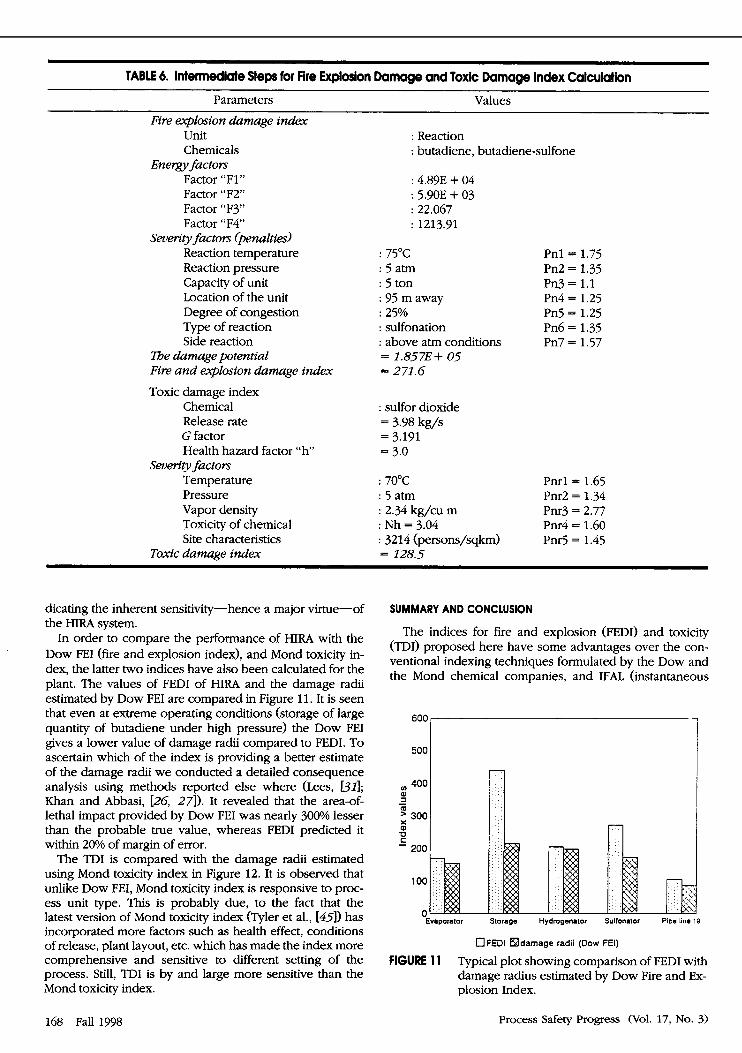
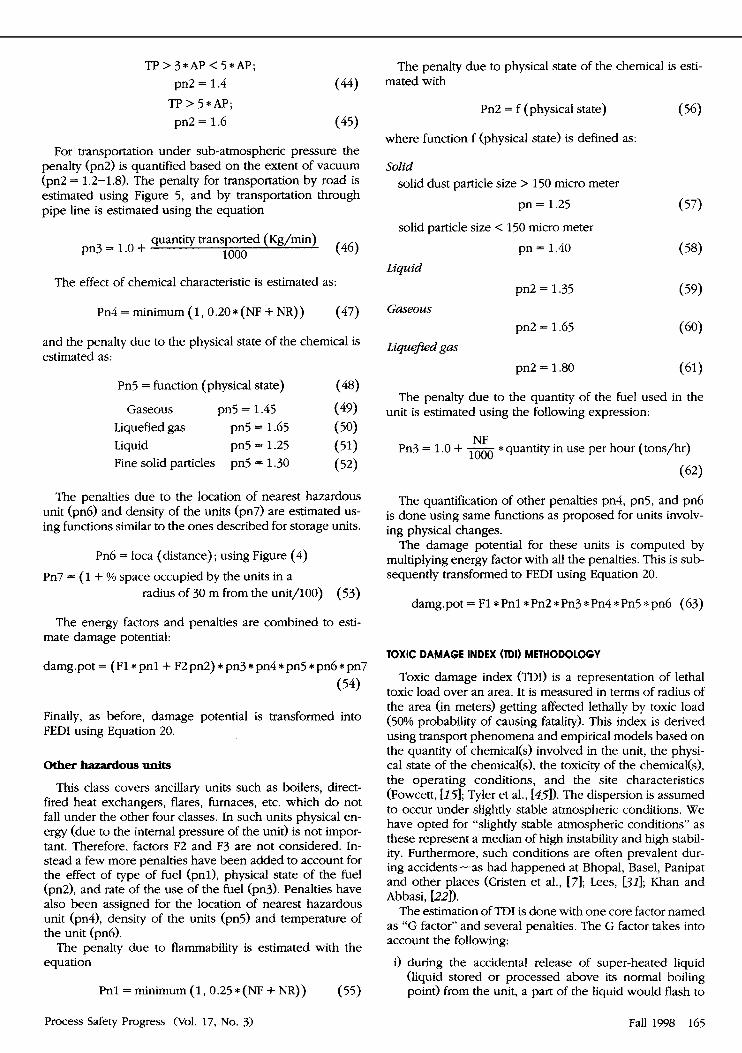
TABLE 6. Intermediate Steps for Fire Explosion Damage and Toxic Damage Index Calculation ~ ~~
Parameters Values Fire eqlosion damage index
Unit Chemicals
Factor “Fl” Factor “F2” Factor “F3” Factor “F4”
Reaction temperature Reaction pressure Capacity of unit Location of the unit Degree of congestion Type of reaction Side reaction
The damage potential Fire and eqlosion damage index Toxic damage index
Chemical Release rate G factor Health hazard factor “h”
Severity factors Temperature Pressure Vapor density Toxicity of chemical Site characteristics
Enew factors
Severity factors (penahies)
Toxic damage index
: Reaction : butadiene. butadiene-sulfone
: 4.89E + 04 : 5.90E + 03 : 22.067 : 1213.91
: 75°C Pnl = 1.75 : 5 atm Pn2 = 1.35 : 5 ton Pn3 = 1.1 : 95 m away Pn4 = 1.25 : 25% Pn5 = 1.25 : sulfonation Pn6 = 1.35 : above atm conditions Pn7 = 1.57 = 1.857E+ 05 = 271.6
: sulfor dioxide = 3.98 kg/s = 3.191 = 3.0
: 70°C Pnrl = 1.65 : 5 atm Pnr2 = 1.34 : 2.34 kg/cu m Pnr3 = 2.77 : Nh = 3.04 Pnr4 = 1.60 : 3214 (persons/sqkm) Pnr5 = 1.45 = 128.5
dicating the inherent sensitivity-hence a major virtue-of the HIRA system.
In order to compare the performance of HIRA with the Dow FEI (fire and explosion index), and Mond toxicity in- dex, the latter two indices have also been calculated for the plant. The values of FEDI of HIM and the damage radii estimated by Dow FEI are compared in Figure 11. It is seen that even at extreme operating conditions (storage of large quantity of butadiene under high pressure) the Dow FEI gives a lower value of damage radii compared to FEDI. To ascertain which of the index is providing a better estimate of the damage radii we conducted a detailed consequence analysis using methods reported else where (Lees, 1311; Khan and Abbasi, [ZG, 271). It revealed that the area-of- lethal impact provided by Dow FEI was nearly 300% lesser than the probable true value, whereas FEDI predicted it within 20% of margin of error.
The TDI is compared with the damage radii estimated using Mond toxicity index in Figure 12. It is observed that unlike Dow FEI, Mond toxicity index is responsive to proc- ess unit type. This is probably due, to the fact that the latest version of Mond toxicity index (Tyler et al., [45]) has incorporated more factors such as health effect, conditions of release, plant layout, etc. which has made the index more comprehensive and sensitive to different setting of the process. Still, TDI is by and large more sensitive than the Mond toxicity index.
SUMMARY AND CONCLUSION
The indices for fire and explosion (FEDI) and toxicity (TDI) proposed here have some advantages over the con- ventional indexing techniques formulated by the Dow and the Mond chemical companies, and IFAL (instantaneous
u) 400
5 300 - 200
m -
0) D
Storage Hydroganator
k Sulfonator
J . %. ’
Pipe line 19
OFEDl mdarnage radii (Dow FEI)
FIGURE 1 1 Typical plot showing comparison of FEDI with damage radius estimated by Dow Fire and Ex- plosion Index.
168 Fall 1998 Process Safety Progress (Vol. 17, No. 3)

h
Storage Sulfonator Evaporator Hydrogenator Pipe lin8 12
3 T D I damage radii (Mond)
FIGURE 12 Typical plot showing comparison of TDI with damage radii estimated by Mond toxicity index.
fractional annual loss). HIRA is more systematic, predicts results with more reliability as it takes into accounts larger number of parameters, and leads to quantification. HIRA methodology is simple in implementation, modular in structure, and can be easily automated in software to re- duce expert time. The important features of HIRA are:
i) it takes into consideration impact of various process operations, and the associated parameters for hazard identification;
ii) it provides quantitative results of good reliability; iii) most of the penalties used in computing FED1 and
TDI (on which HIM is based) are derived from the well-tried and tested models of thermodynamics, transport phenomena, heat transfer, and fluid dy- namics (CCPS, [a; AFT, 131; Greenbook, [ I 71). A few penalties are quantified with the help of empirical models and hazard ranking procedures such as NFPA (NFPA, D5-381) and EHS (EHS, [141);
iv) it does not need case-to-case calibration as its magni- tude directly signifies the level of hazard;
v) it may be used for very rapid reconnaissance of risk.
ACKNOWLEDGMENT
Authors are thankful to All India Council of Technical Education (AICTE) for sponsoring Unit “Computer Aided Environmental Management (CAEM)” which made possible this study.
NOTATION
M = mass of chemical, kg or mass release rate (kg/s)
Hc = heat of combustion, J/mol Iw = latent heat of vaporization of water, kJ,/mol Pf = explosion pressure, kPa
pn = penalties for damage index estimation
SP = specific heat ratio V = volume of vessel, cu m
pnr = penalties for toxic damage index estimation
MW = molecular weight
PP = processing pressure, kPa VP = vapor pressure, kPa AP = atmospheric pressure, kPa
beta = l/(process temperature), K-’ Hrxn = heat of reaction, kJ/kg
K = constant (3.148) C = constant (2152)
estimation
index estimation damg.pot = damage potential
F1, F2, & F3 = core energy factors used in damage index
G = core toxic load factor used in toxic damage
NF = NFPA ranlung for flammability NF = NFPA ranking for reactivity NH = NFPA ranking for health hazard
LITERATURE CITED
1. AIChE, “Dow’s Fire and Explosion Index Classifica- tion Guide,” AIChE Technical Manual LC 80-29237, AIChE, New York (1994).
2. Anderson, P., “Compression of Methods of Hazards Identification at Plant Level,” J. Loss Prevention in Process Industries, 3(4), 339-345 (1990).
3. API, “Management of Process Hazards,” American Petroleum Institute Recommended Practice 750, 1st ed., Washington, DC (1990).
4. Austin, T. G., “Hazards of Commercial Chemical Op- eration and Chemical Reaction, Safety and Accident Prevention in Chemical Operation,” Fowcett and Wood, eds., 2nd ed., John Wiley, 61-86 (1993).
5. Baker, W. E., Cox, P. A, Westin, P. S., Kulesz, J. J., and Stxelow, R A, .Explosion Hazard and Evalua- tion, Elsevier, Amsterdam (1983).
6. CPPS, “Guidelines for Chemical Process Quantitative Risk Analysis,” AIChEJ., 32, New York (1989).
7. Christen, P., Bhnenblust, H., and Seitz, S., “A Method for Assessing Catastrophic Damage to the Population and Environment,” Process Safety Progress, 134) (1994).
8. Crousal, D. A, and J. F. Lower, Chemical Process Safety: Fundamental with Application, Prentice Hall, USA (1990).
9. Davies, P. A, “A Guide to the Evaluation of Con- densed Phase Explosion,” Journal of Hazardous Ma- teriak, 33, 1 (1993).
10. Dow, Dow’s Process Safety Guide, 1st ed., Midland (1964).
11. Dow, Dow ’s Fire and Explosion Index Hazard Classi- fication Guide, 6th ed., Midland (1987).
12. Daw, Dow’s Fire and Explosion Hazard Classqica- tion, Midland (1994a).
13. Dow, Dow’s Chemical and Exposure Index, AIChE, New York (1994b).
14. EHS, “Extremely Hazardous Substances,” Environ- mental Protection Act-40CFR Part 355, Washington, DC (1987).
15. Fowcett, H. H., Toxicity Versus Hazard, Safety and Accident Prwention in Chemical Operation, Fowcett and Wood, eds., John Wiley, 245-260 (1993).
16. Fowcett, €I. H., and W. S. Wood, Safety and Acci- dent m e n t i o n in Chemical operation, 3rd ed., John WiJey, New York (1993).
Process Safety Progress (Vol. 17, No. 3) Fall 7998 760

17. Greenbook, “Methods for Determining of Possible Damage to People and Objects Resulting from Release of Hazardous Materials,” Report CPR 16E, Voorburg, Warrington (1992).
18. Insurance Technical Bureau, ZFAL Factor Work book, London (1981).
19. Jafret., D. E., “Derivation of the British Explosives Safety Distances,” N m York Academy of Science, 152(1>, 18 (1968).
20. Kavfanian, H. F., J. K. and G. V. Brown, “Applica- tion of Hazard Evaluation Techniques to the Design of Potentially Hazardous Industrial Chemical Processes,” Report Div. of Training and Manpower Dev., Nat. Inst. Occup. Safety and Health, Cincinnati, Ohio (1992).
21. Khan, F. I., Alkthar, T., Fatima, M., and Parveen, S., “Manufacture of Sulfolane: A Technical Report,” Department of Chemical Engineering, Aligarh Muslim University, Aligarh, India (1992).
22. Khan, F. I., and S. A. Abbasi, “Risk Analysis of Epichlorohydrin Industry Using Computer Automated Tool MAXCRED,” J. of Loss Prevention in Process In- dustries, 10(3), 213-234 (1997a).
23. Khan, F. I., and S. A. Abbasi, “Modeling of Disper- sion of Heavy Gas Based on Modification in Plume Path Theory,” Atmos. Environ., in press (1998).
24. Khan, F. I., and S. A. Abbasi, “Application of the Re- cently Modified PPT on the Dispersion of Some Heavy Gases,” 10th Regional IUAPPA Conference, Istanbul, Sept. 23-26, Turkey (1997~).
25. Khan, F. I., and S. A. Abbasi, “Modeling and Simula- tion of ‘Heavy Gases’ Released by Petrochemical In- dustries,” 2nd Specialty Conference on Environmental Progress in the Petroleum and Petrochemical Indus- tries, Nov. 17-19, Bahrain (1997d).
26. Khan, F. I., and S. A. Abbasi, “Rapid Risk Analysis of a Typical Chemical Industry Using MAXCRED-11,” In- dianJr. of Chemical Technology, 4 , 167-179 (1997e).
27. Khan, F. I., and S. A. Abbasi, “Accident Hazard In- dex: A Multi-Attribute Method for Process Industry Hazard Rating,” Transaction of ICbE Part B, 75B, 218-224 (19970.
28. Kletz, T. A, “The Industrial Approach to Hazard Iden- tification and Analysis and Setting Criteria for Risk, in Major Hazard Installations: Planning and Assessment,” Dept. of Chemical Engg., Loughborough University (1984).
29. Kletz, T. A, “What Went Wrong? Case Histories,” H y drocurbon Processing, 64(12), 81 (1985).
30. Kletz, T. A., “Process Safety-An Engineering Achievement,” Proc. Instn. Mech. Engrs., 205, 11 (1991).
31. Less, F. P., Loss Pwvention in the Process Zndustries, Butterworths, London (1996).
32. Lewis, D. J., “The Mond Fire, Explosion and Toxicity Index-A Development of The Dow Index,” AIChE on Loss Prevention, New York (1979).
33. Lewis, D. J., “Hazards of Scaling Up,” Haz. Caqo Bull., 5(4), 24 (1984).
34. Marshall, J. G., “Hazardous Clouds and Flames Aris- ing from Continuous Release into the Atmosphere,” Chemical Process Hazards, VI, 99-104 (1977).
35. “PA, “Identification of the Hazardous of Material,” National Fire Protection Agency-Code 704, Quincy, Massachusetts (1989).
36. NFPA, “Industrial Fire Hazards Handbook,” National Fire Protection Association, New Jersey (1990).
37. NFPA, “Hazardous Chemical Data,” National Fire Pro- tection Association Code 325M, New Jersey (1991).
38. NFPA, “Hazardous Materials Response Handbook,” National Fire Protection Association, USA (1992).
39. OSHA, “Process Safety Management of Highly Haz- ardous Chemicals,” 29CFR1910.119, US Occupational Safety and Health Administration, Washington, DC (1990).
40. Raghavan, K. V., and G. Swaminathan, Hazard As- sessment and Disaster Mitigation in Petrochemical In- dustries, Oxford Publishing Company, Chennai (1996).
41. Schemer, N. E., “Improved Fire and Explosion Index Hazard Classification,” Process Safety Progress, 13(4), 214-218 (1994).
42. Shgh, J., and G. Munday, “IFAL: A Model for the Evaluation of Chemical Process Losses,” Design 79, Instn. Chem. Engrs., London (1979).
43. TCPA, “Toxic Catastrophic Prevention Act,” New Jer- sey Environmental Protection Agency, USA (1987).
44. Tyler, B. J., “Using the Mond Index to Measure Inher- ent Hazards,” Plant/Ope?-ation Progress, 4, 172 (1982).
45. Tyler, B. J., et al, “A Toxicity Hazard Index,” Haz- ards, WI, 351 (1994).
46. Whitehouse, H. B., “IFAL-A New Risk Analysis Tool,” The Assessment and Control of Major Hazards,” Instn. Chem. Engrs., Rugby, 309 (1985).
47. WHO, “Major Hazard Control: A Practical Manual,” In- ternational Labour Office, Geneva (1984).
170 Fall 1998 Process Safety Progress (Vol. 17, No. 3)