
Multivariate statistical approach to electron backscattered diffraction
12
Ultramicroscopy 108 (2008) 567–578 Multivariate statistical approach to electron backscattered diffraction Luke N. Brewer , Paul G. Kotula, Joseph R. Michael Sandia National Laboratories, P.O. Box 5800-MS 1411, Albuquerque, NM 87185-1411, USA Received 18 May 2007; received in revised form 2 October 2007; accepted 10 October 2007 Abstract This paper assesses the potential of multivariate statistical analysis (MSA) applied to electron backscattered diffraction (EBSD) data. Instead of directly indexing EBSD patterns on an individual basis, this multivariate approach reduces a large (thousands) set of individual EBSD patterns into a core set of statistically derived component EBSD patterns which can be subsequently indexed. The following hypotheses are considered in this paper: (1) experimental EBSD patterns from a microstructure can be analytically treated as linear combinations of spatially simple components, (2) MSA has an angular resolution on par with standard EBSD, (3) MSA can discriminate between similar and dissimilar phases, and (4) the MSA approach can improve the effective spatial resolution of automated EBSD. Published by Elsevier B.V. PACS: 61.14.Lj; 61.16.d; 02.50.Sk Keywords: Electron backscatter diffraction; Electron diffraction; Data processing/image processing 1. Introduction Electron backscattered diffraction (EBSD) is a widely used, commercially available technique for mapping the crystallography on the surface of an SEM sample [1]. The result of an automated EBSD measurement is a value for a best matched phase and its corresponding orientation (Euler angles) at each value of x and y in the map. This best matched phase is determined by comparing sets of interplanar angles measured from an indexed pattern with tables of interplanar angles for a set of proposed crystal- lographic phases. The proposed phase with the best average angular match to the measured pattern is selected as the correct solution. This indexing of patterns is often complicated by the poor quality of a given pattern, by the overlapping of patterns from adjacent crystals, or by failure to choose all of the correct phases a priori. These problems are exacerbated by the high rate of pattern collection and indexing necessary for efficient, automated measurements (415 patterns/s). The result of these complications can be a large percentage of pixels in the EBSD map with no information or incorrectly indexed information. Additionally, mapping and measurement of grain structures in very fine grain size materials suffer from the high probability of EBSD pattern overlap near ground boundaries. Overlapped EBSD patterns cannot be indexed by normal methods, and the more fine-grained the materials, the more often the probe will encounter grain boundaries. Gains in spatial resolution have been made by lowering the beam voltage and working with thin samples on transparent substrates [2–4], but indexing patterns from the surface of bulk materials with grain sizes less than 100 nm is still quite challenging. The application of multivariate statistical analysis (MSA) techniques to EBSD datasets may provide some relief to these problems. The application of MSA techniques to spectrum-image data has been successfully applied to many microanalytical techniques such as SEM–EDX [5], EDX, and EELS in the STEM [6], TOF–SIMS, and imaging X-ray photoelectron spectroscopy (XPS) [7,8]. The spectrum imaging approach involves the collection of entire spectrum of some sort (e.g. intensity versus wavelength, energy, or mass) at each pixel in a map. The rather large datasets generated by ARTICLE IN PRESS www.elsevier.com/locate/ultramic 0304-3991/$ - see front matter Published by Elsevier B.V. doi:10.1016/j.ultramic.2007.10.013 Corresponding author. Tel.: +1 505 284 2816; fax: +1 505 844 9781. E-mail address: [email protected] (L.N. Brewer).
Transcript of Multivariate statistical approach to electron backscattered diffraction

ARTICLE IN PRESS
0304-3991/$ - se
doi:10.1016/j.ul
�CorrespondiE-mail addre
Ultramicroscopy 108 (2008) 567–578
www.elsevier.com/locate/ultramic
Multivariate statistical approach to electron backscattered diffraction
Luke N. Brewer�, Paul G. Kotula, Joseph R. Michael
Sandia National Laboratories, P.O. Box 5800-MS 1411, Albuquerque, NM 87185-1411, USA
Received 18 May 2007; received in revised form 2 October 2007; accepted 10 October 2007
Abstract
This paper assesses the potential of multivariate statistical analysis (MSA) applied to electron backscattered diffraction (EBSD) data.
Instead of directly indexing EBSD patterns on an individual basis, this multivariate approach reduces a large (thousands) set of
individual EBSD patterns into a core set of statistically derived component EBSD patterns which can be subsequently indexed. The
following hypotheses are considered in this paper: (1) experimental EBSD patterns from a microstructure can be analytically treated
as linear combinations of spatially simple components, (2) MSA has an angular resolution on par with standard EBSD, (3) MSA
can discriminate between similar and dissimilar phases, and (4) the MSA approach can improve the effective spatial resolution of
automated EBSD.
Published by Elsevier B.V.
PACS: 61.14.Lj; 61.16.�d; 02.50.Sk
Keywords: Electron backscatter diffraction; Electron diffraction; Data processing/image processing
1. Introduction
Electron backscattered diffraction (EBSD) is a widelyused, commercially available technique for mapping thecrystallography on the surface of an SEM sample [1]. Theresult of an automated EBSD measurement is a value for abest matched phase and its corresponding orientation(Euler angles) at each value of x and y in the map. This bestmatched phase is determined by comparing sets ofinterplanar angles measured from an indexed pattern withtables of interplanar angles for a set of proposed crystal-lographic phases. The proposed phase with the bestaverage angular match to the measured pattern is selectedas the correct solution. This indexing of patterns is oftencomplicated by the poor quality of a given pattern, by theoverlapping of patterns from adjacent crystals, or byfailure to choose all of the correct phases a priori. Theseproblems are exacerbated by the high rate of patterncollection and indexing necessary for efficient, automatedmeasurements (415 patterns/s). The result of these
e front matter Published by Elsevier B.V.
tramic.2007.10.013
ng author. Tel.: +1505 284 2816; fax: +1 505 844 9781.
ss: [email protected] (L.N. Brewer).
complications can be a large percentage of pixels in theEBSD map with no information or incorrectly indexedinformation. Additionally, mapping and measurement ofgrain structures in very fine grain size materials suffer fromthe high probability of EBSD pattern overlap near groundboundaries. Overlapped EBSD patterns cannot be indexedby normal methods, and the more fine-grained thematerials, the more often the probe will encounter grainboundaries. Gains in spatial resolution have been made bylowering the beam voltage and working with thin sampleson transparent substrates [2–4], but indexing patterns fromthe surface of bulk materials with grain sizes less than100 nm is still quite challenging. The application ofmultivariate statistical analysis (MSA) techniques to EBSDdatasets may provide some relief to these problems.The application of MSA techniques to spectrum-image
data has been successfully applied to many microanalyticaltechniques such as SEM–EDX [5], EDX, and EELS in theSTEM [6], TOF–SIMS, and imaging X-ray photoelectronspectroscopy (XPS) [7,8]. The spectrum imaging approachinvolves the collection of entire spectrum of some sort(e.g. intensity versus wavelength, energy, or mass) at eachpixel in a map. The rather large datasets generated by

ARTICLE IN PRESSL.N. Brewer et al. / Ultramicroscopy 108 (2008) 567–578568
spectrum imaging (10MB up to several gigabytes) can berapidly and meaningfully analyzed through the use ofmultivariate techniques such as principle componentsanalysis (PCA), multivariate curve resolution, or otherleast squares-based techniques [5,9]. The result of thesecalculations is a relatively small set (o10) of componentspectra and corresponding images that explain the majorityof the non-noise variance in a given dataset. This paperexplores the potential benefits of applying a spectrumimaging-like approach to EBSD maps. An MSA approachto EBSD pattern maps would result in a small set ofcomponent EBSD patterns (component spectra for thetechniques above) that are spatially correlated to featuresin the x–y plane (component images for each componentEBSD pattern). Each component pattern in the solution setwould have a much greater aggregate signal-to-noise ratiothan any individual pattern in the dataset. The analystwould then have the opportunity to analyze this muchsmaller set of patterns after the measurement withoutcompromising either indexing accuracy or experimentalcollection speed. Additionally, this MSA approach may beable to solve the problem of indexing overlapped patternsin very fine-grained materials as overlapped patterns can beeasily described as linear mixtures of two distinct EBSDpatterns.
In this paper, we will examine the application andtailoring of MSA-spectrum imaging methods to EBSD
Fig. 1. Schematic of analysis flo
datasets. Four hypotheses will be considered to evaluatethis approach:
(1)
w fo
Experimental EBSD patterns from a microstructurecan be treated as linear combinations of spatiallysimple component EBSD patterns.
(2)
MSA has an angular resolution on par with standardEBSD.(3)
MSA can discriminate between crystallographicallysimilar phases.(4)
The MSA approach can improve the effective spatialresolution of automated EBSD.2. Multivariate analysis methods for EBSD patterns
The EBSD pattern maps were analyzed using anumerical analysis with several steps, schematically shownin Fig. 1. A data handling and analysis program waswritten using the MatLab programing environment toperform the tasks of automated reading of the .jpeg formatpatterns, pre-processing steps such as edge finding and/orHough transformation, and storing each processed patternas a one-dimensional vector/column into a data matrixsuitable for the MSA (MatLab 7.1, Mathworks Inc.). Themultivariate analysis was performed using Sandia NationalLaboratories’ Automated eXpert Spectral Imaging
r EBSD pattern maps.
ARTICLE IN PRESSL.N. Brewer et al. / Ultramicroscopy 108 (2008) 567–578 569
(AXSIA) software code using the statistical approachesdescribed in previous work on spectrum imaging combinedwith MSA [5,8]. The analyses were run in a spatialsimplicity mode which biases the calculation to solutionswhich force high spatial contrast in the components, andtherefore, each point in the map to be either onecomponent-EBSD pattern or another [9]. This assumptionis reasonable given the physical nature of the EBSDexperiment in which each probed volume of crystal shouldproduce only one, distinct EBSD pattern.
Assuming that the data follow a linear model, we wantto factor the raw or transformed EBSD data matrix D intotwo contributions, one containing the EBSD-patterncharacteristics (S) of the species comprising the sample(analogous to the spectral shapes in chemical microanalysisdata) and one containing their spatial distributions (C)(analogous to the component concentrations in chemicalmicroanalysis data). The model of the data is thenrepresented as the matrix product D ¼ CST, where thesuperscript T denotes a matrix transpose. Principalcomponent analysis can effect this factorization. Theresulting components are forced to be orthogonal, how-ever, so they are abstract and not easily interpreted in thecase of highly overlapping EBSD patterns. In our newapproach, PCA is performed on EBSD data such that thespatial components C are orthonormal. The spatialcomponents are then rotated to maximize their mutualsimplicity using the VARIMAX procedure thus producinga solution with high spatial contrast [10]. Applying theinverse rotation to the EBSD components, S, has the effectof relaxing their orthogonality yielding physically realisticEBSD components. Since VARIMAX is an orthogonaltransformation, its solution fits the data equally as well asthe original PCA model.
The calculations were performed on a DELL Precision650 desktop with 2GB of RAM operating a 3.2GHz. Thepre-processing calculations required several minutes perdataset, while the statistical analysis calculations were allcompleted in less than 1min. The resulting statisticalcomponents and maps were read back into MatLab,inverse Radon transformed, if necessary, and then plottedas EBSD patterns. These patterns could then be opened in
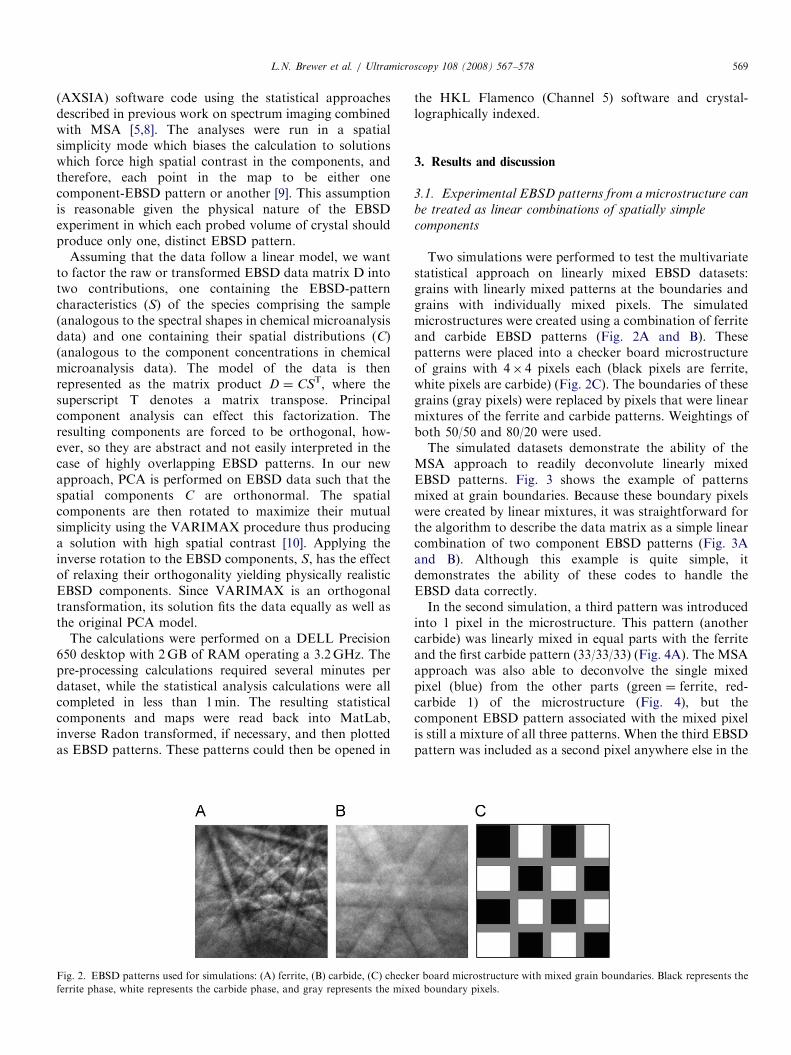
Fig. 2. EBSD patterns used for simulations: (A) ferrite, (B) carbide, (C) checke
ferrite phase, white represents the carbide phase, and gray represents the mixe
the HKL Flamenco (Channel 5) software and crystal-lographically indexed.
3. Results and discussion
3.1. Experimental EBSD patterns from a microstructure can
be treated as linear combinations of spatially simple
components
Two simulations were performed to test the multivariatestatistical approach on linearly mixed EBSD datasets:grains with linearly mixed patterns at the boundaries andgrains with individually mixed pixels. The simulatedmicrostructures were created using a combination of ferriteand carbide EBSD patterns (Fig. 2A and B). Thesepatterns were placed into a checker board microstructureof grains with 4� 4 pixels each (black pixels are ferrite,white pixels are carbide) (Fig. 2C). The boundaries of thesegrains (gray pixels) were replaced by pixels that were linearmixtures of the ferrite and carbide patterns. Weightings ofboth 50/50 and 80/20 were used.The simulated datasets demonstrate the ability of the
MSA approach to readily deconvolute linearly mixedEBSD patterns. Fig. 3 shows the example of patternsmixed at grain boundaries. Because these boundary pixelswere created by linear mixtures, it was straightforward forthe algorithm to describe the data matrix as a simple linearcombination of two component EBSD patterns (Fig. 3Aand B). Although this example is quite simple, itdemonstrates the ability of these codes to handle theEBSD data correctly.In the second simulation, a third pattern was introduced
into 1 pixel in the microstructure. This pattern (anothercarbide) was linearly mixed in equal parts with the ferriteand the first carbide pattern (33/33/33) (Fig. 4A). The MSAapproach was also able to deconvolve the single mixedpixel (blue) from the other parts (green ¼ ferrite, red-carbide 1) of the microstructure (Fig. 4), but thecomponent EBSD pattern associated with the mixed pixelis still a mixture of all three patterns. When the third EBSDpattern was included as a second pixel anywhere else in the
r board microstructure with mixed grain boundaries. Black represents the
d boundary pixels.

ARTICLE IN PRESS
Fig. 3. Simulation of mixed grain boundaries microstructure: (A) EBSD component 1 (carbide), pattern and corresponding map; (B) EBSD component 2
(ferrite), pattern and corresponding map.
L.N. Brewer et al. / Ultramicroscopy 108 (2008) 567–578570
microstructure, then the algorithm was able to separate allthree components patterns correctly.
To test the multivariate statistical approach on experi-mental EBSD datasets, data were collected from analuminum specimen prepared by standard metallographictechniques (diamond polishing down to 1 mm finish). Themaps were collected using a FEI Dual Beam FIB (DB235)outfitted with a Nordlys CCD camera and the HKLChannel 5 collection and analysis software. The beamenergy was selected to be 20 keV and patterns werecollected with a spacing of 0.5 mm. Maps were taken with10� 10 and 20� 20 grids. Each pattern was stored in a.jpeg format, resulting in a stored EBSP with 168� 128pixels.
The results of the MSA on the aluminum dataset (Fig. 5)demonstrate the ability of this approach to treat the data aslinear combinations, but they also highlight the non-linearnature of real datasets and their complications. Thecomposite image from the MSA on aluminum was ableto detect and differentiate the same grains as the traditionalEBSD indexing process (Fig. 5). Only five grains are in thisfield of view, as evidenced by the Euler map from the HKLsoftware. However, 19 statistically relevant componentswere included in the model using MSA (Fig. 5C). Upon
inspection, one can see that there are five componentscorresponding to unique EBSD patterns, 10 correspondingto shifts in detector background, and four corresponding toslight shifts in EBSD patterns. The variations in color huein Fig. 5B are a direct result of the linear factor analysisrepresentation of the data. Each spatial pixel is comprisedthe sum of differently weighted EBSD components. Whennoise components are removed from the overall map, thehue of the color changes because that spatial pixel is notrepresented solely by one component EBSD pattern.These background and pattern shifts result in separate
components because they cannot be explained in terms of alinear mixture of the other EBSD pattern components. Inthe case of a shifting background, it requires at least twocomponents to describe the EBSD pattern itself and theseparate background change. The best way to reduce thiseffect is to use the flattest, smoothest sample possible.These sorts of ‘‘artifact’’ components are regularly ob-served in EDX MVSA from changes in soft X-rayabsorption, usually from surface topography [5]. Thecomponents created by slight shifts in the EBSD patternsthemselves are not necessarily artifacts. A deformed crystalwhich has intra-grain rotation will be described by severalcomponents which are closely related. Future work will

ARTICLE IN PRESS
Fig. 4. Simulation of microstructure with single mixed pixel. Component EBSD patterns: (A) starting EBSD patterns, results from MSA of simulated
microstructure; (B) composite map; (C) component EBSP patterns.
L.N. Brewer et al. / Ultramicroscopy 108 (2008) 567–578 571
examine a post-analysis routine that allows the user tocombine patterns that describe orientations within achosen tolerance.
Application of edge filters and Hough transformsimproved the EBSD component selection in differentways. In these cases, the MSA was applied to the Hough

ARTICLE IN PRESS
Fig. 5. Spectrum images from polycrystalline Al sample: (A) Euler orientation map from HKL Channel 5; (B) EBSD component map using the five
unique, actual EBSD pattern contributions to the signal; (C) all EBSD components generated by multivariate analysis.
L.N. Brewer et al. / Ultramicroscopy 108 (2008) 567–578572
transform of the collected EBSD patterns, not to the rawpatterns themselves. Application of an edge finding algo-rithm, such as the Prewitt method (MatLab 7.1, MathworksInc.), followed by a Hough transform resulted in substan-tially fewer EBSD components in the model (10 versus 18)and the removal of the components describing the localvariation in detector background signal (Fig. 6). However,the edge finding filter removed much of the detail of theoriginal patterns, resulting in component patterns that haveline position information but no dynamical diffractioninformation (Fig. 6B). In this analysis, five of the patternscorrespond to unique EBSD patterns, while five othercomponent patterns represent shifts to these core patterns.
When MSA was applied to Hough transformed patternswithout an edge filter, more components were placed intothe model (16) but the quality of the individual componentEBSD patterns was much higher (Fig. 7). Most of the
component patterns from this approach are a convolutionof the unique EBSD patterns and the detector background(Fig. 7B). Two of the components correspond to a slightshift in pattern for a given grain. Because of the largernumber of component patterns in the model, the compositeimage (Fig. 7A) is less clear than in Figs. 5 and 6. The lackof clarity stems from need to describe each grain bymultiple components, violating the assumption of spatialsimplicity.It should be pointed out that here the use of the term
‘‘grain’’ corresponds to a collection of statistically similarand spatially co-located EBSD patterns. The MSA has noway of indexing patterns and cannot separate regionsbased on knowledge of crystallography. However, the datain Figs. 5–7 show that the ‘‘grains’’ identified by MSAare the same as those identified by the commercialEBSD software.

ARTICLE IN PRESS
Fig. 6. Analysis of Al EBSD patterns using edge filter combined with
Hough transform: (A) component map, (B) component EBSD patterns
(for clarity, only 4 of 10 shown).
Fig. 7. Analysis of Al EBSD patterns using Hough transform but with no
edge filter: (A) spectrum image, (B) component EBSD patterns (for clarity,
only 4 of 16 shown).
L.N. Brewer et al. / Ultramicroscopy 108 (2008) 567–578 573
The data presented here support the hypothesis thatEBSD patterns can be treated linearly, but the assumptionof spatial simplicity can be violated by fairly commonexperimental conditions. As discussed above, locallyvarying background will create variation in the data thatcannot be explained linearly without additional compo-nents. If this variation occurs within a given grain, then theassumption of spatial simplicity breaks down and theidentification of a grain is more difficult. This difficulty canbe overcome by using samples with better surfacepreparations and by pre-processing the data in a mannerwhich removes the background variation (edge filter plusHough transform). Of course, the latter approach doesremove information from the final component EBSDpatterns. Grains in which there is measurable misorienta-tion will also produce quite a few components. To the
analyst, misorientations of o101 might be considered to bewithin the ‘‘same’’ grain, but to the MSA algorithms theEBSD patterns representing a 11 misorientation might bedifferent enough to require separate components. Futurework will look into the post-analysis binning of ‘‘similar’’EBSD patterns to help automatically reduce the number ofcomponents.
3.2. MSA has an angular resolution on par with standard
EBSD
To explore the angular resolution of MSA on EBSDdata, we used Si single crystal patterns systematicallyshifted from each other. A Si single crystal pattern wascollected at four different binnings: 8� 8, 4� 4, 2� 2, andno binning (1� 1). The CCD camera had a pixel density of1344� 1024 with physical dimensions of approximately38mm� 28mm. The pattern was collected at 20 keV with aphysical detector distance of 11.9mm. To test the MSAangular resolution, each Si pattern was shifted 1 pixel along

ARTICLE IN PRESS
Table 1
Correlation between EBSD pattern binning and angular shift
Binning level Angular shift for single pixel shift in
pattern (1)
8� 8 1.0
4� 4 0.5
2� 2 0.25
None 0.125
Fig. 8. Single-pixel shifted EBSD patterns demonstrate the angular resolution of the MSA approach: (A) Si EBSD pattern (20 keV, 4� 4 binning), same
pattern shifted by 1-pixel in x-direction, difference pattern (simple pixel-by-pixel subtraction); (B) simulated microstructure (10� 10 pixels total, 5� 10 for
red ¼ original pattern, 5� 10 for green ¼ shifted pattern); (C) eigenvalue plot showing the two components above noise.
L.N. Brewer et al. / Ultramicroscopy 108 (2008) 567–578574
the x-axis of the EBSD pattern (Fig. 8A). The original andshifted patterns were replicated into a 10� 10 matrixcomprised of 50 EBSD patterns on each side of the‘‘boundary’’ (Fig. 8B). Poisson noise based on the grayscale value of each pixel in each pattern was added to thissimulated dataset. MSA was performed on this simulateddataset using the AXSIA platform described above.
The MSA was able to identify the two, 1-pixel-shiftedEBSD patterns in both the 8� 8 and 4� 4 binning datasets(Fig. 8C). This determination is based upon the number ofeigenvalues calculated above the linear threshold (semi-log)as is commonly done in multivariate analysis [11]. We wereunable to successfully run the 2� 2 and 1� 1 datasetsbecause of the memory limitations of our currentalgorithms, not the method itself. The reader should keepin mind that an unbinned EBSD pattern has 1.4 millionchannels. A standard EDX spectrum has 2048 channelsand a standard TOF–SIMS spectrum can have upwards of100,000 channels. Taking the experimental details above, a
1-pixel shift for the binned patterns corresponds to theangular shifts shown in Table 1.The angular shifts resolved by the MSA of EBSD
patterns are equivalent to angular resolution found oncommon EBSD platforms. Typical values for misorienta-tion resolution using EBSD are on the order of 0.51 [12].Using transform methods such as fast Fourier transforms[12,13] and kuwahara filters, angular resolutions down to0.011 can be achieved. Some adjustment in the codes usedto analyze the present data will allow the angularresolution of MSA on EBSD patterns to go to 0.1251. Itis reasonable to expect that the resolution will drop belowthis value as sub-channel spectral shifts have beendifferentiated using MSA for other types of spectral datasuch as EDX and XPS [14].
3.3. MSA can discriminate between crystallographically
similar phases
To investigate the ability of MSA on EBSD data todiscriminate between crystallographic phases, measure-ments were taken from a metallographic section of aferritic meteorite and from a focused ion beam (FIB)section of a NiO/NiAl2O4 directionally solidified eutecticoxide. The meteorite specimen was prepared from a samplewhich consisted nominally of FCC (austenite) and BCC(ferrite) phases. The section was prepared with standardmetallographic techniques. The NiO/NiAl2O4 eutecticsample was grown at the Universite de Paris Sud asdescribed elsewhere [15]. The sample was prepared by

ARTICLE IN PRESSL.N. Brewer et al. / Ultramicroscopy 108 (2008) 567–578 575
cutting transverse to the growth direction, by polishingwith diamond films down to 1 mm finish, and then bypreparing a thin (�500 nm thick) lift-out section using theFIB. The sample was placed onto a copper-mesh grid andthen briefly milled using an Ar ion beam at 2 keV. TheEBSD patterns for these samples were collected on a ZeissSupra 55VP FEG–SEM with a beam energy of 20 keV andstep sizes of 10 mm (meteorite) and 100 nm (NiO/NiAl2O4),
Fig. 9. Spectrum image data from FCC–BCC meteorite microstructure: (A) ph
MSA of the same dataset, (C) component EBSD pattern, (D) best individual
both with a grid of 25� 25 points. The same format andcompression were used as with the Al data. The MSAcalculations were performed on the Hough transformeddata without the use of an edge filter.The application of MSA to patterns collected from a
duplex FCC/BCC meteorite microstructure demonstratesthe ability of this approach to discriminate betweenmultiple phases. In this case, the FCC and BCC regions
ase and Euler maps from HKL Channel 5 software, (B) components from
EBSD pattern from unknown region.
ARTICLE IN PRESSL.N. Brewer et al. / Ultramicroscopy 108 (2008) 567–578576
in the microstructure were correctly mapped using both theHKL Channel 5 software and the MSA approach (Fig. 9).However, the MSA shows that the BCC phase is actuallybest described by two EBSD components. More impor-tantly, an unknown phase was included in the field of view.This phase could have been indexed by the Channel 5software, but only if the appropriate match units wereincluded before the measurement was taken. The MSAapproach was able to identify this area of the micro-structure as a separate entity with a corresponding, highquality EBSD pattern that might be indexed afterwards bythe analyst. The high level of aggregate signal from theMSA approach is apparent (Fig. 9C) when compared tothe best individual pattern from the area (Fig. 9D).
One of the advantages of the spectrum imagingapproach in general and for EBSD in particular is theability to analyze the aggregate signal collected from amap. The signal level from an individual pixel need not beenormous because of the highly redundant nature of mostmapping data. Approximately 60 pixels were collected onthe unidentified region in Fig. 9. The quality of most ofthese patterns was not suitable for indexing even if asuitable match unit was available. However, the quality ofthe component EBSD pattern (Fig. 9C) is certainly highenough to be indexed given the appropriate match unit.Combining this approach with a compositional signal such
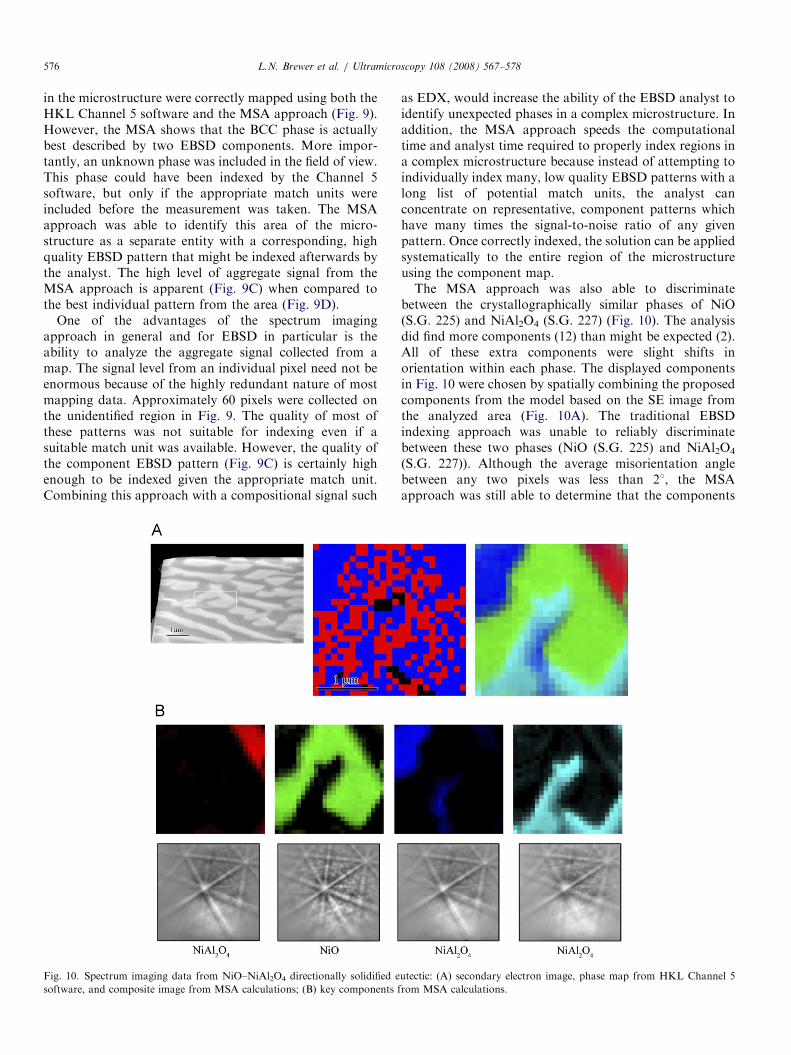
Fig. 10. Spectrum imaging data from NiO–NiAl2O4 directionally solidified e
software, and composite image from MSA calculations; (B) key components f
as EDX, would increase the ability of the EBSD analyst toidentify unexpected phases in a complex microstructure. Inaddition, the MSA approach speeds the computationaltime and analyst time required to properly index regions ina complex microstructure because instead of attempting toindividually index many, low quality EBSD patterns with along list of potential match units, the analyst canconcentrate on representative, component patterns whichhave many times the signal-to-noise ratio of any givenpattern. Once correctly indexed, the solution can be appliedsystematically to the entire region of the microstructureusing the component map.The MSA approach was also able to discriminate
between the crystallographically similar phases of NiO(S.G. 225) and NiAl2O4 (S.G. 227) (Fig. 10). The analysisdid find more components (12) than might be expected (2).All of these extra components were slight shifts inorientation within each phase. The displayed componentsin Fig. 10 were chosen by spatially combining the proposedcomponents from the model based on the SE image fromthe analyzed area (Fig. 10A). The traditional EBSDindexing approach was unable to reliably discriminatebetween these two phases (NiO (S.G. 225) and NiAl2O4
(S.G. 227)). Although the average misorientation anglebetween any two pixels was less than 21, the MSAapproach was still able to determine that the components
utectic: (A) secondary electron image, phase map from HKL Channel 5
rom MSA calculations.
ARTICLE IN PRESSL.N. Brewer et al. / Ultramicroscopy 108 (2008) 567–578 577
were different on the basis of pattern fine structure. TheNiO component EBSD pattern possesses more finestructure than the three NiAl2O4 patterns identified bythe analysis.
The oxide eutectic example indicates that EBSD datamight be able to distinguish between phases of the same orsimilar space groups. Standard, automated indexingroutines have difficulty distinguishing within a given spacegroup or between similar space groups because sets ofinterplanar angles are used to index the patterns. Without
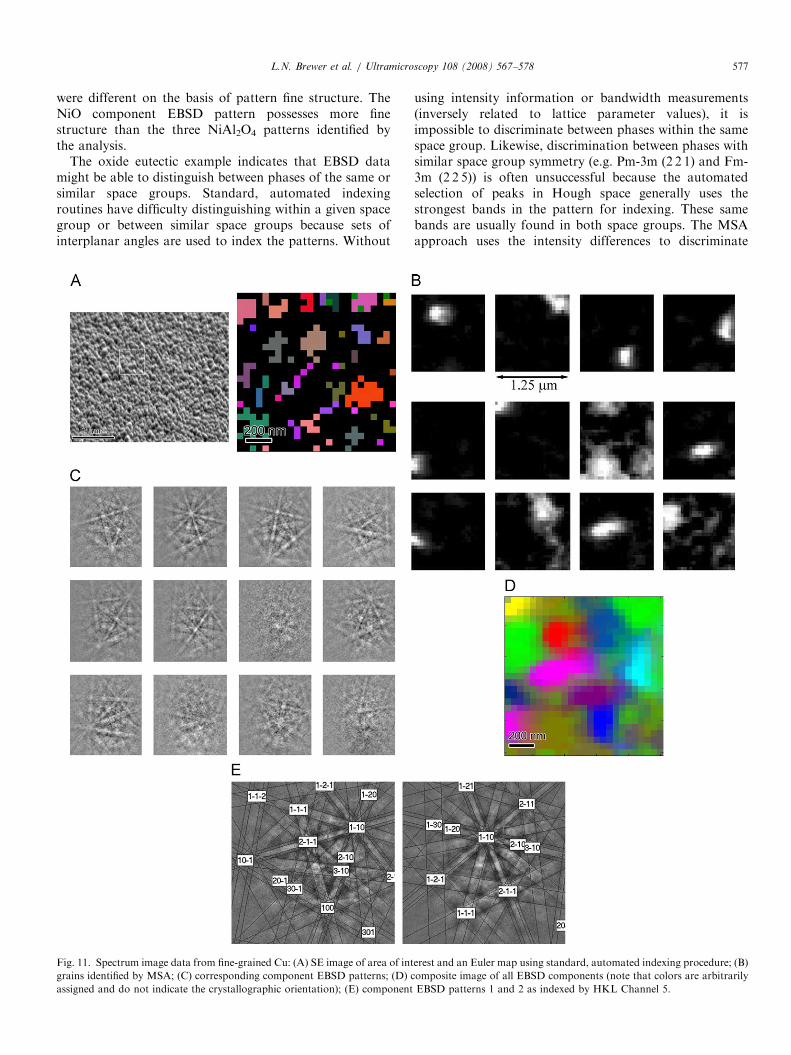
Fig. 11. Spectrum image data from fine-grained Cu: (A) SE image of area of int
grains identified by MSA; (C) corresponding component EBSD patterns; (D) c
assigned and do not indicate the crystallographic orientation); (E) component
using intensity information or bandwidth measurements(inversely related to lattice parameter values), it isimpossible to discriminate between phases within the samespace group. Likewise, discrimination between phases withsimilar space group symmetry (e.g. Pm-3m (2 2 1) and Fm-3m (2 2 5)) is often unsuccessful because the automatedselection of peaks in Hough space generally uses thestrongest bands in the pattern for indexing. These samebands are usually found in both space groups. The MSAapproach uses the intensity differences to discriminate
erest and an Euler map using standard, automated indexing procedure; (B)
omposite image of all EBSD components (note that colors are arbitrarily
EBSD patterns 1 and 2 as indexed by HKL Channel 5.

ARTICLE IN PRESSL.N. Brewer et al. / Ultramicroscopy 108 (2008) 567–578578
between EBSD patterns. The analysis code has, in fact, noknowledge of diffraction and is only making discriminationdecisions based upon statistical differences in the signal ofthe pattern. Higher order lines, extra bands, and differ-ences in bandwidth will all constitute a significantdifference between component EBSD patterns.
3.4. The MSA approach can improve the effective spatial
resolution of automated EBSD
To investigate the ability of the MSA approach toanalyze data from fine grain samples, data were taken froman evaporated film of copper on a silicon substrate. EBSDdata were collected from this specimen without anypolishing or surface treatment.
The EBSD patterns were collected on 25� 25 grid ofpoints with a 50 nm step size. The experimental conditionswere the same as those described in Section 3.
The MSA approach applied to the fine-grained Cudataset allowed the identification and measurement ofthe individual grains (Fig. 11). At this grain size(�400–500 nm) and under these experimental conditionswith a fairly rough surface, the automated indexing routinewas unable to reliably map the grains in this microstructure(27% successful indexing rate; see Euler map Fig. 11A).This low success rate was primarily due to the highly mixednature of the EBSD patterns. Fig. 11B and C show theability of the MSA to identify separate regions or grainsthat have distinct EBSD patterns. Two or three of thecomponent patterns did not have clear enough EBSDpatterns to index, but the analysis still identified these areasas distinct from their surroundings. Fig. 11D shows thecolor composite map of all of the EBSD componentsidentified in Fig. 11B and C. As discussed above for Figs. 5and 7, the intensity in individual pixels can be described asa linear combination of several EBSD components,particularly at ‘‘grain boundaries’’. As a result, the colormap in Fig. 11D is not as clear as the individual componentmaps because of the spatial overlap of differently coloredcomponents. Fig. 11E shows the successful indexing of thestatistically derived patterns using the automated indexingroutines in HKL Channel 5.
The MSA approach shows particular promise forenhancing the mapping of orientation and size of smallgrains. Orientation mapping of fine grain size materials isan active area of research because of the technologicalimportance of nano-structured materials and the difficultyin successfully applying EBSD to bulk materials with grainsizes less than 500 nm [16]. This problem is particularly wellposed for the MSA–EBSD approach because the majorsource of difficulty is the inability to index EBSD patternswith mixed signals from two adjacent grains. As thesimulations (Fig. 3) and the Cu data (Fig. 11) havedemonstrated, the MSA approach is well suited todeconvolving linearly mixed patterns. In fact, the applica-tion of MSA to this dataset was less complicated than forthe larger grained aluminum dataset because of the lack of
internal grain misorientation and local background varia-tion in the fine-grained dataset. Future work will repeatthese measurements on a more controlled ultra-fine-grained microstructure compared directly with TEMmeasurements of the grain structure.
4. Conclusions
This paper has explored the potential for application ofmultivariate statistical analysis techniques to EBSDdatasets. It has been demonstrated that this approach cansuccessfully produce a statistical model of a microstructurethat possess interpretable component EBSD patterns thatcorrespond to a region of the microstructure. Thesepatterns are higher in signal-to-noise ratio than any givensingle pattern, a significant advantage when mappingdifficult to index materials with weak patterns. In addition,this approach has shown promise for distinguishingbetween phases with similar crystal structures and forsuccessfully mapping fine-grained materials. Future workwill need to address the automatic combination of thesurplus EBSD patterns incorporated into the statisticalmodel due to the high sensitivity of the calculations.
Acknowledgments
The authors thank for help and helpful discussions fromBonnie McKenzie and Mike Keenan at Sandia.Sandia is a multiprogram laboratory operated by Sandia
Corporation, a Lockheed Martin Company, for the UnitedStated Department of Energy (DOE) under contract DE-AC0494AL85000.
References
[1] A.J. Schwartz, et al., Electron Backscatter Diffraction in Materials
Science, Kluwer Academic, New York, 2000.
[2] T.C. Isabell, et al., Ultramicroscopy 67 (1/4) (1997) 59.
[3] J.A. Small, et al., J. Microsc. 206 (2002) 170.
[4] V.G.M. Sivel, et al., J. Microsc., Oxford 218 (2005) 115.
[5] P.G. Kotula, et al., Microsc. Microanal. 9 (1) (2003) 1.
[6] P.G. Kotula, et al., Geochim. Cosmochim. Acta 69 (10) (2005) A588.
[7] D.E. Peebles, et al., J. Vac. Sci. Technol. A 2 (4) (2004) 1579.
[8] M.R. Keenan, et al., Surface Interface Anal. 36 (3) (2004) 203.
[9] M.R. Keenan, et al., Multivariate statistical analysis of EELS-
spectral images, in: Microscopy and Microanalysis, Savannah, GA,
2004.
[10] E.R. Malinowski, Factor Analysis in Chemistry, second ed., Wiley,
New York, 1991.
[11] N. Bonnet, et al., Ultramicroscopy 77 (1999) 97.
[12] A.J. Wilkinson, Scripta Mater. 44 (2001) 2379.
[13] A.J. Wilkinson, et al., Ultramicroscopy 106 (2006) 307.
[14] P.G. Kotula, Private communication, 2007.
[15] M. Fragneau, Study of the Interfacial Structure and Its Influence on
the Properties of Composite Materials (Oriented Eutectics) Based
upon Nickel Oxide, Pierre and Marie Curie University, Paris, France,
1983, p. 81.
[16] D.P. Field, Improving the spatial resolution of EBSD, in: Microscopy
and Microanalysis, Cambridge University Press, Honolulu, HI, 2005.