A numerical study of detonation diffraction
30
J. Fluid Mech. (2005), vol. 529, pp. 117–146. c 2005 Cambridge University Press doi:10.1017/S0022112005003319 Printed in the United Kingdom 117 A numerical study of detonation diffraction By MARCO ARIENTI 1 AND J. E. SHEPHERD 2 1 United Technologies Research Center, East Hartford, CT 06108, USA 2 Graduate Aeronautical Laboratories, California Institute of Technology, Pasadena, CA 91125, USA (Received 10 March 2003 and in revised form 15 October 2003) An investigation of detonation diffraction through an abrupt area change has been carried out via a set of two-dimensional numerical simulations parameterized by the activation energy of the reactant. Our analysis is specialized to a reactive mixture with a perfect gas equation of state and a single-step reaction in the Arrhenius form. Lagrangian particles are injected into the flow as a diagnostic tool for identifying the dominant terms in the equation that describes the temperature rate of change of a fluid element, expressed in the shock-based reference system. When simplified, this equation provides insight into the competition between the energy release rate and the expansion rate behind the diffracting front. The mechanism of spontaneous generation of transverse waves along the diffracting front is carefully analysed and related to the sensitivity of the reaction rate to temperature. We study in detail three highly resolved cases of detonation diffraction that illustrate different types of behaviour, super-, sub- and near-critical diffraction. 1. Introduction Detonations are supersonic combustion waves with a strong lead shock front. The shock wave ignites the reactive material, and the exothermic stage of the reactions creates volume expansion that pushes the shock into fresh reactants. Detonations diffracting from a planar to a cylindrical (or spherical) geometry through an abrupt area change experience expansion waves that propagate into the partially burnt reactants behind the wavefront. One of the key features of this process is the propagation of the signal generated by the expansion waves emanating at the corner. As shown in figure 1(a), the disturbance is propagating at the local acoustic speed c while being convected downstream at a speed u. The undisturbed front moves at a constant speed D. The angle between the disturbance trajectory and the normal of the undiffracted shock, α, can be found by carrying out a Huygen’s construction for the wavefront of a sound wave. As discussed in Skews (1967), the wavefront is a circle, of radius ct , whose origin is at point O translated downstream from the corner a distance ut . From the geometric construction, we have tan α = v D = c 2 − (D − u) 2 D . (1.1) In the non-reactive case, the values u and c are evaluated from the post-shock state behind the undisturbed shock. In the reactive case, a finite transverse signal speed is observed in corner-turning experiments with Chapman–Jouguet (CJ) detonations (Schultz 2000). This indicates that acoustic disturbances must propagate in the
-
Upload
independent -
Category
Documents
-
view
0 -
download
0
Transcript of A numerical study of detonation diffraction

J. Fluid Mech. (2005), vol. 529, pp. 117–146. c© 2005 Cambridge University Press
doi:10.1017/S0022112005003319 Printed in the United Kingdom
117
A numerical study of detonation diffraction
By MARCO ARIENTI1 AND J. E. SHEPHERD2
1United Technologies Research Center, East Hartford, CT 06108, USA2Graduate Aeronautical Laboratories, California Institute of Technology, Pasadena,
CA 91125, USA
(Received 10 March 2003 and in revised form 15 October 2003)
An investigation of detonation diffraction through an abrupt area change has beencarried out via a set of two-dimensional numerical simulations parameterized by theactivation energy of the reactant. Our analysis is specialized to a reactive mixturewith a perfect gas equation of state and a single-step reaction in the Arrhenius form.Lagrangian particles are injected into the flow as a diagnostic tool for identifyingthe dominant terms in the equation that describes the temperature rate of changeof a fluid element, expressed in the shock-based reference system. When simplified,this equation provides insight into the competition between the energy release rateand the expansion rate behind the diffracting front. The mechanism of spontaneousgeneration of transverse waves along the diffracting front is carefully analysed andrelated to the sensitivity of the reaction rate to temperature. We study in detailthree highly resolved cases of detonation diffraction that illustrate different types ofbehaviour, super-, sub- and near-critical diffraction.
1. IntroductionDetonations are supersonic combustion waves with a strong lead shock front. The
shock wave ignites the reactive material, and the exothermic stage of the reactionscreates volume expansion that pushes the shock into fresh reactants. Detonationsdiffracting from a planar to a cylindrical (or spherical) geometry through an abruptarea change experience expansion waves that propagate into the partially burntreactants behind the wavefront.
One of the key features of this process is the propagation of the signal generated bythe expansion waves emanating at the corner. As shown in figure 1(a), the disturbanceis propagating at the local acoustic speed c while being convected downstream ata speed u. The undisturbed front moves at a constant speed D. The angle betweenthe disturbance trajectory and the normal of the undiffracted shock, α, can be foundby carrying out a Huygen’s construction for the wavefront of a sound wave. Asdiscussed in Skews (1967), the wavefront is a circle, of radius c t , whose origin is atpoint O translated downstream from the corner a distance u t . From the geometricconstruction, we have
tan α =v
D=
√c2 − (D − u)2
D. (1.1)
In the non-reactive case, the values u and c are evaluated from the post-shock statebehind the undisturbed shock. In the reactive case, a finite transverse signal speed isobserved in corner-turning experiments with Chapman–Jouguet (CJ) detonations(Schultz 2000). This indicates that acoustic disturbances must propagate in the

118 M. Arienti and J. E. Shepherd
u ∆t
c ∆t
Head ofcornersignal α
D ∆t
Undisturbed shock
Interactionpoint
v ∆t
Diffractedshock
D – u
vc
O
Z
α (
deg.
)
0 0.5 1.0
5
10
15
20
25
αmax = 22.6°αvN = 18.7°
(a) (b)
Figure 1. (a) Schematic of a diffracting shock (Skews’ construction) in non-reactive gas.(b) Disturbance angle plotted vs. progress variable Z for a ZND-CJ detonation. Z = 0corresponds to post-shock conditions, Z = 1 corresponds to the end of the reaction zone.
reaction zone, between the sonic plane (where D − u = c by definition) and thelead shock. Disturbance angles α were measured by Schultz (2000) from a sequenceof schlieren images in sub-critical detonation diffraction of hydrocarbon mixturesand hydrogen mixtures. When these results were compared with values computedfrom the corresponding Zel’dovich–von Neumann–Doering (ZND) profiles (see, forinstance, figure 1b), the angles corresponding to the maximum disturbance velocitywere found to be in good agreement with the experimental measurements.
The sensitivity of chemical reactions to post-shock conditions is the second keyfeature in detonation diffraction. For a single-step reaction model of order nr , therate of reaction of a fluid particle can be described by
DZ
Dt= k ρnr −1 (1 − Z) exp(−θ TvN/ T ), (1.2)
where Z monitors the reaction progress (from 0 to 1), ρ is the density, TvN is thevon Neumann temperature in the ZND profile, and k is a proportionality parametersetting the length scale of energy release. The sensitivity of the chemical kinetics isexpressed in the nonlinear term by the reduced activation energy θ , the key parameterin the work presented here.
Since the shock is weakened by the interaction with expansion waves from thecorner, the post-shock temperature can be significantly smaller along the diffractingfront than in the reference ZND profile, and the reaction process can be quenched orsubstantially delayed. If the reaction does not take place or else happens far behind theshock front, the reduced amount of energy released into the flow results in a furtherdecay of the detonation speed. As the shock strength diminishes, incoming reactantsare less compressed, and this, in turn, increases the ignition delay. Depending on thesensitivity of the reactions to temperature and density changes and on the strength ofthe rarefaction, the detonation will eventually either be re-established (super-criticaldiffraction) or cease to propagate (sub-critical diffraction). The conditions that controlthe transition from super-critical to sub-critical diffraction identify the near-criticalstate. With all other conditions held constant, the detonation fails for a tube diametersmaller than a critical value (Zel’dovich, Kogarko & Simonov 1956).

Numerical study of detonation diffraction 119
yw
xa Da
Dw
H
Figure 2. Detonation diffraction around a corner. – . –, the plane of symmetry of the channel;H , the channel half-width. Also shown are the distances measured along the plane of symmetry,xa , and along the corner wall, yw .
There is an empirical correlation between critical diameter and detonation cellwidth, λ (Mitrofanov & Soloukhin 1965; Edwards, Thomas & Nettleton 1979;Knystautas, Lee & Guirao 1982; Moen et al. 1982; Shepherd et al. 1986; Desbordes1988). The survey by Guirao, Knystautas & Lee (1987) for hydrogen–air mixturesindicates that detonation is re-established if the tube diameter is greater than 13 λ.For rectangular orifices with large aspect ratio, the detonation is re-established if thesmallest side of the orifice is larger than 3 λ. A recent review of the available detonationdiffraction literature can be found in Schultz (2000). Despite the large amount ofexperimental data, a quantitative theory to predict the critical tube diameter is stilllacking.
In two dimensions, an extensive series of simulations with two-step reaction kineticswas performed by Jones et al. (1990, 1991, 1995) and Oran et al. (1992, 1993). Theiraim was to reproduce the diffracting patterns in detonation transmission experimentsby Liu et al. (1987, 1988). The role of detonation cellular structure in detonationdiffraction was further investigated by Jones et al. (1996, 2000) and Li & Kailasanath(2000), through simulations that were found in agreement with the 3 λ rule. In threedimensions, computations with single-step Arrhenius kinetics were carried out byWilliams, Bauwens & Oran (1996). Their results suggest that vorticity, providing astrong coupling mechanism between perpendicular transverse modes, can be a triggermechanism for the production of new transverse waves.
In the problem we investigated, detonation diffraction takes place around a sharpcorner with an interior angle of 90 (figure 2). An instance of this situation is encoun-tered when a detonation tube or channel opens into a larger volume. If we assume anunbounded volume, then the only geometric parameter is the exit diameter of the tube,or, in two dimensions, the channel half-width, H . Dimensional analysis for the single-step reaction model in the Arrhenius form leads to the following dependence for thecritical channel half-width,
Hc
∆1/2
= g
(Q
RgT0
, γp, γr, f, θ, nr
), (1.3)
where Q is the heat of reaction, γr and γp are the reactant and product specific heatratios, and f = D/DCJ is the overdrive of the detonation in the channel. Rg is themixture gas constant and T0 is the uniform temperature ahead of the shock. Thereaction characteristic length, ∆1/2, is defined as the distance, in the reference ZNDwave, between the shock (Z = 0) and the point where Z = 1/2. Our study is furtherspecialized by setting f = 1, γp = γr and nr = 2. The reference reduced activation
120 M. Arienti and J. E. Shepherd
ξ
η η
η
φ
(x0, y0 )
(x0, y0 )
η1η2
Dn
x
y
x
y
ξη
η1η2
η
φDn
φ0
(a) (b)
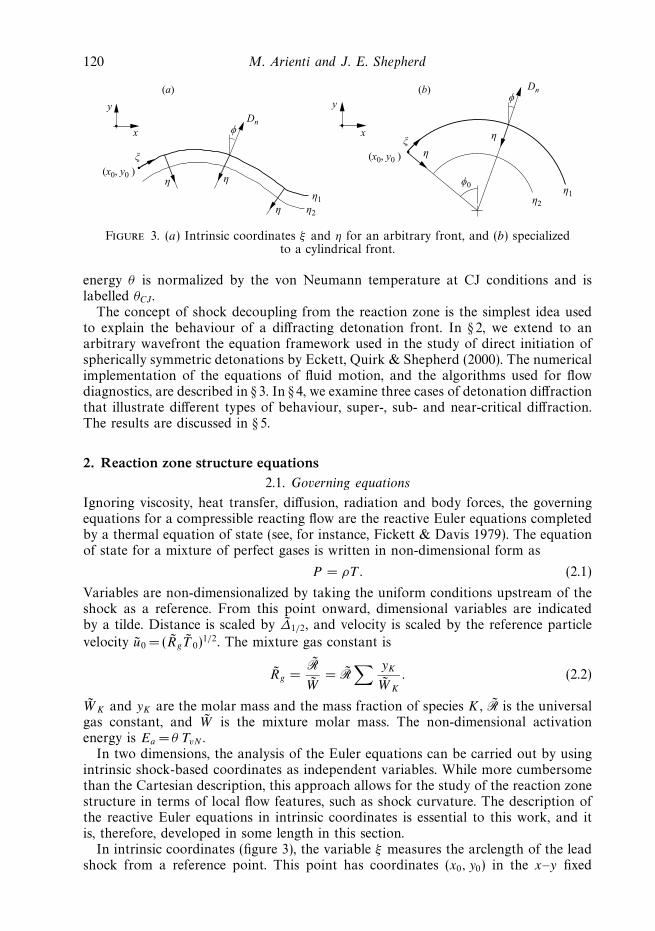
Figure 3. (a) Intrinsic coordinates ξ and η for an arbitrary front, and (b) specializedto a cylindrical front.
energy θ is normalized by the von Neumann temperature at CJ conditions and islabelled θCJ.
The concept of shock decoupling from the reaction zone is the simplest idea usedto explain the behaviour of a diffracting detonation front. In § 2, we extend to anarbitrary wavefront the equation framework used in the study of direct initiation ofspherically symmetric detonations by Eckett, Quirk & Shepherd (2000). The numericalimplementation of the equations of fluid motion, and the algorithms used for flowdiagnostics, are described in § 3. In § 4, we examine three cases of detonation diffractionthat illustrate different types of behaviour, super-, sub- and near-critical diffraction.The results are discussed in § 5.
2. Reaction zone structure equations2.1. Governing equations
Ignoring viscosity, heat transfer, diffusion, radiation and body forces, the governingequations for a compressible reacting flow are the reactive Euler equations completedby a thermal equation of state (see, for instance, Fickett & Davis 1979). The equationof state for a mixture of perfect gases is written in non-dimensional form as
P = ρT . (2.1)
Variables are non-dimensionalized by taking the uniform conditions upstream of theshock as a reference. From this point onward, dimensional variables are indicatedby a tilde. Distance is scaled by ∆1/2, and velocity is scaled by the reference particle
velocity u0 = (RgT 0)1/2. The mixture gas constant is
Rg =RW
= R∑ yK
WK
. (2.2)
WK and yK are the molar mass and the mass fraction of species K , R is the universalgas constant, and W is the mixture molar mass. The non-dimensional activationenergy is Ea = θ TvN .
In two dimensions, the analysis of the Euler equations can be carried out by usingintrinsic shock-based coordinates as independent variables. While more cumbersomethan the Cartesian description, this approach allows for the study of the reaction zonestructure in terms of local flow features, such as shock curvature. The description ofthe reactive Euler equations in intrinsic coordinates is essential to this work, and itis, therefore, developed in some length in this section.
In intrinsic coordinates (figure 3), the variable ξ measures the arclength of the leadshock from a reference point. This point has coordinates (x0, y0) in the x–y fixed

Numerical study of detonation diffraction 121
Cartesian reference system. Along the shock, the second coordinate η is constantand equal to zero. Lines of constant η are the loci of points with the same distancefrom the shock. The angle φ between the normal to the front and a reference axis,is a dependent variable, φ(ξ, t). The two-dimensional curvature of the front, κ , is, bydefinition, κ = (∂φ/∂ξ )η, t . Dn is the detonation velocity normal to the front. As anexample of an intrinsic coordinate system, figure 3(b) shows the particular case of acylindrical front with radius R(t). In this simple situation, the relation between ξ andη and the cylindrical coordinates (r and φ) is given by ξ = (φ − φ0) R and η = R − r ,and the trivial result κ = 1/R is found.
Conservation of mass, momentum and total energy can be written in intrinsiccoordinates as (Bdzil & Aslam 2000),
L(ρ) + [(Dn − uη)ρ],η + ρuηκ + uξ,ξ
1 − η κ= 0, (2.3a)
L(uη) + (Dn − uη)uη,η =P,η
ρ− uξ (Dn,ξ − uξκ)
1 − η κ, (2.3b)
L(uξ ) + (Dn − uη)uξ,η = −P,ξ + ρuη(uξκ − Dn,ξ )
ρ(1 − η κ), (2.3c)
L(e) + (Dn − uη)e,η =P
ρ2[L(ρ) + (Dn − uη)ρη], (2.3d)
where t is time and P and e are pressure and specific internal energy. The variables uη,uξ are the particle velocity components in the shock normal and transverse direction.We use the notation, ξ and, η to indicate a partial derivative with respect to ξ and η,in this order. The operator L is defined as
L =∂
∂t
∣∣∣∣ξ,η
+
(B +
uξ − ηDn,ξ
1 − η κ
)∂
∂ξ
∣∣∣∣t,η
. (2.4)
Note that, since the intrinsic reference system is time varying, the shock-based partialtime derivative differs from the partial time derivative evaluated in a fixed reference.In (2.4), B is the rate of change in arclength with respect to a fixed axis of referenceas measured by an observer that is always moving in the shock normal direction(Bdzil & Stewart 1989). The Lagrangian derivative, computed along the path of afluid element, can be expressed as
D/Dt = L + (Dn − uη) ∂/∂η. (2.5)
For N species, the rate of change of species K of a fluid element is
DyK
Dt= ΩK, (2.6)
with the index K varying between 1 and N . Using simple thermodynamic relations, theenergy equation (2.3d) may be replaced by the adiabatic change equation (Fickett &Davis 1979),
DP
Dt= c2 Dρ
Dt+ ρc2
∑K
σKΩK, (2.7)
where c is the frozen sound speed. The sum of the thermicity coefficients σK in (2.7)expresses the total pressure change due to chemical reaction at constant volume, and

122 M. Arienti and J. E. Shepherd
is called the thermicity product σ ,
σ =∑K
σKΩK. (2.8)
In this work, we specialize the reaction model to a one-step irreversible reaction,A → B, where the upstream fluid is undiluted species A. The reactant and product aretaken to have the same specific heat ratio γ . The specific internal energies of speciesA and B are
eA = CvT , eB = CvT − Q, (2.9)
where Cv is the gas specific heat at constant volume. The caloric equation of state is
e =1
γ − 1T − ZQ. (2.10)
The progress variable Z is defined as the mass fraction of product B, Z = yB = 1 − yA,the thermicity is
σ = (γ − 1)Q
c2
DZ
Dt, (2.11)
and the reaction rate is given by (1.2).
2.2. The Lagrangian derivative of temperature
Since realistic reaction rates are strongly temperature dependent, the Lagrangianderivative of temperature, DT/Dt , is of particular interest when considering thepossibility of detonation failure. By taking the Lagrangian derivative of (2.1), andusing the adiabatic change equation (2.7) together with the mass and momentumequations in (2.3), we find the temperature reaction zone structure equation(
1 −w2
η
c2
)Cp
DT
Dt=
1
γ − 1
(c2 − γw2
η
)σ + w2
η
κ(Dn − wη)
1 − η κ
+ wη(Dn − wη),t +P,t
ρ+ w2
η
wξ,ξ
1 − ηκ− wη
w2ξ κ
1 − ηκ
+wξ
1 − ηκ
(−wηwη,ξ +
P,ξ
ρ
)+ B
(wη(Dn − wη),ξ +
P,ξ
ρ
)
− ηDn,ξ
1 − ηκ
(wη(Dn − wη),ξ +
P,ξ
ρ
)+ wξwη
2 Dn,ξ
1 − ηκ(2.12)
with wη = Dn − uη and wξ = uξ . Cp is the mixture specific heat at constant pressure,Cp = γ /(γ −1). Equation (2.12) has the dimension of energy density per unit time. Theright-hand side has terms depending on the thermicity product, the shock curvature,the partial time derivatives of the flow, the transverse divergence wξ,ξ , and a termin w2
ξ κ that has the appearance of work associated with centripetal motion. Theremaining terms in the last two rows of (2.12) are more difficult to interpret.
The two terms containing a partial time derivative in the intrinsic reference framecan be grouped together, and, for the remainder of this work, they will be referred toas ‘unsteady terms’ or ‘unsteadiness’ of the fluid particle. Note that in a deceleratingwave, such as occurs in detonation diffraction, the unsteady terms are always negative.Thus, the reaction may quench if the wave is decelerating too rapidly.
If the plane of reference is also a plane of symmetry for the flow field, several termsdisappear at ξ = 0. The transverse derivatives vanish, with the exception of wξ,ξ , and

Numerical study of detonation diffraction 123
we obtain(1 −
w2η
c2
)Cp
DT
Dt=
1
γ − 1
(c2 − γw2
η
)σ + w2
η
κs(Ds − wη)
1 − ηκs
+ wη(Ds − wη),t +P,t
ρ+ w2
η
wξ,ξ
1 − ηκs
. (2.13)
In (2.13), κs(t) and Ds(t) are the front curvature and shock speed evaluated on theplane of symmetry. The result is the same as that found for a cylindrically symmetricflow with the addition of a transverse divergence term (Eckett et al. 2000). This termis always positive since wξ is anti-symmetric and no mass flux is allowed at the planeof symmetry. Note that, when the wavefront is convex-upstream, the curvature termis also positive in (2.13) and so it cannot possibly be a source of reaction quenchingwithout the additional presence of unsteadiness.
The relative size and behaviour of the terms in the temperature reaction zonestructure equation will be examined numerically by following the path of masslessparticles injected into the flow. We will refer to these particles as Lagrangian. Thegoal is to identify the dominant balance in a Lagrangian particle close to ignitionfailure and to find any simplifying assumption regarding the behaviour of terms in(2.12) or (2.13).
3. Numerical implementationThe reactive Euler equations are integrated via operator splitting as an alternated
sequence of convective and reaction source steps (Strang 1968). In the convectivestep, numerical fluxes are computed with Roe’s approximate solution of the Riemannproblem (Roe 1986). Formal second-order spatial accuracy is obtained via min-mod flux limiting, and the scheme is made entropy-satisfying with Harten’s entropyfix (Harten 1983). In the reaction source step, at ρ and e constant, the ordinarydifferential equation
dZ
dt= kρ (1 − Z) exp(−Ea/T ) (3.1)
is integrated by a second-order time-accurate predictor–corrector scheme. Verificationof results and the detailed description of the one-dimensional solver can be foundin Eckett (2001). The scheme is extended to two dimensions via standard dimension-by-dimension integration, and is marched in time with the forward Euler integrationscheme.
To accelerate the program execution time, the solver is embedded in the GridHierarchy Adaptive Computational Engine library, or GrACE (Parashar et al. 1997;Parashar & Browne 2000). This parallel library operates on partitions of thecomputational domain that are assigned to different CPUs of a multi-processorcomputer. Communication between processors is based on the Message PassingInterface (MPI) protocol (see, for instance, Snir et al. 1996).
A schematic diagram of the computational domain is shown in figure 2. Forsimplicity, a zero-gradient condition is imposed on the flow variables at the inlet (left-hand boundary), even if the flow, initially at CJ conditions, becomes subsonic whenthe rarefaction signal from the corner moves upstream. The length of the channelis 0.9H so that the corner expansion is protected from perturbations coming fromthe inlet in the early phases of detonation diffraction. Reflective boundary conditionsare implemented at the plane of symmetry (top boundary) and the simulation is

124 M. Arienti and J. E. Shepherd
θCJ 0.0 1.0 2.0 2.5 3.0 3.5 3.75 4.15
k 0.2013 0.3931 0.7757 1.077 1.551 2.204 2.632 3.509
Table 1. Normalized activation energy and proportionality factor.
terminated before the detonation front exits the domain at the right-hand and bottomboundaries.
To remove the singularity introduced in an Euler (inviscid) flow around asharp corner, the vertex is described by 128 segments as a polygonal boundary,approximating a rounded corner with radius of curvature rc = 1. The ghost-fluidcoupling scheme is used to model the correct reflective boundary conditions at thewall, solving the issue of Cartesian cells that are cut by the polygonal boundary. Anextensive description of this level-set based technique can be found in Arienti et al.(2003) in the context of the solution of dynamic fluid–solid coupling problems withcomplex interfaces. The details of the actual corner shape are, however, unimportantsince it is found that, for a sufficiently small radius (compared to the reference reactionlength), the flow field is affected only within a distance of a few multiples of rc fromthe corner (Arienti 2002).
At time t = 0, the initial solution is a planar ZND-CJ wave travelling from left toright in the inlet channel. The reference state ahead of the shock is P 0 = 24 kPa andT 0 = 298 K. The specific heat ratio, γ = 1.22, and gas constant, Rg =274.4 J kg−1 K−1,are estimated for stoichiometric oxyacetylene. These properties and the CJ detonationspeed, DCJ =2346.1 m s−1 (corresponding to the Mach number 7.422 and thenon-dimensional value DCJ = 8.204), were evaluated with the program STANJAN(Reynolds 1986). The non-dimensional energy release is Q = 65.81. To compareconsistently the wave profiles computed for different values of θCJ, the proportionalityparameter k in the reaction rate formula (3.1) is adjusted so that ∆1/2 is the same inall the simulations (see table 1 for a list of values).
An important part of the numerical results that are presented in this workdepends on the correct tracking of the detonation front; see Appendix A for moredetails. Particular care is required to control the error associated with time andspace derivatives of the estimated lead shock position. This error is due to thenecessary use of interpolation in the shock-tracking procedure and to high-frequencysolution oscillations that occur when the wavefront crosses the interface betweencomputational cells.
A second analysis tool is provided by the massless particles that are injected intothe flow to register the thermodynamic state and velocity of the surrounding fluid. Ateach time step, these particles are first advected by the flow-field solution and thenused to interpolate the flow-field variables and gradients at their current location.Each particle data stream is separately stored to be post-processed at the end of thesimulation. More details on this procedure can be found in Appendix B.
4. Activation energy studiesThe reduced activation energy θCJ is the key parameter determining the dynamics
of a combustion system described by a one-step Arrhenius rate model. Large valuesof θCJ result in a chemical reaction rate that is very sensitive to changes in thethermodynamic state. Small values of θCJ result in a chemical reaction rate that is

Numerical study of detonation diffraction 125
xa
Da/
DC
J
100 150 200 2500.4
0.5
0.6
0.7
0.8
0.9
1.0
4.15
3.75
3.5
2.5 3.0
01.0
2.0
Figure 4. Detonation velocity at the plane of symmetry, Da , as a function of the distancemeasured from the vertex, xa . The labels are values of the reduced activation energy θCJ,varying from 0 to 4.15.
almost independent of changes in the thermodynamic state. As a consequence, thediffraction behaviour of detonations modelled with an Arrhenius rate law can varywidely depending on the magnitude of the activation energy. In the present study,a range of values has been examined in order to map out the possible types ofdiffraction behaviour that can occur with a fixed ratio of reaction zone length tochannel height.
Two types of study were carried out. First, a set of coarse-resolution simulationswas performed for eight values of θCJ between 0 and 4.15. Secondly, a set of high-resolution simulations was carried out for three selected cases with reduced activationenergies of 1, 3.5 and 4.15. All of these simulations were performed with an initiallyplanar ZND wave travelling at the CJ speed before diffracting around the corner.Normal mode stability analysis (Lee & Stewart 1990) indicates that the neutralstability curve for one-dimensional CJ detonations asymptotes to a constant valueθCJ
∼= 4.74 for sufficiently large Mach numbers (MCJ > 6). Our simulations lie entirelywithin the range of one-dimensional hydrodynamic stability, allowing the study ofpurely gasdynamic quenching mechanisms in detonation diffraction.
Computations were carried out over a sufficiently long time to determine theultimate fate of the detonation wave. The half-width H of the channel in thesesimulations was fixed at 36.67 reaction half-lengths.
The coarse-resolution studies were performed with 16 grid points per half-reactionzone length, N1/2 = 16. This resolution level was convenient since it enabled a completesimulation (on a 4824 by 3752 grid) to be performed in less than 36 wall-clock hourson 48 processors (Pentium III, 1GHz with 1 GB of RAM) of the ASAP Linux clusterin the Centre for Advanced Computing Research (CACR) at Caltech.
4.1. Coarse-resolution studies
The histories of the shock detonation speeds, Da and Dw (shown in figure 2), are plot-ted as a function of position in figures 4 and 5. In figure 4, the shock speed on theplane of symmetry remains constant until the first expansion wave reaches the centreof the channel at about 90 half-reaction lengths from the corner vertex location. Theexpansion causes the shock speed to decay in all cases, but the long-time behaviouris different depending on the values of reduced activation energy.

126 M. Arienti and J. E. Shepherd
yw
Dw
/DC
J
0 50 100 150 2000.3
0.4
0.5
0.6
0.7
0.8
0.9
1.0
3.754.15
3.52.5
2.0
1.00
3.0
Figure 5. Detonation velocity at the corner wall, Dw , as a function of the distance from thevertex, yw . The labels are values of the reduced activation energy θCJ, varying from 0 to 4.15.
In figure 5, the shock speed at the wall drops instantly, since the flow around thecorner immediately affects the shock front. The very low pressure in the corner regioncauses the shock to propagate at much lower velocity along the wall than along theplane of symmetry. Overall, in this initial phase of corner diffraction, the behaviourof diffracting detonations is very similar to that observed with non-reacting shockwaves.
For longer times, two extreme types of behaviour can be noted for low activationenergy and high activation energy. These behaviours resemble the super-critical (lowactivation energy) and sub-critical (high activation energy) diffraction cases observedin experimental studies of diffraction from tubes. In addition, the cases of intermediateactivation energy appear to be similar to the critical case of diffraction from tubes. Itis important to keep in mind two key differences between experiments and the presentsimulations. First, the reduced activation energy is between 4 and 7 for most fuel–oxidizer combinations (Schultz 2000). Secondly, there are always transverse wavespresent on the detonation prior to reaching the corner so the correspondence betweenexperiment and present simulations is necessarily inexact. More realistic computationsare required in future studies to examine the influence of these two factors.
4.1.1. Low activation energy
For 0 θCJ 1, the reaction rate is essentially independent of the thermodynamicstate so that the reaction zone length is unaffected by the shock velocity. Since thereaction rate is nearly constant, the detonation will always accelerate after diffraction,reaching the CJ velocity far from the corner. This is similar to the case of super-criticaldiffraction that is observed in diffraction experiments (Schultz 2000) where the tubeis larger than the critical size required for successful detonation transmission.
Upon examination of figures 4 and 5, a simple picture of the low-activation-energycase emerges. The detonation velocity initially decreases owing to the expansion wavescreated by the flow around the corner, yet, after the initial decay, the wave acceleratesand eventually approaches the CJ velocity at a large distance from the corner. Thevelocity on the plane of symmetry drops slowly to about 88 % of the CJ velocity andthen begins to recover after propagating to 200 half-reaction lengths along the planeof symmetry (figure 4). The velocity on the wall drops immediately to 40 % of the CJvalue and recovers to about 80 % of CJ by the time the shock has propagated 200

Numerical study of detonation diffraction 127
half-reaction lengths along the wall (figure 5). The magnitude of the drop in the shockvelocity and the rate of acceleration are associated with the competition between thegasdynamic expansion created by corner flow and the energy release immediatelybehind the shock.
4.1.2. High activation energy
For 3.75 θCJ 4.15, the reaction rate is strongly dependent on the thermodynamicstate so that the reaction zone length increases rapidly when the shock speed decreases.This causes the reaction zone to decouple from the shock wave, and the reaction rate toessentially drop to zero, after a short distance from the corner vertex. The detonationfails completely and the resulting flow is essentially a non-reactive shock wave.This is similar to the case of sub-critical diffraction that is observed in diffractionexperiments where the tube is smaller than the critical size required for successfuldetonation transmission (Schultz 2000).
Examining figures 4 and 5, we find that there is also a simple pattern of behaviourfor this case. The wave velocity on both the plane of symmetry and the wall decreasescontinuously and reaches very low values, less than 50 % of the CJ value at 200–250half-reaction lengths from the corner vertex. The dynamics of the wave propagationare essentially those of a non-reactive shock, and the approximate method of Whitham(1974) can be used to find the evolution of the front.
4.1.3. Intermediate activation energy
For 2.5 θCJ 3.5, the reaction rate is moderately dependent on the thermodynamicstate. The reaction zone length increases as the shock decays, but the acceleratingeffects of energy release are sufficient to cause the reaction zone length to decreaseultimately in an abrupt fashion. This gives the appearance of a re-ignition event nearthe wall (figure 5) that propagates back to the centre of the channel. This is similarto the case of critical diffraction that is observed in diffraction experiments where thetube is comparable to the critical size required for successful detonation transmission(Schultz 2000).
The axial and wall velocities show an initial decay to a velocity higher than thatobserved in the high-activation-energy cases, followed by an acceleration back tovelocities similar to the low-activation-energy cases. The acceleration is abrupt at thewall, but more gradual on the plane of symmetry. This is related to the mechanismof transition, discussed in more detail below.
Another way to analyse the flow near the channel centre is to plot wave speed vs.curvature (figure 6). A unique Dn–κ relationship should result if the flow is quasi-steady in nature (Bdzil & Stewart 1989; Yao & Stewart 1995; Stewart & Yao 1998).Although the curves of figure 6 have a backward C-shape, their numerical values canbe very different from those in the corresponding Dn–κ curves. These differences arereported in detail in Arienti (2002).
4.2. High-resolution studies
Following the results of the coarse-resolution studies, more detailed simulationswere performed for selected cases at high resolution. The need for highly resolvedcomputations is crucial in the study of detonation diffraction. When the reaction zoneis under-resolved, direct numerical simulations tend to overestimate the wavefrontcurvature (Menikoff, Lackner & Bukiet 1996), and poor predictions of detonationwave structure can be expected (Sharpe 2001). The following three simulations werecomputed with N1/2 = 22.5 on a 6570 × 5858 grid for θCJ = 1 and 3.5, and on a

128 M. Arienti and J. E. Shepherd
κaH
Da/D
CJ
0 1 2 3 4
0.5
0.6
0.7
0.8
0.9
1.00 1
4.15
2
3
3.5
3.75
2.5
Figure 6. Detonation velocity–curvature (Dn–κ) diagram at the plane of symmetry of thechannel. The labels are values of the reduced activation energy θCJ, varying from 0 to 4.15.
1
2
3
45
(a) (b)
Figure 7. Numerical schlieren images for the case θCJ = 1. (a) t = 21.15; (b) 35.79. The solidline is the locus of 95 % product.
6750 × 5100 grid for θCJ = 4.15. Results of a convergence study with varying N1/2,presented in Arienti (2002), show that the main wave features are essentially convergedin these examples when N1/2 = 22.5.
The height of the computational domain (top-to-bottom) is approximately 250 ∆1/2.The time step is 1.1 × 10⁻³, corresponding to an average CFL number of 0.5 orsmaller; given a final time between 40 and 60 for the detonation front to reach thebottom of the computational domain, at least 40 000 time steps are required to reachsimulation completion.
4.3. Case θCJ = 1
Two numerical schlieren images are displayed in figure 7. Numerical schlieren visualiz-ation amounts to displaying the magnitude of the density gradient as a grey-scale. Anonlinear mapping, or grey-scale shading function, is used so that density gradients

Numerical study of detonation diffraction 129
ρ
0 10 20 300
1
2
3
4
5
6
7
1 2
3
4 5
T
0 10 20 300
2
4
6
8
10
12
14
16
181 2
3 54
(a) (b)
η
P
0 10 20 300
5
10
15
20
25
30
35
40
45
1 2
3
4 5
η
Z
0 10 20 300
0.2
0.4
0.6
0.8
1.0
12
3
45
(c) (d)
Figure 8. (a) Density, (b) temperature, (c) pressure and (d) progress variable profiles for 5data sets extracted at t = 35.79. Slices 1 and 5 are extracted along the plane of symmetry andthe corner wall, respectively. The remaining data are taken in the shock normal direction andare evenly spaced along the detonation front.
varying through several orders of magnitude are still visible. In this work, the grey-scale shading function is
ν = 0.8 exp
(−µ
|∇ρ||∇ρ|max
), (4.1)
with µ a strictly positive amplification parameter. The grey-scale ranges from blackfor ν =0 to white for ν = 1. Larger values of µ give darker images and accentuateweak features of the flow. To provide a consistent grey-scale reference, frames in asequence of schlieren images, such as that in figure 7, have the same amplificationand normalization factors.
In addition to the density gradient, figure 7 also displays the locus of points wherethe product mass fraction is equal to 0.95. This contour is displayed as a solid line.The corner, on the left-hand side of each plot, is shown as a rectangular shape witha small (not visible to the eye) rounded vertex of radius rc = 1. In each frame, onlythe last portion of the inlet channel (one-fifth of the total length) is shown.
As mentioned in the previous section, a value θCJ = 1 corresponds to a reaction ratemodel that is essentially insensitive to the shock velocity changes in the expansionfrom the channel half-width H = 36.67. Figure 8 is a plot of density, temperature,

130 M. Arienti and J. E. Shepherd
yw12
3...
xa
1 32 ...(a)
(b)
Figure 9. (a) Initial location of injected particles along the corner wall and the (b) plane ofsymmetry.
yw
t
0 50 100 150 200
0
10
20
30
40
1 2 654 109
t
T
0 10 20 30 40
0
5
10
15
1 2 654 8 109
(a) (b)
3 87 73
Figure 10. (a) Particle paths for 10 sample particles injected along the vertical corner wallfor θCJ = 1. (b) Temperature profiles along the particle paths.
pressure and progress variable for five ‘slices’ of the computational domain at timet = 35.79. Slices 1 and 5 are extracted along the plane of symmetry and the cornerwall, respectively. The remaining data are taken in the shock normal direction andare evenly spaced along the detonation front (see figure 7a). In all the slices, the post-shock pressure is almost exactly 75 % of the von Neumann value, corresponding toa detonation velocity 0.86DCJ =7.010. This estimate is consistent with the diagram infigure 4. Overall, the profiles in the two frames show the same dependence on η, withthe exceptions of slice 3 (dashed line) and slice 4 (dotted line) both passing througha system of transverse shocks. No residual effects of the transverse gradient due tothe corner rarefaction are observed, and, by the shock-change equation (Fickett &Davis 1979, p. 101), we conclude that the front is propagating as an almost cylindricaldetonation.
The receding 0.95 reaction locus in the first frame of figure 7 indicates that themost severe reduction of reaction rate is found along the corner wall. The trajectoriesof particles injected along this boundary (see figure 9a) are displayed in the space–time diagram of figure 10(a). The temperature profiles in figure 10(b) show that allparticles ignite, even those very close to the corner. From their trajectories, it appearsthat these particles are eventually pulled upward into the colder fluid at the cornervortex. At this time, however, the fluid element has almost completely reacted, andthe decrease in temperature has no feedback to the main reaction zone.
We conclude the analysis of the case θCJ = 1 with a comment on the group oftransverse shocks shown in figure 7(b). The first of these waves, moving from thecorner to the centre of the channel, is due to reflection of the curved detonation

Numerical study of detonation diffraction 131
5 4
2
1
3
(a) (b)
Figure 11. Numerical schlieren images for the case θCJ = 4.15 at (a) t = 28.43; (b) 53.22.
front at the corner wall in the initial phase of corner turning. The reflection causesa triple point to form at the detonation front with a contact discontinuity embeddedin the reaction zone. We found that the discontinuity in the sonic parameter actsas a channel for the propagation of high-frequency acoustic disturbances, which areamplified by the energy release due to chemical reaction and steepen to form newtransverse shocks. To each new shock at the detonation front corresponds a contactdiscontinuity, which, in turn, acts as a propagation guide. The mechanism describedhere is consistent with the propagation and amplification of high-frequency acousticwaves in a planar ZND-CJ reaction zone described by Strehlow & Fernandes (1965)and Barthel & Strehlow (1966). A complete discussion on this topic can be found inArienti (2002).
4.4. Case θCJ = 4.15
Two snapshots of the simulation, computed for θCJ =4.15, are displayed in figure 11.The decoupling occurs just behind the head of the corner signal that sweeps acrossthe wave from the corner to the centre of the channel. The detonation fails completelyand there is no local re-ignition, so the main flow features appear to evolve in time,similarly to a non-reacting shock.
Moving along the wavefront from the channel centre, we see that the wave curvatureincreases up to the point where the no-flow boundary condition, generated by the wall,causes a straight shock perpendicular to it. The transition from curved to straight frontis smooth, since the shock is immediately followed by an unsteady expansion wave.This structure is qualitatively predicted by Whitham’s geometrical shock dynamicsapplied to a non-reacting shock diffracting at a sharp corner (Whitham 1974, p. 297).It is also observed in direct numerical simulations by Xu, Aslam & Stewart (1997)and Helzel, Leveque & Warnecke (2000). At the junction of the curved front and thestem adjacent to the wall, the schlieren images in figure 11 indicate a discontinuouschange of density gradient.
The steep density gradient in figure 11 marks the separation between the burntgases, produced before reaction quenching, and the shock-compressed (but unburnt)reactants. This is shown in figure 12, where density, temperature, pressure and progressvariable profiles of five slices of the computational domain (at time t = 53.22) areplotted. Slices 1 and 5 are extracted along the plane of symmetry and the corner wall,

132 M. Arienti and J. E. Shepherd
ρ
0 25 50 75 100 1250
1
2
3
4
5
3
5
4
1
2
T
0 25 50 75 100 1250
2
4
6
8
10
12
14
16
3
5
4
1
2
(a) (b)
η
P
0 25 50 75 100 1250
2
4
6
8
10
12
3
5
4
12
η
Z
0 25 50 75 100 1250
0.2
0.4
0.6
0.8
1.0
3 5
4
1
2
(c) (d )
Figure 12. (a) Density, (b) temperature, (c) pressure and (d) progress variable profilesfor 5 data sets extracted at t =53.22.
respectively. The remaining data are taken in the direction normal to the shock andare evenly spaced along the detonation front (see figure 11a). Behind the lead shock,temperature and progress variable do not vary substantially from their post-shockvalues, whereas density and pressure decrease similarly to what would be expected ina blast wave. Density drops abruptly at a distance of 20 to 30∆1/2 from the shock.At the same location, temperature and progress variable rise very rapidly to thecorresponding values of the burnt products. This distance becomes 60 ∆1/2 behindthe Mach stem at the wall (slice 5).
4.4.1. Particle analysis
We now discuss the results obtained for a selection of particles injected along thechannel plane of symmetry (figure 9b). That is the most convenient location to probethe flow field, where the corner expansion is initially the weakest. For each particle,data analysis starts immediately after the passage of the lead shock. Since the shock isnormal to the plane of symmetry, the simplified equation (2.13) can be used. Particletrajectories, labelled from 1 to 10 in figure 13(a), become almost parallel to the tracesof the constant mass fraction of the product. This is an indication that the reactionis quenched, with no change in reactant–product composition (see also the contactdiscontinuity in figure 11).The temperature history along particle trajectories is plotted

Numerical study of detonation diffraction 133
xa
t
50 100 150 200
10
20
30
40
102 3 4 5 8 96 71
t
T
10 20 30 40 50
0
2
4
6
8
10
12
14
16
101 53
(a) (b)
Figure 13. (a) Particle paths for ten sample particles on the plane of symmetry. Shock (thicksolid line); traces of 5 % and 95 % of reaction completion (dashed lines); particle paths (thinsolid lines). (b) Temperature profiles along the particles paths.
in figure 13(b). The increase of the particle’s time to ignition as the shock strengthdecreases is clearly consistent with the reaction rate dependence on temperature.
The decomposition of DT/Dt is performed for particles 1, 3, 5 and 10 and displayedin figure 14. The plots show that the (positive) transverse divergence term is alwayssmall. This result, also found in the analysis of the θCJ =1 and θCJ = 3.5 cases, indicatesthat near the plane of symmetry, the flow is nearly cylindrical. From figure 14, wealso note that the contribution made by the curvature term to DT/Dt is negligiblefor particles close to failure.
The unsteady term mainly balances curvature and transverse divergence infigure 14(a), while the temperature variation is produced by heat release alone. Plotssimilar to figure 14(a) are obtained for the case θCJ = 1. In figures 14(b) and 14(c),the unsteady term becomes a large negative forcing factor that reduces DT/Dt belowthe value due to heat release for particles 3 and 5, whose rise in temperature is wellseparated from the initial shock. For particle 5, in particular, unsteadiness is initiallylarger than heat release, so that immediately after the shock, the temperature decreasesinstead of increasing. The large delay in ignition of particle 5 is not found for thecase θCJ = 1. This behaviour is more and more evident in the following elements offluid, until, by particle 10, the temperature steadily decreases after the shock, owingto unsteadiness dominating over heat release (figure 14d). At this point, the reactionis completely quenched.
4.5. Case θCJ = 3.5
This example shows the most interesting behaviour of all the cases examined in thisstudy: the detonation begins to fail at the wall, but, at some point, a re-ignition eventoccurs. Numerical schlieren images (figures 15 and 16) for the case θCJ = 3.5 indicatehow complex the dynamics of the diffraction process are. As shown by figures 4 and 5,the front evolves differently along the plane of symmetry and the wall. At the channelcentre, the shock appears never to completely decouple from the reaction zone. Thedetonation speed exhibits a plateau at a speed of about 0.6DCJ, but then climbstoward the CJ value. Conversely, the shock at the corner wall immediately detachesfrom the reaction zone and maintains a speed of about 0.4DCJ until the arrival of are-ignition transverse wave.

134 M. Arienti and J. E. Shepherd
13 14 15 16
–10
0
10
20
30
40
14 15 16 17 18–5
0
5
10
15
(a) (b)
t20 30 40 50
–1
0
1
2
3
4
5
t24 25 26 27 28
–0.15
–0.10
–0.05
0
0.05
(c) (d )
Figure 14. Terms in the reaction zone temperature (2.13) along the same particle paths asin figure 13 for θCJ = 4.15. The particles are injected on the channel plane of symmetry.· · ·, Lagrangian temperature; – . –, heat release; – – –, curvature; — —, transverse divergence;– .. –, unsteadiness. The solid line is the difference between the left-hand side and the right-handside in (2.13), as computed from the terms above. (a) Particle 1; (b) Particle 3; (c) Particle 5;(d) Particle 10.
From figure 15(a) to figure 15(c), the rarefaction originating at the corner reflects atthe plane of symmetry, and then sweeps downwards along the detonation front. Thisfurther reduces the strength of the lead shock and results in a flattening of the frontat the centre of the channel. An observer moving along the wavefront from the chan-nel centre to the corner wall would find the maximum value of pressure at the leadshock to be immediately ahead of the reflected expansion front. As the observermoves beyond that peak toward the corner wall, the pressure decreases again, thistime because of the effect of the first corner expansion. At time t = 17.49, the reflectedexpansion appears to have lost most of its strength and, near the wavefront pressurepeak, the end reaction zone begins to approach the shock, which accelerates. At timet = 21.15, the wavefront has acquired a very peculiar shape. It is almost flat at theplane of symmetry, has a relatively large curvature in the centre, and is completelydecoupled at the wall. A fold or kink in the shock front is starting to form. In thenext frame, a transverse shock wave is developing from this fold and propagating

Numerical study of detonation diffraction 135
(a) (b) (c)
(d ) (e) ( f )
Figure 15. Numerical schlieren images for the case θCJ = 3.5. (a) 10.17; (b) 13.83; (c) 17.49;(d) 21.15; (e) 24.81; (f ) 28.47. The solid line is the locus of 95 % product.
toward the corner wall. Figure 16 displays this further evolution, up to the reflectionof the transverse wave at the corner wall.
A close-up of the transverse wave system at t = 28.47 is shown in figure 17. Theincident shock (IS) is essentially non-reactive, while the curved Mach stem (MS)has a much higher reaction rate. This can be seen by considering the distance ofthe 95 % reaction locus (solid line in figure 17b) from the shock front. A contactdiscontinuity (CD2) separates the partially reacted gas, processed by IS, from thecompletely burnt products. The transverse wave (TS) extends between the two triplepoints, T1 and T2, as a straight shock, and from T2 to the 95 % reaction locus as acurved strongly reactive wave. It propagates into the partially reacted region behindthe incident shock and quickly brings the reaction to completion. The maximum valueof reactivity is found immediately behind the short stem connecting point P with T2.In figure 17(a), this small area is above the cutoff value of the pressure contours, andit is surrounded by the highest density of contour lines. The contact discontinuityCD1 separates the gas that has passed through the MS from the gas processed bythe transverse shock. A relatively minor feature, a kink (K) in the Mach stem, isalso visible. The discontinuity associated with the kink terminates near point P . Gridresolution studies by Sharpe (2001) indicate that this feature rapidly disappears inunder-resolved simulations, so its presence in the result we are showing here suggeststhat the level of resolution is adequate.
It is important to point out that a transverse wave structure analogous to thatdescribed here can also be observed with higher values of normalized activationenergy. In the case computed with θCJ =3.75 (not shown here), the mechanismdescribed above was found to produce a first transverse wave similar to that infigure 17. This wave was slower and weaker than that at θCJ = 3.5 and could notaccelerate the lead shock. This is shown in figure 4, where Da decays monotonicallyfor θCJ = 3.75. It is, therefore, the acceleration of the shock close to the channel

136 M. Arienti and J. E. Shepherd
(a) (b)
(c) (d )
(e) ( f )
Figure 16. Numerical schlieren images for the case θCJ = 3.5. (a) 32.13; (b) 35.79; (c) 39.45;(d) 43.11; (e) 44.94; (f ) 46.77.

Numerical study of detonation diffraction 137
(a) (b)
CD2
CD1P
TS
T2
MST1
K
IS
Figure 17. Structure of the re-ignition transverse wave: (a) contours of pressure and(b) numerical schlieren of density, at time t = 28.47. In (a), the contour lines are spacedby the non-dimensional value 2.083 with a cutoff limit of 250 marking the pressure peak (at445) behind the kink. The segment at the bottom left shows the length ∆1/2 in the plot scale.The solid line in (b) is the 95 % reaction completion locus.
x
t
100 150 200 250
10
20
30
40
50
101 16 21
t
T
10 20 30 40 50
0
4
8
12
16
161 10 21
(a) (b)
Figure 18. (a) Particle paths for 21 sample particles injected along the channel plane ofsymmetry (figure 9b) for θCJ = 3.5. The labels 1, 10, 16, 21 indicate particles that are analysedin terms of numerical dominant balance. (b) Temperature profiles along the particle paths.
plane of symmetry that appears as the distinctive feature of a successful near-criticaldetonation diffraction. This point will be clarified in the following sections.
4.5.1. Particle analysis
From the previous description, two radically different behaviours can be identifiedin the two regions near the channel plane of symmetry and the corner wall. At thewall, the decoupling of the shock from the reaction zone persists until an externalcause, the reflection of a strong transverse shock, is able to re-ignite the mixture.Near the channel centre, a complex wavefront dynamic results in shock foldingand eventually produces an explosion, followed by a system of transverse waves. Inboth cases, local flow symmetry occurs, and the simplified equation (2.13) for theLagrangian temperature derivative can be used.
Lagrangian trajectories are displayed in figure 18(a) for particles that are located onthe plane of symmetry and in figure 19(a) for particles on the wall. The temperature

138 M. Arienti and J. E. Shepherd
yw
t
0 50 100 150 200
0
10
20
30
40
50
101
t
T
0 10 20 30 40 50
1.0
1.2
1.4
1.6
1.8
2.0
2.2
1 10
(a) (b)
Figure 19. (a) Particle paths for 20 sample particles injected along the vertical corner wall(figure 9a) for θCJ = 3.5. The labels 1 and 10 indicate the particles that are analysed in termsof numerical dominant balance. (b) Temperature profiles along particles paths.
readings along these paths are displayed in figures 18(b) and 19(b), respectively. Labelsindicate particles that will be further analysed in this section.
For particles moving along the channel plane of symmetry, the post-shock tem-perature decreases, reaches a minimum, and then increases again. Likewise, the timedelay between the shock passage and the peak temperature for particle 10 is largerby about an order of magnitude than the corresponding time for particle 1, indicatinga growth in ignition time. From particles 10 to 21, the ignition time decreases again.These results indicate that the detonation slows down, but does not fail. Note thatthe post-shock slopes of the temperature never become negative for any of thetrajectories shown in figure 18. This important observation, and the fact that DT/Dt
instead passes through zero when θCJ = 4.15, will be used later in the discussionsection.
In particles moving along the corner wall, no ignition occurs until approximatelyt = 43. The post-shock temperature steadily decays from particle 1 to particle 7, hasa slight increment from particle 7 to 12, and then decreases again. Overall, the flowfield near the wall can be treated as non-reacting up to the point when ignition issuddenly re-started by the transverse shock reflection (between figures 16d and 16e).
The decomposition of the terms in the reaction zone temperature according to(2.13) is shown in figure 20 for particles 1, 10, 16 and 21 along the plane of symmetryof the channel. Results for particles initially located just downstream of the headdisturbance arrival point are very similar for the cases θCJ = 3.5 and θCJ = 4.15 (seefigure 20a and figure 14a). This is expected since the activation energies in these twocases differ by a relatively small amount. The behaviour of the particles that follow is,however, radically different. Whereas particles 10 and 16 have much longer ignitiontimes, of the order of 5–10 units of time, particles that are located further downstreamagain display an ignition time close to one. This reinforces the observation that forthe case θCJ = 3.5, the detonation re-couples near the channel centre, whereas for thecase θCJ = 4.15, the detonation completely decouples.
If we now examine one by one the terms appearing on the right-hand side of (2.13),we notice that the unsteady term appears almost everywhere in the form of a negativeforcing factor, as for the case θCJ = 4.15. Overall, curvature and transverse divergenceeffects play a relatively unimportant role in determining the Lagrangian derivative of

Numerical study of detonation diffraction 139
11 12 13 14
–10
0
10
20
30
40
25 30 35 40 45–8
–4
0
4
8
12(a) (b)
t35 40 45
–2
0
2
4
6
8
10
12
14
t41 42 43 44
0
4
8
12
16
(c) (d)
Figure 20. Terms in the reaction zone temperature (2.13) along the same particle paths as infigure 18(a) for the case θCJ = 3.5. The particles are injected along the plane of symmetry. . . .,Lagrangian temperature; – . –, heat release; – – –, curvature; — —, transverse divergence; – .. –,unsteadiness. The solid line is the difference between the left-hand side and the right-hand sidein (2.13), as computed from the terms above. (a) Particle 1; (b) Particle 10; (c) Particle 16;(d) Particle 21.
temperature. Exceptions to this are the paths 10 and 16 (figure 20b, c), where a strongpeak in the curvature term can be observed at time t ∼= 40. At this point, however,the flow has already reacted, and DT/Dt is almost zero.
The analysis of fluid elements along the corner wall (not shown here) leads toresults that are very similar to those observed for the case θCJ =4.15, with delayedor no ignition occurring and temperature decrease dictated by the unsteady term.Temperature variations are much smaller than those observed in particles movingalong the plane of symmetry until the arrival of the re-ignition transverse wave atapproximately t = 43. Further analysis after this point is not possible owing to thepresence of strong shock waves processing the unreacted fluid.
5. DiscussionIn the previous section, the magnitude of the terms in the reaction zone structure
equation was examined along selected particle paths for sub-, near- and super-critical

140 M. Arienti and J. E. Shepherd
cases. The study focused on particle trajectories running along the plane of symmetryof the channel and the lower wall of the corner, since these two regions show verydifferent wavefront dynamics in the case θCJ =3.5.
A first result of our analysis is that the contribution of the curvature and transversedivergence terms to the Lagrangian derivative of temperature is negligible in causingparticle ignition delay. This result coincides with the findings of Eckett et al. (2000)for the closely related case of direct initiation of spherical detonations. Thus, thereaction zone structure equation simplifies to show the competition between energyrelease rate and unsteadiness,
(1 − M2)Cp
DT
Dt= (1 − γ M2)Qkρ(1 − Z) exp
(−Ea
T
)
+ wη(Da − wη),t +P,t
ρ. (5.1)
A second result is that fluid elements that fail to ignite exhibit a negative post-shockderivative DT/Dt . Two representative cases were shown in the previous section. In thecase θCJ = 4.15, the derivative DT/dt is negative along several Lagrangian paths afterthe passage of the shock (figure 13), but when θCJ = 3.5, the derivative remains positiveat post-shock conditions, albeit very close to zero for a few particles (figure 18). Toassociate the temperature change immediately after the passage of the lead shock tothe particle ignition delay, we propose the local decoupling condition,
DT/Dt |s = 0, (5.2)
as a criterion for the decoupling of the shock front from the reaction zone. Equa-tion (5.2), evaluated at the post-shock state, s, intuitively relates the rate of post-shocktemperature increase to the ignition delay of the particle. To satisfy this condition –introduced by Eckett et al. (2000) in the study of direct detonation initiation andpostulated by Schultz (2000) for detonation diffraction – the following equation mustbe satisfied,
Qkρs exp
(−Ea
Ts
)= − 1(
1 − γ M2s
)[wη(Dn − wη),t +
P,t
ρ
]s
. (5.3)
Note that the right-hand side of (5.3) is a function only of γ and the shockdeceleration.
A third result is that the global criterion for diffraction failure can be reduced to atest for detonation front decoupling at the plane of symmetry of the channel, a fewreference reaction lengths downstream of the head expansion arrival point. We callthis location the critical point. The fact that re-ignition starts from the channel centrehas been regularly observed in experimental studies on detonation diffraction (see,for instance, Edwards et al. 1979; Moen et al. 1982).
In the strong shock limit, equation (5.3), evaluated at the plane of symmetry,becomes
Qk exp
(−D2
CJ
D2ac
θCJ
)= − 12
3 − γ
(γ − 1)2
(γ + 1)3Dac
Dac. (5.4)
Equation (5.4) points out the balance between the energy release rate, proportional toQ k, and a term similar to kinetic energy decay. To characterize the critical detonation

Numerical study of detonation diffraction 141
Xa
dDa/d
t H / D
2 CJ
80 100 120 140 160–0.8
–0.6
–0.4
–0.2
0
3.5
4.15
1.0
Blast model
Whitham’s theory
Figure 21. Shock deceleration as a function of the distance from the corner vertex,parameterized by θCJ.
speed Dac, we take (somewhat arbitrarily) the critical point to be such that
Dac= 0.75DCJ, (5.5)
and propose that, if (5.4) is verified downstream of this point, the decoupling willcontinue until reaction quenching. It is very difficult to relate Dac
to the dynamicand kinetic properties of the decoupling detonation front, to the point that this termshould be considered more like a free parameter of the model. The same factor 0.75is derived by Radulescu et al. (2003) from experiments on direct detonation initiationas the critical value marking the onset of detonation.
To derive the critical relation between θCJ and H from (5.4), we must still model thecritical shock deceleration at the channel centre, Dac
. Shock deceleration depends onthe initial speed and the width of the channel, and it can be argued to be proportionalto D 2
CJ/H by dimensional arguments. By assuming that, in the sub-critical case, thelead shock decays (at the plane of symmetry) as a cylindrical blast of initial radiusH/tan α, the relation between shock speed and curvature is Dac
= κ HDCJ/ tan α. Theshock decay at H/tan α is, therefore,
Dac= −D2
CJ
Htan α. (5.6)
The angle α is the maximum disturbance angle from the Skews’ construction (seefigure 1b). For this problem, α = 22.6. The shock decay computed from the numericalsimulations is plotted in figure 21 as a function of position for the three values ofθCJ, together with the estimated critical shock deceleration deduced from the blastmodel. An alternative formula for Dac
can be derived from Whitham’s geometricalshock dynamics (see Arienti 2002 for details) and is also shown in figure 21.
With (5.6), equation (5.4) is reduced to
Hk
DCJ
Q
D2CJ
= exp (1.78θCJ)9 tanα
3 − γ
(γ − 1)2
(γ + 1)3. (5.7)
As a consistency check, we verify that substitution of the values of α, Q, k, H , DCJ
and γ leads to θCJ c= 4.0. This value is close to the actual critical reduced activation
energy. From figure 4, we see that θCJ cis between 3.5 (success) and 3.75 (failure) when
H = 36.67.

142 M. Arienti and J. E. Shepherd
6. ConclusionsIn this work, we have identified modes of detonation diffraction that depend on
the activation energy of a single-step irreversible Arrhenius reaction model. For thefixed value of gap half-width, H = 36.67, we found three regimes of diffraction thatresemble the super-, sub- and near-critical diffraction observed in experiments. Then,we extended the technique used by Eckett et al. (2000) to record the time derivativeof temperature along the paths of particles that are close to ignition failure. Wefound that large ignition delays, and ultimately, local decoupling of the shock frontfrom the reaction zone occur if the Lagrangian derivative of temperature vanishesimmediately after the passage of the shock. We identified this condition, when flowfield unsteadiness (as seen by the fluid particle) balances the rate of the energy release,as the critical condition for a failing detonation diffraction.
The importance of flow unsteadiness in the reaction zone structure equation ismore apparent when comparing measured values of detonation speed and curvaturewith the Dn–κ diagram derived from asymptotic quasi-steady quasi-one-dimensionaltheory (Stewart & Bdzil 1988). We found that, in the case θCJ = 1, the measured frontcurvature and detonation speed approach the asymptotic Dn–κ values only when thewavefront has moved past a distance of the order of 6H from the corner. In the caseθCJ = 3.5, we did not observe a quasi-steady state before simulation termination. Aneven clearer indication of flow unsteadiness is provided by the maximum measuredfront curvature at the channel centre in figure 6. In the near-critical case θCJ = 3.5,immediately after the arrival of the corner disturbance, front curvature rapidly reachesa value ten times larger than the maximum curvature allowed by a cylindrical steady-state detonation with the same activation energy. Even with this large value ofdetonation curvature, we found that the large-scale features of the wavefront can beconsidered quasi-one-dimensional. This can be seen in figure 6, where the minimummeasured wavefront radius of curvature (at the channel centre), 1/κa >H/4.1 = 9.1,is sufficiently larger than unity.
In summary, our simulations indicate that a diffracting detonation wavefrontis not insulated from transverse perturbations due to unsteady rarefaction waves.This appears in the propagation angle of the head disturbance with respect to theundisturbed front and, when local re-ignition takes place, in the complex interactionof the reflected expansion front with the partially decoupling detonation structure. Infact, sonic conditions are not reached at the end of the reaction zone for a relativelylong transient, even in cases where detonation transmission is successful. This limitsthe applicability of the quasi-steady model by Stewart & Bdzil (1988) when studyingthe critical diameter problem for mixtures whose reaction rate strongly depends ontemperature. In the case of sub-critical diffractions, our simulations do not indicateany direct role played by front curvature. Rather, unsteadiness, due to decelerationof the lead shock, is found to be the dominant negative forcing factor that drives theignition delay. Our conclusions disagree with the global failure mechanism proposedby Lee (1996) for mixtures with relatively small activation energies, as this mechanismpostulates the existence of a critical curvature to explain detonation failure.
Our work addresses the purely gasdynamic quenching mechanisms, since thedetonation cellular structure was not treated in the present simulations. The parameterrange and initial conditions were chosen deliberately so that cellular structure wasinitially suppressed. The decision to carry out the computations without cellularstructure was taken to facilitate shock tracking and the order-of-magnitude analysisalong particle paths. Clearly, the result obtained from this analysis depends, in part,on this simplification.

Numerical study of detonation diffraction 143
Our model is also limited to the description of a system governed by very simplereaction kinetics. It is an open issue whether the current results provide a lowerbound for critical diffraction conditions in the presence of cellular structure andwith a more detailed reaction mechanism. This is a significant extension of thepresent study, and we have left it for future investigation. Since the present parallelcomputations involved week-long simulations and stretched to a limit the capabilityof analysing large volumes of data, we anticipate that these investigations will requireimplementation of parallel adaptive mesh refinement algorithms and chemical kineticsreduction techniques.
Even if the empirical relationships between cell detonation width and critical tubediameter (or gap width, in two dimensions) are not applicable in the present case,studies by Westbrook & Urtiew (1983), Moen et al. (1982, 1984), and Schultz (2000)have demonstrated that equally reasonable correlations exist between critical tubediameter, reaction zone length and activation energy. At present, there are no reliablemethods for computing cell width, except for mixtures with very weak instabilities,but some progress can be made by considering the role of the reaction zone structuredirectly. Starting from similar considerations of the role played by unsteadiness,Schultz (2000) was successful in connecting the available experimental data witha critical model of spherical detonation diffraction leading to an equation similarto (5.7).
This work was carried out at the Caltech ASC ‘Centre for Simulation of DynamicResponse of Materials’ and funded by Contract B341492 under DOE ContractW-7405-ENG-48.
Appendix A. Shock-tracking algorithmDetonation speed, shock acceleration and front curvature of the detonation wave
are reconstructed in a post-processing step from shock-tracking data collected duringthe simulation. Shock tracking is performed in a non-intrusive step at each timeintegration after updating the flow field. The tracking algorithm consists of a sequenceof sweeps of the current solution in the x and y coordinate directions. For each sweep,the position of the first peak of density that emerges from the undisturbed flow issearched. The shock location is taken as the position of the flex point in the numericalrepresentation of the shock. The flex is defined as the midpoint between the peakvalue of density and the undisturbed value. Its position is estimated as a linearinterpolation between the two grid points that bracket this value.
In the post-processing step at the end of the simulation, quantities such as thenormal detonation velocity, Dn, and the local curvature, κ , are evaluated throughfinite-difference approximations for spatial and temporal derivatives of the shockposition. For instance, the curvature along the channel plane of symmetry requiresthe evaluation of a second-order derivative, which we compute as a centred differencescheme,
κa = 2xm−w − xm
w2y2+ Cw2y2, (A 1)
where C depends on the truncation error. In the equation above, we skipped w gridpoints in both directions from ym, and then used the symmetry condition for thetracked shock positions xm+w = xm−w . A similar formula is used for evaluating thecurvature along the corner wall.

144 M. Arienti and J. E. Shepherd
Particular care is required to control the error associated with the approximation ofderivatives of the shock position. Errors due to linear interpolation at the flex point inthe shock profile and to high-frequency oscillations of the post-shock state (occurringwhen the wavefront crosses the interface between computational cells) appear in thenumerator of (A 1). Since these errors can be of the same order as the grid spacing,a naive implementation of this formula may not converge under grid refinement.Aslam, Bdzil & Hill (1998) raised the issue and suggested increasing the number ofskipped points w with grid refinement in such a way that the difference in (A 1) isnever too small compared with the position error. In a convergence study in Arienti(2002), different strategies for choosing the points for differentiation are compared.Following that study, in the present work, we present results where w = 16 in (A 1)for the coarse-resolution study and w = 21 for the high-resolution study.
Appendix B. Lagrangian particles integrationIntegration of the particle trajectory is performed with a predictor–corrector method
in the form of an Adams–Bashforth predictor (P) followed by an Adams–Moultoncorrector (C). Only one PC iteration is performed. The overall scheme is of the PECEtype, where step E indicates the update of the derivative part from the last computedvalue (in Press et al. 1992, pp. 747–751). Step P is computed before advancing theEuler equations by a time step, and step C is computed after. A master–slave strategy(see, for instance, Wilkinson & Allen 1999) is implemented to track particles that aretransported from one processor sub-domain to the next.
Particle data analysis starts only after the first peak value in particle pressure data.Lagrangian derivatives are directly computed by finite-difference operations on theparticle data stream, whereas partial time derivatives (in the intrinsic reference frame)are available only indirectly from the relation
∂/∂t |ξ,η = D/Dt − wη∂/∂η − wξ∂/∂ξ. (B 1)
The spatial gradients in η and ξ are obtained by coordinate transformation from thestored gradients in x and y. When the partial time derivative is small compared toD/Dt (a limit case is a ZND detonation where ∂/∂t |ξ,η is identically zero), equation(B 1) is prone to cancellation errors. Since the partial time derivatives are combinedin the unsteady term as
wη(Dn − wη),t +P,t
ρ,
an alternative solution is to evaluate this entire term by rearranging momentum andmass conservation equations. Under conditions of symmetry, the result
wη(Ds − wη),t +P,t
ρ=
1
ρ
(DP
Dt− w2
η
Dρ
Dt
)+ w2
η
κs(Ds − wη)
1 − ηκs
+ w2η
wξ,ξ
1 − ηκs
(B 2)
is numerically easier to treat and is, therefore, used in (2.13) to evaluate the unsteadyterms.
REFERENCES
Arienti, M. 2002 A numerical and analytical study of detonation diffraction. PhD thesis, CaliforniaInstitute of Technology.
Arienti, M., Hung, P., Morano, E. O. & Shepherd, J. E. 2003 A level set approach to Eulerian–Lagrangian coupling. J. Comput. Phys. 185, 213–251.

Numerical study of detonation diffraction 145
Aslam, T. D., Bdzil, J. B. & Hill, L. 1998 Extension to DSD theory: analysis of PBX 9502 ratestick data. In 11th Symp. (Intl) on Detonation , pp. 21–29. Office of Naval Research.
Barthel, H. O. & Strehlow, R. A. 1966 Wave propagation in one-dimensional reactive flows.Phys. Fluids A 9, 1896–1907.
Bdzil, J. B. & Aslam, T. D. 2000 Detonation front models: theories and methods. LA-UR-00-942.Los Alamos National Laboratory.
Bdzil, J. B. & Stewart, D. S. 1989 Modeling two-dimensional detonations with detonation shockdynamics. Phys. Fluids A 1, 1261–1267.
Desbordes, D. 1988 Transmission of overdriven plane detonations: critical diameter as a functionof cell regularity and size. Prog. Astronaut. Aeronaut. 114, 170–185.
Eckett, C. A. 2001 Numerical and analytical studies of the dynamics of gaseous detonations. PhDthesis, California Institute of Technology.
Eckett, C. A., Quirk, J. J. & Shepherd, J. E. 2000 The role of unsteadiness in direct initiation ofgaseous detonations. J. Fluid Mech. 421, 147–183.
Edwards, D. H., Thomas, G. O. & Nettleton, M. A. 1979 The diffraction of a planar detonationwave at an abrupt area change. J. Fluid Mech. 95, 79–96.
Fickett, W. & Davis, W. C. 1979 Detonation . University of California Press.
Guirao, C. M., Knystautas, R. & Lee, J. H. 1987 A summary of hydrogen–air detonationexperiments. Tech. Rep. SAND87-7128. Sandia National Laboratories.
Harten, A. 1983 High resolution schemes for hyperbolic conservation laws. J. Comput. Phys. 49,357–393.
Helzel, C., Leveque, R. J. & Warnecke, G. 2000 A modified fractional step method for theaccurate approximation of detonation waves. SIAM J. Sci. Comput. 22, 1489–1510.
Jones, D. A., Kemister, G., Oran, E. S. & Sichel, M. 1996 The influence of cellular structure ondetonation transmission. Shock Waves 6, 119–129.
Jones, D. A., Kemister, G., Tonello, N. A., Oran, E. S. & Sichel, M. 2000 Numerical simulationof detonation reignition in H2–O2 mixtures in area expansions. Shock Waves 10, 33–41.
Jones, D. A., Sichel, M., Guirguis, R. & Oran, E. S. 1991 Numerical simulation of layereddetonations. Prog. Astronaut. Aeronaut. 133, 202–219.
Jones, D. A., Sichel, M. & Oran, E. S. 1995 Reignition of detonation by reflected shocks. ShockWaves 5, 47–57.
Jones, D. A., Sichel, M., Oran, E. S. & Guirguis, R. 1990 Detonation transmission in layeredexplosives. In 23rd Symp. (Intl) on Combustion , pp. 1805–1811. The Combustion Institute.
Knystautas, R., Lee, J. H. & Guirao, C. M. 1982 The critical tube diameter for detonation failurein hydrocarbon–air mixtures. Combust. Flame 48, 63–83.
Lee, H. I. & Stewart, D. S. 1990 Calculation of linear detonation instability: one-dimensionalinstability of plane detonation. J. Fluid Mech. 216, 103–132.
Lee, J. H. S. 1996 On the critical diameter problem. In Dynamics of Exothermicity (ed. J. R. Bowen),pp. 321–336. Gordon & Breech.
Li, C. & Kailasanath, K. 2000 Detonation transmission and transition in channels of differentsizes. In 28th Symp. (Intl) on Combustion , pp. 603–609. The Combustion Institute.
Liu, J. C., Liou, J., Sichel, M. & Nichols, C. W. K. J. A. 1987 Diffraction and transmissionof a detonation into a bounding explosive layer. In 21st Symp. (Intl) on Combustion ,pp. 1639–1647. The Combustion Institute.
Liu, J. C., Sichel, M. & Kauffmann, C. W. 1988 The lateral interaction of detonating and detonablegas mixtures. Prog. Astronaut. Aeronaut. 114, 264–283.
Menikoff, R., Lackner, K. S. & Bukiet, B. G. 1996 Modeling flows with curved detonation waves.Combust. Flame 104, 219–240.
Mitrofanov, V. V. & Soloukhin, R. I. 1965 The diffraction of multifront detonation waves. Sov.Phys. Dokl. 9, 1055–1058.
Moen, I., Funk, J. W., Ward, S. A., Rude, G. M. & Thibault, P. A. 1984 Detonation length scalesfor fuel-air explosives. Prog. Astronaut. Aeronaut. 94, 55–79.
Moen, I., Murray, S., Bjerketvedt, D., Rinnan, A., Knystautas, R. & Lee, J. 1982 Diffractionof detonation from tubes into a large fuel–air explosive cloud. In 19th Symp. (Intl) onDetonation , pp. 635–644.
Oran, E. S., Boris, J., Jones, D. A. & Sichel, M. 1993 Ignition in a complex Mach structure. Prog.Astronaut. Aeronaut. 153, 241–252.

146 M. Arienti and J. E. Shepherd
Oran, E. S., Jones, D. A. & Sichel, M. 1992 Numerical simulations of detonation transmission.Proc. R. Soc. Lond. A 436, 267–297.
Parashar, M., Browne, J. C., Edwards, C. & Klimkowski, K. 1997 A common data managementinfrastructure for adaptive algorithms for PDE solutions. Proc. 1997 ACM/IEEE Conf. onSupercomputing, pp. 1–22. ACM Press (CDROM).
Parashar, M. & Browne, J. C. 2000 System engineering for high performance computing software:The HDDA/DAGH Infrastructure for implementation of parallel structured adaptive meshrefinement. IMA: Structured Adaptive Mesh Refinement (SAMR) Grid Methods , vol. 117,pp. 1–18. Springer.
Press, W. H., Teukolsky, S. A., Vetterling, W. T. & Flannery, B. P. 1992 Numerical Recipes: theArt of Scientific Computing , pp. 747–752. Cambridge University Press.
Radulescu, M. I., Higgins, A. J., Murray, S. B. & Lee, J. H. S. 2003 An experimental investigationof the direct intitiaion of cylindrical detonations. J. Fluid Mech. 480, 1–24.
Reynolds, W. C. 1986 The element potential method for chemical equilibrium analysis:implementation in the interactive program STANJAN. Tech. Rep. Stanford University, Deptof Mech. Engng.
Roe, P. L. 1986 Characteristic-based schemes for the Euler equations. Annu. Rev. Fluid Mech. 18,337–365.
Schultz, E. 2000 Detonation diffraction through an abrupt area expansion. PhD thesis, CaliforniaInstitute of Technology.
Sharpe, G. J. 2001 Transverse waves in numerical simulations of cellular detonations. J. Fluid Mech.447, 31–51.
Shepherd, J. E., Moen, I. O., Murray, S. B. & Thibault, P. A. 1986 Analyses of the cellularstructure of detonation. In 21st Symp. (Intl) on Combustion , pp. 1649–1658. The CombustionInstitute.
Skews, B. W. 1967 The shape of a diffracting shock wave. J. Fluid Mech. 29, 297–304.
Snir, M., Otto, S. W., Huss-Lederman, S., Walker, D. W. & Dongarra, J. 1996 MPI: TheComplete Reference. Scientific and Engineering Computation . MIT Press.
Stewart, D. S. & Bdzil, J. B. 1988 The shock dynamics of stable multi-dimensional detonation.Combust. Flame 72, 311–323.
Stewart, D. S. & Yao, J. 1998 The normal detonation shock velocity–curvature relationship formaterials with nonideal equation of state and multiple turning points. Combust. Flame 113,224–235.
Strang, G. 1968 On the construction and comparison of difference schemes. SIAM J. Numer. Anal.5, 506–517.
Strehlow, R. A. & Fernandes, F. D. 1965 Transverse waves in detonations. Combust. Flame 9,109–119.
Westbrook, C. K. & Urtiew, P. A. 1983 Use of chemical kinetics to predict critical parameters ofgaseous detonations. Combust. Explosion Shock Waves 19, 753–766.
Whitham, G. B. 1974 Linear and Nonlinear Waves . Wiley.
Wilkinson, B. & Allen, M. 1999 Parallel Programming, Techniques and Applications UsingNetworked Workstations and Parallel Computers . Prentice Hall.
Williams, D. N., Bauwens, L. & Oran, E. S. 1996 Detailed structure and propagation of three-dimensional detonations. In 26th Symp. (Intl) on Combustion , pp. 2991–2998. The CombustionInstitute.
Xu, S., Aslam, T. & Stewart, D. S. 1997 High resolution numerical simulation of ideal and non-ideal compressible reacting flows with embedded internal boundaries. Combust. Theor. Model.1, 113–142.
Yao, J. & Stewart, D. S. 1995 On the normal shock velocity–curvature relationship for materialswith large activation energy. Combust. Flame 100, 519–528.
Zel’dovich, I. B., Kogarko, S. M. & Simonov, N. N. 1956 An experimental investigation ofspherical detonation of gases. Sov. Phys. Tech. Phys. 1, 1689–1713.