Noninvasive Measurement of Local Thermal Diffusivity Using Backscattered Ultrasound and Focused...
30
NONINVASIVE MEASUREMENT OF LOCAL THERMAL DIFFUSIVITY USING BACKSCATTERED ULTRASOUND AND FOCUSED ULTRASOUND HEATING Ajay Anand * and Peter J. Kaczkowski Center for Industrial and Medical Ultrasound, Applied Physics Laboratory, University of Washington, Seattle, WA, USA. Abstract Previously, noninvasive methods of estimating local tissue thermal and acoustic properties using backscattered ultrasound have been proposed in the literature. In this article, a noninvasive method of estimating local thermal diffusivity in situ during focused ultrasound heating using beamformed acoustic backscatter data and applying novel signal processing techniques is developed. A high intensity focused ultrasound (HIFU) transducer operating at subablative intensities is employed to create a brief local temperature rise of no more than 10°C. Beamformed radio-frequency (RF) data are collected during heating and cooling using a clinical ultrasound scanner. Measurements of the time-varying “acoustic strain”, that is, spatiotemporal variations in the RF echo shifts induced by the temperature related sound speed changes, are related to a solution of the heat transfer equation to estimate the thermal diffusivity in the heated zone. Numerical simulations and experiments performed in vitro in tissue mimicking phantoms and excised turkey breast muscle tissue demonstrate agreement between the ultrasound derived thermal diffusivity estimates and independent estimates made by a traditional hot-wire technique. The new noninvasive ultrasonic method has potential applications in thermal therapy planning and monitoring, physiological monitoring and as a means of noninvasive tissue characterization. Keywords Thermal ablation; Ultrasound treatment monitoring; Tissue characterization; Ultrasonic signal processing; Ultrasound thermometry INTRODUCTION The delivery of an accurate thermal dose is essential for the success of ablative thermal therapies such as high intensity focused ultrasound (HIFU) (Vaezy et al. 1997; Sanghvi et al. 1999; ter Haar 2001; Wu et al. 2002) and radio-frequency ablation (Mahnken et al. 2004; Frericks et al. 2005; Nour and Lewin 2005) in the clinic. The thermal parameters at the ablation site, namely, thermal diffusivity and perfusion loss, play important roles in the final therapeutic outcome as they influence the evolution of temperature distributions in space and time achieved in the tissue. The thermal diffusivity is an intrinsic tissue thermal property that combines the thermal conductivity and the heat capacity to express the rate at which heat dissipates and, Copyright © 2008 World Federation for Ultrasound in Medicine & Biology Printed in the USA. All rights reserved Address correspondence to: Ajay Anand, PhD, Philips Research North America, 345 Scarborough Road, Briarcliff Manor, NY 10510 USA. E-mail: [email protected]. * Present address: Philips Research North America, Briarcliff Manor, NY, USA. NIH Public Access Author Manuscript Ultrasound Med Biol. Author manuscript; available in PMC 2010 March 21. Published in final edited form as: Ultrasound Med Biol. 2008 September ; 34(9): 1449–1464. doi:10.1016/j.ultrasmedbio.2008.02.004. NIH-PA Author Manuscript NIH-PA Author Manuscript NIH-PA Author Manuscript
-
Upload
independent -
Category
Documents
-
view
4 -
download
0
Transcript of Noninvasive Measurement of Local Thermal Diffusivity Using Backscattered Ultrasound and Focused...

NONINVASIVE MEASUREMENT OF LOCAL THERMALDIFFUSIVITY USING BACKSCATTERED ULTRASOUND ANDFOCUSED ULTRASOUND HEATING
Ajay Anand* and Peter J. KaczkowskiCenter for Industrial and Medical Ultrasound, Applied Physics Laboratory, University of Washington,Seattle, WA, USA.
AbstractPreviously, noninvasive methods of estimating local tissue thermal and acoustic properties usingbackscattered ultrasound have been proposed in the literature. In this article, a noninvasive methodof estimating local thermal diffusivity in situ during focused ultrasound heating using beamformedacoustic backscatter data and applying novel signal processing techniques is developed. A highintensity focused ultrasound (HIFU) transducer operating at subablative intensities is employed tocreate a brief local temperature rise of no more than 10°C. Beamformed radio-frequency (RF) dataare collected during heating and cooling using a clinical ultrasound scanner. Measurements of thetime-varying “acoustic strain”, that is, spatiotemporal variations in the RF echo shifts induced by thetemperature related sound speed changes, are related to a solution of the heat transfer equation toestimate the thermal diffusivity in the heated zone. Numerical simulations and experimentsperformed in vitro in tissue mimicking phantoms and excised turkey breast muscle tissue demonstrateagreement between the ultrasound derived thermal diffusivity estimates and independent estimatesmade by a traditional hot-wire technique. The new noninvasive ultrasonic method has potentialapplications in thermal therapy planning and monitoring, physiological monitoring and as a meansof noninvasive tissue characterization.
KeywordsThermal ablation; Ultrasound treatment monitoring; Tissue characterization; Ultrasonic signalprocessing; Ultrasound thermometry
INTRODUCTIONThe delivery of an accurate thermal dose is essential for the success of ablative thermaltherapies such as high intensity focused ultrasound (HIFU) (Vaezy et al. 1997; Sanghvi et al.1999; ter Haar 2001; Wu et al. 2002) and radio-frequency ablation (Mahnken et al. 2004;Frericks et al. 2005; Nour and Lewin 2005) in the clinic. The thermal parameters at the ablationsite, namely, thermal diffusivity and perfusion loss, play important roles in the final therapeuticoutcome as they influence the evolution of temperature distributions in space and time achievedin the tissue. The thermal diffusivity is an intrinsic tissue thermal property that combines thethermal conductivity and the heat capacity to express the rate at which heat dissipates and,
Copyright © 2008 World Federation for Ultrasound in Medicine & Biology Printed in the USA. All rights reservedAddress correspondence to: Ajay Anand, PhD, Philips Research North America, 345 Scarborough Road, Briarcliff Manor, NY 10510USA. E-mail: [email protected].*Present address: Philips Research North America, Briarcliff Manor, NY, USA.
NIH Public AccessAuthor ManuscriptUltrasound Med Biol. Author manuscript; available in PMC 2010 March 21.
Published in final edited form as:Ultrasound Med Biol. 2008 September ; 34(9): 1449–1464. doi:10.1016/j.ultrasmedbio.2008.02.004.
NIH
-PA Author Manuscript
NIH
-PA Author Manuscript
NIH
-PA Author Manuscript

thus, directly influences the time dependence of the temperature distribution in tissue. Perfusionacts as a local sink for excess heat energy by convective transport and depends on the degreeof vascularity at the ablation site and proximity to larger blood vessels. In reality, these tissuespecific thermal parameters are highly variable between tissue types and also acrossindividuals. Hence, noninvasive methods of measuring these thermal parameters at thetreatment location can reduce the uncertainty in therapeutic dose planning and delivery.Development of such technologies could also provide a means of tissue characterization tomonitor physiological response to stimulus, or to detect abnormal tissue pathologies, forexample (Lagendijk et al. 1988; Cheng and Plewes 2002).
Recently, the use of numerical simulation tools to predict the temperature distribution andthermal dose for therapy dosimetry planning applications has been widely reported in theliterature (Meaney et al. 1998; Kolios et al. 1999; Curra 2001). The Pennes bio-heat transferequation (BHTE) (Pennes 1948) is used to compute the temperature distribution and thethermal dose is computed using the formalism proposed by Sapareto and Dewey (1984). Thesesimulation tools typically use a priori knowledge or assume standard values for tissue thermalparameters, namely, thermal diffusivity and perfusion loss. Uncertainties in the knowledge ofthese parameters can result in significant errors in the temperature distribution computed usingthe BHTE and consequently the thermal dose, which is a clinically important indicator of theendpoint of thermal therapy. Providing in situ estimates of the thermal parameters in thetreatment region as inputs to the simulation tools would reduce errors in the predictedtemperature distributions during planning phases and improve the ability of these tools toeffectively adapt to varying local conditions for planning or during treatment.
Imaging techniques based on magnetic resonance imaging (MRI) (Cheng and Plewes 2002)and infrared (IR) imaging (Telenkov et al. 2001) to noninvasively estimate tissue thermaldiffusivity and/or perfusion have been previously reported. However, no ultrasound basednoninvasive method to estimate these parameters has been developed to the best of theknowledge of the authors. An ultrasound-based estimation technique is a more attractive optionfor use with therapy delivery systems because MRI requires specialized therapy equipmentcompatible with high magnetic fields and has lower temporal resolution (frame rate) comparedwith ultrasound imaging. IR imaging methods are limited to estimation of surface thermalmeasurements and may not be suitable for deeper ablation sites due to poor penetration.
Ultrasonic methods of estimating tissue thermal and acoustic properties have been recentlyproposed. Yao and Ebbini (Hui et al. 2004) demonstrated the feasibility of reliably estimatingthe initial heating rate at a localized heating spot by inducing a temperature change on the orderof 1 °C and proposed that the ultrasonically estimated initial heating rate can be used to computethe local tissue absorption. They also demonstrated that the ultrasonically determined initialtemperature decay rate after turning off the heating demonstrates excellent agreement with thedecay rate obtained from invasive thermocouple readings and conclude that the local perfusioncan be estimated from these decay rate measurements. However, no quantitative estimate ofthe local tissue properties, absorption and perfusion, is obtained in that study. Recently, Sumiand Yanagimura (2005, 2007) proposed a technique for reconstructing the thermal propertiessuch as thermal conductivity and diffusivity provided that quantitative spatial and temporaltemperature information of the region-of-interest and reference values of the thermal propertiesare independently measured a priori. The temperature rise in the sample was induced using aheated waterbath. Simulations and experimental results obtained in a tissue mimickingphantom were presented. Practical application of the methods in noninvasive therapymodalities such as HIFU was not presented in that study.
In this article, a noninvasive ultrasound-based technique for estimating the local thermaldiffusivity in situ using focused ultrasound or HIFU heating and application of novel
Anand and Kaczkowski Page 2
Ultrasound Med Biol. Author manuscript; available in PMC 2010 March 21.
NIH
-PA Author Manuscript
NIH
-PA Author Manuscript
NIH
-PA Author Manuscript

backscattered radio-frequency (RF) signal processing techniques is presented. The techniqueis designed such that the thermal diffusivity estimation can be performed in the treatment regionas part of a therapy planning calibration procedure conducted prior to the therapy deliverysession. The theoretical framework underlying the estimation procedure is developed for thein vivo situation using the Green’s function solution for the BHTE including the effect of bulkperfusion as a heat sink. It is shown from the theoretical analysis that the thermal diffusivitycan be obtained by tracking the rate of change of the size of the heated region withoutknowledge of the absolute temperature. The estimated thermal diffusivity can then used as aknown quantity to estimate the unknown perfusion term if information about the heat sourceis available. The effects of heat transport in the presence of a large blood vessel are notconsidered in this theoretical formulation. Since the current experimental work is limited toin vitro scenarios, the estimation of perfusion is not included in the parameter estimation step.Discussions on extending the parameter estimation step to the in vivo case for measuringperfusion are provided. The parameter estimation technique is based on visualizing thespatiotemporal variation of temperature induced strain (Miller et al. 2002, 2004) estimatedfrom the raw ultrasound backscatter data after a short focused ultrasound heating pulse isapplied at subablative intensities. The temperature induced strain is caused by changes in thelocal sound speed of the medium and thermal expansion (Maass-Moreno et al. 1996; Simon etal. 1998; Varghese et al. 2002). The maximum induced temperature rise is less than 10°C toavoid any permanent changes in tissue. A mathematical analysis of the solution to the heattransfer equation illustrates that the spatiotemporal rate of change of the temperature inducedstrain profile transverse to the HIFU beam axis of propagation is directly related to the thermaldiffusivity. The technique is applied to ultrasound backscatter data collected during in vitroexperiments performed in a tissue mimicking phantom and excised turkey breast muscle tissue.
THEORYThe technique adopted in this work for the estimation of the thermal diffusivity is based ondetermining unknown thermal parameters from the BHTE. For the in vitro case, in the absenceof perfusion, the BHTE reduces to the heat transfer equation (HTE). In this analysis, it isassumed that the medium is locally homogenous and isotropic in the local region where thethermal parameters are estimated.
Bio heat transfer equationThe differential equation describing the transient BHTE can be written in axisymmetriccylindrical coordinates as,
(1)
where T(r,z,t) is the temperature change in °C, K is the thermal diffusivity (m2/s), Q(t) (°C/s)represents the local in situ heating rate due to ultrasound energy absorption, I(r,z) is thenormalized spatial acoustic intensity distribution profile (unitless), r represents the axisperpendicular to beam propagation (transverse) and z represents the beam propagation axis(longitudinal). b is given by wbρbCb/ρC, where wb is the blood perfusion rate (ml/s/ml), ρb andρ represent the density of blood and tissue respectively in kg/m3, Cb and C represent the heatcapacity of blood and tissue respectively in J/kg/°C. It may be noted that Q is a scalar numberand I(r,z) is a two-dimensional (2D) matrix of values between 0 and 1 with the rowsrepresenting r and the columns representing z.
Anand and Kaczkowski Page 3
Ultrasound Med Biol. Author manuscript; available in PMC 2010 March 21.
NIH
-PA Author Manuscript
NIH
-PA Author Manuscript
NIH
-PA Author Manuscript

The solution of transient BHTE can be expressed in terms of the Green’s function G and thesource heating term S(r,z,t) in cylindrical coordinates as (Carslaw and Jaeger 1959; Arfken andWeber 2005),
(2)
The Green’s function of the transient BHTE is given by (Vyas and Rustgi 1992),
(3)
where ut′(t) is the unit step function,
(4)
I0(x) is the modified Bessel function of order zero.
The focused ultrasound source is modeled with a Gaussian spatial beam profile along the axial(z) and radial (r) directions as (Parker 1983,1985; Cheng and Roemer 2005),
(5)
where βr and βz represent the ultrasound beam width along r and z, respectively andQacoustic(t) is the acoustic power deposited per unit volume in W/m3.
Substituting eqn 3 and eqn 5 in eqn 2 and rearranging the terms we get,
(6)
Solving the integrals in eqn 6 with respect to r’ and z’ and rearranging the terms,
(7)
Anand and Kaczkowski Page 4
Ultrasound Med Biol. Author manuscript; available in PMC 2010 March 21.
NIH
-PA Author Manuscript
NIH
-PA Author Manuscript
NIH
-PA Author Manuscript

The above equation requires the time integral to be solved numerically. However, by limitingthe focused ultrasound heat source to a short burst of energy of duration t0 applied at t = 0(Newman and Lele 1985;Parker 1985), the impulse approximation can be used to represent theheat source Qacoustic(t) as,
(8)
where, I0 is the peak acoustic intensity, α is the acoustic absorption coefficient.
Substituting eqn 8 in 7, we get the temperature profiles during the decay phase as,
(9)
If the temperature profiles are observed along the radial direction r for a fixed value of z, theabove equation can be expressed as,
(10)
Equation (10) is the product of Ap(t) and a Gaussian curve with width related parameter R(t)= 4Kt + βr at time t. The equation demonstrates that it is possible to estimate the thermaldiffusivity and the perfusion separately in a sequential manner provided (i) A short durationheating pulse (eqn 8) relative to the times for thermal dissipation is applied to induce thetemperature rise, and (ii) Flow is not in large vessels which would result in a directional heatloss but rather through perfusion modeled as a nondirectional heat sink term in the BHTE.
Focused ultrasound beams, such as those employed this article, are particularly well suited toinduce temperature rises rapidly and produce a sharp thermal gradient perpendicular to thedirection of propagation of the acoustic beam. The focal field of a uniformly excited sphericaltransducer is not Gaussian but the focal shape can be well approximated by an equivalentGaussian that is fit by matching average power over the peak. In addition, since the heatingeffect produced by focused beams is local and the proposed thermal diffusivity estimationtechnique is also designed to produce a local estimate around that heated location, the use ofa nondirectional perfusion term as implemented in the BHTE should be valid. If large bloodvessels are present within the parameter estimation region-of-interest that result in a directionalheat sink, the parameter estimation method developed based on eqn 1 and the approximateforms that follow would not be valid.
From eqn 10, K is estimated by tracking the rate of change of R(t) i.e.,
(11)
The estimated thermal diffusivity can then be substituted in Ap(t) to predict the local perfusionb assuming the terms βr, βz are known from the characteristics of the HIFU beam profile. Aspart of the estimation procedure for b, the heat source term 2αI0t0/ρC would also have to bedetermined. This can be performed using an iterative approach such as that proposed by Cheng
Anand and Kaczkowski Page 5
Ultrasound Med Biol. Author manuscript; available in PMC 2010 March 21.
NIH
-PA Author Manuscript
NIH
-PA Author Manuscript
NIH
-PA Author Manuscript

and Plewes (2002) where the heat source and perfusion terms are alternately computed untilthe parameter values converge.
The temperature variation at the center of the focal region (r = 0,z = 0) is,
(12)
The temperature at the center of the focus will decay as a function of t and is affected by theperfusion constant.
The scope of the experimental results presented in this article was limited to in vitro conditionsfor which there is no perfusion. Substituting b = 0 in eqn 9, the BHTE reduces to the HTE andwe get,
(13)
or equivalent to eqn 10,
(14)
where A(t) is equal to Ap(t) with the perfusion constant b set to zero, and R(t) = 4Kt + βr asbefore. Thus, the approach to estimating K relies on measuring the rate of change in transversewidth of the temperature profile near the HIFU focus.
Estimation of thermal diffusivity using backscattered ultrasoundThe estimation of thermal diffusivity using backscattered ultrasound is based on tracking thespatiotemporal evolution of the temperature induced strain profiles. In this approach, a shortheating pulse is applied and the resulting temperature induced strain is measured ultrasonicallyover a period of time sufficient to detect the spatial diffusion of the heat. This section describeshow quantitative estimates of the thermal diffusivity can be obtained from time series of thestrain profiles.
The experimental arrangement, including orientation of the HIFU transducer (used to inducethe local temperature rise) and the position of the ultrasound imaging probe and the samplevolume being interrogated, is illustrated in Fig. 1. For a short HIFU-induced heating pulseapplied at time t = 0, the resulting temperature distribution along the transverse direction r afterthe HIFU pulse has been turned off is modeled by eqn 14. Previously, it has been demonstrated(Simon et al. 1998;Varghese et al. 2002;Pernot et al. 2004) that the temperature-induced strain(ε) measured from the ultrasound radio-frequency (RF) backscatter signal, for smalltemperature rises above ambient temperature, is directly proportional to the inducedtemperature change T(r,t)
(15)
Anand and Kaczkowski Page 6
Ultrasound Med Biol. Author manuscript; available in PMC 2010 March 21.
NIH
-PA Author Manuscript
NIH
-PA Author Manuscript
NIH
-PA Author Manuscript

where k is a scalar constant.
The maximum temperature rise that can be induced depends on the range of temperatures forwhich k is constant to minimize the estimation error resulting from the temperature dependenceof this parameter. For example, based on experiments in turkey muscle tissue, it was reportedthat the strain versus temperature relation is linear for temperature rises up to 10°C (Maass-Moreno et al. 1996; Simon et al. 1998). Miller et. al. (Miller et al. 2002) have reported on thetemperature dependence of k and its variability with tissue composition. For example, in normalliver (low fat content) and fatty liver, k remains nearly constant (from 37°C to around 50 °C),whereas for liver with intermediate fat content k is small and may even change sign. For suchconditions, the method has fundamental limitations and may not work unless the tissue is heatedor cooled to a substantially different operating point.
From eqn 14 and eqn 15, we get,
(16)
where εmax = k A(t) (no perfusion) or k Ap(t) (with perfusion).
In this technique, as long as the parameter k is independent of temperature over the range ofinterest, it is not necessary to know the value of the constant k. The data processing resultindicates the degree to which k is constant with temperature. Integrating eqn 16 along r incylindrical coordinates, the cumulative shift in the ultrasound RF echo locations s(r,t) alongthe imaging beam has the form of the error function erf(x),
(17)
where smax(t) is the peak displacement. From eqn 17, it can be seen that the parameter R(t) canbe obtained from the s(r,t) profile for measurement time t. It is important to note from eqn 17that since the integration is performed with respect to r, the perfusion term contained insmax(t) is separable and allows the thermal diffusivity to be independently estimated.
The above equation does not compensate for the thermal lens effect (decorrelation in the RFsignal due to refraction and refocusing of the US beam during heating) (Simon et al. 1998).The thermal “lens” can lead to aberration of the acoustic imaging beam when lateraltemperature gradients are large compared with the imaging beam width. As a consequence ofthis effect, the shape of s(r,t) in the above equation would deviate from the ideal error functionerf(x), especially distal to the heated zone. Additional sound propagation modeling, signalprocessing and filtering would be required to minimize the errors introduced by this effect inthe parameter estimation process. Simon and Ebbini (Simon et al. 1998, Fig. 12) haveexperimentally demonstrated that the effect is dominant at the ends of the HIFU beam and isnot present in the central region. Based on this observation, care was taken in the experimentaldesign in this work to ensure that only scanlines towards the center of the focal region wereused for analysis to estimate the thermal diffusivity. Placing the HIFU beam in the imagingplane reduces the lateral gradient in the plane at the ends of the HIFU focal zone. Additionally,centering the imaging plane on the HIFU focus minimizes the role of lateral (out of plane)distortion by imposing symmetry.
As indicated in eqn 11, differentiating R(t) with respect to t gives,
Anand and Kaczkowski Page 7
Ultrasound Med Biol. Author manuscript; available in PMC 2010 March 21.
NIH
-PA Author Manuscript
NIH
-PA Author Manuscript
NIH
-PA Author Manuscript

(18)
Equation (18) shows that by computing the rate of change of R(t) versus t, the thermaldiffusivity K can be estimated. The measurement procedure is noninvasive and can use severalultrasound scanlines over a sequence of frames to improve the signal to noise ratio. It may benoted from eqn 17 that errors introduced by the signal processing process in the estimation ofs(r,t) will affect the estimated R(t) and consequently the estimated value of thermal diffusivityK. These signal processing related errors are in addition to the underlying model shortcomingssuch as neglecting thermal lensing, assuming spatial homogeneity in K and neglectingtemperature dependence of K (and k). In many cases, we expect these assumptions to hold andwe present two experimental examples for which the method is successful.
MATERIALS AND METHODSSimulations
To validate the ultrasound RF-based estimation technique for the noninvasive estimation ofthermal diffusivity, simulations were performed by generating backscattered RF scanlinesduring a simulated HIFU exposure and applying the estimation algorithm. The procedureoutlined by Miller and Bamber (Miller et al. 2002) was followed to simulate the effect oftemperature on backscattered RF data. A random scatterer distribution is created with Gaussiandistributed amplitudes while the spacing between the scatterers was derived from a uniformdistribution. Twenty scatterers per wavelength are generated along each scanline to guaranteefully developed speckle. RF waveforms are synthesized by convolution of a system impulseresponse with the point scatterer distribution. In this study, the evolution of the temperaturefield over a 3 cm × 2 cm 2D region around the HIFU focus was computed using an axisymmetricfinite element solution of the heat transfer equation implemented in FEMLAB™ (nowCOMSOL Multiphysics, by COMSOL AB, Stockholm, Sweden). The heat source field wasdefined using the linear acoustic intensity field for a single element transducer with a geometricfocal length of 35 mm and active diameter of 16 mm, operating at 5 MHz; the field of thetransducer used in the experiments was mapped using a hydrophone (Golden Lipstick, 200 µmaperture, SEA, Soquel, CA, USA) to confirm that the simulated beam pattern matched themeasured transducer field. The HIFU ON-time was 5 s and the cool down phase (OFF-time)was observed for 15 s. The simulation parameters are listed in Table 1. The HIFU exposureintensity was chosen such that the maximum temperature reached at the focus was no greaterthan 10°C above ambient temperature (37°C). The temperature maps were converted tocorresponding sound speed using the mapping reported by Bloch et al. (Bloch et al. 1998) forliver tissue, which is a primary tissue of interest for HIFU treatment applications (insimulations, the acoustic strain coefficient k must be specified but its value is not used in theestimation of diffusivity K). For each scanline, the sound speed depth profile was mapped toapparent displacements of the scatterers and new RF backscattered waveforms were computedfor these new scatterer locations. The center frequency of the transmit pulse used in theultrasound imaging system was 8 MHz with a fractional bandwidth of 60%. The signal-to-noise ratio (SNR) of the simulated RF signals was set to 20 dB by the addition of white noise.Imaging RF waveforms were generated at a frame rate of 1 frame per second for the warmingand cooling phases. Fifty realizations of the simulations using different scatterer arrangementswere performed to compute first and second order statistics. For the estimation of K, signalanalysis was performed along scanlines passing through the HIFU focal zone at z = 0 (Fig. 1).The RF waveform shifts s(r,t) and function R(t) were computed by processing each frameacquired during the cool down phase relative to a reference frame acquired before heatingcommenced.
Anand and Kaczkowski Page 8
Ultrasound Med Biol. Author manuscript; available in PMC 2010 March 21.
NIH
-PA Author Manuscript
NIH
-PA Author Manuscript
NIH
-PA Author Manuscript

RF data analysisEquation (17) illustrates that the backscatter waveform shifts s(r,t) can be represented by aclosed functional form and parameterized in terms of smax (maximum amplitude) and R (widthparameter). In this article, a novel parametric estimation approach is employed to estimatesmax and R in eqn 17 from the RF backscatter data collected during the HIFU experiment. Aschematic representation of the estimation technique is presented in Fig. 2. Techniques forestimation of ultrasound echo location shifts s(r,t) between RF data frames acquired from aspatial region-of-interest have been previously used for ultrasound-based temperatureestimation (Simon et al. 1998; Miller et al. 2002; Miller et al. 2004). However, such methodsfirst estimate strain and then apply those estimates to temperature estimation. They do notincorporate knowledge of the underlying physical heat diffusion mechanism in the estimationalgorithm and result in noisy and often biased estimates for strains that occur over distancesthat comprise few imaging wavelengths. The approach presented here estimates thermalparameters smax and R by iterative analysis of the RF data and makes use of thermal diffusionmodeling to guide the solution. The processing is cast as a minimization problem and relieson comparing a reference RF waveform (acquired before heating commenced, at time t = t0)to a post-heating waveform acquired during cool down (t= tcool). As indicated in eqn 17, theheat transfer model is used to predict the displacement (shift) for a particular choice ofparameters (smax, R) and the predicted shift is applied to the heated waveform. The differencebetween the shift-corrected and reference waveforms is minimized by searching over the valuesof (smax, R). This procedure provides an estimate of strain by relating the measured RF shiftsto the underlying heat transfer model for the HIFU heating experiment and is accurate underthe assumptions listed above. Furthermore, final degree of correlation, goodness of fit andapparent degree of linearity in the various results of processing provide clear assessment of thevalidity of several key assumptions.
The steps in the algorithm to find the optimal R(tcool) for a single scanline passing through theheated region are outlined below:
1. s(r,t) is mathematically modeled using eqn 17 with parameters (smax, R) set toreasonable initial guess values for a particular time t = tcool.
2. The RF line acquired at t = tcool is shifted by function s(r, tcool). Each data sample ofthe RF line is shifted by the corresponding value of s(r, tcool). The shifted data pointsare then re-sampled onto the same uniform grid as the reference signal acquired at t= t0. No additional global shift, scaling or any localized corrections other than thatspecified by s(r,t) is applied to the waveform. The shifting operation is similar inprinciple to temporal stretching (Alam and Ophir 1997; Varghese and Ophir 1997)and companding (Chaturvedi et al. 1998) earlier proposed in elasticity imaging.However, it must be noted that the phenomenon of thermal lens effect is not an issuein elasticity imaging as in estimating the temperature induced strain from theultrasound backscatter.
3. The shifted RF line acquired at t = tcool (step 2) and the reference RF line are bothsegmented into N nonoverlapping segments and the normalized zero-lag correlationcoefficient for each segment i is computed using eqn 19. A fixed value of N is chosen.For a 1 cm scanline segment, a typical value of N is 15. In eqn 19, m is total numberof RF samples (typically m = 40) in the segment.
Anand and Kaczkowski Page 9
Ultrasound Med Biol. Author manuscript; available in PMC 2010 March 21.
NIH
-PA Author Manuscript
NIH
-PA Author Manuscript
NIH
-PA Author Manuscript

(19)
4.The total squared error is then computed.
5. The parameters (smax, R) are updated iteratively until the value of err is less than0.002.
The values of smax and R obtained after minimization of err are called the best-fit parameters.Plots of the zero-lag cross-correlation before and after convergence are shown in Fig. 2 (bottompanel). This procedure is repeated for all the RF frames collected during the cool down phase(after HIFU has been turned off) to obtain a set of values of R(t) corresponding to each frame.The optimization algorithm was implemented using the MATLAB (The Mathworks Inc.,Natick, MA, USA) function fminsearch, which is based on the Nelder-Mead Simplex searchtechnique (Nelder and Mead 1965).
Phantom experimentsExperiments were performed in a tissue-mimicking phantom made of alginate based hydrogelcontaining 95% water by weight. The material is simple to prepare, nontoxic, and providesuniform scatterer distributions ideal for speckle tracking studies. The phantom is prepared bydissolving 16 gm of Jeltrate™ dental impression material (Dentsply Caulk Inc., Milford, DE,USA) in 300 ml water while stirring continuously to ensure a homogenous mix. The solutionis degassed under vacuum and allowed to settle for 20 min in specially designed sample holdersof size 5 × 5 × 6.5 cm3 in which the solution solidifies. The sound speed and the acousticattenuation of the phantom at 25°C are measured using the sample replacement technique(Bloch et al. 1998; Madsen et al. 1999) with a pair of 7 mm diameter PVDF transducers (SonicConcepts, Woodinville, WA, USA); measured bulk values for the sample used in this examplewere c = 1483 m/s and α = 0.35 dB/cm/MHz, respectively. The schematic diagram of theexperimental set-up (calipers not shown) is presented in Fig. 3. A 5 MHz HIFU therapytransducer (SU-104, Sonic Concepts, Woodinville, WA, USA) with an aperture diameter of33 mm and a focal depth of 35 mm was used to deliver the HIFU heating pulse. The HIFUtransducer was rigidly attached to a three-dimensional translation stage that allows controlledmotion in increments of 1 mm. The driving electronics for the HIFU transducer consisted of asignal generator (HP 33120, Hewlett Packard, Palo Alto, CA, USA) driving a power amplifier(A300, ENI, Rochester, NY, USA). The imaging probe used was the ATL CL10-5 (PhilipsMedical Systems, Bothell, WA, USA) with a bandwidth of 5 to 10 MHz. Vertical alignmentpins affixed to the base of the sample holder were used to co-register the HIFU beampropagation plane with the imaging plane. Specifically, as part of the alignment procedure, theHIFU transducer is operated in pulse-echo mode and translated using the motion stage untilthe received echo amplitude from the proximal alignment pin is maximized thereby ensuringthat the pins are in the HIFU focal plane; the HIFU transducer is then raised to place the focalregion above the pins. The imaging transducer is mounted on the sample holder such thatalignment pins are visible on B-mode images as straight lines, thus, assuring that the HIFUfocal zone lies within the imaging plane.
RF data frames time-synchronized with the HIFU delivery were acquired using an ATLHDI-1000 ultrasound scanner (Philips Medical Systems, Bothell, WA, USA) during the HIFU
Anand and Kaczkowski Page 10
Ultrasound Med Biol. Author manuscript; available in PMC 2010 March 21.
NIH
-PA Author Manuscript
NIH
-PA Author Manuscript
NIH
-PA Author Manuscript

heating phase lasting 5 s and the cool down phase lasting 15 s. The RF data frames wereacquired at a frame rate of 1 frame per second. A personal computer running a software programdeveloped in LabVIEW™ (National Instruments, Austin, TX, USA) controlled the operationof the entire system (Anand et al. 2003; Anand and Kaczkowski 2004). The RF data weretransferred to the PC at the end of the experiment for offline data analysis. HIFU acousticintensities were chosen such that the maximum temperature rise induced was approximately10°C. The RF data sets were analyzed using the algorithm described in the previous section tocompute R(t) and a least square fit was performed using eqn 7 to estimate the thermal diffusivityK. The experiment and estimation procedure was repeated on five phantom samples preparedusing the same recipe.
The thermal diffusivity (K) was also independently measured for the phantom samples usingthe transient hot-wire technique (Carslaw and Jaeger 1959; Prokop et al. 2003), a standardmethod reported in the heat transfer literature for measuring the thermal properties of solids.The estimates obtained by this method were compared with those obtained using thenoninvasive ultrasound-based estimation procedure. A schematic representation of the imagingplane view of the transient hot-wire experiment set-up is shown in Fig. 4. A nickel-chromium(Ni-Cr) heating wire (Omega Engineering Inc., Stamford, CT, USA) was pulled taut throughthe center of the phantom sample placed in a custom designed aluminum holder. Three 0.2-mm diameter T-type thermocouples with copper-constantan junctions (HYP0-33-1-T-G-60-SMPW-M, Omega Engineering Inc., Stamford, CT, USA) were inserted into the phantomunder ultrasound B-mode guidance to ensure that the thermocouple stayed parallel to theheating wire along its length. The thermocouples were placed at different radial distances fromthe wire, ranging from 2 to 5 mm. The distances from the tip of the thermocouples to the heatingwire were measured using the distance measurement feature with L11-5 transducer (PhilipsMedical Systems, Bothell, WA, USA) on the HDI-1000 clinical ultrasound scanner with aprecision of ±0.1 mm. A programmable DC power supply (PSP-2010, Goodwill Instek Ltd,Chino, CA, USA) was connected to the heating element through a series relay switch used toturn the heating circuit on and off remotely. The thermocouple terminals were connected to adata acquisition module (HP 34970, Hewlett Packard Inc., Palo Alto, CA, USA) to store thetemperature readings in digitized form. A software-based control program developed inLabVIEW™ (National Instruments, Austin, TX, USA) controlled the delivery of electricalpower to the heating wire, and the thermocouple data acquisition. The heating power wasobtained using the voltage drop across and current through the wire, monitored with a pair ofmultimeters throughout the experiment; the measured values were 2 ± 0.01 V and 7 ± 0.01 A,respectively. The total heating time was 90 s and thermocouple data was acquired at 1 Hzthroughout this interval. The maximum temperature rise was no greater than 10 to 15°C toprevent irreversible changes to the sample under test and to prevent formation of gas bubblesat the wire-gel interface. The experiments were performed in four samples prepared using thesame recipe with three data sets acquired in each sample.
The spatiotemporal temperature distribution radially outward from the heating wire duringheating with a constant heat source is approximately described by the following equation inaxisymmetric cylindrical coordinates (Carslaw and Jaeger 1959),
(20)
where the first term, , is a constant and does not vary with time, and the second term isthe exponential integral Ei( − r2/4Kt).q represents the power (W) delivered per unit length of
Anand and Kaczkowski Page 11
Ultrasound Med Biol. Author manuscript; available in PMC 2010 March 21.
NIH
-PA Author Manuscript
NIH
-PA Author Manuscript
NIH
-PA Author Manuscript

the wire, λ represents the thermal conductivity (W/m/°C), K is the thermal diffusivity (m2/s),r represents the radial distance away from the wire (m), and t represents the time (s) after heatingcommenced. It is important to note that in the transient hot-wire method the thermal diffusivityis measured during the application of a constant heat source (using an embedded hot wire) andusing eqn 20, while in the ultrasound based estimation approach the diffusivity is measuredduring cooling after the application of a short focused ultrasound heating pulse using eqn 17.The thermal diffusivity estimates obtained using the two independent methods are thencompared in this article. While eqn 20 and eqn 17 may appear similar in form, 0074hey arederived for very different physical conditions. Equation (20) assumes that the heat source isinfinitely long with negligible diameter surrounded by an infinite solid, and these assumptionsare reasonable for this experimental arrangement. The exponential integral in eqn 20 isevaluated using the function “expint” included in MATLAB ™ (The Mathworks Inc, Natick,MA, USA). Unknown parameters A and thermal diffusivity K are obtained by finding the bestfit to eqn 20 for the thermocouple data. The hot-wire method provides a reference estimate ofthe thermal diffusivity for the phantom material that is independent of the values obtained usingthe new backscattered ultrasound technique described in this work, though experimentaluncertainty primarily due to thermocouple placement error is actually larger than that for theultrasonic approach.
In vitro turkey breast muscle experimentsIn vitro experiments on turkey breast muscle were performed using the same physical set-updescribed above for the phantom study. Prior to the experiments, store bought tissue was cutinto convenient sizes so that pieces could be placed in the sample holders of dimensions 5 × 5× 6.5 cm. The cut samples were then immersed in de-ionized water and degassed under vacuum.The degassing process was continued until no visible outgassing from the sample was evident.This process typically lasted 30–40 min. After degassing, the tissue sample was placed nearthe center of the holder and suspended vertically with the aid of a needle and sewing thread asshown in Fig. 5. Chunks of tissue where the muscle fiber orientation could be visuallyrecognized to be straight were carefully selected for use in the experiment. This orientation isimportant because of the anisotropy of muscle fibers. In muscle, the attenuation along the fibersexceeds that across the fibers by a factor of 2 or 3 (Duck 1990). The sample was then carefullysuspended in the holder ensuring that the direction of propagation of the ultrasound therapyand imaging beam were both perpendicular to the fiber orientation. With the sample held inthis position, alginate gel was poured into the holder to encase the tissue sample. Thisarrangement ensured that the tissue sample was positioned in the center of the holder allowingeasy insertion of thermocouples into the tissue. It also ensured that the ultrasound therapy beamenters through a relatively flat front surface. Not doing so may lead to significant refractionand misalignment of the imaging and therapy beams. The propagation distance through the gelwas approximately 1 cm. The attenuation and sound speed was measured using the samplereplacement technique for each of the samples in the experiment. The average sound speedand attenuation measured over four samples was 1567.8 ± 12.4 m/s and 1.24 ± 0.18 dB/cm/MHz, respectively. These attenuation measurements were performed with the muscle fibersoriented perpendicular to the beam propagation direction. The attenuation values measuredwith the fibers oriented parallel to the beam propagation direction were 2.1 ± 0.16 dB/cm/MHz.The reported values for attenuation in muscle perpendicular and parallel to the fibers are in therange of 0.9–1.4 dB/cm/MHz and 1.6–2.8 dB/cm/MHz, respectively (Duck 1990). Theattenuation of the alginate gel phantom was also independently measured to be 0.34 ± 0.032dB/cm/MHz. It may be noted that the attenuation and sound speed values are not used in thethermal diffusivity computation, but do affect the heating rate and imaging signal-to-noiseratio.
Anand and Kaczkowski Page 12
Ultrasound Med Biol. Author manuscript; available in PMC 2010 March 21.
NIH
-PA Author Manuscript
NIH
-PA Author Manuscript
NIH
-PA Author Manuscript

A brief HIFU exposure at an in situ intensity of about 30 W/cm2 was applied to estimate thethermal diffusivity (K). The exposures were typically 5 s in duration and the diffusivity wasestimated during the cool down period. The actual temperature in the tissue is not needed tomeasure the spatial diffusion rate of the heat pulse.
RESULTSPhantom experiment
Fig. 6 presents model-derived curves for cumulative acoustic strain s(r,t) (Fig. 6a) and localacoustic strain ε(r,t) (Fig. 6b) at various times after the HIFU heating pulse has been turnedoff for a RF data set acquired in the alginate phantom. The local strain ε(r,t) is Gaussian as ineqn 16 and s(r,t) has the form of a error function erf(x) as described in eqn 17. It can be clearlyseen that the width scale parameter R(t) increases as cooling progresses and the maximumamplitude decreases due to thermal diffusion and conservation of energy. Fig. 6c includes plotsof the zero-lag cross-correlation coefficient σi at initial iteration 0 and after final convergenceof the iterative K-estimation algorithm. At iteration 0 of the algorithm, proximal to the HIFUfocal zone, σi is close to unity because no shift in the RF signal due to thermal change appearsbefore the heated zone. Correlation reduces sharply approaching the HIFU focal region andstays low beyond the heated zone. This is consistent with the temperature induced echo-shiftmodel represented by eqn 17. After final convergence of the iterative strain estimationprocedure, σi is close to unity over all depths, illustrating that the model properly accountedfor the shifts in the post-heated RF scanline caused by temperature rise. As noted before, s(r,t) does not include the influence of the thermal lens effect, yet the method produces highlycorrelated results even for regions distal to the HIFU focus. This case illustrates how to evaluatethe degree to which the thermal lens effect may interfere with the method.
The estimated R(t) values are plotted as a function of time t in Fig. 7a and a least squares linearfit to the data points based on eqn 18 is shown. Note the good agreement (r = 0.96) of the datawith the straight line model, indicating a constant value of K for the experiment. The linearityof the model also indicates that the strain coefficient k is constant over this range oftemperatures, within experimental accuracy. Thermal diffusivity calculated using eqn 18 is1.72 × 10−7 m2/s for this phantom sample. The mean estimate of K obtained noninvasively forthe five phantom samples analyzed is 1.7 ± 0.07 × 10⁻⁷ m2/s. Fig. 7b is a plot of the meanvalue of R(t) for the five different samples as a function of time. The error bars represent thestandard deviation in the R(t) estimate at each time instant. The good agreement between thedata points and the linear fit demonstrates the robustness of the technique for the experimentalconditions in this work.
Fig. 8a illustrates the typical temperature profiles obtained during the transient hotwireexperiments and the superimposed analytical fit to the temperature data using eqn 20. Fig. 8bshows the residual error in the fit. The mean value of K estimated using this technique in foursamples is (1.44 ± 0.2) × 10−7 m2/s.
SimulationsFig. 9 illustrates the histogram of the ratio of estimated thermal diffusivity (Kest) and the truediffusivity (Ktrue) for 50 realizations in the simulation. The estimated mean value was 0.994and the standard deviation was 0.089. This close match between the noninvasive estimate andtrue value illustrates the precision of the estimator used in the ultrasound based noninvasivetechnique for estimating K and suggests very little bias in the method.
Anand and Kaczkowski Page 13
Ultrasound Med Biol. Author manuscript; available in PMC 2010 March 21.
NIH
-PA Author Manuscript
NIH
-PA Author Manuscript
NIH
-PA Author Manuscript

In vitro turkey breast muscle experimentsA plot of R(t) as a function of time during cool down (beginning immediately after heating wasturned off) is shown in Fig. 10a for one of the samples tested. The slope of the linear fit to thedata points leads to the thermal diffusivity: 1.42 × 10⁻⁷ m2/s for this sample. The uncertaintyin this estimate at the 95% confidence level is 0.3 × 10⁻⁷ m2/s. The thermal diffusivity estimatesobtained for the remaining samples tested are 1.18 × 10⁻⁷, 1.3 × 10⁻⁷ and 1.55 × 10⁻⁷ m2/s.The variation in the diffusivity values is possibly due to the local heterogeneities and inter-sample variability that would be expected between independent tissue samples. Fig. 10b is aplot of the mean value of R(t) for the four different tissue samples as a function of time. Theerror bars represent the standard deviation in the R(t) estimate at each time instant. Forcomparison, the reported range of thermal diffusivity values in the literature for muscle is 1.25–1.54 × 10⁻⁷ m2/s (Duck 1990). The values estimated from our experimental noninvasivemeasurements for turkey breast tissue fall in this range.
DISCUSSIONThe noninvasive estimation of tissue thermal and acoustic properties using ultrasoundbackscatter has been previously proposed. Yao and Ebbini (Hui et al. 2004) demonstrated thatthe ultrasound backscatter provides information to estimate the acoustic absorption and thetissue perfusion following a short ultrasound heating pulse. However, no quantitative estimatesof these parameters were presented. Recently, Sumi and Yanagimura (2005 and 2007) proposeda technique for reconstructing the thermal properties such as thermal conductivity anddiffusivity. The temperature rise in the sample was induced using a heated waterbath. Practicalapplication of the methods in noninvasive therapy modalities such as HIFU was not presentedin that study. Unique to this article is the development of a noninvasive ultrasound basedapproach to obtain quantitative absolute estimates of the thermal diffusivity by focusedultrasound heating. Furthermore, ultrasound strain estimation is performed using a newiterative heat transfer model-based signal processing algorithm. The method is intended tofacilitate HIFU therapy planning but the small transverse beam width of the HIFU focus andthe ease of delivering a short duration heating pulse present distinct advantages for generalestimation of thermal diffusivity, and perhaps for capillary bed perfusion. In our experimentalset-up, the ultrasound imaging scanlines are oriented transverse to the HIFU beam (Fig. 1). Itis advantageous to image the temperature evolution in this direction since the thermal gradientsare greater (compared with imaging in parallel with the HIFU beam), thus, providing greatersensitivity to spatial rates of thermal dissipation. The estimation approach was demonstratedin an in vitro experimental set-up in a gel phantom and in turkey breast tissue. Using a shortultrasound heating pulse permits simplification of the solution to the BHTE such that thediffusivity and the tissue perfusion can be separately estimated, provided the underlying BHTEmodel in eqn 1 is valid. The presence of large blood vessels in the region of interest wouldinvalidate assumptions of homogeneity of acoustic and thermal parameters near the HIFUfocus.
The results from the numerical simulations of HIFU induced acoustic strain demonstrated thatunder realistic ultrasound signal-to-noise conditions, K can be estimated compared to theground truth value input in the simulations with a variation of less than 10%. The simulationsprovide a means to select the signal processing parameters and predict the lower bound of theestimation accuracy that can be expected with the algorithm. Experimental variation in theestimate of diffusivity would be expected to be greater than that obtained through thesesimulations which used Gaussian particle distribution statistics. In phantoms, the estimates ofK independently obtained using the invasive transient hot-wire method and the noninvasivemethod showed a difference of approximately 15%. The hot-wire method was used forcomparison because it is a standard method of estimating the thermal properties of solid
Anand and Kaczkowski Page 14
Ultrasound Med Biol. Author manuscript; available in PMC 2010 March 21.
NIH
-PA Author Manuscript
NIH
-PA Author Manuscript
NIH
-PA Author Manuscript

materials in the heat transfer literature. However, there exist significant discrepancies betweenthe governing equation describing the heat flow (eqn 20) and the experimental arrangementfor the hot-wire method. For example, the estimation procedure includes a number ofassumptions regarding the geometry of the heat source and sample, thermal properties of theheating wire, and heat transfer between the heating wire and the sample being tested (indeed,boiling at the wire surface is difficult to avoid). Based on a detailed quantitative error analysisincorporating model errors and experimental measurement errors, Hammerschmidt and Sabuga(2000) showed that the expected uncertainty in the thermal diffusivity from a hot-wiretechnique can be on the order of 30%. Another major source of uncertainty in the hotwiremethod specific to our experimental set-up is the distance between the thermocouples and theheating wire and orientation of the thermocouples. Since r2/4K appears as a lumped term ineqn 20, any errors in the measured distance strongly influences the diffusivity estimate. Forexample, an error of 0.2 mm in a thermocouple placed 2 mm from the wire results in an errorof 20% in the estimated diffusivity. Given these challenges with the hot-wire method, we canonly conclude that the two independent methods are in experimental agreement. In fact, theultrasonic estimation technique using a HIFU source has significant advantages: i) thediffusivity estimation is based on data collected at multiple points along a complete scanlinecompared with a set of discrete thermocouple measurements, ii) the presence of the heatingsource (HIFU beam) does not affect the integrity of the sample as long as the temperature riseis small to prevent irreversible damage, and iii) the heat transfer from the HIFU focus to thesurrounding medium is continuous. Finally, the ultrasonic approach is noninvasive.Experiments were also performed in excised turkey breast. The hot-wire method was not usedin these turkey breast experiments because of experimental difficulty in visualizing thethermocouples amid the field of bright tissue scatterers present in the background. Theestimates of K obtained in excised turkey breast samples showed good agreement with thepublished literature values.
Accurate estimation of echo location shifts s(r,t) is important to minimize errors in theultrasonic estimates of K. In this study, no attempt was made to optimize the signal processingparameters such as RF data sampling rate, imaging and HIFU transducer frequency, cross-correlation window length (N) and thresholds in the optimization routines used in the estimationtechnique. A detailed error analysis would be necessary in a future study to understand howchoice of these parameters affect s(r,t) estimates and, consequently, the uncertainties in K.Nevertheless, the results of this study clearly demonstrate that the local thermal diffusivity canbe noninvasively estimated from the RF data acquired during brief HIFU exposures atsubablative intensities.
A scanline based (one-dimensional [1D]) RF processing scheme was adopted in this article toestimate K with the lateral scan direction of the imaging transducer oriented parallel to theHIFU beam propagation direction. RF lines near the center of the HIFU focal region were usedin the analysis. This is consistent with the orientation recommended by Simon and Ebbini(Simon et al. 1998) to minimize the acoustic thermal lens effect (decorrelation in the RF signaldue to refraction and refocusing of the US beam during heating) because the thermal gradientsacross the imaging transducer aperture are smaller near the center as compared to the edges ofthe HIFU focal region. Extension of the 1D based approach to a 2D estimation techniqueperformed over multiple adjacent scan lines in the heated region might benefit fromincorporating the thermal lens effect in an appropriate numerical model (Alaniz et al. 2002) tominimize model inconsistencies. Additional signal processing and filtering could be performedon the raw ultrasound backscatter data to reduce the spatial ripple introduced by the thermallens effect (Simon et al. 1998). In another recent approach proposed to mitigate the effect, theconventional beamforming on transmit was replaced by multiple steered plane waveinsonifications using several subapertures. The results demonstrated that the artifact is reducedby averaging the 2D maps from the multiple steered plane wave insonifications. The averaged
Anand and Kaczkowski Page 15
Ultrasound Med Biol. Author manuscript; available in PMC 2010 March 21.
NIH
-PA Author Manuscript
NIH
-PA Author Manuscript
NIH
-PA Author Manuscript

temperature induced strain map could be combined with the proposed approach presented inthis article to estimate R(t) and the thermal diffusivity (Pernot et al. 2004). Nevertheless, in theexperiments presented here, thermal lens aberration was not severe enough to preclude strainestimation using the new BHTE-constrained algorithm, both proximal and distal to the HIFUfocal zone.
In this analysis, the medium was considered to be spatially homogenous and isotropic and theanisotropy of thermal properties in muscle is unknown and was neglected. In heterogeneousmedia, spatial variations in the thermal properties can be expected. To account for these spatialvariations, measurements of the local thermal diffusivity at a number of spatial locations withinthe region of interest can be repeated to construct a spatial map of thermal properties. Themaximum temperature rise induced in the sample to perform the thermal diffusivity estimationwas less than 10°C and it was assumed that the thermal diffusivity remains constant with respectto temperature in this range. For the in vitro experimental results presented in this study, theexcellent fit to the linear model (Fig. 7 and Fig. 10) provide confidence in the validity of thiskey assumption. The threshold for thermal ablation is typically close to 60–70°C (i.e., 20–30°C temperature rise from 37°C). Further experimental studies are required to understand whetherthe temperature dependence of thermal diffusivity is significant in the regimes involved inablative thermal therapy in vivo. The proposed methods in this article could be used to performrepeat measurements of the diffusivity to understand its temperature sensitivity at elevatedtemperatures. The diffusivity can be estimated for small local temperature rises starting froman elevated baseline temperature and these measurements can be carried out successively oversmall temperature ranges for which the diffusivity is constant until the coagulation thresholdis reached. The temperature dependence beyond the ablation threshold is less relevant in HIFUtherapy since the clinical goal is to be able to monitor the treatment accurately until ablationhas been reached. The temperature dependence of diffusivity was also not considered by anumber of previous authors who developed simulation programs to predict the temperaturerise during HIFU (Meaney et al. 1998;Curra 2001). Their results showed good agreementbetween simulated temperature profiles and measured temperature estimates fromthermocouples in vitro.
The methods developed in this article can be used in therapy planning applications to computethe thermal dose at the treatment site for a given exposure protocol. Currently, these therapyplanning procedures typically use standard values for the thermal parameters derived from theliterature. In situ estimates can reduce the uncertainty in the knowledge of these parametersand thus improve the accuracy of the predicted results, and the new method is performednoninvasively without ablating the tissue. The experimental results in this article were limitedto the estimation of thermal diffusivity. In an in vivo setting, tissue perfusion and its variabilitywould play a significant role in the local temperature evolution. Future work would addressthe estimation of tissue perfusion in vivo by extending the methods developed in this article.In the absence of large blood vessels resulting in a directional heat sink, an exponential decayterm would adequately model the perfusion in capillary beds and predict the temperatureevolution. The method presented here improves upon conventional elastographic processingtechniques for estimating strain because it constrains the solution using the heat transfer model.This approach has application in noninvasive estimation of temperature rise as well and weuse this thermal diffusivity estimation algorithm as part of a calibration procedure for HIFUtherapy monitoring (Kaczkowski and Anand 2004).
This study examined the feasibility of a noninvasive ultrasonic estimation of thermal diffusivityunder in vitro conditions. Convective heat loss due to proximity to a blood vessel requiresdetailed study and the next step in the research is to extend the method to in vivo conditions.In addition to heat loss from vascularity and perfusion, potential complications include motionartifacts from respiration, cardiac pulsation and bulk motion of transducer assembly (especially
Anand and Kaczkowski Page 16
Ultrasound Med Biol. Author manuscript; available in PMC 2010 March 21.
NIH
-PA Author Manuscript
NIH
-PA Author Manuscript
NIH
-PA Author Manuscript

for freehand scanning) that can preclude cross-correlation analysis. Although the experimentalmethods developed in this article employed HIFU devices, the same techniques can be appliedto other forms of thermal ablation including radio-frequency ablation and microwave therapy.The heat transfer equations would need to be modified accordingly to include the geometry ofthe heat source and appropriate boundary conditions.
CONCLUSIONSA noninvasive technique for estimating local thermal diffusivity using ultrasound backscatterdata is developed and presented in this article. The method uses a highly focused ultrasonicsource to develop a localized heat impulse in a medium and deduces the diffusivity fromultrasonic backscatter measurements of spatial and temporal rates of heat dissipation. Themaximum temperature rise is small (less than 10°C) and the sound speed is assumed to varylinearly with temperature; thus, temperature variations induce proportional apparentdisplacements of scatterers in the medium that shift the backscattered waveforms over thedissipation time. A heat transfer model that takes advantage of the impulsive heat source isused to develop a spatio-temporal template for the dissipation of the heat pulse. A significantadvance in acoustic strain estimation provided by the method presented here is the use of theheat transfer model to constrain the estimation of the heat diffusivity by fitting the ultrasonicRF waveform curves using the model templates and, thus, optimally compensate for thetemperature induced strain. The applicability of this technique to estimate the diffusivityparameter can be extended to assess the heterogeneity of biological tissue and to constructspatial maps of the variation of this and other tissue specific thermal parameters. The techniquesdeveloped in this article have potential applications in thermal therapy planning andmonitoring, by noninvasively and nondestructively determining tissue thermal propertiesspecific to the patient and organ at the site of interest. Extension of the method to in vivoconditions is nontrivial, as motion artifacts and variable vascularization and perfusion rateswill require modification of the model. Furthermore, validation of the method in vivo willrequire significantly more complicated experimental arrangements.
AcknowledgmentsThe authors thank Andrew Proctor for help with the experiment set-up. This work was supported in part by U.S. ArmyMRMC/TATRC (DAMD 17-002-0063, DAMD 17-02-2-0014), and Office of Naval Research (N00014-01-G-0460),and NIH-NCI (R01 CA109557-01).
REFERENCESAlam S, Ophir J. Reduction of signal decorrelation from mechanical compression of tissues by temporal
stretching: Applications to elastography. Ultrasound Med Biol 1997;23:95–105. [PubMed: 9080622]Alaniz A, Kallel F, Hungerford E, Ophir J. Variational method for estimating the effects of continuously
varying lenses in HIFU, sonography, and sonography-based cross-correlation methods. J Acoust SocAm 2002;111:468–474. [PubMed: 11831822]
Anand A, Kaczkowski PJ. Monitoring formation of high intensity focused ultrasound (HIFU) inducedlesions using backscattered ultrasound. Acoust Res Lett Online 2004;5:88–94.
Anand, A.; Kaczkowski, PJ.; Daigle, R.; Huang, L.; Crum, LA. SPIE Medical Imaging. San Diego, CA:SPIE; 2003. Using the ATL HDI-1000 Ultrasound Scanner for monitoring HIFU-induced lesionformation.
Arfken, G.; Weber, HJ. Mathematical methods for physicists. 6th Edition. San Diego, CA: AcademicPress; 2005.
Bloch SH, Bailey MR, Crum LA, Kaczkowski PJ, Keilman GW, Mourad PD. Measurements of soundspeed in excised tissue over temperatures expected under high-intensity focused ultrasound conditions.J Acoust Soc Am 1998;103:2868.
Carslaw, HS.; Jaeger, JC. Conduction of heat in solids. Oxford: Clarendon Press; 1959.
Anand and Kaczkowski Page 17
Ultrasound Med Biol. Author manuscript; available in PMC 2010 March 21.
NIH
-PA Author Manuscript
NIH
-PA Author Manuscript
NIH
-PA Author Manuscript

Chaturvedi P, Insana MF, Hall T. 2D companding for noise reduction in strain imaging. IEEE TransUltrason Ferroelectr Freq Control 1998;45:179–191. [PubMed: 18244170]
Cheng H-LM, Plewes DB. Tissue thermal conductivity by magnetic resonance thermometry and focusedultrasound heating. J Magn Reson Imaging 2002;16:598–609. [PubMed: 12412038]
Cheng KS, Roemer RB. Blood perfusion and thermal conduction effects in Gaussian beam, minimumtime single-pulse thermal therapies. Med Phys 2005;32:311–317. [PubMed: 15789574]
Curra, F. Bioengineering. Seattle: University of Washington; 2001. Medical ultrasound algorithm fornoninvasive high intensity ultrasound applications.
Duck, F. Physical properties of tissue: A comprehensive reference work. New York: Elsevier Science &Technology Books; 1990.
Frericks BB, Ritz JP, Roggan A, Wolf KJ, Albrecht T. Multipolar radiofrequency ablation of hepatictumors: Initial experience. Radiology 2005;237:1056–1062. [PubMed: 16237132]
Hammerschmidt U, Sabuga W. Transient hot-wire (THW) method: Uncertainty assessment. Int JThermophys 2000;21:1255–1278.
Hui, Y.; Griffin, R.; Ebbini, ES. Noninvasive localized ultrasonic measurement of tissue properties; IEEEUltrason Symp; 2004. p. 724-727.
Kaczkowski, PJ.; Anand, A. Temperature rise measured noninvasively during thermal therapy usingcorrelated backscattered ultrasound; IEEE Ultrason Symp Montreal; Canada. 2004.
Kolios MC, Sherar MD, Hunt JW. Temperature dependent properties and ultrasound thermal therapy.Advances in heat and mass transfer in biotechnology 1999;HTD-Vol363/BED-Vol44:113–118.
Lagendijk JJ, Hofman P, Schipper J. Perfusion analyses in advanced breast carcinoma duringhyperthermia. Int J Hyperthermia 1988;4:479–495. [PubMed: 3292667]
Maass-Moreno R, Damianou CA, Sanghvi NT. Noninvasive temperature estimation in tissue viaultrasound echo-shifts. Part II. In vitro study. J Acoust Soc Am 1996;100:2522–2530. [PubMed:8865655]
Madsen EL, Dong F, Frank GR, Garra BS, Wear KA, Wilson T, Zagzebski JA, Miller HL, Shung KK,Wang SH, Feleppa EJ, Liu T, O’Brien WD Jr, Topp KA, Sanghvi NT, Zaitsev AV, Hall TJ, FowlkesJB, Kripfgans OD, Miller JG. Interlaboratory comparison of ultrasonic backscatter, attenuation, andspeed measurements. J Ultrasound Med 1999;18:615–631. [PubMed: 10478971]
Mahnken AH, Gunther RW, Tacke J. Radiofrequency ablation of renal tumors. Eur Radiol 2004;14:1449–1455. [PubMed: 15150668]
Meaney PM, Clarke RL, ter Haar GR, Rivens IH. A 3D finite-element model for computation oftemperature profiles and regions of thermal damage during focused ultrasound surgery exposures.Ultrasound Med Biol 1998;24:1489–1499. [PubMed: 10385970]
Miller NR, Bamber JC, Meaney PM. Fundamental limitations of noninvasive temperature imaging bymeans of ultrasound echo strain estimation. Ultrasound Med Biol 2002;28:1319–1333. [PubMed:12467859]
Miller NR, Bamber JC, ter Haar GR. Imaging of temperature-induced echo strain: preliminary in vitrostudy to assess feasibility for guiding focused ultrasound surgery. Ultrasound Med Biol 2004;30:345–356. [PubMed: 15063516]
Nelder JA, Mead R. A simplex method for function minimization. Comput J 1965:308–313.Newman WH, Lele PP. A transient heating technique for the measurement of thermal properties of
perfused biological tissue. J Biomech Eng 1985;107:219–227. [PubMed: 4046562]Nour SG, Lewin JS. Radio-frequency thermal ablation: The role of MR imaging in guiding and
monitoring tumor therapy. Magn Reson Imaging Clin N Am 2005;13:561–581. [PubMed: 16084420]Parker KJ. The thermal pulse decay technique for measuring ultrasonic absorption coefficients. J Acoust
Soc Am 1983;74:1356–1361.Parker KJ. Effects of heat conduction and sample size on ultrasonic absorption measurements. J Acoust
Soc Am 1985;77:719–725. [PubMed: 3973241]Pennes HH. Analysis of tissue and arterial blood temperatures in the resting human forearm. J Appl
Physiol 1948;1:93–122. [PubMed: 18887578]
Anand and Kaczkowski Page 18
Ultrasound Med Biol. Author manuscript; available in PMC 2010 March 21.
NIH
-PA Author Manuscript
NIH
-PA Author Manuscript
NIH
-PA Author Manuscript

Pernot M, Tanter M, Bercoff J, Waters KR, Fink M. Temperature estimation using ultrasonic spatialcompound imaging. IEEE Trans Ultrason Ferroelectr Freq Control 2004;51:606–615. [PubMed:15217237]
Prokop AF, Vaezy S, Noble ML, Kaczkowski PJ, Martin RW, Crum LA. Polyacrylamide gel as anacoustic coupling medium for focused ultrasound therapy. Ultrasound Med Biol 2003;29:1351–1358.[PubMed: 14553813]
Sanghvi NT, Foster RS, Bihrle R, Casey R, Uchida T, Phillips MH, Syrus J, Zaitsev AV, Marich KW,Fry FJ. Noninvasive surgery of prostate tissue by high intensity focused ultrasound: An updatedreport. Eur J Ultrasound 1999;9:19–29. [PubMed: 10099163]
Sapareto SA, Dewey WC. Thermal dose determination in cancer therapy. Int J Radiat Oncol Biol Phys1984;10:787–800. [PubMed: 6547421]
Simon C, VanBaren P, Ebbini ES. Two-dimensional temperature estimation using diagnostic ultrasound.IEEE Trans Ultrason Ferroelectr Freq Control 1998;45:1088–1099. [PubMed: 18244264]
Sumi, C.; Yanagimura, H. Reconstruction of thermal property distributions - thermal conductivity,diffusivity, capacity; IEEE Ultrason Symp; 2005. p. 18-21.
Sumi C, Yanagimura H. Reconstruction of thermal property distributions of tissue phantoms fromtemperature measurements-thermal conductivity, thermal capacity and thermal diffusivity. Phys MedBiol 2007;52:2845–2863. [PubMed: 17473355]
Telenkov SA, Youn JI, Goodman DM, Welch AJ, Milner TE. Noncontact measurement of thermaldiffusivity in tissue. Phys Med Biol 2001;46:551–558. [PubMed: 11229733]
ter Haar G. Acoustic Surgery. Phys Today 2001;54:29.Vaezy S, Martin R, Schmiedl U, Caps M, Taylor S, Beach K, Carter S, Kaczkowski P, Keilman G, Helton
S, Chandler W, Mourad P, Rice M, Roy R, Crum L. Liver hemostasis using high-intensity focusedultrasound. Ultrasound Med Biol 1997;23:1413–1420. [PubMed: 9428140]
Varghese T, Ophir J. Enhancement of echo-signal correlation in elastography using temporal stretching.IEEE Trans Ultrason Ferroelectr Freq Control 1997;44:173–180. [PubMed: 18244115]
Varghese T, Zagzebski JA, Chen Q, Techavipoo U, Frank G, Johnson C, Wright A, Lee FT Jr. Ultrasoundmonitoring of temperature change during radio-frequency ablation: Preliminary in vivo results.Ultrasound Med Biology 2002;28:321–329.
Vyas R, Rustgi ML. Green’s function solution to the tissue bioheat equation. Med Phys 1992;19:1319–1324. [PubMed: 1435617]
Wu F, Chen W-Z, Bai J, Zou J-Z, Wang Z-L, Zhu H, Wang Z-B. Tumor vessel destruction resulting fromhigh-intensity focused ultrasound in patients with solid malignancies. Ultrasound Med Biol2002;28:535–542. [PubMed: 12049967]
Anand and Kaczkowski Page 19
Ultrasound Med Biol. Author manuscript; available in PMC 2010 March 21.
NIH
-PA Author Manuscript
NIH
-PA Author Manuscript
NIH
-PA Author Manuscript

Fig. 1.Schematic illustration of the orientation of HIFU therapy transducer, ultrasound imagingtransducer and location of the geometric focal spot of the therapy transducer.
Anand and Kaczkowski Page 20
Ultrasound Med Biol. Author manuscript; available in PMC 2010 March 21.
NIH
-PA Author Manuscript
NIH
-PA Author Manuscript
NIH
-PA Author Manuscript

Fig. 2.Flowchart of technique to estimate smax and R in eqn 17.
Anand and Kaczkowski Page 21
Ultrasound Med Biol. Author manuscript; available in PMC 2010 March 21.
NIH
-PA Author Manuscript
NIH
-PA Author Manuscript
NIH
-PA Author Manuscript

Fig. 3.Schematic of experimental set-up for ultrasound thermal diffusivity estimation.
Anand and Kaczkowski Page 22
Ultrasound Med Biol. Author manuscript; available in PMC 2010 March 21.
NIH
-PA Author Manuscript
NIH
-PA Author Manuscript
NIH
-PA Author Manuscript

Fig. 4.Schematic of experimental set-up for transient hot-wire technique
Anand and Kaczkowski Page 23
Ultrasound Med Biol. Author manuscript; available in PMC 2010 March 21.
NIH
-PA Author Manuscript
NIH
-PA Author Manuscript
NIH
-PA Author Manuscript
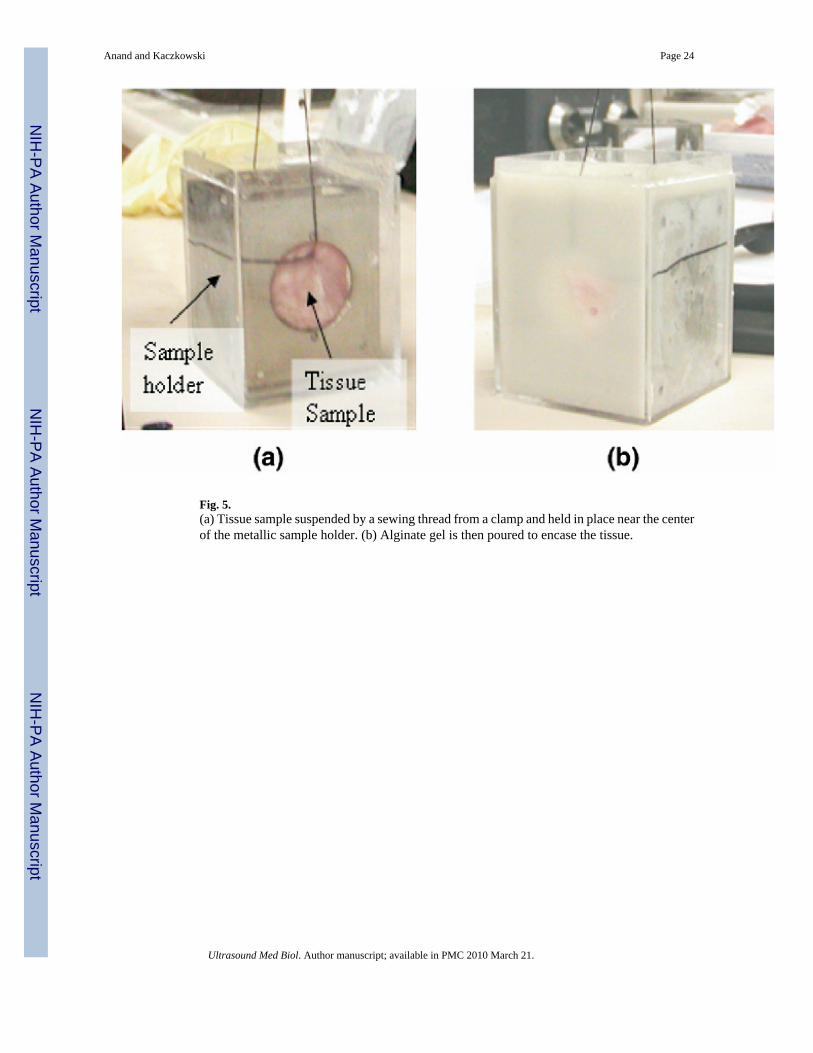
Fig. 5.(a) Tissue sample suspended by a sewing thread from a clamp and held in place near the centerof the metallic sample holder. (b) Alginate gel is then poured to encase the tissue.
Anand and Kaczkowski Page 24
Ultrasound Med Biol. Author manuscript; available in PMC 2010 March 21.
NIH
-PA Author Manuscript
NIH
-PA Author Manuscript
NIH
-PA Author Manuscript

Fig. 6.(a) s(r,t) and (b) ε(r,t) from t = 1 s (after start of cool down) to t = 15 s at intervals of 2 s forRF scanline passing through center of HIFU focal region (c) Zero-lag cross-correlation σiversus depth at iteration 0 (o) and at final convergence (μ) of the model-based strain estimationalgorithm at time t=1 s after start of cooling.
Anand and Kaczkowski Page 25
Ultrasound Med Biol. Author manuscript; available in PMC 2010 March 21.
NIH
-PA Author Manuscript
NIH
-PA Author Manuscript
NIH
-PA Author Manuscript

Fig. 7.(a) Plot of R(t) versus time t estimated from a RF data set acquired in the alginate phantom.The straight line represents a least squares linear fit to the data points. (b) Plot of the meanvalue of R(t) versus t from data collected in five independent phantom samples. The error barsrepresent the standard deviation in R(t).
Anand and Kaczkowski Page 26
Ultrasound Med Biol. Author manuscript; available in PMC 2010 March 21.
NIH
-PA Author Manuscript
NIH
-PA Author Manuscript
NIH
-PA Author Manuscript
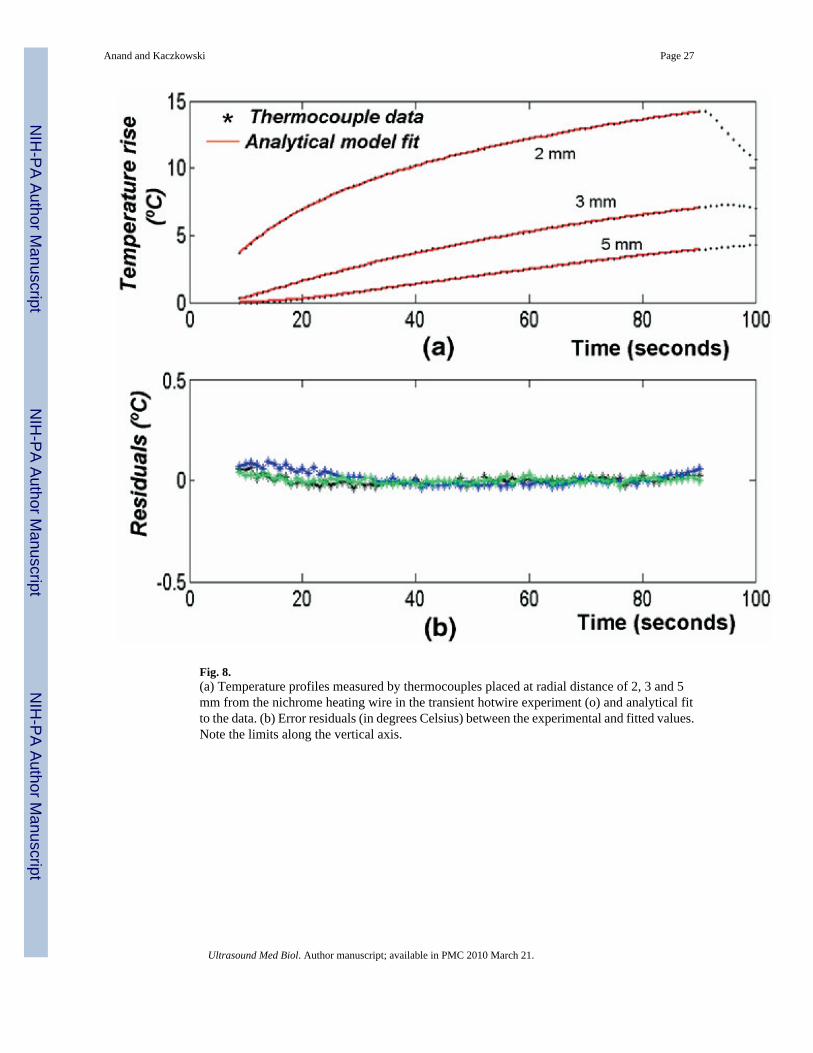
Fig. 8.(a) Temperature profiles measured by thermocouples placed at radial distance of 2, 3 and 5mm from the nichrome heating wire in the transient hotwire experiment (o) and analytical fitto the data. (b) Error residuals (in degrees Celsius) between the experimental and fitted values.Note the limits along the vertical axis.
Anand and Kaczkowski Page 27
Ultrasound Med Biol. Author manuscript; available in PMC 2010 March 21.
NIH
-PA Author Manuscript
NIH
-PA Author Manuscript
NIH
-PA Author Manuscript

Fig. 9.Histogram illustrating distribution of estimated thermal conductivity (Kest) relative to truevalue (Ktrue) under simulated conditions at an ultrasonic SNR of 20 dB over 50 independenttrials.
Anand and Kaczkowski Page 28
Ultrasound Med Biol. Author manuscript; available in PMC 2010 March 21.
NIH
-PA Author Manuscript
NIH
-PA Author Manuscript
NIH
-PA Author Manuscript

Fig. 10.(a) Plot of R(t) versus time t estimated from a RF data set acquired in turkey breast muscle.The straight line represents a least squares linear fit to the data points. (b) Plot of the meanvalue of R(t) vs. t from data collected in four turkey breast tissue samples. The error barsrepresent the standard deviation in R(t).
Anand and Kaczkowski Page 29
Ultrasound Med Biol. Author manuscript; available in PMC 2010 March 21.
NIH
-PA Author Manuscript
NIH
-PA Author Manuscript
NIH
-PA Author Manuscript

NIH
-PA Author Manuscript
NIH
-PA Author Manuscript
NIH
-PA Author Manuscript
Anand and Kaczkowski Page 30
Table 1
Ultrasound and thermal parameter values used in simulation to generate RF data for noninvasive estimation ofthermal diffusivity
Center frequency (MHz) 8 MHz, 60% bandwidth
Scatterer density 20 per wavelength
Sound speed (m/s) 1540
Ultrasonic SNR (dB) 20
Sampling rate (MHz) 32
HIFU ON time (s) 5
HIFU frequency (MHz) 5
Initial temperature (°C) 25
Thermal conductivity (W/m/°C) 0.7
Heat capacity (J/kg/°C) 4180
Density (kg/m3) 1000
SNR = signal-to-noise ratio; HIFU = high intensity focused ultrasound; RF = radio-frequency.
Ultrasound Med Biol. Author manuscript; available in PMC 2010 March 21.