ULTRASOUND CONTRAST AGENTS FOR IMAGING AND ...
283
ULTRASOUND CONTRAST AGENTS FOR IMAGING AND THERAPY Tom van Rooij
-
Upload
khangminh22 -
Category
Documents
-
view
2 -
download
0
Transcript of ULTRASOUND CONTRAST AGENTS FOR IMAGING AND ...

ULTRASOUND CONTRAST AGENTS FOR IMAGING AND THERAPY
Tom van Rooij

Ultrasound Contrast Agents for
Imaging and Therapy
Echocontrastmiddelen voor beeldvorming en therapie
Tom van Rooij
COLOPHON ISBN: 9789462335165 Cover design: Flip Vossen & Tom van Rooij Printed by: Gildeprint, Enschede, the Netherlands
© 2016 T. van Rooij, the Netherlands Except for the following chapters:
Chapter 2: © 2015 Taylor and Francis Online
Chapter 4: © 2014 WILEY‐VCH Verlag GmbH & Co
Chapter 5: © 2015 World Federation for Ultrasound in Medicine & Biology
Chapter 6: © 2015 Acoustical Society of America
Chapter 9: © 2016 Elsevier B.V. All rights reserved. No part of this publication may be reproduced, stored in a retrieval system, or transmitted, in any form, or by any means, electronic, mechanical, photocopying, recording, or otherwise, without prior consent from the author, or when appropriate, from the publishers of the publications. For a printed version please contact: Secretary Biomedical Engineering (January 2017: room Ee 2302) Erasmus MC P.O. Box 2040 3000 CA Rotterdam the Netherlands
Ultrasound Contrast Agents for Imaging and Therapy
Echocontrastmiddelen voor beeldvorming en therapie
Thesis
to obtain the degree of Doctor from the Erasmus University Rotterdam
by command of the rector magnificus
Prof. dr. H.A.P. Pols
and in accordance with the decision of the Doctorate Board
The public defence shall be held on
Wednesday 18th of January 2017 at 13.30 hours
by
Tom van Rooij
born in Eindhoven
DOCTORAL COMMITTEE:
Promoters: Prof. dr. ir. N. de Jong
Prof. dr. ir. A.F.W. van der Steen
Other members: Prof. dr. C. Ince
Prof. dr. A.M. Versluis
Prof. dr. E. Stride
Co‐promoter: Dr. K. Kooiman
This thesis is part of NanoNextNL, a micro and nanotechnology innovation consortium of the Government of the Netherlands and 130 partners from academia and industry. More information can be found on www.nanonextnl.nl. The research described in this thesis has been carried out at the Department of Biomedical Engineering, Thorax Center, Erasmus MC in Rotterdam. Financial support by the Dutch Heart Foundation and the Dutch Kidney Foundation for the publication of this thesis is gratefully acknowledged.
VOORWOORD
Waarom bellen en ultrageluid? Met een achtergrond in MRI en klinische chemie is dit niet de
meest voor de hand liggende keuze. Aan de andere kant zag ik hierin een mooie combinatie
van biologie, wat scheikunde en een beeldvormende techniek waar tevens een toekomst in
zit qua therapeutische mogelijkheden. Vanwege de samenstelling van de afdeling gaf dit
onderzoek me ook de kans om zelf te kiezen hoe technisch of biologisch ik het onderzoek in
wilde vullen. Ik heb meer geleerd dan ik vooraf had kunnen bedenken, zoals cellen kweken,
werken met proefdieren en het in recordtempo schrijven van artikelen. De meeste
voldoening haal ik uit de wetenschap dat ik patiënten kan helpen en ik ben er dan ook trots
op dat de studie naar acuut nierfalen al een jaar na de preklinische fase naar de intensive
care wordt gebracht. Ik ben erg blij en opgelucht dat ik nu dit boekje afgeleverd heb en ben
trots op het resultaat van vier jaar (hard) werken. Waarschijnlijk zul je na het lezen van dit
voorwoord meteen doorbladeren naar het dankwoord om te kijken of je genoemd wordt,
maar neem ook even de tijd om de rest te bekijken. Het zou jammer zijn als ik alles voor
niets heb geschreven…
Tom, december 2016
Financial support for the printing of this thesis was kindly provided by:
Bracco Suisse SA
Erasmus MC
FUJIFILM VisualSonics, Inc
Lipoid GmbH
Oldelft Ultrasound
Olympus Nederland B.V.
TraskBritt
CONTENTS 1 Introduction 1 2 Targeted ultrasound contrast agents for ultrasound molecular imaging 9 and therapy 3 Microbubble composition and preparation for high‐frequency contrast‐ 33 enhanced ultrasound imaging: in vitro and in vivo evaluation 4 DSPC or DPPC as main shell component influences ligand distribution 57 and binding area of lipid‐coated targeted microbubbles 5 Non‐linear response and viscoelastic properties of lipid‐coated micro‐ 73 bubbles: DSPC versus DPPC 6 Impulse response method for characterization of echogenic liposomes 95 7 Focal areas of increased lipid concentration on the coating of micro‐ 117 bubbles during short tone‐burst ultrasound insonification 8 Vibrational responses of bound and non‐bound targeted lipid‐coated 139 single microbubbles 9 Viability of endothelial cells after ultrasound‐mediated sonoporation: 159 Influence of targeting, oscillation, and displacement of microbubbles 10 Laser‐activated polymer microcapsules for ultrasound imaging and 191 therapy: an in vitro feasibility study 11 Feasibility of quantitative in vivo contrast‐enhanced ultrasound imaging 215 of the renal cortex in hemorrhagic shock 12 Renal contrast‐enhanced ultrasound and sublingual video‐microscopy 231 identify microcirculatory dysfunction in acute kidney injury 13 Cellular to systemic impact of microbubbles and ultrasound on the 251 human body: potential risks and how to control them 14 Discussion & Outlook 263 Bibliography 273 Summary 307

Samenvatting 311 Dankwoord 315 Publications 319 Conference presentations 321 PhD portfolio 324 Curriculum Vitae 327

Introduction
1 Chapter
1

CHAPTER 1
1.1. ULTRASOUND
Sound is omnipresent: some sounds we can hear, others we cannot hear. Whether we can
hear a certain sound depends on its frequency. A young and healthy human ear can pick up
sound with frequencies between 20 and 20,000 Hz [1]. Sound close to 20 Hz has long sound
waves and a low pitch; think of the bass in music, whereas the higher spectrum has short
sound waves and a high pitch, such as the sound of a flying mosquito. Sound at frequencies
higher than the ones we can hear is referred to as ultrasound. Although we are not able to
hear those sounds, they have been proven to be very valuable to us in naval applications
(sonar) and in the hospital. The first application of medical ultrasound (Dutch: echografie of
echo) dates back to 1942. In that year Karl Dussik performed an ultrasound transmission
scan with a transmit transducer on one side of the head of a patient, and a receive
transducer on the other side. This was also the first scientific publication on medical
ultrasonics. A few years later, in 1947, George D. Ludwig used ultrasound to locate
gallstones and John Julian Wild used it to detect breast masses [2]. Since these early
introductions of medical ultrasound, it is now mostly known from applications in obstetrics
and gynecology to visualize the unborn
child (Fig. 1.1).
The principle of ultrasound imaging is
the detection of reflected sound waves
(the echoes). Because different tissues
reflect ultrasound differently, an image
can be reconstructed. Ultrasound imaging
is therefore very useful for real‐time
imaging of tissue, but one of the
drawbacks is that it is not capable of
visualizing blood.
1.2. ULTRASOUND CONTRAST AGENTS
In 1968, Raymond Gramiak and Pravin M. Shah administered saline intravenously to a
patient during an ultrasound examination of the aortic root [3]. Surprisingly, the injection of
saline enabled them to visualize the blood; this was caused by the mini air bubbles that
were present in the saline or that were caused by the saline injection [3]. We now know that
this result was caused by the fact that gas bubbles are very efficient reflectors of sound,
due to their compression and expansion in response to the incident ultrasound wave [4].
This property of gas bubbles has been exploited for over forty years for the development of
ultrasound contrast agents (UCAs). Air bubbles, such as those present in agitated saline,
dissolve within tens of milliseconds in blood [5], which limits their use as contrast agent for
ultrasound imaging. Over the years, several types of UCAs have been developed to increase
Fig. 1.1. Ultrasound image of 27‐weeks old fetus
(www.echowonder.nl)
2

Introduction
the lifetime of the gas bubbles after injection in the blood stream. In 1994, the first
commercially available contrast agent Albunex (Molecular Biosystems, San Diego, CA, USA)
was marketed; air bubbles coated with human albumin, an abundant blood protein, to
increase their stability [6]. To further increase the lifetime of these so called microbubbles
of 1‐10 µm in diameter [7‐10], the air in the core was replaced by heavier gasses with lower
diffusion coefficients in blood. The inert gasses that are currently used in commercially
available ultrasound contrast agents are SF6 in SonoVue/Lumason (Bracco Imaging, Milan,
Italy) [7, 8], C3F8 in Definity (Lantheus Medical Imaging, North Billerica, MA, USA) [9] and in
Optison (GE Healthcare AS, Oslo, Norway), and C4F10 in Sonazoid (Daiichi Sankyo, GE
Healthcare, Tokyo, Japan) [11].
The newest generation of UCAs also contains C4F10 (e.g. VEGFR2‐targeted BR55, Bracco
Imaging) and is currently still in the phase of clinical trials to assess their safety before
approval by the regulating agencies as the Food and Drug Administration (FDA) for the USA
and the European Medicines Evaluation Agency (EMEA) for Europe. Using C4F10 as the gas
core has improved microbubble stability, but next to the gas core the coating could also be
optimized to increase stability. Albumin results in a relatively thick and rigid shell [5], which
limits oscillation of the gas bubble. Other coatings such as lipids or polymers were therefore
introduced and are currently still used [12‐18]. Lipids have the great advantage that they
result in relatively large oscillation amplitudes [18‐20], whereas polymers can increase the
payload for hydrophobic drugs in their core [14]. However, polymer contrast agents have
stiffer shells that need to be cracked in order to let the gas escape or the oil to be vaporized
to provide sufficient contrast [13, 14, 21]. Both lipids and polymers have the advantage that
they offer more options to tune the shell properties, which in addition opens up
opportunities for functionalization and targeting of the microbubbles.
1.3. CONTRAST‐ENHANCED ULTRASOUND IMAGING AND THERAPY
Contrast‐enhanced ultrasound (CEUS) is currently used to aid diagnosis in several organs,
such as heart, liver, breast, kidney, and prostate, but also to detect neovessels [22‐27]. Next
to enhanced visualization of the blood for diagnostic purposes, microbubbles can also be
functionalized by conjugating ligands to their surface to target specific biomarkers of a
disease or a disease process [28‐30]. These targeted microbubbles can be used for a wide
range of pre‐clinical applications including diagnosis, molecular imaging, monitoring of drug
treatment, and therapy [30‐32]. For therapies involving drug delivery, one can exploit an
interesting property of oscillating microbubbles. Due to the microbubble vibration it can
‘massage’ a cell and create permanent or transient pores in the cell membrane [33‐37]. The
formation of these pores is called sonoporation, which can be used to locally enhance the
delivery of drugs or to locally induce cell death [38, 39]. Although the exact mechanism
3

CHAPTER 1
remains unknown, it has been shown that the acoustic settings and microbubble behavior
mainly determine whether cells are sonoporated or not [35, 40, 41].
Although the acoustic behavior of microbubbles has been experimentally studied in
detail for the last decade, our understanding is still far from complete. Modeling of single
microbubbles oscillating in an ultrasound field aids in this understanding and can
complement experimental findings. In 1917, Lord Rayleigh derived an equation to describe
the behavior of a single oscillating air bubble [42], which has later been modified by Plesset
to the now known Rayleigh‐Plesset equation [43]. This equation has been applied by many
researchers to describe the behavior of microbubbles that are freely‐floating or are located
close to a membrane [5, 44]. Recently, a model has been introduced by Lajoinie et al. that
applies the Rayleigh‐Plesset equation in two dimensions in a spherical coordinate system, in
order to solve the equation for each axisymmetric line segment [15]. This is the first model
that predicts the oscillation of functionalized microbubbles that are bound to a membrane.
Most of the previously described models [5, 15, 44] approximate the true microbubble
oscillation quite accurately and can therefore be used to determine shell properties from
experimental data, such as damping, elasticity, and viscosity. However, some relations are
still not completely clear. Although we know that the microbubble size is inversely related
to their resonance frequency [45], i.e., the ultrasound frequency at which the highest
response can be measured, the shell and gas core of the microbubble also contribute to
their acoustic response [19]. Each commercially available or in‐house produced UCA is
composed of different gas cores and coating compositions, but the exact relation between
the microbubble composition and their acoustic responses remains unknown.
Most UCAs consist of microbubbles with a lipid‐based shell. Various combinations of
lipids have been shown to result in different distributions over the microbubble shell; some
combinations distribute uniformly over the shell, while others form ordered domains or
microstructures [46‐49]. Some of these microbubbles have long contrast persistence in vivo
and provide good contrast, while others provide only limited or no contrast at all [50]. A
possible reason for these differences is the variation in shell composition. Surprisingly, the
relation between shell composition and the acoustic properties of single microbubbles has
never been thoroughly studied and remains so far unknown. Because only a single or a few
targeted microbubbles can adhere to the biomarker of interest, complete understanding of
single microbubble behavior is crucial for molecular imaging and local drug delivery
applications. The aim of this thesis is to unravel the relation between shell properties and
the acoustic response of single microbubbles. Next, the most stable and acoustically best
performing UCAs are also investigated in vitro for therapeutic applications by means of
sonoporation, and for in vivo diagnostic imaging applications.
4

Introduction
1.4. OUTLINE OF THIS THESIS
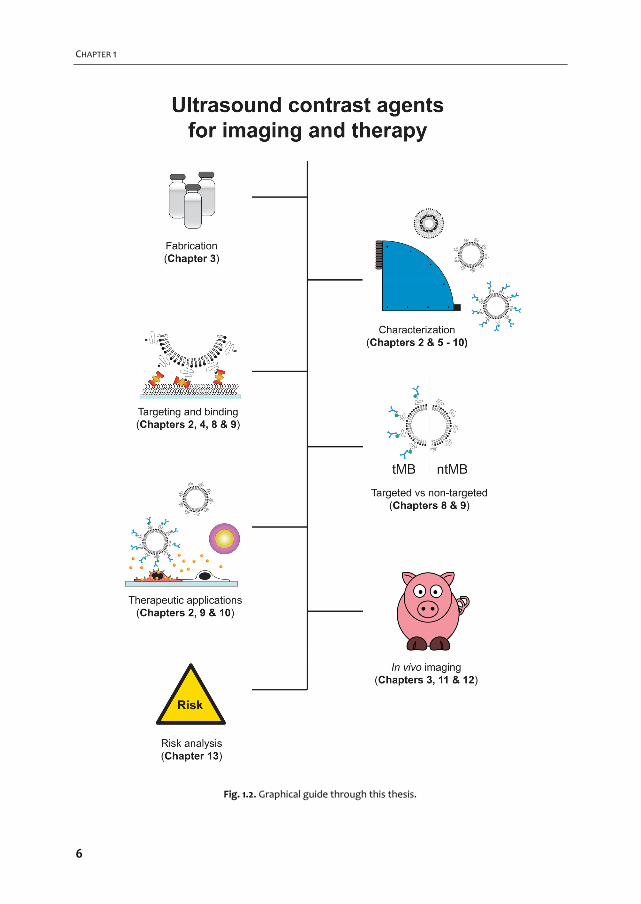
A graphical overview of the work described in this thesis is provided in Fig. 1.2. In Chapter 2
we give an overview of the current use of targeted microbubbles for ultrasound molecular
imaging and drug delivery. We describe the preparation of targeted microbubbles in terms
of coating materials and methods to attach ligands to the shell for specific biomarkers that
can be successfully targeted. Next, techniques to assess shell and acoustic properties of
targeted microbubbles are discussed and possible approaches are provided for
discriminating targeted microbubbles that have adhered to a biomarker from those that
have not. Finally, the current status of ultrasound molecular imaging and drug delivery is
discussed.
For imaging of superficial organs and preclinical imaging of small animals such as mice
and rats, high‐frequency CEUS imaging is mostly used. Clinical examinations are usually
performed at lower frequencies, so the commercially available UCAs have been optimized
for low frequency applications. At high frequencies, UCAs that consist of smaller
microbubbles have higher resonance frequencies and therefore respond better. In
Chapter 3 we focus on designing, producing, and characterizing twelve different UCAs for
high‐frequency applications. We vary shell compositions and use two production methods:
sonication and mechanical agitation, both with their own advantages and disadvantages.
Two out of these twelve microbubble compositions are functionalized and studied in
more detail in Chapter 4 in terms of their shell microstructure and binding characteristics.
To study the lipid shell at the molecular level super‐resolution microscopy is required. The
relation between the determined shell microstructures and the acoustic properties is
characterized in Chapter 5. To stimulate a microbubble, frequencies above 1 MHz [51] are
usually applied. This means that it oscillates at least one million times per second. To fully
capture these oscillations ultra‐high‐speed optical cameras are required; we therefore used
our Brandaris 128 camera [52] to study microbubble behavior.
Next to the microbubbles we describe in the previous chapters, one can also use other
types of UCAs. In collaboration with the University of Cincinnati (Cincinnati, OH, USA) we
studied echogenic liposomes (Chapter 6). These echogenic liposomes consist of a multi‐
layer of lipids encapsulating a gas and an aqueous phase [53], that have the potential to
locally deliver bioactive gasses such as oxygen [54], deliver drugs to dissolve blood clots
(sonothrombolysis) [55], or to enhance radiation and cytostatic cancer therapies. In this
chapter we develop a generic model to determine the shell and acoustic properties of
echogenic liposomes on measurements acquired by the Brandaris 128 camera.
Since the ultra‐high‐speed Brandaris 128 camera only visualizes the gas core of the
microbubbles, it cannot be used to directly study the shell. This requires an ultra‐high‐speed
camera that can caputre real‐time movement of fluorescently labeled lipids in the shell of
oscillating microbubbles (Chapter 7). The camera that was recently build by the University
5
CHAPTER 1
Fig. 1.2. Graphical guide through this thesis.
6
Introduction
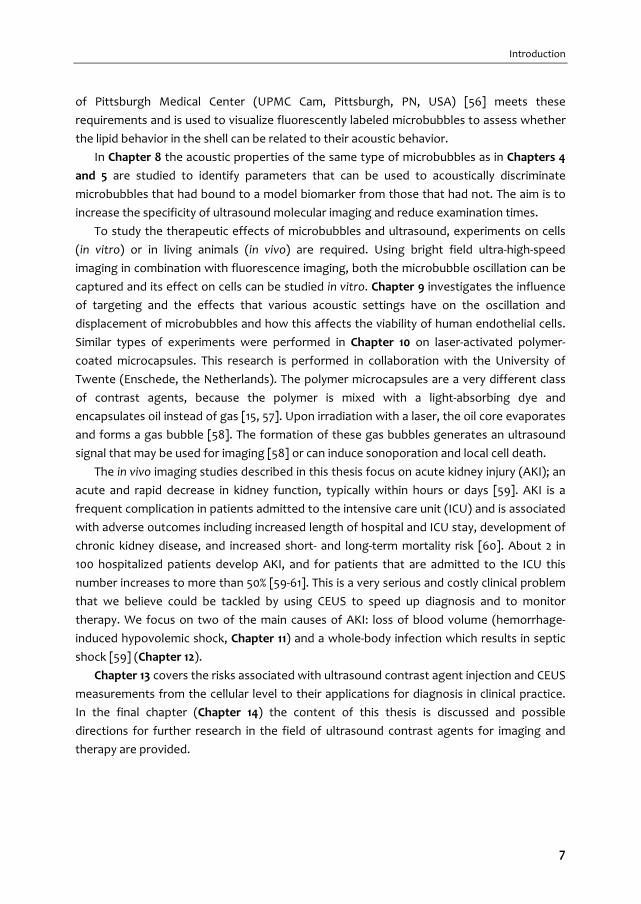
of Pittsburgh Medical Center (UPMC Cam, Pittsburgh, PN, USA) [56] meets these
requirements and is used to visualize fluorescently labeled microbubbles to assess whether
the lipid behavior in the shell can be related to their acoustic behavior.
In Chapter 8 the acoustic properties of the same type of microbubbles as in Chapters 4
and 5 are studied to identify parameters that can be used to acoustically discriminate
microbubbles that had bound to a model biomarker from those that had not. The aim is to
increase the specificity of ultrasound molecular imaging and reduce examination times.
To study the therapeutic effects of microbubbles and ultrasound, experiments on cells
(in vitro) or in living animals (in vivo) are required. Using bright field ultra‐high‐speed
imaging in combination with fluorescence imaging, both the microbubble oscillation can be
captured and its effect on cells can be studied in vitro. Chapter 9 investigates the influence
of targeting and the effects that various acoustic settings have on the oscillation and
displacement of microbubbles and how this affects the viability of human endothelial cells.
Similar types of experiments were performed in Chapter 10 on laser‐activated polymer‐
coated microcapsules. This research is performed in collaboration with the University of
Twente (Enschede, the Netherlands). The polymer microcapsules are a very different class
of contrast agents, because the polymer is mixed with a light‐absorbing dye and
encapsulates oil instead of gas [15, 57]. Upon irradiation with a laser, the oil core evaporates
and forms a gas bubble [58]. The formation of these gas bubbles generates an ultrasound
signal that may be used for imaging [58] or can induce sonoporation and local cell death.
The in vivo imaging studies described in this thesis focus on acute kidney injury (AKI); an
acute and rapid decrease in kidney function, typically within hours or days [59]. AKI is a
frequent complication in patients admitted to the intensive care unit (ICU) and is associated
with adverse outcomes including increased length of hospital and ICU stay, development of
chronic kidney disease, and increased short‐ and long‐term mortality risk [60]. About 2 in
100 hospitalized patients develop AKI, and for patients that are admitted to the ICU this
number increases to more than 50% [59‐61]. This is a very serious and costly clinical problem
that we believe could be tackled by using CEUS to speed up diagnosis and to monitor
therapy. We focus on two of the main causes of AKI: loss of blood volume (hemorrhage‐
induced hypovolemic shock, Chapter 11) and a whole‐body infection which results in septic
shock [59] (Chapter 12).
Chapter 13 covers the risks associated with ultrasound contrast agent injection and CEUS
measurements from the cellular level to their applications for diagnosis in clinical practice.
In the final chapter (Chapter 14) the content of this thesis is discussed and possible
directions for further research in the field of ultrasound contrast agents for imaging and
therapy are provided.
7

8
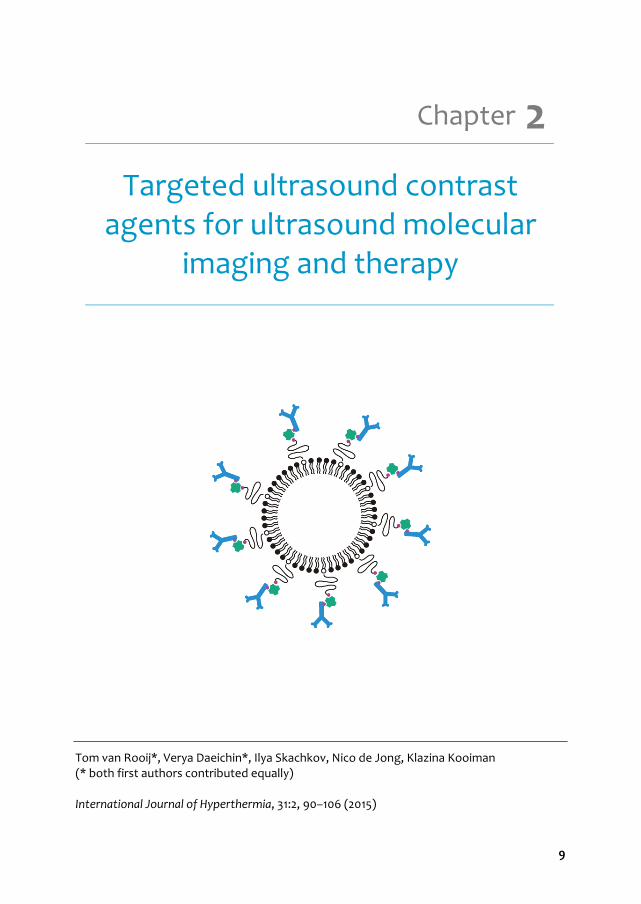
Targeted ultrasound contrast
agents for ultrasound molecular imaging and therapy
Tom van Rooij*, Verya Daeichin*, Ilya Skachkov, Nico de Jong, Klazina Kooiman (* both first authors contributed equally) International Journal of Hyperthermia, 31:2, 90–106 (2015)
2 Chapter
9
CHAPTER 2
2.1. ABSTRACT
Ultrasound contrast agents (UCAs) are used routinely in the clinic to enhance contrast in
ultrasonography. More recently, UCAs have been functionalized by conjugating ligands to
their surface to target specific biomarkers of a disease or a disease process. These targeted
UCAs (tUCAs) are used for a wide range of pre‐clinical applications including diagnosis,
monitoring of drug treatment, and therapy. In this review, recent achievements with tUCA
in the field of molecular imaging, evaluation of therapy, drug delivery, and therapeutic
applications are discussed. We present the different coating materials and aspects that have
to be considered when manufacturing tUCAs. Next to tUCA design and the choice of ligands
for specific biomarkers, additional techniques are discussed that are applied to improve
binding of the tUCAs to their target and to quantify the strength of this bond. As imaging
techniques rely on the specific behavior of tUCAs in an ultrasound field, it is crucial to
understand the characteristics of both free and adhered tUCAs. To image and quantify the
adhered tUCAs, the state‐of‐the‐art techniques used for ultrasound molecular imaging and
quantification are presented. This review concludes with the potential of tUCAs for drug
delivery and therapeutic applications.
2.2. INTRODUCTION
Ultrasound contrast agents (UCAs) consist of gas bubbles that are typically stabilized by an
albumin, lipid or polymer shell. For over three decades, UCA have been clinically used to
enhance ultrasound (US) imaging in different fields, such as cardiology and radiology [62,
63]. Targeted UCAs (tUCAs) differ from clinically approved UCAs by the decoration of their
shell with targeting ligands [17]. Due to their typical size (∼1‐10 µm) UCAs are confined to
the blood pool only [64, 65]. This makes tUCAs ideal agents to adhere to intravascular
biomarkers expressed on endothelial cells, to target for instance cancer and cardiovascular
disease, as covered in this review. Because of the large compressibility of the gas core of
the microbubbles (MBs), they create nonlinear backscatter and reflection in an US field,
allowing for differentiation between the highly echogenic agent and surrounding tissues
and fluids [28, 45]. Recently, smaller tUCAs have been synthesized which allow them to
extravasate out of leaky vasculature offering opportunities for new applications [66, 67].
This review focuses on tUCAs for ultrasound molecular imaging (UMI) and therapy.
Manufacturing and functionalizing tUCAs will be covered, including targeting novel
biomarkers. The binding and acoustic properties of bound tUCAs will be evaluated, as these
properties are important for both UMI and therapy. The current state‐of‐the‐art clinical and
preclinical molecular imaging techniques and quantification methods are discussed. tUCA‐
mediated drug and gene delivery is a relatively new field as the first proof of concept was
reported in 2011 [35]. The progress since then will be presented.
10
tUCA for ultrasound molecular imaging and therapy
2.3. TARGETING AND BINDING OF TUCAS
To compose tUCAs several aspects have to be accounted for. A choice for the coating has to
be made, the biomarkers that are upregulated in the disease of interest have to be
identified, and a suitable targeting ligand has to be found. This targeting ligand has to be
attached to the contrast agent and the binding properties of the tUCA have to be
evaluated.
Coating materials
The commercially available UCAs have different coating materials to reduce the surface
tension and gas diffusion out of the UCAs, thereby increasing their lifetime. These are:
albumin (Albunex, Cardiosphere, Optison), galactose (Echovist, Levovist), lipids (Definity,
Imagent, Levovist, Lumason, MicroMarker, Sonazoid, SonoVue, Targestar), or polymers
(Acusphere, Sonovist) [68, 69]. The main advantage of lipid‐coated bubbles is that different
mixtures can be easily formulated and modified [69]. Very recently, super‐resolution
fluorescence microscopy revealed that the main lipid in the coating (1,2‐distearoyl‐sn‐
glycero‐3‐phosphocholine (DSPC) or 1,2‐dipalmitoyl‐sn‐glycero‐3‐phosphocholine (DPPC))
influences the ligand distribution on the shell [70] and it was also shown that the difference
in ligand distribution also changes the acoustical properties [71]. This offers opportunities
for designing UCAs with very specific and known properties. Most lipid‐coated UCAs have a
brush of polyethylene glycol (PEG) incorporated in their shell to prevent close contact
between neighboring bubbles to inhibit their fusion and to shield them from the immune
system [69]. But although this is generally accepted as a method to increase UCA lifetime,
the necessity of incorporating PEG for tUCAs has been questioned [72]. This study indicated
that small peptides either conjugated to the lipid directly or via a PEG‐spacer (∼10
monomers), might hinder access of the ligand to the target receptors when short PEG
brushes (molecular weight of 350 kDa; i.e. 8 monomers) are part of the coating. Even when
the MBs were prepared without a PEG brush in their coating, the introduction of a PEG
spacer between the ligand and the lipid seemed to reduce binding. Their hypothesis is that
the flexibility of the spacer possibly enabled the peptide to loop back onto the bubble
surface. According to Marsh et al. [73] this is indeed what happens: due to their choice of
incorporating relatively short PEG chains in the coating, the PEG chains will be in the
mushroom regime and therefore assume a random configuration. If they would have used
similar concentrations of PEG with longer chains, such as PEG(2000) containing 45
monomers, these chains would be in the brush state: a more stretched and less random
configuration [73]. The random configuration of the PEG chain in the study of Myrset et al.
[72] could thus shield the ligand, whilst a brush configuration may have been advantageous.
Polymer tUCAs have a stiffer and thicker coating than lipid‐coated bubbles, and the main
acoustic difference is their echogenicity: usually a polymer bubble is destructed and the free
11
CHAPTER 2
gas bubble is detected, whereas a lipid‐coated bubble can be used for non‐destructive
imaging [45]. Combinations of different shell materials have also been reported; Ottoboni
et al. [74] used microcapsules with a cross‐linked albumin outer layer and a poly‐(DL‐lactide)
inner layer. The advantage of the two different layers is the possibility to tweak the acoustic
performance via the inner polymer layer in terms of their stiffness and thickness, and to
change the biological activity via the protein outer layer.
In vivo, the adsorption of serum proteins on the shell (opsonization) is a major challenge
in the design of UCA, as it might inhibit binding of the tUCA to its target. Lipid‐coated MBs
based on phosphatidylcholine (PC)—especially pure DSPC—have lower serum protein
adsorption, higher stability in serum, and lower uptake by the reticuloendothelial system
(RES) than negatively charged phospholipids, such as phosphatidylserine (PS) [72]. Another
problem caused by opsonization is its triggering capacity for phagocytosis. As targeting
ligands typically present nucleophilic groups (e.g., hydroxyl or amino) this could trigger
complement C3/C3b activation to promote phagocytosis and decrease the tUCA circulation
time. This can be partly overcome by using longer PEG chains that are in the brush state [73]
to shield the ligands for complement activation (“overbrushing”) and thus reduce
immunogenicity [75]. Unnikrishnan and Klibanov [69] on the other hand, state that
complement activation aids MB adherence in the microvasculature. Although PEGylation of
UCAs might decrease the circulation time, it does reduce immunogenicity and thus seems to
be desirable.
Attaching ligands
The ligand that makes the tUCA functional is typically a peptide, protein, polymer, antibody,
nanobody or aptamer [68, 76‐78] (Fig. 2.1A). A reactive moiety suitable for conjugation with
the ligand of interest needs to be attached to the tUCA shell, of which biotin (noncovalent),
or covalent coupling via a carboxylate group, thiol, or maleimide are most common [69, 79]
(Fig. 2.1A3). Covalent coupling does not require foreign proteins such as streptavidin, so the
chances of immune response in a clinical setting are low [80]. A carboxyl group
incorporated in the tUCA shell can be activated with carbodiimide, forming an active ester
that reacts with the protein amino group, forming an amide bond. However, proteins
possess multiple lysine residues, so coupling via amide bonds is random and may therefore
interfere with ligand‐receptor interaction. As an alternative, a maleimide on the shell is
coupled to a thiol group on the ligand (or vice versa), forming a thioether. The advantage of
maleimide‐thiol coupling is oriented coupling: a ligand protein possessing a single thiol then
has a single point attachment to the bubble shell. This retains the affinity of the ligand to its
target [69]. A new class of ligands are camelid‐derived single‐domain antibody‐fragments
(∼15 kDa) called nanobodies, that do not induce an immune response in humans [77].
12
tUCA for ultrasound molecular imaging and therapy
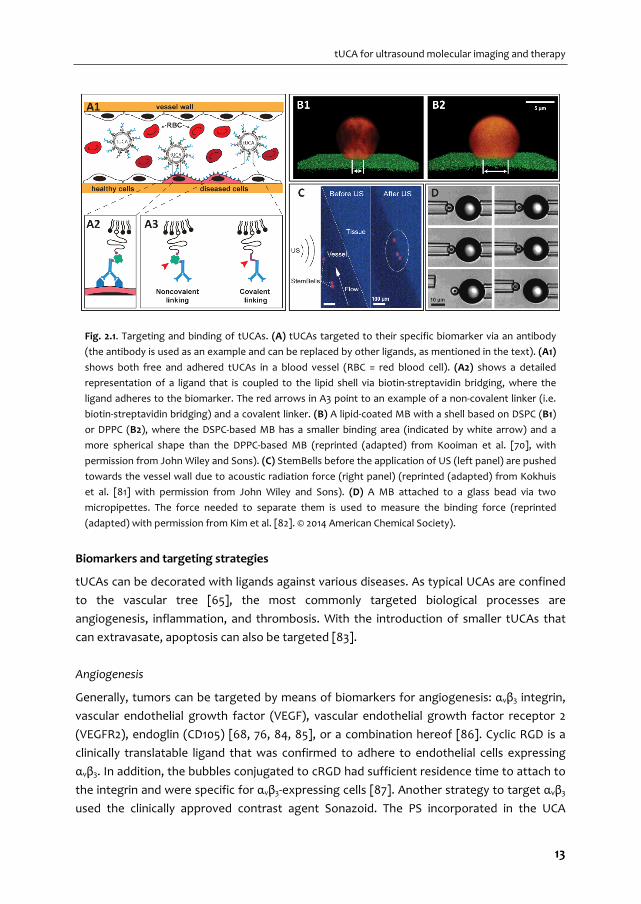
Fig. 2.1. Targeting and binding of tUCAs. (A) tUCAs targeted to their specific biomarker via an antibody
(the antibody is used as an example and can be replaced by other ligands, as mentioned in the text). (A1)
shows both free and adhered tUCAs in a blood vessel (RBC = red blood cell). (A2) shows a detailed
representation of a ligand that is coupled to the lipid shell via biotin‐streptavidin bridging, where the
ligand adheres to the biomarker. The red arrows in A3 point to an example of a non‐covalent linker (i.e.
biotin‐streptavidin bridging) and a covalent linker. (B) A lipid‐coated MB with a shell based on DSPC (B1)
or DPPC (B2), where the DSPC‐based MB has a smaller binding area (indicated by white arrow) and a
more spherical shape than the DPPC‐based MB (reprinted (adapted) from Kooiman et al. [70], with
permission from John Wiley and Sons). (C) StemBells before the application of US (left panel) are pushed
towards the vessel wall due to acoustic radiation force (right panel) (reprinted (adapted) from Kokhuis
et al. [81] with permission from John Wiley and Sons). (D) A MB attached to a glass bead via two
micropipettes. The force needed to separate them is used to measure the binding force (reprinted
(adapted) with permission from Kim et al. [82]. © 2014 American Chemical Society).
Biomarkers and targeting strategies
tUCAs can be decorated with ligands against various diseases. As typical UCAs are confined
to the vascular tree [65], the most commonly targeted biological processes are
angiogenesis, inflammation, and thrombosis. With the introduction of smaller tUCAs that
can extravasate, apoptosis can also be targeted [83].
Angiogenesis
Generally, tumors can be targeted by means of biomarkers for angiogenesis: αvβ3 integrin,
vascular endothelial growth factor (VEGF), vascular endothelial growth factor receptor 2
(VEGFR2), endoglin (CD105) [68, 76, 84, 85], or a combination hereof [86]. Cyclic RGD is a
clinically translatable ligand that was confirmed to adhere to endothelial cells expressing
αvβ3. In addition, the bubbles conjugated to cRGD had sufficient residence time to attach to
the integrin and were specific for αvβ3‐expressing cells [87]. Another strategy to target αvβ3
used the clinically approved contrast agent Sonazoid. The PS incorporated in the UCA
13
CHAPTER 2
coating was conjugated to lactaderin. This is analogous to the process of phagocytosis:
apoptotic cells externalize PS allowing lactaderin to bind to PS to promote binding to the
integrins on the surface of phagocytic cells [88]. Since adherence of the MBs functionalized
with lactadherin to human umbilical vein endothelial cells (HUVEC) under flow was higher
than for bare MBs, this complex has potential to be translated to the clinic for targeting
angiogenesis.
For VEGFR2 targeting the lipid‐coated BR55 bubble (Bracco Diagnostics) is most
promising for translation to the clinic for which a heterodimer peptide is directly conjugated
to the PEGylated lipid [84]. Recently, a phase 0 clinical trial with this agent for prostate
cancer was successfully conducted [89].
Inflammation
Inflammation plays a role in several diseases, such as atherosclerosis, and transient ischemia
[90‐93]. Specific inflammation markers that have been used for tUCAs are intracellular
adhesion molecule 1 (ICAM‐1), vascular cell adhesion molecule 1 (VCAM‐1), E‐selectin, and P‐
selectin [74, 76, 94, 95]. MBs targeted to VCAM‐1 can be used to discriminate the severity of
inflammatory burden in mice with various degrees of atherosclerosis [90]. This suggests
that assessment of early inflammation in plaques is feasible. However, the same study
showed that MB attachment to endothelial cells exposed to high wall shear stresses was
very low (in vitro). This did improve with short interruptions of the high shear rate, as is the
case with a pulsatile blood flow. Since the adhesion molecules ICAM‐1 and VCAM‐1 mediate
the firmer adhesion of the leukocytes to the endothelium, and E‐selectin and P‐selectin
promote the initial attachment and rolling of leukocytes [76], targeting both selectin and
adhesion molecules can potentially improve initial binding and increase the binding
strength.
Thrombosis
Targeting of thrombi is mainly focused on the glycoprotein IIb‐IIIa (GPIIb‐IIIa or CD41/CD61)
expressed by activated platelets in the thrombus [66, 68, 76, 96]. This glycoprotein
mediates platelet‐aggregation and is the most abundant receptor on the platelet surface
[96]. Using Targestar‐SA (Targeson Inc., San Diego, CA, USA) conjugated with anti‐GPIIb/IIIa
single‐chain antibodies, these bubbles bound specifically to activated platelets in vitro. This
may allow for real‐time in vivo molecular imaging of acute arterial thrombosis and
monitoring of pharmacological thrombolysis. Next to antibodies, it has been shown that
cRGD can also be used to target GPIIb‐IIIa. Although this ligand is generally known as a
marker for angiogenesis, cRGD was shown to be specific for GPIIb‐IIIa (also known as
integrin αiibβ3) as well [97]. cRGD was conjugated to the MBs via thiol‐maleimide coupling
and binding to GPIIb‐IIIa was evaluated in vitro in the presence of plasma and under wall
shear stresses up to 8 dynes/cm2 [66]—a value representative for the human aorta
14
tUCA for ultrasound molecular imaging and therapy
averaged over the heart cycle [98]. Several studies have demonstrated that cRGD exhibits
an ∼30× higher binding efficiency than linear RGD, and indeed significantly more cRGD
bubbles adhered up to the highest shear rate in vitro and in the larger arteries of mice [66].
Nakatsuka et al. [78] recently introduced a new concept using MBs that are only
acoustically active at thrombin levels associated with clot formation. The targeting moiety
of these bubbles was a thrombin aptamer crosslinking strand (TACS). Crosslinking limits the
nonlinear signal generation of the MB due to the immobilization of the lipids in the shell.
Upon decrosslinking the polymer‐DNA strands completely displace from the TACS, allowing
the MB to oscillate freely, enhancing their nonlinear response. The MBs consisted of DSPC,
DPPA (1,2‐dipalmitoyl‐sn‐glycero‐3‐phosphate), and 1,2‐distearoyl‐sn‐glycero‐3‐
phosphoethanolamine‐poly(acrylic acid)‐TACS (DSPE‐PAA‐TACS). When the bubbles are in
contact with thrombin in the thrombus, this protein binds to the aptamer, which results in
decrosslinking. The in vitro onset of decrosslinking was about 20 nM thrombin. Since in vivo
clot formation starts with a concentration of ∼25 nM thrombin this offers opportunities to
detect small clots at an early stage [78]. This has been shown in vivo using similar MBs, but
with different amounts of DSPE‐PEG(5000) added to the mixture [99]. Small amounts of
PEG were found to improve stability, while higher concentrations did not contribute
significantly to stability. Indeed, it was also shown that these aptamer MBs enhanced US
signal in the vicinity of clots.
Novel targeting strategies
The last few years molecular imaging using MBs has emerged and multiple novel targets
have been proposed and investigated. Prostate cancer is difficult to diagnose noninvasively,
and common practice is routine clinical testing in the laboratory to determine the level of
prostate‐specific antigen in the blood. However, this test lacks sensitivity and specificity
[100]. The prostate‐specific membrane antigen (PSMA) has higher expression levels in
prostate cancer epithelial tissue than in normal prostate tissue and benign prostatic
hyperplasia [101], and is therefore very promising for UMI and staging of prostate cancer as
shown in vitro [102]. Next to prostate cancer, other types of cancers have been successfully
targeted in vivo using tUCA: 1) tumor vessels of angiosarcoma that were targeted via
secreted frizzled related protein 2 (SFRP2) using DSPC:PEG(2000)‐PE bubbles [103]; 2)
ovarian cancer tumor vasculature that expresses CD276 with Target‐Ready MicroMarker
conjugated to anti‐CD276 [104]; and 3) the neovasculature of pancreatic ductal
adenocarcinoma targeted to thymocyte differentiation antigen 1 (Thy1 or CD90) using anti‐
Thy1 MBs [105]. The latter two are specific endothelial markers for human cancer types,
which are a challenge to investigate in a preclinical setting. The group of Willmann [104, 105]
therefore developed a mouse model that expresses human vascular biomarkers by
transfecting mouse endothelial cells with the human biomarker of interest and implanting
these together with the tumor cells of interest.
15
CHAPTER 2
In a preclinical setting Targestar‐B was targeted to epidermal growth factor receptor
(EGFR) and CD147 expressed in head and neck squamous cell carcinoma, where using the
dual targeting was reported as most promising [106]. Although E‐selectin is not a novel
target, its upregulation due to inflammation can also be used to monitor tumor progression
and metastasis. E‐selectin can therefore be used as a new targeting strategy for early
screening for tumors with metastatic potential [85]. Next to novel targeting strategies for
tumors, ischemia‐reperfusion after myocardial infarction was targeted to matrix
metalloproteinase‐2 (MMP‐2) using polymer‐shelled microcapsules. Apoptosis is another
recently studied target, typically targeted to PS. Annexin V is known to specifically bind to
PS [107] and was used for apoptosis imaging in breast cancer cells using nanobubbles [83].
Techniques to enhance binding
Binding of tUCAs to target biomarkers under in vivo conditions is a key factor for successful
application of molecular imaging for diagnosis and therapy (Fig. 2.1A). Methods to enhance
binding of targeted MBs (tMBs) generally depend on adjustments in the coating of the
tMBs and/or applying acoustic radiation force to push the tMBs to the target cells. Deflating
the tMBs to increase the shell surface area [95], conjugating two [108] or three [109]
different ligands to the coating, or optimizing the length of the ligand linker [110] are among
those studies optimizing the tMBs for an enhanced binding effect. Also, the probability of
successful binding may be increased by homogenizing the ligand distribution on the MB
shell [70], but needs further investigation. In addition, larger tMBs have a higher binding
force because of their larger binding area. Nevertheless, the shear forces induced by the
blood flow experienced by larger tMBs are higher than those experienced by smaller tMBs:
this increases the risk of detachment of larger tMBs from their targets. In a numerical study,
the optimal tMB size for enhanced binding (assuming they keep their spherical shape) is
suggested to be in the range of 2–4 µm in diameter [111]. In a very recent study, super‐
resolution microscopy was used to compare tMBs based on DSPC or DPPC in terms of ligand
distribution, binding area, and their shape upon binding (Fig. 2.1B) [70]. This study shows
that DSPC tMBs keep their spherical shapes after binding (Fig. 2.1B1) and have significantly
smaller binding areas than DPPC tMBs, which had a dome‐shape after binding (Fig. 2.1B2).
Magnetic MBs have also been developed to enhance the targeting in UMI and therapy [112‐
114]. Magnetic targeting uses an externally applied magnetic field, typically applied using a
permanent magnet, to control the location of magnetically responsive MBs. Various
magnetic MB preparations and applications have been published by Stride et al. in 2009 and
2012 [113, 115]. For instance, the gas core of the MB can be surrounded by a ferrofluid and
stabilized by an outer coating of L‐α‐PC. Such a magnetic MB could increase the dwell time
of tMBs in a target volume, whilst specificity could be provided by biochemical targeting
[115].
16
tUCA for ultrasound molecular imaging and therapy
In addition to the tMB shell modifications, acoustic radiation force [116] can be used to
push the MBs against the vessel wall to further improve the targeting rate of the MBs [117‐
120]. This technique was also successfully used to improve the delivery of stem cells to the
vessel wall which can be used for the repair of damaged tissue (Fig. 2.1C) by developing
echogenic complexes by conjugating tMBs to stem cells (StemBells) [81].
Measuring binding force
To evaluate the efficacy and strength of tUCAs, a measurement system capable of assessing
the strength of various binding configurations is necessary. Several in vitro methods have
been proposed. Kim et al. [82] used a micromanipulation technique to adhere a single tMB
to an individual glass bead using two separate pipets (Fig. 2.1D). The pressure applied by the
bead pipet was incrementally increased until the MB detached from the bead. Using this
method, the binding force was measured as a function of composition and structure of the
lipid shell and the receptor‐ligand pair in a controlled in vitro environment. For instance, the
detachment force for the biotin‐PEG‐avidin system was measured to be in the order of 100
nN assuming the contact area of the MBs and the coated surface to be around 10 µm2. In
another study, atomic force microscopy (AFM) was used for assessing the adhesive
interactions of tMBs with their target cells in vitro [121]. They used in‐house developed lipid‐
shelled tMBs conjugated to the CD31 antibody using biotin‐avidin bridging for adhesion to
Sk‐Hep1 hepatic endothelial cells and measured single distributions of the binding forces
with a median of 93 pN. Controlled shear flow has also shown potential for monitoring the
binding force of MBs targeted to P‐selectin in vitro [122]. In this experiment attachment and
detachment of tMBs to P‐selectin immobilized on a culture dish was investigated in a
parallel‐plate flow chamber by increasing shear stress at intervals of 30 seconds. The
accumulation rate first increased with shear stress, reached a maximum at ∼0.6 dyn/cm2
and then decreased. Half‐maximal detachment was reached at 34 dyn/cm2. These results
suggest that accumulation and retention of tMBs are possible under physiologic flow
conditions [98]. Another approach for measuring binding force is the effect of secondary
Bjerknes forces on tMBs, which was studied using a high‐speed camera [123, 124]. The
secondary Bjerknes force is an averaged net force that neighboring MBs experience due to
their oscillations in an ultrasound field. The direction of the force depends on the phase
difference between the MB oscillations and the oscillating pressure gradient [44]. Kokhuis
et al. [123] observed that bound tMBs deform in the direction of their neighboring MB when
they were subjected to secondary Bjerknes forces. If low‐intensity ultrasound is applied, the
deformation induces an elastic restoring force, causing the MBs to recoil back to their
equilibrium position. For higher acoustic pressures, the secondary Bjerknes force can break
the bond between the tMB and the surface. Using this technique, the binding force
between a single biotinylated MB and an avidin‐coated surface was measured to be
between 0.9 and 2 nN. In addition, the optical observation of the event suggests that lipid
17
CHAPTER 2
anchors are pulled out of the MBs shell, rather than destruction of the strong bond
between biotin and avidin [123].
2.4. CHARACTERIZATION OF TUCAS
Non‐targeted MBs for contrast‐enhanced imaging, such as SonoVue and Definity, have been
thoroughly characterized in terms of their acoustic behavior in an US field [125‐128]. These
studies mainly focused on bulk measurements, as regular contrast‐enhanced US imaging is
also performed in vessels containing high concentrations of microbubbles. However, for
imaging of tMBs where only very few adhered MBs may be in the imaging field, the
response of only a single MB or a cluster of MBs has to be detected [129]. The response of a
single MB in an US field is therefore of high interest to aid enhancement of the
backscattered signal to improve imaging. A first step is to determine the MB properties
after attaching a targeting ligand to it. The next step is the characterization of tMBs
adhered to their molecular targets, and comparing this to the response of non‐adhered
tMBs to find parameters to distinguish them from each other.
Functionalized lipid‐coated MBs
Only a few studies used functionalized MBs to determine the effect of functionalization on
the MB properties; in particular their elasticity using either atomic force microscopy (AFM)
or high‐speed optical imaging. Using AFM, an elasticity was found that was almost 30×
higher for streptavidin‐functionalized bubbles than for bare lipid‐coated bubbles (710±41 vs
25±1.4 mN/m; DPPC:PE‐biotin, 90:10 mol%) [130]. Recently, the same group performed AFM
studies on bubbles with a C3F8 core and a lipid‐coating of DPPC:DSPE‐PEG(2000)‐biotin or
DPPC:DOPE‐biotin (1,2‐dioleoyl‐sn‐glycero‐3‐phosphoethanolamine‐biotin) in a 90:10 ratio
[131]. Both types were functionalized with streptavidin and bubbles with diameters
between 3 and 4 μm were deformed up to 20% of their original size, whereas non‐
functionalized bubbles were deformed up to 50%. Here, streptavidin functionalization
increased the elasticity to 26.9±1.4 mN/m for the PEGylated bubbles, but PEGylation itself
was also found to increase the elasticity (17.7±0.7 vs 10.7±0.5 mN/m). However, the increase
in elasticity between PEGylated and non‐PEGylated MBs might actually be a consequence of
the different lipids that were used for both bubble types: DSPE or DOPE as it has recently
been shown that the main lipid of non‐targeted biotinylated MBs changes the distribution
of the lipids in the shell and its shell properties [70, 71]. The authors do not explain the large
difference in stiffness values between both studies [130, 131]. Indeed, there does not seem
to be a straightforward explanation. The preparation method is identical, but although the
biotinylated lipids are different this cannot explain such a large difference. The major
difference between both studies is the PEGylation [131], but this was found to increase the
stiffness, and contradicts with their results.
18

tUCA for ultrasound molecular imaging and therapy
To study the influence of functionalization on several MB properties, we functionalized
identical biotinylated MBs—with either DSPC or DPPC as the main coating lipid [70]—with
streptavidin via avidin‐biotin bridging [132]. These unbound bubbles were investigated at
frequencies between 1 and 4 MHz at a pressure of 50 kPa and their vibrational response was
recorded by optical ultrahigh‐speed imaging [20, 71]. For DSPC and DPPC‐based bubbles the
acoustic stability increased after functionalization, although their shrinkage remained
significant (Table I). The resonance frequencies of functionalized and non‐functionalized
DSPC MBs were similar, whereas those of DPPC MBs were higher for the functionalized
ones. The number of MBs responsive at the subharmonic (SH) frequency was slightly lower
for functionalized DSPC bubbles than for non‐functionalized DSPC bubbles. For DPPC there
was no change after functionalization. At the second harmonic frequency the functionalized
and non‐functionalized DSPC bubbles behaved similar, whereas after functionalization
hardly any DPPC bubbles responded. The viscoelastic shell properties of both functionalized
and non‐functionalized MBs were estimated [20, 71] using the Marmottant model [19]. The
shell elasticity for DSPC slightly increased after functionalization, whereas for DPPC the
elasticity increased almost fourfold. The shell damping and viscosity, on the other hand, did
not change after functionalization.
Table 1. Characteristics of streptavidin‐functionalized and non‐functionalized DSPC and DPPC bubbles
* Median (interquartile range, IQR)
§ Data adapted from van Rooij et al. (14)
A critical side note regarding the elasticity estimated for the functionalized DPPC MBs is
the narrow size distribution that did not cover the same range as the DSPC bubbles (DPPC:
4.8‐6.2 μm; DSPC: 3.1‐7.3 μm). However, our results clearly show an increase of the
resonance frequency and thus of the elasticity, which corresponds with the results obtained
using AFM [130, 131]. The increase in elasticity after functionalization is believed to be due to
the presence of crystallization of streptavidin around the lipid shell forming a stiffer
external layer [131] as also observed on streptavidin‐functionalized giant unilamellar
phospholipid vesicles [133, 134]. This is also consistent with the increased stability: a stiffer
and thicker shell better prevents gas escape [135]. The above mentioned studies all found
differences between streptavidin‐functionalized MBs and non‐functionalized MBs. In
contrast, Overvelde et al. [136] concluded that the frequency of maximum response and the
Type Strept‐
avidin # MBs
Stability
(%)*
Responding
at SH (%)
Responding at
second harmonic
frequency (%)
Elasticity (N/m) Viscosity
(× 10‐8 kg/s)*
DSPC No§ 15 95.9 (3.5) 27 67 0.17 ± 0.06 1.2 (0.9)
Yes 12 99.1 (2.8) 17 75 0.23 ± 0.06 1.0 (0.5)
DPPC No§ 14 90.3 (8.2) 67 17 0.06 ± 0.08 1.0 (0.3)
Yes 6 94.4 (4.3) 71 79 0.21 ± 0.08 1.8 (0.6)
19

CHAPTER 2
maximum amplitude of oscillation of functionalized bubbles (BG‐6438, Bracco Imaging
S.p.A., Milan, Italy) and non‐functionalized bubbles (BG‐6437, Bracco) did not seem to
change.
Although streptavidin‐biotin binding is a useful tool to gain insights into the effects of
coupling of relatively large and heavy ligands to MBs in vitro, it can never be used clinically
due to strong immune responses [80]. Therefore, alternatives for in vivo targeting have to
be considered, such as peptides, polymers, or antibodies, as discussed in the Targeting and
binding section. Peptides consist of a few amino acids (∼100‐200 Da) [137] and the RGD‐
peptide used typically for targeting has a molecular mass of ∼380 Da. Since functionalizing
bubbles with a small, low molecular mass ligand such as biotin (∼250 Da) has hardly any
effect on the MB response, it is expected that functionalization of MBs with a peptide has
also minimal effect. Polymers are regularly used in MB designs to increase circulation times
and to function as a stealth mechanism, mostly in the form of a PEG‐lipid [138]. Abou‐Saleh
et al. [131] only mentioned a slight increase in elasticity upon PEGylation, but it is not known
whether addition of a polymer changes other properties. Streptavidin‐functionalization, on
the other hand, has a significant effect on MB response. Since antibodies (∼150 kDa) are
more than 2× heavier than streptavidin (∼60 kDa) an even larger effect, especially on the
elasticity and resonance frequency, is expected. In addition, coupling an antibody covalently
to a lipid could also induce cross‐linking of the lipids as there are usually several reactive
groups on an antibody.
Discriminating free from adhered MBs
The next step after functionalization of MBs is studying their behavior when they have
bound to their molecular target. Moreover, the differences in acoustical signals between
free and adhered bubbles are the key feature to facilitate discrimination.
Some of the non‐functionalized biotinylated bubble types described in the previous
section [70, 71, 129] were used to target an avidin‐coated cellulose capillary using acoustic
radiation force to promote binding [139]. Optical imaging was used to confirm bubble
adhesion and high‐speed optical imaging was used to visualize the oscillations [140]. The
adherent MBs oscillated symmetrically in the plane parallel to the wall (similar to a free‐
floating MB) and asymmetrically in the plane normal to the wall. The side of the MB near the
boundary expanded and contracted to a lesser extent than the side away from the
boundary. The normalized radial expansion was larger for adherent bubbles in both imaging
planes. When the transmission pressure was increased from 240 to 450 kPa, the center of
the microbubble began to collapse toward the fixed boundary, producing a jet. At even
higher pressures (650 kPa) fragmentation was observed in the plane parallel to the
boundary, where the remaining fragments expanded and contracted, and were displaced
along the wall away from the ultrasound source [139]. This can be advantageous for drug
delivery applications when the drug is incorporated in or attached to the shell of the MB.
20
tUCA for ultrasound molecular imaging and therapy
The response at the fundamental frequency was larger for adherent bubbles than for free
bubbles [140], the responses at the SH frequency were similar, and the second harmonic
component also increased [139]. At increasing pressures the signals at the third and fourth
harmonic frequency were also higher for adhered MBs. One of the underlying causes of the
higher fundamental (and maybe also harmonic) signals of adherent bubbles could be due to
the small diameter of the bubbles (<< acoustical wavelength) and the nearly uniform spatial
distribution of free bubbles, resulting in incoherent echo summation and a small
backscattered intensity from each sample volume. Alternatively, a layer of tUCA adherent to
the inside of a vessel wall reflects US coherently, resulting in a large reflection of the
fundamental component. Secondly, the adherent bubbles formed aggregates, which
increase the coupling between adjacent bubbles and thus their effective scattering cross
section [140].
In addition to adhered and free floating microbubbles, Overvelde et al. [136] studied
bubbles close to an OptiCell wall, using ultrahigh‐speed imaging. For non‐functionalized
bubbles close to the wall the amplitudes at the frequency of maximum response were
lower than for free‐floating non‐functionalized MBs. However, the OptiCell wall was not
blocked for unspecific binding, hence these bubbles probably also adhered to the wall and
cannot be considered as non‐adherent. The observation that still holds is the 50% lower
frequency of maximum response for adherent functionalized MBs than for functionalized
and non‐functionalized MBs in the unbounded fluid (150 μm away from the wall). The lower
frequency of maximum response for bubbles bound to the OptiCell wall might be due to an
increase in damping due to the coupling of the bubble and the wall.
Besides optical interrogation of bubbles, acoustical measurements have been used to
characterize tMBs. Prior to the acoustical measurements, the biotinylated bubbles were
sized by optical microscopy and subsequently injected in a capillary with or without
streptavidin‐coating [141]. Scattering of non‐biotinylated bubbles and biotinylated bubbles
at the fundamental frequency (2 MHz) was similar, whether or not the capillary was coated.
The second harmonic resonance radius of an adherent MB was higher than that of a non‐
adherent targeted bubble, i.e. the second harmonic resonance frequency was higher. The
reason that a difference between biotinylated and non‐biotinylated bubbles was not found
might be just a size or mass effect of the functionalization ligand. Not only is biotin
(∼250 Da) much smaller than streptavidin (∼60 kDa), but one streptavidin molecule can
bind up to four biotin molecules [138] that could form a protein layer around the shell, as
suggested by others [131, 134]. The effect of biotinylation on the resonance frequency might
therefore be only minimal.
The most recent study that compared free with bound MBs focused on the SH response
frequencies at 11 and 25 MHz [142]. The rationale behind applying higher frequencies is
imaging in a preclinical setting, but also in a clinical setting for the assessment of
atherosclerosis in the carotid or for superficial tumors these high frequencies are needed.
21
CHAPTER 2
This study used the commercially available Target‐Ready MicroMarker (lipid‐coated and
streptavidin functionalized) which had stronger SH activity for larger bubbles when
insonified at 11 MHz, i.e. the SH resonance frequency decreased upon binding. At 25 MHz
the difference was smaller between free and bound MBs, but the amplitude of the adhered
bubbles was 20% higher. In general, the pressure thresholds for SHs were lower at 11 MHz
than at 25 MHz. Bound bubbles disrupted at lower pressure thresholds than unbound,
especially at 11 MHz. At this frequency mainly compression‐only behavior was observed for
both bound and unbound MBs, whereas at 25 MHz the oscillations were expansion‐
dominated. Although differences in SH resonance were present, no shift in the fundamental
resonance frequency was observed. This study also aimed to find a strategy to enhance the
SH signal for imaging. Optimal pulse‐inversion techniques require the same phase (0 radian
phase shift) of the responses induced by both transmit pulses. Consequently, due to
complete constructive interference (much like an opposite phase of π radian is desirable
between fundamental echoes to ensure complete destructive interference) this would yield
the maximal SH amplitude. At 11 MHz the SH emissions were consistently half a wavelength
(π/2 radian) out of phase and at 25 MHz it varied more, but a similar trend was observed.
This suggests that with the incorporation of a phase‐shifting strategy; SH signal amplitudes
from pulse‐inversion techniques can be increased to 60% to enhance imaging.
Interestingly, the before mentioned studies show an opposite effect on the resonance
frequency upon binding of the MBs. For streptavidin‐functionalized MBs in an OptiCell
insonified at pressures between 2 and 4 MHz, the resonance frequency decreased [136],
while for biotinylated MBs in a streptavidin‐coated capillary insonified at 2 and 3.5 MHz the
resonance frequency increased [141]. At higher frequencies streptavidin‐coated bubbles at
11 MHz showed an increase in resonance frequency, while they showed a decrease at
25 MHz [142]. A potential explanation for the observed opposing trends may be frequency‐
dependent boundary effects, for example caused by frequency‐dependent boundary
stiffness [142]. Nevertheless, these contradictions show that much is still unknown
concerning the effects of binding on the bubble response. As this is the key factor for
acoustical differentiation between bound and unbound MBs, single MB studies are needed
for reliable determination of the bubble properties. Especially in vivo studies could aid the
understanding of MB behavior in a clinically‐translatable environment.
Other types of targeted tUCAs
Next to the lipid‐coated MBs described above, the characteristics of other types of tUCAs
such as polymer and nanobubbles have been studied. Schmidt et al. [143] used poly(l‐lactic
acid) (PLA) capsules that bonded to a neutravidin‐adsorbed polystyrene surface (similar to
an OptiCell wall). In this study the microcapsules adhered to the surface under flow
conditions with wall shear stresses between 0.2 dyn/cm2 and 1.5 dyn/cm2. The capsules first
slowed down before binding and were easier to detach at higher shear stresses and higher
22
tUCA for ultrasound molecular imaging and therapy
acoustic pressures. At the highest pressure of 291 kPa an appreciable fraction of the
capsules also ruptured and released their gas content.
Recently, polyvinylalcohol (PVA) capsules gained specific interest due to their chemical
versatility that enables functionalization with different ligands, for instance hyaluronic acid
for the targeting of tumor cells and tissues [144]. The properties of the air‐filled PVA
capsules were compared to other polymer‐coated capsules and commercially available
bubbles with lipid and protein coatings [145]. At very high pressures up to 2.344 MPa
(mechanical index (MI) = 1.58) the shell’s shear modulus was estimated to be 3.7 MPa.
Assuming a shell thickness of 0.5 µm [145] this corresponds to an elasticity parameter of 5.6
N/m: an order of magnitude higher than for lipid‐coated bubbles [20, 127, 128]. The in vitro
capsule concentration necessary to obtain the same signal was similar to Albunex, 5 to 10‐
fold lower than for SonoVue and Definity and even 35‐fold lower than for Optison. Using the
same concentrations for SonoVue and PVA bubbles the second and higher harmonic signals
for PVA were up to 10 dB higher.
Sub‐micron sized nanobubbles (∼200 nm) may potentially extravasate by passing the
capillary barrier to reach cells at the tumor cell target site [66]. This property makes them
promising for targeted molecular imaging and drug delivery in tumors. Due to the higher
permeability of tumor vasculature—enhanced permeability and retention (EPR) effect—
nanobubbles are more likely to accumulate in tumors, known as passive targeting. The
stability of the lipid‐Pluronic nanobubbles was higher than that of Definity (in vitro). In mice,
the lipid‐Pluronic nanobubbles were imaged using contrast harmonic imaging at 8 MHz and
their contrast in the tumor was higher than for Definity. This was ascribed to the possible
extravasation of the nanobubbles, which retains them in the tumor and thus increased the
signal.
2.5. ULTRASOUND MOLECULAR IMAGING
UMI that uses tUCAs is a multidisciplinary technology applicable for both diagnosis,
monitoring of lesion formation, and therapy evaluation.
Contrast‐specific imaging techniques
MBs generate higher harmonics, SHs and ultraharmonics of the excitation frequency [146‐
151]. Upon excitation by multi‐frequency bursts, MBs can also act as nonlinear mixers of the
excitation frequencies and produce cross‐products [152‐154]. Conventional nonlinear
imaging techniques, at lower frequencies (< 15 MHz), focus mainly on detection of higher
harmonics [155‐159]. The need for high resolution UMI in small animal applications has
pushed the frequencies used in preclinical imaging to above 15 MHz [160]. At these
frequencies similar nonlinear techniques have been implemented [161‐165]. However,
performance of these imaging methods is degraded because the excitation frequency is
23
CHAPTER 2
much higher than the resonance frequency of the MBs, attenuation is higher, and far‐wall
artifacts are a big challenge to overcome [166‐170]. Therefore, improved imaging methods
have been extensively studied, such as improved harmonic imaging methods [171‐173], chirp
coded excitation alone [174, 175] or combined with pulse inversion [176, 177]. Among the
nonlinear components of the MB response the SH signal has drawn much attention lately,
due to its MB specificity and artifact‐free characteristics. Moreover, SH response of the MB
has shown its potential for selectively imaging bound tMBs [142, 178]. The SH signal is
strongly dependent on the applied acoustic pressures, the ambient pressure variations [147,
179‐183], and the envelope of the excitation signal [184‐188]. The SH signal is also less
attenuated than the ultraharmonic and higher harmonics, and therefore a more suitable
choice for high frequency applications. Next to the different strategies to improve the
sensitivity of MB detection, adjusting the MBs is another approach to gain sensitivity. It has
been shown that UMI of sorted 3 µm MBs results in an approximately 20 times higher video
intensity than for unsorted populations [189]. This size lies within the optimal tMB size
distribution for enhanced binding, as shown numerically [111]. This can significantly
maximize the sensitivity to small numbers of MBs for UMI.
Selective imaging of true bound tMBs from free flowing unbound ones is another
challenge that is extensively studied [190‐194]. The most common approach for imaging
and quantification of tMBs is to wait for a few minutes (2 [195] to 20 minutes [196]) so most
of the circulating MBs have been taken up by the lungs and liver (i.e. RES system), or have
been dissolved. This time also allows the tMBs to accumulate at the site of their targets.
Then low power nondestructive pulses are applied to image the tMBs, followed by a high
power disruptive pulse (flash) to eliminate the MBs within the imaging plane which is again
followed by low power pulses to image the residual circulating MBs (Fig. 2.2A). The intensity
difference before and after the flash corresponds to the amount of bound tMBs and is a
measure for the biomarker concentration [197‐200], as shown in Fig. 2.2A. In such methods
the quantification of bound tMBs strongly depends on the injected dose, imaging system
gain, and local perfusion [190]. In addition, the influence of inhaled gasses in the anesthetic
protocols influences the MBs longevity [201‐204]. These studies confirmed longer
circulation times of in‐house lipid‐shell decafluorobutane‐filled UCAs and commercially
available UCAs such as Definity® and Albunex® when animals breathe medical air instead of
pure oxygen as the carrier gas for the isoflurane anesthetic. This is perhaps due to a
reduced ventilation/perfusion mismatch and classical diffusion between the blood gasses
and the gas inside the MBs (e. g. perfluorobutane), in which nitrogen plays a role by
increasing the volume of the MBs and diluting other gas species in the MBs gas core [204].
The presence of tissue motion can compromise quantification, as well as high
concentrations of freely recirculating MBs after the waiting period. Several methods for
selectively imaging the bound tMBs in real time have been proposed: utilizing an image‐
push‐image sequence [190]; transmission at a low frequency and reception at a high
24

tUCA for ultrasound molecular imaging and therapy
frequency [191]; using the SH response of the MBs and interframe filtering [192]; and using
singular value spectra properties [193]. However, none of the proposed methods have yet
been applied in vivo. Only Pysz et al. developed a quantification method based on dwell
time MB signal measurements, which was tested in vivo in well vascularized tumors in mice
[205]. However, in this in vivo model where attachment of tMBs is significant, the classical
way of quantification also performs well. Thus, the performance of the method
developedby Pysz et al. in applications with very few tMBs in the presence of circulating
MBs remains unclear. Daeichin et al. have developed an off‐line quantification method for
the detection of biomarker concentrations in vivo in cases with a high number of bound
Fig. 2.2. Ultrasound molecular imaging. (A) Timeline of the imaging protocol and schematic
representation of a typical time intensity curve in the region of interest (e.g. tumor). (B) B‐mode (grey)
overlaid with non‐linear contrast mode (green) US imaging in 3D to detect the αvβ3 expression via αvβ3‐
tMBs (MicroMarker) adhered to the SVEC cells (SV40‐transformed murine endothelial cell line), which
were cultured in an OptiCell. The band in the middle of the figure in which there is no green signal
present shows the destruction of the tMBs with the flash burst. (C–E) 3D micro‐UMI using VEGFR‐2
Target‐Ready MicroMarker on a subcutaneous human hepatocellular carcinoma tumor which was
developed by injection of HuH7 cells in male nude NMRI mice. All animal work was approved by the
regulatory authority of Erasmus MC and performed in compliance with the Dutch government regulation
guidelines. (C) 3D B‐mode US render of the tumor. (D) 3D render of contrast images 10 min after bound
tMBs within the entire volume of the tumor. (E) 3D render of contrast images 10 min after injecting the
control MBs. Lack of signals within the tumor indicates no attachment of control MBs to the VEGFR‐2
receptors. For (B–E), imaging was performed with a Vevo 2100 US imaging system and MS250 probe at
18 MHz. The probe was moved with increments of 32 mm using a step motor (VisualSonics).
25
CHAPTER 2
MBs, as well as only very few bound MBs [206]. This method benefits from motion
compensation and individual contrast spot detection, and is capable of distinguishing bound
MBs from unbound MBs based on their displacement. Such a quantification method can be
applied in studies performed with different imaging settings because it is less sensitive to
imaging parameters.
In vivo molecular imaging
As discussed previously, the diagnostic focus of UMI is mainly on inflammation, thrombosis
and angiogenesis. Assessment of angiogenesis is perhaps the application where UMI is used
the most [86, 90‐93, 207‐212]. For evaluating tumor growth noninvasively, successful in vivo
quantification of the expression levels of the angiogenetic biomarkers αvβ3 integrin,
endoglin, and VEGFR2, which vary during tumor growth in subcutaneous cancer xenografts,
have been reported [211]. Recently, an UMI study using MBs targeted to αvβ3 in an ovarian
cancer model in hens [213], suggested that the detection of ovarian tumor–associated
angiogenic microvessels improved when using UMI. For assessing the efficacy of cell‐based
therapies, UMI has been used to image a genetically engineered cell‐surface marker on
endothelial progenitor cells to track the fate of these progenitor cells after their delivery
into vascular engraftment in vivo within Matrigel plugs [214]. Next to the basic research that
is performed using UMI, numerous studies are putting a step forward by investigating the
possibilities of clinically translatable targeted MBs. In humans, the first phase 0 clinical trial
for prostate cancer UMI was presented recently using BR55, a VEGFR2‐tUCA [89]. Although
it was only a safety study it was reported that 12 out of 14 lesions (proven by histology)
could be detected with UMI. Bachawal et al. [215] used BR55 in transgenic mice with breast
cancer and ductal carcinoma. UMI allowed for highly accurate detection of both breast
cancer and ductal carcinoma in situ and this can be a promising clinical approach for early
breast cancer detection. In addition, BR55 has shown its potential for early detection of liver
dysplasia in transgenic mice [216].
UMI has also been used to noninvasively assess the effects of anti‐inflammatory
treatment on endothelial inflammation in early atherosclerosis in genetically modified mice
[217, 218]. UMI has also proven its ability to detect biomarkers of early response to
chemotherapy in several cancer types by MBs targeted to single biomarker expressions
(VEGFR2, αVβ3, endoglin, Annexin V, or VEGF‐VEGFR complex) [83, 210, 219‐221] and MBs
targeted to two or more of these biomarker expressions [195]. Impressively, studies have
shown that UMI using αvβ3‐tMBs is a consistent method that can classify a tumor as a
responder or a non‐responder as early as two days after treatment [222, 223]. To establish
the link to clinical oncology Flisikowska et al. [224] have suggested the use of larger animal
cancer models with more similarities to humans, such as genetically modified pigs. They
proposed programs to generate gene‐targeted pigs with mutations in tumor suppressor
genes and proto‐oncogenes that replicate key lesions responsible for a variety of human
26

tUCA for ultrasound molecular imaging and therapy
cancers. Whilst tumor models in large animals are challenging, cardiovascular disease can
more easily be modeled. A study on miniswines suffering from atherosclerosis showed that
an improved endothelial permeability through ultrasound‐activated nitric oxide loaded
echogenic immunoliposomes, can facilitate the delivery of anti‐ICAM‐1 conjugated
echogenic immunoliposomes to inflammatory components in the arterial wall. This
approach therefore has the potential to improve UMI of atheroma [225]. Next to pigs, the
expression of P‐selectin and VCAM‐1 expression in the carotid of nonhuman primates has
also been recently assessed with UMI. This study showed that endothelial cell adhesion
molecule expression in large arteries could be an early event that coincides with diet‐
induced obesity and insulin resistance in nonhuman primates [226]. In another recent study
on nonhuman primates with myocardial ischemia, UMI showed to be both safe and
effective for imaging recent myocardial ischemia. Lipid‐coated MBs were functionalized
with dimeric recombinant human P‐selectin glycoprotein ligand‐1, a recombinant ligand
appropriate for humans were used [227]. The study suggests that UMI can be useful for
detecting recent ischemia in patients with chest pain, even in the absence of necrosis [227].
Three dimensional UMI
It is challenging to image the same plane repeatedly in 2D UMI serial studies and small
misalignments can already introduce a substantial error. tMBs are attached to their targets
and are therefore stationary in UMI applications where tissue motion is absent. This thus
opens up opportunities for three dimensional (3D) UMI using 2D probes, by mechanically
moving the ultrasound probe over the target of interest. This is illustrated in Fig. 2.2 where
3D UMI is performed with VEGFR2 Target‐Ready MicroMarker (FUJIFILM VisualSonics, Inc.,
Toronto, Ontario, Canada) on subcutaneous human hepatocellular carcinoma tumor in a
mouse.
Feasibility of 3D UMI has also been proven by other groups. Streeter at al. [196]
performed 3D UMI of tumors expressing αvβ3 integrin by mechanically stepping the
transducer across the tumor in 800 µm increments. In another study, it was shown that
multiple injections of tMBs did not block sufficient binding sites to bias molecular imaging
data in serial studies [228], which is an important finding. Using the clinically promising BR55
agent, 3D UMI was shown to be very well suited in depicting the angiogenic activity in very
small breast lesions, suggesting its potential for detecting and characterizing these lesions
in a very early stages [229]. Combining the effort to selectively image bound tMBs and 3D
UMI, Hu et al. [230] used a broadband single pulse imaging sequence (transmitting at low
frequencies and receiving at high frequencies) that is faster than the multi‐pulse methods.
Then, this method was combined with interframe filtering to selectively image targeted
MBs without waiting for clearance of unbound MBs, thereby reducing acquisition time from
10 to 2 minutes. Their results suggest a feasible method for 3D UMI that is faster than
current multi‐pulse strategies.
27
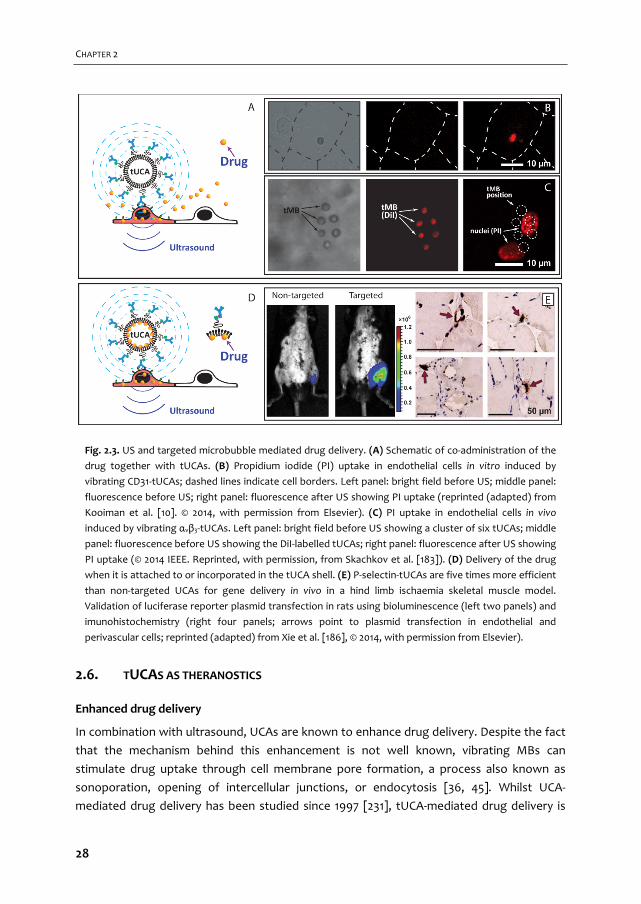
CHAPTER 2
Fig. 2.3. US and targeted microbubble mediated drug delivery. (A) Schematic of co‐administration of the
drug together with tUCAs. (B) Propidium iodide (PI) uptake in endothelial cells in vitro induced by
vibrating CD31‐tUCAs; dashed lines indicate cell borders. Left panel: bright field before US; middle panel:
fluorescence before US; right panel: fluorescence after US showing PI uptake (reprinted (adapted) from
Kooiman et al. [10]. © 2014, with permission from Elsevier). (C) PI uptake in endothelial cells in vivo
induced by vibrating αvβ3‐tUCAs. Left panel: bright field before US showing a cluster of six tUCAs; middle
panel: fluorescence before US showing the DiI‐labelled tUCAs; right panel: fluorescence after US showing
PI uptake (© 2014 IEEE. Reprinted, with permission, from Skachkov et al. [183]). (D) Delivery of the drug
when it is attached to or incorporated in the tUCA shell. (E) P‐selectin‐tUCAs are five times more efficient
than non‐targeted UCAs for gene delivery in vivo in a hind limb ischaemia skeletal muscle model.
Validation of luciferase reporter plasmid transfection in rats using bioluminescence (left two panels) and
imunohistochemistry (right four panels; arrows point to plasmid transfection in endothelial and
perivascular cells; reprinted (adapted) from Xie et al. [186], © 2014, with permission from Elsevier).
2.6. TUCAS AS THERANOSTICS
Enhanced drug delivery
In combination with ultrasound, UCAs are known to enhance drug delivery. Despite the fact
that the mechanism behind this enhancement is not well known, vibrating MBs can
stimulate drug uptake through cell membrane pore formation, a process also known as
sonoporation, opening of intercellular junctions, or endocytosis [36, 45]. Whilst UCA‐
mediated drug delivery has been studied since 1997 [231], tUCA‐mediated drug delivery is
28
tUCA for ultrasound molecular imaging and therapy
relatively new. In 2011, Kooiman et al. were the first to show that CD31‐tUCAs could
sonoporate primary endothelial cells in vitro [35]. Cell membrane permeability (Fig. 2.3B)
was already induced at acoustic pressures as low as 80‐200 kPa (1 MHz, 6×10 cycle bursts),
indicated by uptake of the co‐administered model drug propidium iodide (PI). Since then,
several other studies reported tUCAs for drug delivery by either co‐administrating the drug
with the tUCAs or loading the drug in/on the tUCAs. Another co‐administration in vitro study
using PI showed that sonoporation of cancer cells by αvβ6‐tUCAs was higher with chirp
pulses from 3‐7 MHz than with chirp pulses between 1.3 and 3.1 MHz or single frequency
insonification at 2.2 or 5 MHz (110 kPa, 10 μs burst, pulse repetition frequency (PRF) 1 kHz,
2 min treatment) [232]. This can be explained by the fact that chirp pulses cover a broader
range of resonance frequencies, as MBs with various sizes have different resonance
frequencies; chirp pulses are therefore more efficient than single frequency pulses. In the
chicken embryo model (in vivo), a single sine‐wave burst (1 MHz, 1000 cycles at 150 or 200
kPa) was sufficient for vascular PI uptake using αvβ3‐tUCA as shown in Fig. 2.3C [233].
tUCAs can also be loaded with genetic drugs (plasmid DNA, siRNA, mRNA) or drugs for
local gene/drug delivery. Philips et al. [234] used VCAM‐1‐tUCAs loaded with plasmid DNA to
transfect smooth muscle cells with the model gene green fluorescent protein (GFP) in vitro
at 1 MHz (200‐300 kPa, PRF 100 Hz, ~5 sec per cell) and at 1.5 MHz (200 kPa, PRF 8 kHz, ~5 s
per cell). In another study ovarian cancer cells were transfected with wild‐type p53 tumor
suppressor gene using Luteinizing Hormone‐Releasing Hormone analog (LHRHa)‐tUCA to
induce apoptosis (1 MHz, 0.5 W/cm2, 30 s treatment) [235]. Two studies [236, 237] showed
that tUCAs loaded with luciferase plasmid can transfect vasculature in vivo. Xie et al. [236]
used P‐selectin tUCAs in a hindlimb ischemia skeletal muscle model (see Fig. 2.3E; 1.6 MHz,
0.6‐1.8 MPa, Power Doppler, pulsing interval 5 s, PRF 2.5 kHz for 10 min), whereas Tlaxca et
al. [237] used mucosal addressin cell adhesion molecule‐1 or VCAM‐1‐tUCA in a model for
Crohn’s disease (1 MHz, 5 W/cm2, 25% duty cycle for 5 min).
Two types of drugs loaded in tUCAs have been reported for cancer treatment. Paclitaxel
loaded into tUCAs induced tumor cell apoptosis in vitro in ovarian cancer cells (LHRHa‐
tUCAs, 0.3 MHz, 0.5 W/cm2, 30 sec treatment) [238] and breast cancer cells (LyP‐1‐tUCA,
1 MHz, 4 W/cm2, 50% duty cycle, 2 min. treatment) [239] as well as in vivo (LHRHa‐tUCAs,
0.3 MHz, 1 W/cm2, 50% duty cycle, 3 min treatment) [240]. In vivo, the tUCAs were
administered intraperitoneally allowing the tUCAs to adhere to the ovarian cancer cells. The
other anti‐cancer drug loaded into VEGFR2‐tUCAs was BCNU (1,3‐bis(2‐chloroethyl)‐1‐
nitrosourea) for the treatment of glioma brain tumors in vitro (1 MHz, 0.5 MPa, 10,000
cycles, PRF 5 Hz for 1 min treatment at 2 sites) and in vivo (1 MHz, 0.7 MPa, 10 ms burst, 5%
duty cycle, PRF 5 Hz, 1 min treatment at 2 sites), where in vivo the tUCAs were also used to
open the blood brain barrier [241].
29

CHAPTER 2
tUCAs versus non‐tUCAs for enhanced drug delivery
Strikingly, when tUCAs for drug delivery are directly compared with their non‐targeted UCA
counterparts, tUCAs are more efficient both in vitro [232, 234, 235, 238, 239] (up to 7.7‐fold
higher [239]) and in vivo [236, 237, 240, 241] (up to 5‐fold higher [236]), irrelevant whether
the drug was co‐administered with the tUCAs or whether the drug was loaded on/in the
tUCAs. Although the reasons for this higher efficiency have not yet been investigated,
several could be possible. Possibly the main reason could be that tUCAs vibrate against the
cells directly as they are bound to the cells, which may result in a more efficient transfer of
acoustic energy, especially because sonoporation was only reported in cells adjacent to
vibrating microbubbles for non‐tUCAs [37, 242]. The acoustic behavior of the tUCAs itself
could also explain this difference, as in vitro studies have shown that tUCAs are acoustically
more stable, vibrate with a larger amplitude at the fundamental frequency, fragment in the
plane parallel to the boundary and have a different resonance frequency (see
characterization of tUCAs section). Microbubble clustering could also be a phenomenon
contributing to the higher efficiency of tUCAs, as a cluster of bubbles is known to behave as
one large bubble, which is also associated with a shift in their resonance frequency [243].
This is substantiated by the chicken embryo study in which clusters of 10 to16 tMBs had a 16‐
fold higher sonoporation efficacy than single tMBs [233].
A disadvantage of using tUCAs for drug delivery was reported by Hu et al. [244] who
showed that insonified αvβ3‐tUCAs temporarily decreased blood flow within the insonified
area after application of a 5 MHz, 2 or 4 MPa color‐Doppler destruction pulse (6‐cycle pulse
length, PRF 124 Hz, 900 ms duration). Although such high frequency and pressure pulses are
not typically used for drug delivery, temporarily reducing the blood flow could be
advantageous to keep the delivered drug in the treated area. The reduced blood flow could
also reduce tumor size by itself as has been reported for non‐tUCA [245].
With tUCAs now also being used for drug delivery, the terms ultrasound‐mediated
targeted drug delivery or ultrasound and microbubble targeted drug delivery (UMTD) have
become confusing. UMTD is used for drug delivery using non‐targeted UCA where
“targeted” refers to the local application of the ultrasound itself. We therefore suggest
banning the UMTD term and use ultrasound and microbubble mediated drug delivery
(UMMD) for non‐targeted UCAs and ultrasound and targeted microbubble mediated drug
delivery (UtMMD) for tUCAs instead.
30
tUCA for ultrasound molecular imaging and therapy
2.7. OUTLOOK AND CONCLUSIONS
Recent studies on larger human‐like animals such as pigs and nonhuman primates, as well as
the first phase 0 clinical trial for prostate cancer with the VEGFR2 tUCA BR55 show the
capability of clinical UMI in the near future. Recent insights in shell coating properties of
tUCAs, new strategies for targeting, and the development of nanoscale tUCAs will open up
a new range of opportunities and will broaden the spectrum of diseases that can be
targeted.
Intrinsic properties of the tUCAs, such as deformability due to low elasticity could be
used as an advantage to improve binding. This underlines the necessity of single tMB
investigation to further understand their properties. Upon binding, opposite effects on the
resonance frequency are reported, which also reflects a change in harmonic frequencies.
The increase in their SH amplitude upon binding could potentially be utilized for selective
imaging of adhered tMBs, which could speed up the UMI and increase its specificity.
Obviously, 3D imaging is desired for UMI applications, either by mechanically moving a two
dimensional probe or using a volumetric 3D probe.
By using tUCAs as local drug delivery systems, intracellular drug uptake can be enhanced
several fold in comparison to non‐tUCAs. tUCAs able to carry and deliver a high payload are
needed, as is the elucidation of the mechanism by which tUCA stimulate drug uptake. A
novel therapeutic use of tUCAs for cancer treatment could be the functionalization with
kinase inhibitors. These molecules have a high affinity for cancer cell receptors and are
already approved or in clinical trials as anticancer drugs, such as gefitinib (EGFR), sunitinib
(FLT‐1), Bevacizumab (VEGF) [246]. Bound kinase inhibitor‐tUCAs could therefore facilitate
both UMI and act as inhibitor activators for apoptosis. With BR55 now undergoing
regulatory approval for clinical use, this will hopefully pave the way for other tUCA with
other targets as well. However, for every new tUCA or drug‐loaded tUCA regulatory
approval will be needed before clinical use.
tUCAs can also be used as theranostic agent without the addition of a drug or gene, but
in combination with high intensity focused ultrasound (HIFU) techniques instead. These
techniques utilize high‐energy focused ultrasound to locally increase the temperature at the
focal point for ablation of tumors. UCAs, as synergists, have become a research topic to
improve the efficiency of HIFU treatment [247, 248]. In this field, a folate‐tUCA (phase
transition nanoemulsion) has shown great potential to enhance HIFU ablation of ovarian
cancer in vivo [249].
In conclusion, adding to the wide applications of UMI for diagnosis, the therapeutic
benefits of this technology also play a major role in its popularity. Detection of diseased
cells using tUCAs combined with local drug delivery, sonoporation, and HIFU are good
examples of the applications and the potential of UMI for therapy.
31

CHAPTER 2
Acknowledgements
This research is partly supported by the Center for Translational Molecular Medicine and the
Dutch Heart Foundation (PARISk), and by NanoNextNL, a micro and nanotechnology
consortium of the Government of the Netherlands and 130 partners. This work is also part
of the research program Veni, which is financed by the Netherlands Organisation for
Scientific Research (NWO) (KK).
32

Microbubble composition and preparation for high‐frequency contrast‐enhanced ultrasound imaging: in vitro and in vivo
evaluation
Verya Daeichin, Tom van Rooij, Ilya Skachkov, Bulent Ergin, Patricia A.C. Specht, Alexandre Lima, Can Ince, Johan G. Bosch, Antonius F.W. van der Steen, Nico de Jong, Klazina Kooiman IEEE Transactions on Ultrasound Ferroelectrics and Frequency Control (2016) – Submitted
3 Chapter
33

CHAPTER 3
3.1. ABSTRACT
Although high‐frequency ultrasound imaging is gaining attention in various applications,
hardly any ultrasound contrast agents (UCAs) dedicated to such frequencies (>15 MHz) are
available for contrast‐enhanced ultrasound imaging (CEUS). Moreover, the composition of
the limited commercially available UCAs for high‐frequency CEUS (hfCEUS) is largely
unknown, while shell properties have been shown to be an important factor for their
performance. The aim of our study was to produce UCAs in‐house for hfCEUS. Twelve
different UCA formulations A‐L were made by either sonication or mechanical agitation. The
gas core consisted of C4F10 and the main coating lipid was either DSPC (A‐F formulation) or
DPPC (G‐L formulation). Mechanical agitation resulted in UCAs with smaller microbubbles
(number weighted mean diameter ~1 μm) than sonication (number weighted mean
diameter ~2 μm). UCA formulations with similar size distributions but different main lipid
component, showed that the DPPC‐based UCA formulations had higher nonlinear responses
at both the fundamental and subharmonic frequencies in vitro for hfCEUS using the
Vevo 2100 high‐frequency preclinical scanner (FUJIFILM VisualSonics Inc.). In addition, UCA
formulations F (DSPC‐based) and L (DPPC‐based) that were made by mechanical agitation
performed similar in vitro to the commercially available Target‐Ready MicroMarker
(FUJIFILM VisualSonics Inc.). UCA formulation F also performed similar to Target‐Ready
MicroMarker in vivo in pigs with similar mean contrast intensity within the kidney (n=7), but
formulation L did not. This is likely due to the lower stability of formulation L in vivo. Our
study shows that DSPC‐based microbubbles produced by mechanical agitation resulted in
small microbubbles with high nonlinear responses suitable for hfCEUS imaging.
3.2. INTRODUCTION
Ultrasound imaging at high frequencies (≥ 15 MHz) enables high resolution imaging at the
price of lower penetration depth, making this technique highly suitable for imaging of small
animals [160] and superficial organs in large animals (e.g. skin [250]) and humans (e.g. eye
[251] and skin tumors [252]). Alternatively, an endoscopic (e.g. transrectal [253]) or
intravascular probe [254] could be used if the organ of interest lies deeper within the body.
Contrast‐enhanced ultrasound imaging (CEUS) allows assessment of blood flow to
improve diagnosis and monitor therapy. For CEUS, intravenously injected ultrasound
contrast agents (UCAs) are needed that consist of gas‐coated microbubbles dispersed in
saline [17, 63, 255]. Examples of preclinical high‐frequency CEUS (hfCEUS) are tumor
angiogenesis imaging [45] and cerebral microvascular hemodynamics assessment in rats
[256]. Microbubbles are effective UCAs with a strong resonance structure and inherently
nonlinear behavior in response to a time varying pressure field [45, 256]. These nonlinear
oscillations can be present at the subharmonic (SH), fundamental, ultra‐harmonic, and
higher harmonic frequency. The nonlinear signals generated by the microbubbles are
34
Microbubble composition and preparation for high‐frequency CEUS
utilized in imaging techniques to separate the UCA signal from that of the surrounding
tissue [161].
Methods based on the detection of higher harmonics are hindered by artifacts when the
excitation frequency is high (≥ 15 MHz), such as nonlinear propagation artifacts [166, 184]. In
addition to those artifacts, higher harmonics undergo dramatic attenuation because of their
high frequencies, which limits the penetration depth. Nonlinear fundamental contrast
imaging is the most common approach for nonlinear hfCEUS imaging [161]. The nonlinear
fundamental component suffers less from attenuation, but nonlinear propagation is still a
drawback. SH imaging, on the other hand, is free from such artifacts, is less attenuated, and
neither generated during propagation in tissue nor scattered by tissue [257]. A SH signal can
be achieved with minimum amplitude excitation if the driving frequency is twice the
resonance frequency of the microbubbles [178, 258]. To increase the sensitivity of hfCEUS
both the imaging techniques and the UCA design need to be optimized.
The performance of UCAs highly depends on the resonance behavior of a microbubble,
which is inversely related to its diameter [44, 178]. Therefore, UCAs with smaller
microbubbles can improve the sensitivity of hfCEUS imaging. Next to size, microbubble shell
properties have been shown to be an important factor for their performance, mainly in the
generation of SH [259, 260]. The lipid composition of the microbubble shell in the
commercially available UCAs for hfCEUS is only known for Definity [9], but unknown for
MicroMarker [261] and Targestar P‐HF [163]. For high‐frequency ultrasound molecular
imaging, functionalizing the microbubbles is required to target them to the biomarker of
interest [262]. Although Target‐Ready MicroMarker provides streptavidin linkage [164], no
UCA is commercially available to provide covalent coupling of the ligand to the microbubble
shell, limiting flexibility in choice of ligands. In‐house produced UCAs could overcome these
disadvantages.
Based on a preliminary experiment we conducted before [263], the aim of our study was
to produce lipid‐coated UCAs in‐house with high nonlinear response for hfCEUS. Based on
microbubble size a resonance frequency can be predicted [44], but the actual response still
depends on the shell microstructure, as we previously showed for the main lipids used in
commercially available UCAs [8, 9]: 1,2‐distearoyl‐sn‐glycero‐3‐phosphocholine (DSPC) or
1,2‐dipalmitoyl‐sn‐glycero‐3‐phosphocholine (DPPC) [260]. We therefore studied twelve
different UCA types with the aim to produce microbubbles with a size similar to Definity [9]
and MicroMarker [261]. UCAs were either produced by sonication, i.e. the most common
UCA production method [264], or mechanical agitation, i.e. the method by which Definity is
prepared [9]. In addition, we compared the UCA compositions we [70] and others [16, 265]
have used throughout the years, and quantitatively evaluated the performance of the in‐
house produced UCAs to Target‐Ready MicroMarker in vitro and in vivo with hfCEUS using
the most commonly used high‐frequency ultrasound imaging platform (Vevo 2100,
FUJIFILM VisualSonics Inc. Toronto, ON, Canada).
35

CHAPTER 3
3.3. MATERIALS AND METHODS
Ultrasound contrast agent preparation
All UCAs were produced in phosphate‐buffered saline (PBS; Invitrogen, Groningen, the
Netherlands) as the aqueous medium. UCAs were either produced by probe sonication at 20
kHz with a Sonicator Ultrasonic Processor XL2020 at setting 10 (Heat Systems, Farmingdale,
NY, USA) as previously described [70, 129] for 60, 90 or 120 s or by mechanical agitation for
45 s using a Vial Shaker (Bristol‐Myers Squibb Medical Imaging, Inc., North Billerica, MA,
USA). UCAs with a C4F10 (F2 Chemicals, Preston, UK) gas core and different phospholipid
coating formulations (see Table 3.1) were made. The main phospholipid component for all
UCA formulations was either 1,2‐distearoyl‐sn‐glycero‐3‐phosphocholine (DSPC; P6517),
purchased from Sigma‐Aldrich, Zwijndrecht, the Netherlands (formulations A‐F), or 1,2‐
dipalmitoyl‐sn‐glycero‐3‐phosphocholine (DPPC; 850355), purchased from Avanti Polar
Lipids, Alabaster, AL, USA (formulations G‐L). The other coating components were
polyoxyethylene (40) stearate (PEG‐40 stearate; P3440; Sigma‐Aldrich), 1,2‐distearoyl‐sn‐
glycero‐3‐phosphoethanolamine‐N‐carboxy(polyethylene glycol) (DSPE‐PEG(2000); 880125;
Avanti Polar Lipids), and 1,2‐distearoyl‐sn‐glycero‐3‐phosphoethanolamine‐N‐
biotinyl(polyethylene glycol) (DSPE‐PEG(2000)‐biotin; 880129; Avanti Polar Lipids).
Table 3.1. Production of microbubbles: composition of microbubble phospholipid coating, other coating components, additives, and method of production; MB = microbubble
UCA
ID
Main coating
component
(mol%)
Other coating components
(mol%) Glycerol
(v/v %)
Propylene
glycol
(v/v %)
Method of MB
production (time)
DSPC DPPC PEG‐40
stearate
DSPE‐
PEG(2000)
DSPE‐
PEG(2000)
biotin
Sonication
(s)
Vial
shaker
(s)
A 59.4 ‐ 35.7 4.1 0.8 ‐ ‐ 60 ‐
B 59.4 ‐ 35.7 4.1 0.8 ‐ ‐ 90 ‐
C 59.4 ‐ 35.7 4.1 0.8 ‐ ‐ 120 ‐
D 59.4 ‐ 35.7 4.1 0.8 ‐ ‐ ‐ 45
E 92.4 ‐ ‐ 6.4 1.2 5 5 ‐ 45
F 92.4 ‐ ‐ 6.4 1.2 10 20 ‐ 45
G ‐ 59.4 35.7 4.1 0.8 ‐ ‐ 60 ‐
H ‐ 59.4 35.7 4.1 0.8 ‐ ‐ 90 ‐
I ‐ 59.4 35.7 4.1 0.8 ‐ ‐ 120 ‐
J ‐ 59.4 35.7 4.1 0.8 ‐ ‐ ‐ 45
K ‐ 92.4 ‐ 6.4 1.2 5 5 ‐ 45
L ‐ 92.4 ‐ 6.4 1.2 10 20 ‐ 45
36
Microbubble composition and preparation for high‐frequency CEUS
Coating formulations A‐D and G‐J were identical to our previously produced UCAs made
by sonication for 10 s (number weighted mean ~4 μm) [29]. The UCAs made by vial shaking
either contained no glycerol and no propylene glycol (formulation D and J) as reported by
Sirsi et al. [266] and Moran et al. [267] or contained 5% v/v glycerol (818709, Merck Millipore,
Merck, Amsterdam, the Netherlands) and 5% v/v propylene glycol (82280, Sigma‐Aldrich)
(formulation E and K) as reported by Segers et al. [31] or 10% v/v glycerol and 20% v/v
propylene glycol (formulation F and L) as reported by Geers et al. [265]. Our UCA
formulations E, F, K, and L only contained two different lipids, which is typical for in‐house
produced UCAs made by vial shaking [47, 265, 268, 269]. We chose DSPE‐PEG(2000) in
addition to the main lipid DSPC or DPPC because this lipid can be utilized for targeting,
whereas the PEG‐40‐stearate cannot [262]. The molar ratio of DSPC or DPPC to (DSPE‐
PEG(2000) + DSPE‐PEG(2000)‐biotin) was kept identical to UCA formulations A‐D and G‐J.
UCAs produced by sonication (formulation A‐C, G‐I) were put in 5 mL glass serum bottles
(223738; Wheaton, Millville, NJ, USA), topped with C4F10 gas and closed with a rubber
stopper (Z166065; Sigma‐Aldrich) and aluminum cap (224193‐01; Wheaton). Before the
experiments, UCAs made by sonication were washed three times by centrifugation at 400 g
for 1 min (Heraeus Biofuge, Thermo Scientific, Etten‐Leur, the Netherlands) to remove the
excess lipids. For the vial shaking method, 1 mL of the solution (lipid concentration
0.4 mg/mL for formulations D‐F, J‐L) was pipetted in a 2 mL glass screw top vial (5182‐0714;
Agilent Technologies, Santa Clara, CA, USA), topped with C4F10 gas and closed with a screw
cap (5182‐0717; Agilent Technologies).
Target‐Ready MicroMarker UCA was prepared from the ready kit (FUJIFILM VisualSonics
Inc.) according to the manufacturer’s instructions: the lyophilisate cake was reconstituted
with 1 mL of 0.9% sodium chloride solution. The microbubbles in this UCA consist of a
phospholipid shell encapsulating a C4F10/N2 gas core [261]. All UCAs were produced or
reconstituted not more than a few hours before the experiments. Size distributions of the
UCAs were measured using a Coulter Counter (Multisizer 3, Beckman Coulter, Mijdrecht, the
Netherlands). A 20 µm aperture tube was used, allowing quantification of particle diameters
between 0.4 and 12 µm using a linear spacing between the 256 channels. Measurements
were repeated three times for each UCA to obtain the mean microbubble diameter, size
distribution, and concentration. Polydispersity of the UCAs was calculated by assessing the
SPAN, which illustrates the width of the distribution, by using (d90%–d10%)/d50% where d10,
d50 and d90 are the microbubble number weighted diameters below which 10, 50, and 90%
of the cumulative amount of number weighted microbubbles is found. Data are presented
with standard deviations (SD).
37
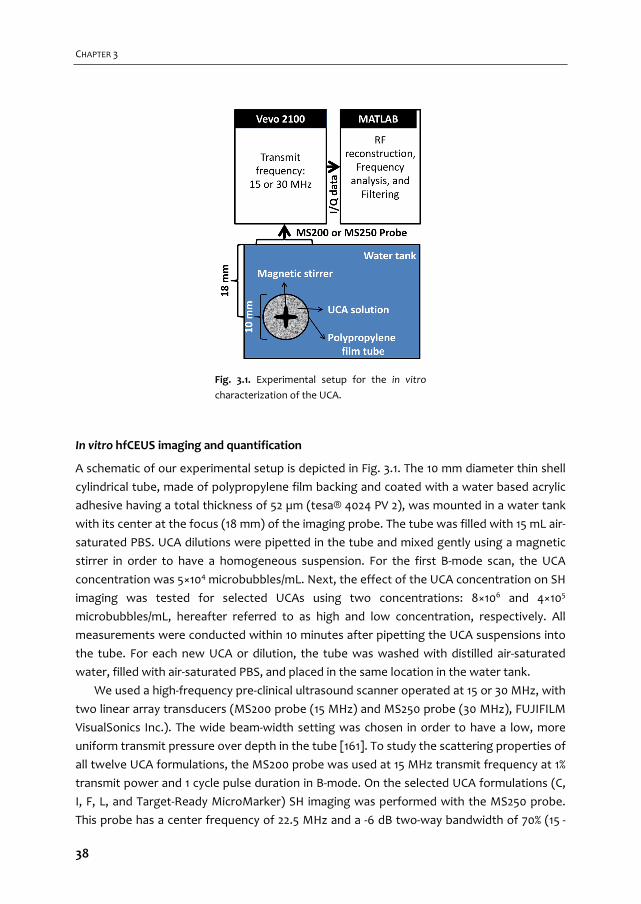
CHAPTER 3
In vitro hfCEUS imaging and quantification
A schematic of our experimental setup is depicted in Fig. 3.1. The 10 mm diameter thin shell
cylindrical tube, made of polypropylene film backing and coated with a water based acrylic
adhesive having a total thickness of 52 µm (tesa® 4024 PV 2), was mounted in a water tank
with its center at the focus (18 mm) of the imaging probe. The tube was filled with 15 mL air‐
saturated PBS. UCA dilutions were pipetted in the tube and mixed gently using a magnetic
stirrer in order to have a homogeneous suspension. For the first B‐mode scan, the UCA
concentration was 5×10⁴ microbubbles/mL. Next, the effect of the UCA concentration on SH
imaging was tested for selected UCAs using two concentrations: 8×10⁶ and 4×10⁵
microbubbles/mL, hereafter referred to as high and low concentration, respectively. All
measurements were conducted within 10 minutes after pipetting the UCA suspensions into
the tube. For each new UCA or dilution, the tube was washed with distilled air‐saturated
water, filled with air‐saturated PBS, and placed in the same location in the water tank.
We used a high‐frequency pre‐clinical ultrasound scanner operated at 15 or 30 MHz, with
two linear array transducers (MS200 probe (15 MHz) and MS250 probe (30 MHz), FUJIFILM
VisualSonics Inc.). The wide beam‐width setting was chosen in order to have a low, more
uniform transmit pressure over depth in the tube [161]. To study the scattering properties of
all twelve UCA formulations, the MS200 probe was used at 15 MHz transmit frequency at 1%
transmit power and 1 cycle pulse duration in B‐mode. On the selected UCA formulations (C,
I, F, L, and Target‐Ready MicroMarker) SH imaging was performed with the MS250 probe.
This probe has a center frequency of 22.5 MHz and a ‐6 dB two‐way bandwidth of 70% (15 ‐
Fig. 3.1. Experimental setup for the in vitro
characterization of the UCA.
38
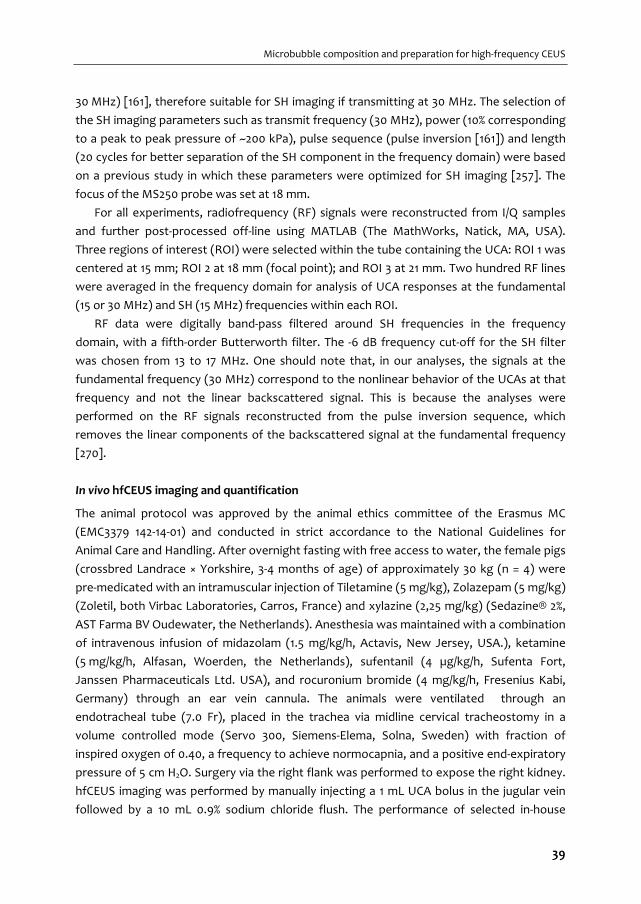
Microbubble composition and preparation for high‐frequency CEUS
30 MHz) [161], therefore suitable for SH imaging if transmitting at 30 MHz. The selection of
the SH imaging parameters such as transmit frequency (30 MHz), power (10% corresponding
to a peak to peak pressure of ~200 kPa), pulse sequence (pulse inversion [161]) and length
(20 cycles for better separation of the SH component in the frequency domain) were based
on a previous study in which these parameters were optimized for SH imaging [257]. The
focus of the MS250 probe was set at 18 mm.
For all experiments, radiofrequency (RF) signals were reconstructed from I/Q samples
and further post‐processed off‐line using MATLAB (The MathWorks, Natick, MA, USA).
Three regions of interest (ROI) were selected within the tube containing the UCA: ROI 1 was
centered at 15 mm; ROI 2 at 18 mm (focal point); and ROI 3 at 21 mm. Two hundred RF lines
were averaged in the frequency domain for analysis of UCA responses at the fundamental
(15 or 30 MHz) and SH (15 MHz) frequencies within each ROI.
RF data were digitally band‐pass filtered around SH frequencies in the frequency
domain, with a fifth‐order Butterworth filter. The ‐6 dB frequency cut‐off for the SH filter
was chosen from 13 to 17 MHz. One should note that, in our analyses, the signals at the
fundamental frequency (30 MHz) correspond to the nonlinear behavior of the UCAs at that
frequency and not the linear backscattered signal. This is because the analyses were
performed on the RF signals reconstructed from the pulse inversion sequence, which
removes the linear components of the backscattered signal at the fundamental frequency
[270].
In vivo hfCEUS imaging and quantification
The animal protocol was approved by the animal ethics committee of the Erasmus MC
(EMC3379 142‐14‐01) and conducted in strict accordance to the National Guidelines for
Animal Care and Handling. After overnight fasting with free access to water, the female pigs
(crossbred Landrace × Yorkshire, 3‐4 months of age) of approximately 30 kg (n = 4) were
pre‐medicated with an intramuscular injection of Tiletamine (5 mg/kg), Zolazepam (5 mg/kg)
(Zoletil, both Virbac Laboratories, Carros, France) and xylazine (2,25 mg/kg) (Sedazine® 2%,
AST Farma BV Oudewater, the Netherlands). Anesthesia was maintained with a combination
of intravenous infusion of midazolam (1.5 mg/kg/h, Actavis, New Jersey, USA.), ketamine
(5 mg/kg/h, Alfasan, Woerden, the Netherlands), sufentanil (4 µg/kg/h, Sufenta Fort,
Janssen Pharmaceuticals Ltd. USA), and rocuronium bromide (4 mg/kg/h, Fresenius Kabi,
Germany) through an ear vein cannula. The animals were ventilated through an
endotracheal tube (7.0 Fr), placed in the trachea via midline cervical tracheostomy in a
volume controlled mode (Servo 300, Siemens‐Elema, Solna, Sweden) with fraction of
inspired oxygen of 0.40, a frequency to achieve normocapnia, and a positive end‐expiratory
pressure of 5 cm H2O. Surgery via the right flank was performed to expose the right kidney.
hfCEUS imaging was performed by manually injecting a 1 mL UCA bolus in the jugular vein
followed by a 10 mL 0.9% sodium chloride flush. The performance of selected in‐house
39

CHAPTER 3
produced UCA formulations (F and L) was compared to that of Target‐Ready MicroMarker.
The order in which they were injected was random. The nonlinear hfCEUS measurements
were recorded using the Vevo 2100 equipped with an MS250 transducer (18 MHz transmit
frequency, 10 frames per second, 10% power, ~400 kPa (MI < 0.1)). The Vevo 2100 uses the
amplitude modulation pulse sequence in the nonlinear contrast imaging mode which mainly
detects the nonlinear fundamental component of the UCA [161]. Immediately after injection
of the UCA into the catheter, the ventilation of the animal was paused to minimize
movement due to breathing. After 25‐30 s the measurement had been completed and the
ventilation was turned on again. Cine loops of side‐by‐side B‐mode and nonlinear contrast
mode images were stored as lossless DICOM images for further offline analysis using
MATLAB. First, correction for tissue motion in the imaging plane was applied as described
previously [271, 272]. Briefly, the motion pattern of tissue in the field of view was extracted
from the B‐mode images and applied to the contrast mode images to correct for the motion
in the field of view. Three regions of interest (ROI) were chosen for every DICOM recording
at a depth of 0.5‐5 mm, 5‐9 mm, and 9‐13.5 mm. For each ROI, all pixel intensities were
summed and normalized to the area of the ROI. The intensity in each frame was obtained to
construct a time‐intensity curve (TIC) and the frames with the maximum intensity were
detected and the mean intensity and standard deviation of this frame and the five frames
before and after this frame were calculated. In addition, alternative ROIs were chosen to
compare contrast enhancement in the artery with that in the microcirculation where no
clear vascularity was visible. The ratio between the intensities in these ROIs was used to
quantify the ability to discriminate the blood vessels from the peripheral enhancement.
Statistics
The ratios for the arteries and microvasculature of Target‐Ready MicroMarker and UCA
formulation F were tested for significance using paired‐samples Student’s t‐tests, after first
ensuring that the data was normally distributed using Shapiro‐Wilk normality tests. A p‐
value < 0.05 was regarded as indicating significance.
3.4. RESULTS
Ultrasound contrast agent preparation
After production, all UCA formulations appeared white as shown in Fig. 3.2 a and b,
indicating that UCAs could be produced with all twelve formulations. UCA formulations D
and J were least white. In addition, both these formulations had the smallest layer of
microbubbles at the top of the aqueous solution in the vial after leaving the vials on the
bench for 2 h (Fig. 3.2 c and d), suggesting a lower amount of microbubbles in these
formulations.
40
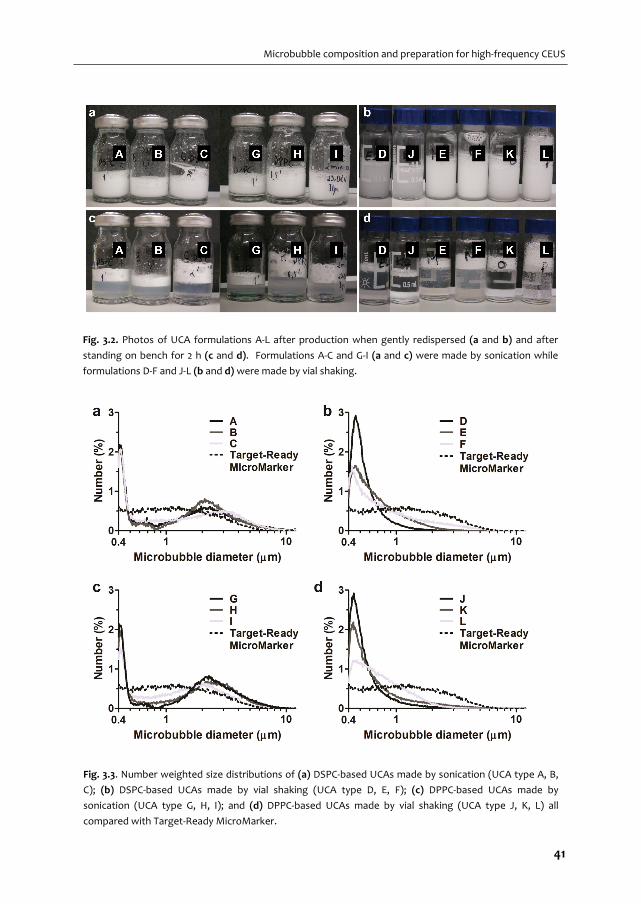
Microbubble composition and preparation for high‐frequency CEUS
Fig. 3.2. Photos of UCA formulations A‐L after production when gently redispersed (a and b) and after
standing on bench for 2 h (c and d). Formulations A‐C and G‐I (a and c) were made by sonication while
formulations D‐F and J‐L (b and d) were made by vial shaking.
Fig. 3.3. Number weighted size distributions of (a) DSPC‐based UCAs made by sonication (UCA type A, B,
C); (b) DSPC‐based UCAs made by vial shaking (UCA type D, E, F); (c) DPPC‐based UCAs made by
sonication (UCA type G, H, I); and (d) DPPC‐based UCAs made by vial shaking (UCA type J, K, L) all
compared with Target‐Ready MicroMarker.
41
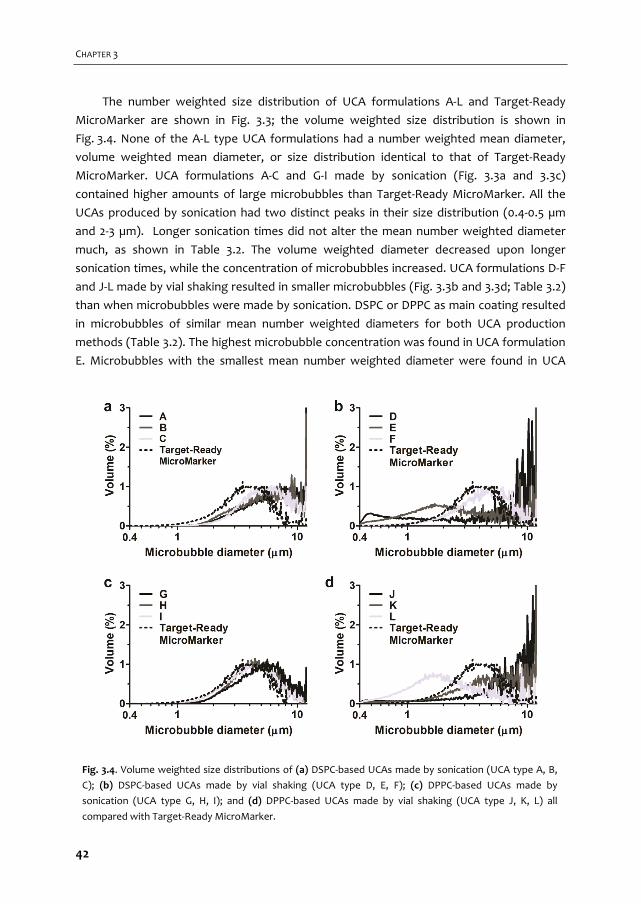
CHAPTER 3
The number weighted size distribution of UCA formulations A‐L and Target‐Ready
MicroMarker are shown in Fig. 3.3; the volume weighted size distribution is shown in
Fig. 3.4. None of the A‐L type UCA formulations had a number weighted mean diameter,
volume weighted mean diameter, or size distribution identical to that of Target‐Ready
MicroMarker. UCA formulations A‐C and G‐I made by sonication (Fig. 3.3a and 3.3c)
contained higher amounts of large microbubbles than Target‐Ready MicroMarker. All the
UCAs produced by sonication had two distinct peaks in their size distribution (0.4‐0.5 µm
and 2‐3 µm). Longer sonication times did not alter the mean number weighted diameter
much, as shown in Table 3.2. The volume weighted diameter decreased upon longer
sonication times, while the concentration of microbubbles increased. UCA formulations D‐F
and J‐L made by vial shaking resulted in smaller microbubbles (Fig. 3.3b and 3.3d; Table 3.2)
than when microbubbles were made by sonication. DSPC or DPPC as main coating resulted
in microbubbles of similar mean number weighted diameters for both UCA production
methods (Table 3.2). The highest microbubble concentration was found in UCA formulation
E. Microbubbles with the smallest mean number weighted diameter were found in UCA
Fig. 3.4. Volume weighted size distributions of (a) DSPC‐based UCAs made by sonication (UCA type A, B,
C); (b) DSPC‐based UCAs made by vial shaking (UCA type D, E, F); (c) DPPC‐based UCAs made by
sonication (UCA type G, H, I); and (d) DPPC‐based UCAs made by vial shaking (UCA type J, K, L) all
compared with Target‐Ready MicroMarker.
42
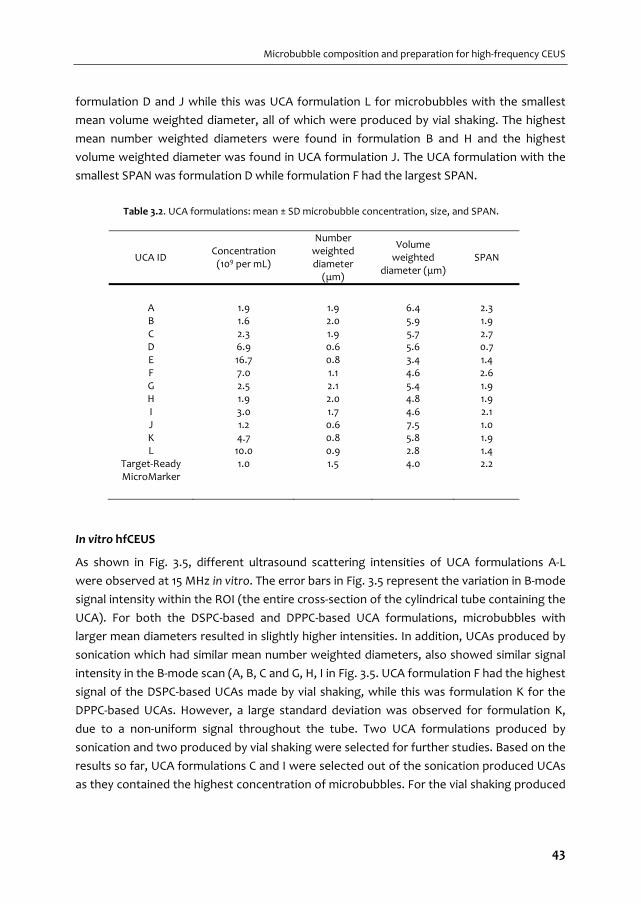
Microbubble composition and preparation for high‐frequency CEUS
formulation D and J while this was UCA formulation L for microbubbles with the smallest
mean volume weighted diameter, all of which were produced by vial shaking. The highest
mean number weighted diameters were found in formulation B and H and the highest
volume weighted diameter was found in UCA formulation J. The UCA formulation with the
smallest SPAN was formulation D while formulation F had the largest SPAN.
Table 3.2. UCA formulations: mean ± SD microbubble concentration, size, and SPAN.
UCA ID Concentration (109 per mL)
Number weighted diameter (μm)
Volume weighted
diameter (μm) SPAN
A 1.9 1.9 6.4 2.3 B 1.6 2.0 5.9 1.9 C 2.3 1.9 5.7 2.7 D 6.9 0.6 5.6 0.7 E 16.7 0.8 3.4 1.4 F 7.0 1.1 4.6 2.6 G 2.5 2.1 5.4 1.9 H 1.9 2.0 4.8 1.9 I 3.0 1.7 4.6 2.1 J 1.2 0.6 7.5 1.0 K 4.7 0.8 5.8 1.9 L 10.0 0.9 2.8 1.4
Target‐Ready MicroMarker
1.0 1.5 4.0 2.2
In vitro hfCEUS
As shown in Fig. 3.5, different ultrasound scattering intensities of UCA formulations A‐L
were observed at 15 MHz in vitro. The error bars in Fig. 3.5 represent the variation in B‐mode
signal intensity within the ROI (the entire cross‐section of the cylindrical tube containing the
UCA). For both the DSPC‐based and DPPC‐based UCA formulations, microbubbles with
larger mean diameters resulted in slightly higher intensities. In addition, UCAs produced by
sonication which had similar mean number weighted diameters, also showed similar signal
intensity in the B‐mode scan (A, B, C and G, H, I in Fig. 3.5. UCA formulation F had the highest
signal of the DSPC‐based UCAs made by vial shaking, while this was formulation K for the
DPPC‐based UCAs. However, a large standard deviation was observed for formulation K,
due to a non‐uniform signal throughout the tube. Two UCA formulations produced by
sonication and two produced by vial shaking were selected for further studies. Based on the
results so far, UCA formulations C and I were selected out of the sonication produced UCAs
as they contained the highest concentration of microbubbles. For the vial shaking produced
43
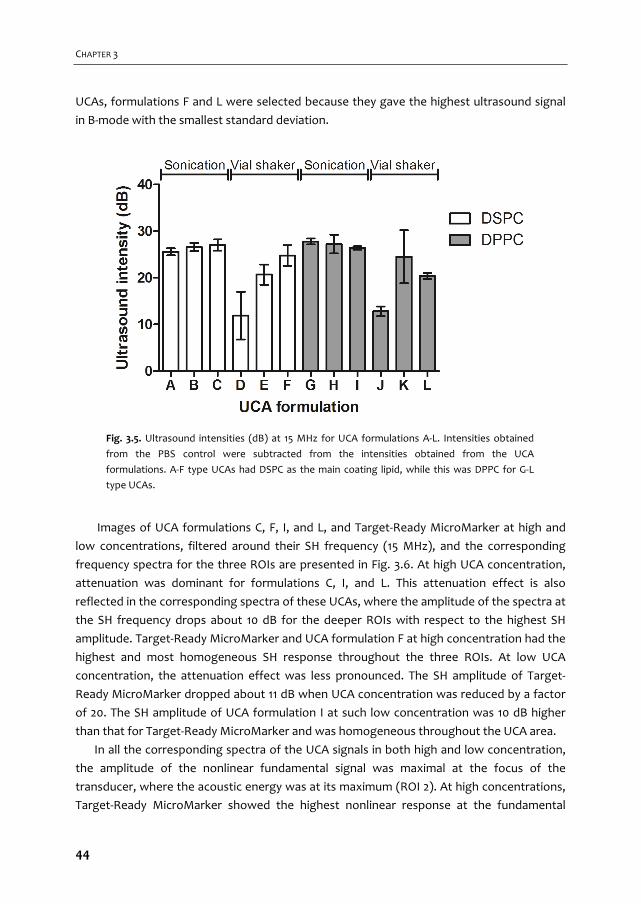
CHAPTER 3
UCAs, formulations F and L were selected because they gave the highest ultrasound signal
in B‐mode with the smallest standard deviation.
Images of UCA formulations C, F, I, and L, and Target‐Ready MicroMarker at high and
low concentrations, filtered around their SH frequency (15 MHz), and the corresponding
frequency spectra for the three ROIs are presented in Fig. 3.6. At high UCA concentration,
attenuation was dominant for formulations C, I, and L. This attenuation effect is also
reflected in the corresponding spectra of these UCAs, where the amplitude of the spectra at
the SH frequency drops about 10 dB for the deeper ROIs with respect to the highest SH
amplitude. Target‐Ready MicroMarker and UCA formulation F at high concentration had the
highest and most homogeneous SH response throughout the three ROIs. At low UCA
concentration, the attenuation effect was less pronounced. The SH amplitude of Target‐
Ready MicroMarker dropped about 11 dB when UCA concentration was reduced by a factor
of 20. The SH amplitude of UCA formulation I at such low concentration was 10 dB higher
than that for Target‐Ready MicroMarker and was homogeneous throughout the UCA area.
In all the corresponding spectra of the UCA signals in both high and low concentration,
the amplitude of the nonlinear fundamental signal was maximal at the focus of the
transducer, where the acoustic energy was at its maximum (ROI 2). At high concentrations,
Target‐Ready MicroMarker showed the highest nonlinear response at the fundamental
Fig. 3.5. Ultrasound intensities (dB) at 15 MHz for UCA formulations A‐L. Intensities obtained
from the PBS control were subtracted from the intensities obtained from the UCA
formulations. A‐F type UCAs had DSPC as the main coating lipid, while this was DPPC for G‐L
type UCAs.
44

Microbubble composition and preparation for high‐frequency CEUS
frequency. However at low concentration, all our in‐house produced UCAs had higher
nonlinear responses at the fundamental frequency than Target‐Ready MicroMarker. The
attenuation effect was similar for the SH response and the nonlinear fundamental response.
UCA formulations C, I, and L showed higher attenuation than Target‐Ready MicroMarker
and UCA formulation F.
In vivo hfCEUS
Of the four formulations that were studied in vitro for their SH and nonlinear fundamental
response, the two best performing UCA formulations were selected for in vivo hfCEUS
studies: F and L. This decision was based on the fact that both the acoustic signal and
microbubble size distribution resembled Target‐Ready MicroMarker the closest. Fig. 3.7
Fig. 3.6. In vitro subharmonic images of Target‐Ready MicroMarker and formulation C, I, F, and L at high
(8.0×10⁶ microbubbles/mL) and low (4.0×10⁵ microbubbles/mL) concentrations (top panel) and the
corresponding spectra of each region of interest at three depths for each image (bottom panel).
45
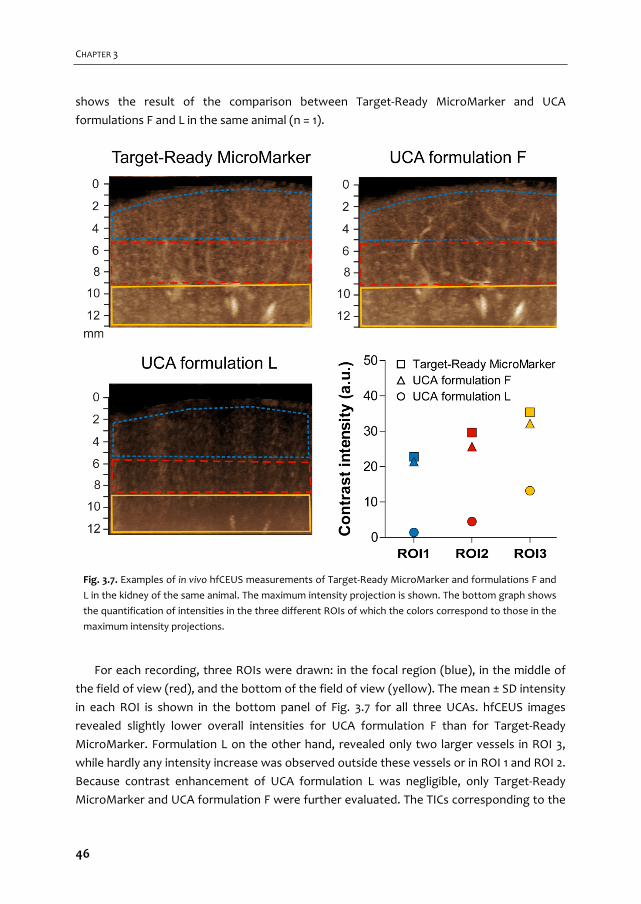
CHAPTER 3
shows the result of the comparison between Target‐Ready MicroMarker and UCA
formulations F and L in the same animal (n = 1).
For each recording, three ROIs were drawn: in the focal region (blue), in the middle of
the field of view (red), and the bottom of the field of view (yellow). The mean ± SD intensity
in each ROI is shown in the bottom panel of Fig. 3.7 for all three UCAs. hfCEUS images
revealed slightly lower overall intensities for UCA formulation F than for Target‐Ready
MicroMarker. Formulation L on the other hand, revealed only two larger vessels in ROI 3,
while hardly any intensity increase was observed outside these vessels or in ROI 1 and ROI 2.
Because contrast enhancement of UCA formulation L was negligible, only Target‐Ready
MicroMarker and UCA formulation F were further evaluated. The TICs corresponding to the
Fig. 3.7. Examples of in vivo hfCEUS measurements of Target‐Ready MicroMarker and formulations F and
L in the kidney of the same animal. The maximum intensity projection is shown. The bottom graph shows
the quantification of intensities in the three different ROIs of which the colors correspond to those in the
maximum intensity projections.
46

Microbubble composition and preparation for high‐frequency CEUS
example in Fig. 3.7 for Target‐Ready MicroMarker (grey) and UCA formulation F (black)
show very similar behavior between both UCAs in all three ROIs (Fig. 3.8).
The experiments comparing Target‐Ready MicroMarker and formulation F (n = 7 in total)
confirmed the observation that the total contrast enhancement of Target‐Ready
MicroMarker was higher, although the difference was lower in ROI 3 (Fig. 3.9).
This implies lower attenuation for UCA formulation F than for Target‐Ready
MicroMarker. Since UCA formulation F seemed to better visualize the larger vessels and
Target‐Ready MicroMarker resulted in more enhancement in the microvasculature (see
Fig. 3.7), we quantified the ratio between enhancement in the arteries and the
microvasculature for all injections. The symbols that are used in Fig. 3.9 correspond to those
in Fig. 3.10, and quantification of the example in Fig. 3.7 ( ) shows better discrimination of
the artery from the microvasculature for UCA formulation F. Although this example showed
Fig. 3.8. Time‐intensity curves (TICs) of Target‐Ready MicroMarker (grey) and UCA
formulation F (black) for the different ROIs as shown in Fig. 3.7. The TICs
correspond to the same injections as the example shown in Fig. 3.7.
47

CHAPTER 3
a clear difference, overall the differences between Target‐Ready MicroMarker and UCA
formulation F were not significant (p > 0.05).
We also verified the reproducibility of UCA formulation F by repetitive injection in the
same animal (n = 3) and found similar intensities in ROI 1 and ROI 3 between the first and
second injection (Fig. 3.11). In ROI 2 the second injection was 17% lower than the first
injection. The third injection was 39% lower than the first injection in ROI 1, 31% lower in
ROI 2, and only 11% lower in ROI 3. We verified that the baseline values before the start of
each measurement were comparable. Reproducibility for Target‐Ready MicroMarker was
not studied.
Fig. 3.10. Comparison of the ratios of contrast
enhancement in the arteries and the
microvasculature between Target‐Ready
MicroMarker (grey) and UCA formulation F
(white). The symbols, identical to the symbols in
Fig. 3.9, indicate the data obtained from the same
paired injection where indicates the example
shown in Fig. 3.7 (measurement 1, animal a).
Measurement 2 was performed in animal b and
measurements 3‐7 in animal c. The lines connect
the paired injections (injected in random order).
Differences between the two UCAs were not
significant.
Fig. 3.9. Complete comparison of Target‐Ready
MicroMarker and UCA formulation F. The markers
indicate the mean peak intensity of each
measurement, the bars the corresponding
standard deviation (n = 7). The symbols indicate
the data obtained from the same paired injection
where indicates the example shown in Fig. 3.7
(measurement 1, animal a). Measurement 2 was
performed in animal b and measurements 3‐7 in
animal c.
48
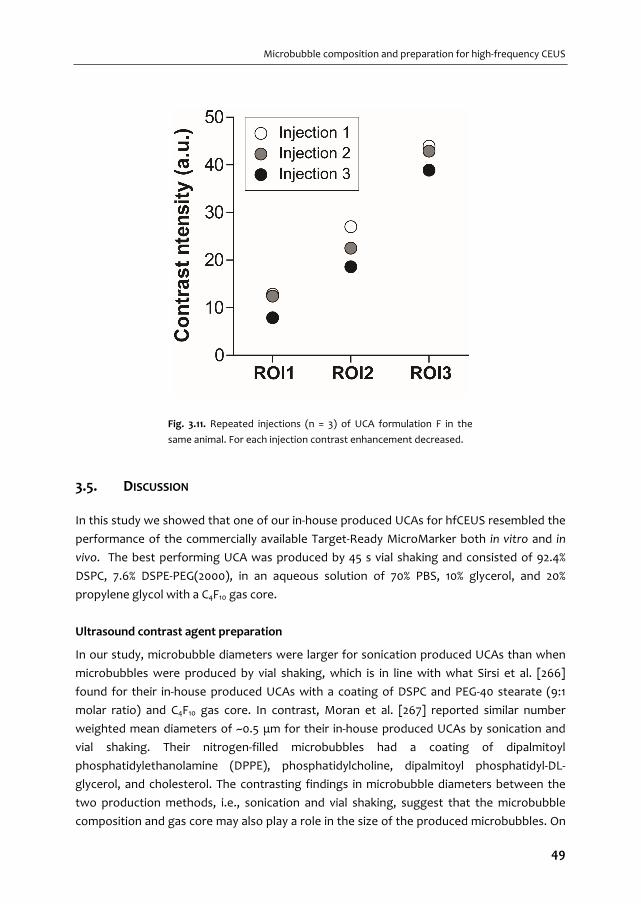
Microbubble composition and preparation for high‐frequency CEUS
3.5. DISCUSSION
In this study we showed that one of our in‐house produced UCAs for hfCEUS resembled the
performance of the commercially available Target‐Ready MicroMarker both in vitro and in
vivo. The best performing UCA was produced by 45 s vial shaking and consisted of 92.4%
DSPC, 7.6% DSPE‐PEG(2000), in an aqueous solution of 70% PBS, 10% glycerol, and 20%
propylene glycol with a C4F10 gas core.
Ultrasound contrast agent preparation
In our study, microbubble diameters were larger for sonication produced UCAs than when
microbubbles were produced by vial shaking, which is in line with what Sirsi et al. [266]
found for their in‐house produced UCAs with a coating of DSPC and PEG‐40 stearate (9:1
molar ratio) and C4F10 gas core. In contrast, Moran et al. [267] reported similar number
weighted mean diameters of ~0.5 μm for their in‐house produced UCAs by sonication and
vial shaking. Their nitrogen‐filled microbubbles had a coating of dipalmitoyl
phosphatidylethanolamine (DPPE), phosphatidylcholine, dipalmitoyl phosphatidyl‐DL‐
glycerol, and cholesterol. The contrasting findings in microbubble diameters between the
two production methods, i.e., sonication and vial shaking, suggest that the microbubble
composition and gas core may also play a role in the size of the produced microbubbles. On
Fig. 3.11. Repeated injections (n = 3) of UCA formulation F in the
same animal. For each injection contrast enhancement decreased.
49

CHAPTER 3
the other hand, different probe‐sonication devices were used in these studies (Sonicator
Ultrasonic Processor XL2020 in our study; Branson Ultrasonics Model 250A by Sirsi et al.
[266, 273]; Soniprep 150 by Moran et al. [267]) which could have given different ultrasonic
power outputs thereby influencing the microbubble size distribution [264].
We previously reported [70] that 10 s sonication for the same UCA formulations as A‐C
(DSPC‐based) and G‐I (DPPC‐based) resulted in microbubbles with a mean number weighted
diameter of 4.2 and 3.9 μm respectively. Although sonication for 60 s resulted in smaller
microbubbles (~2 μm in mean number weighted diameter; see Table 3.2), the number
weighted mean diameter was similar after 60, 90 or 120 s sonication. This was also observed
by Moran et al. [267] who reported that the number weighted mean diameter of ~0.5 μm
did not change when the sonication time was varied between 30, 60, 90, or 300 s for their
lipid‐coated microbubbles (coating composition see above). However, the number
weighted size distribution of our UCAs produced by sonication had two peaks (0.4‐0.5 µm
and 2‐3 µm; Fig. 3.3). A longer sonication time seemed to produce lower amounts of large
microbubbles (> 2 µm) and more microbubbles in between the peaks (0.5‐2 µm). This result
is confirmed with the changes in the volume weighted mean diameters which decreased
with increasing sonication time. In addition, microbubble concentrations increased for
longer sonication times. It is likely that more microbubbles can be produced during longer
sonication times because excess unincorporated lipids are always present when
microbubbles are made by sonication [138]. The increase in the concentration and the
changes in the size distribution of the UCA suggest that longer sonication times can break
up bigger microbubbles into smaller ones.
Our in‐house produced UCA formulations D and J were made by vial shaking in the
absence of glycerol and propylene glycol, just as Sirsi et al. [266] and Moran et al. [267] did.
On the other hand, glycerol and propylene glycol are often added to increase the fluid
viscosity when making UCAs in‐house by vial shaking [47, 265, 268, 269] and are also
present in the clinically approved Definity [9]. When the concentrations of glycerol and
propylene glycol were increased from 0%/0% to 5%/5% and 10%/20% v/v, we found varying
results on microbubble size and concentration. For the DPPC‐based UCAs (formulations J, K,
and L) increasing the concentration of glycerol and propylene glycol increased the
microbubble concentration and the number weighted mean diameter. For the DSPC‐based
UCAs (formulations D, E and F), the number weighted mean diameter followed the same
trend. The concentration of the microbubbles, on the other hand, first increased with 5%/5%
glycerol and propylene glycol and decreased for the highest concentration. In addition, UCA
formulations F and L were more stable after 2 h than those without glycerol and propylene
glycol. This suggests that glycerol and propylene glycol can play a role not only in increasing
the concentration of the microbubbles, but also on the stability of the produced
microbubbles. This increased stability of UCA formulations F and L was also observed in the
increased intensity in the in vitro B‐mode images of these UCAs.
50
Microbubble composition and preparation for high‐frequency CEUS
In vitro hfCEUS
In an in vitro setup, mimicking a practical imaging condition, we showed that both the shell
microstructure of microbubbles as well as their size distribution have a considerable impact
on their nonlinear behavior both at the SH and fundamental frequencies. All our homemade
UCAs showed high nonlinear behavior when excited at 30 MHz, which was comparable to
the commercially available Target‐Ready MicroMarker. Such high nonlinear response at
both the SH and fundamental frequencies can be attributed to the small sizes of all studied
microbubbles. The larger microbubbles in formulations C and I (2‐3 µm) accounted for more
attenuation at high concentrations. This hypothesis is confirmed by the lower attenuation
of the smaller microbubbles in UCAs F and L, while the nonlinear responses remained high.
The attenuation effect was more pronounced for the SH component than the nonlinear
responses at the fundamental frequency. This is perhaps due to the threshold behavior of
SH oscillations [184]. The microbubbles at the lower part of the focal zone may not have
been excited with sufficiently high pressures to undergo SH oscillation. However, when the
concentration was 20× lower, the SH response of these larger microbubbles became
stronger and more homogeneous throughout the sample.
Comparison of UCA formulations C and I with similar size distributions but different main
lipid component, showed that the DPPC‐based UCA formulation I showed higher nonlinear
responses at both the fundamental and SH frequencies. At low concentration, the response
of UCA formulation I at the fundamental and SH frequency was 6 and 3 dB higher,
respectively, than for the DSPC‐based UCA formulation C. This higher SH response has also
been reported by van Rooij et al. [260] utilizing optical single microbubble spectroscopy in
the range of 1‐4 MHz.
The small size of Target‐Ready MicroMarker microbubbles seems to play an important
role in its nonlinear behavior, particularly for the SH response at high‐frequency excitation.
The majority of the microbubbles have a diameter below 1.5 µm, corresponding to a
resonance frequency around and higher than 15 MHz [274, 275]. It is conventionally thought
that SH generation is achieved most readily (i.e., at lowest pressure threshold) when
microbubbles are excited at twice their resonance frequency [258]. This means that for the
majority of the Target‐Ready MicroMarker microbubbles, the 30 MHz excitation used in this
study is around twice their resonance frequency. Indeed, high amplitude SH response of
Target‐Ready MicroMarker UCA has previously been reported by Helfield et al. [259],
although they studied individual microbubbles in an acoustical setup. Another reason for
the high SH behavior of the UCAs we observed may be the rectangular shape of the
excitation used in the Vevo 2100 scanner. It has been reported that rectangular‐shaped
excitations generate a self‐demodulation signal which enhances the SH response of
microbubbles [184, 257]. Our in vitro results show that Target‐Ready MicroMarker is also
producing a strong nonlinear response at the fundamental frequency. This characteristic is
51
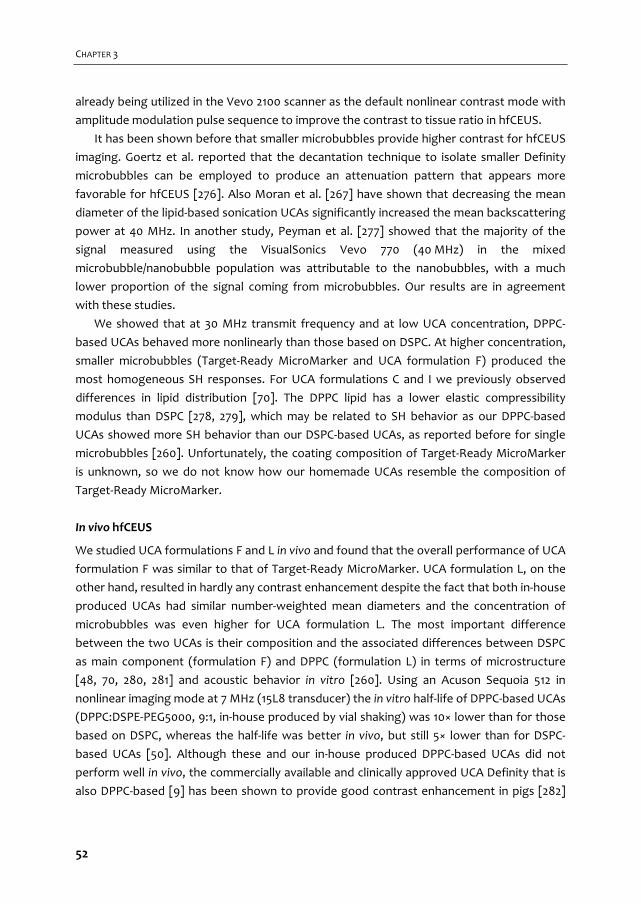
CHAPTER 3
already being utilized in the Vevo 2100 scanner as the default nonlinear contrast mode with
amplitude modulation pulse sequence to improve the contrast to tissue ratio in hfCEUS.
It has been shown before that smaller microbubbles provide higher contrast for hfCEUS
imaging. Goertz et al. reported that the decantation technique to isolate smaller Definity
microbubbles can be employed to produce an attenuation pattern that appears more
favorable for hfCEUS [276]. Also Moran et al. [267] have shown that decreasing the mean
diameter of the lipid‐based sonication UCAs significantly increased the mean backscattering
power at 40 MHz. In another study, Peyman et al. [277] showed that the majority of the
signal measured using the VisualSonics Vevo 770 (40 MHz) in the mixed
microbubble/nanobubble population was attributable to the nanobubbles, with a much
lower proportion of the signal coming from microbubbles. Our results are in agreement
with these studies.
We showed that at 30 MHz transmit frequency and at low UCA concentration, DPPC‐
based UCAs behaved more nonlinearly than those based on DSPC. At higher concentration,
smaller microbubbles (Target‐Ready MicroMarker and UCA formulation F) produced the
most homogeneous SH responses. For UCA formulations C and I we previously observed
differences in lipid distribution [70]. The DPPC lipid has a lower elastic compressibility
modulus than DSPC [278, 279], which may be related to SH behavior as our DPPC‐based
UCAs showed more SH behavior than our DSPC‐based UCAs, as reported before for single
microbubbles [260]. Unfortunately, the coating composition of Target‐Ready MicroMarker
is unknown, so we do not know how our homemade UCAs resemble the composition of
Target‐Ready MicroMarker.
In vivo hfCEUS
We studied UCA formulations F and L in vivo and found that the overall performance of UCA
formulation F was similar to that of Target‐Ready MicroMarker. UCA formulation L, on the
other hand, resulted in hardly any contrast enhancement despite the fact that both in‐house
produced UCAs had similar number‐weighted mean diameters and the concentration of
microbubbles was even higher for UCA formulation L. The most important difference
between the two UCAs is their composition and the associated differences between DSPC
as main component (formulation F) and DPPC (formulation L) in terms of microstructure
[48, 70, 280, 281] and acoustic behavior in vitro [260]. Using an Acuson Sequoia 512 in
nonlinear imaging mode at 7 MHz (15L8 transducer) the in vitro half‐life of DPPC‐based UCAs
(DPPC:DSPE‐PEG5000, 9:1, in‐house produced by vial shaking) was 10× lower than for those
based on DSPC, whereas the half‐life was better in vivo, but still 5× lower than for DSPC‐
based UCAs [50]. Although these and our in‐house produced DPPC‐based UCAs did not
perform well in vivo, the commercially available and clinically approved UCA Definity that is
also DPPC‐based [9] has been shown to provide good contrast enhancement in pigs [282]
52
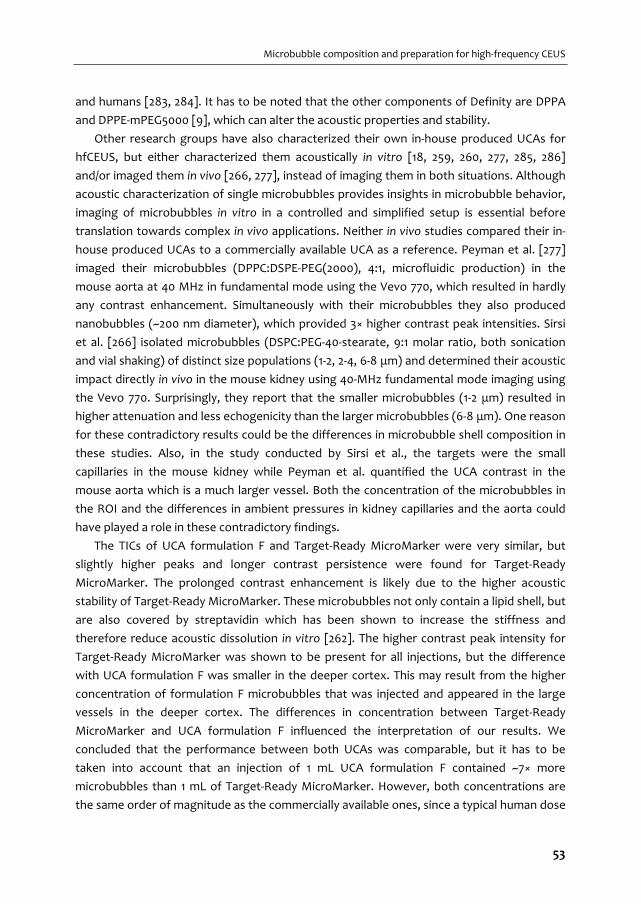
Microbubble composition and preparation for high‐frequency CEUS
and humans [283, 284]. It has to be noted that the other components of Definity are DPPA
and DPPE‐mPEG5000 [9], which can alter the acoustic properties and stability.
Other research groups have also characterized their own in‐house produced UCAs for
hfCEUS, but either characterized them acoustically in vitro [18, 259, 260, 277, 285, 286]
and/or imaged them in vivo [266, 277], instead of imaging them in both situations. Although
acoustic characterization of single microbubbles provides insights in microbubble behavior,
imaging of microbubbles in vitro in a controlled and simplified setup is essential before
translation towards complex in vivo applications. Neither in vivo studies compared their in‐
house produced UCAs to a commercially available UCA as a reference. Peyman et al. [277]
imaged their microbubbles (DPPC:DSPE‐PEG(2000), 4:1, microfluidic production) in the
mouse aorta at 40 MHz in fundamental mode using the Vevo 770, which resulted in hardly
any contrast enhancement. Simultaneously with their microbubbles they also produced
nanobubbles (~200 nm diameter), which provided 3× higher contrast peak intensities. Sirsi
et al. [266] isolated microbubbles (DSPC:PEG‐40‐stearate, 9:1 molar ratio, both sonication
and vial shaking) of distinct size populations (1‐2, 2‐4, 6‐8 μm) and determined their acoustic
impact directly in vivo in the mouse kidney using 40‐MHz fundamental mode imaging using
the Vevo 770. Surprisingly, they report that the smaller microbubbles (1‐2 μm) resulted in
higher attenuation and less echogenicity than the larger microbubbles (6‐8 μm). One reason
for these contradictory results could be the differences in microbubble shell composition in
these studies. Also, in the study conducted by Sirsi et al., the targets were the small
capillaries in the mouse kidney while Peyman et al. quantified the UCA contrast in the
mouse aorta which is a much larger vessel. Both the concentration of the microbubbles in
the ROI and the differences in ambient pressures in kidney capillaries and the aorta could
have played a role in these contradictory findings.
The TICs of UCA formulation F and Target‐Ready MicroMarker were very similar, but
slightly higher peaks and longer contrast persistence were found for Target‐Ready
MicroMarker. The prolonged contrast enhancement is likely due to the higher acoustic
stability of Target‐Ready MicroMarker. These microbubbles not only contain a lipid shell, but
are also covered by streptavidin which has been shown to increase the stiffness and
therefore reduce acoustic dissolution in vitro [262]. The higher contrast peak intensity for
Target‐Ready MicroMarker was shown to be present for all injections, but the difference
with UCA formulation F was smaller in the deeper cortex. This may result from the higher
concentration of formulation F microbubbles that was injected and appeared in the large
vessels in the deeper cortex. The differences in concentration between Target‐Ready
MicroMarker and UCA formulation F influenced the interpretation of our results. We
concluded that the performance between both UCAs was comparable, but it has to be
taken into account that an injection of 1 mL UCA formulation F contained ~7× more
microbubbles than 1 mL of Target‐Ready MicroMarker. However, both concentrations are
the same order of magnitude as the commercially available ones, since a typical human dose
53

CHAPTER 3
of Definity contains 4.2×10⁹ microbubbles [9] and a typical dose of SonoVue/Lumason varies
between 3.0×10⁸ and 1.1×10⁹ microbubbles [8]. In addition, the concentration of
microbubbles between batches of Target‐Ready MicroMarker that were used in our
experiments varied between 2.6×10⁸ and 1.3×10⁹ microbubbles/mL (n = 5). These
concentrations were assessed by us and are in line with what others have reported, namely
8.4×10⁸ [164], 9.2×10⁸ [162], and 1.9×10⁹ [287]. The batch to batch variability in microbubble
concentration for our UCA formulation F ranged from 2.1×10⁹ to 5.5×10⁹ microbubbles/mL
(n = 5 batches) and was therefore narrower than for Target‐Ready MicroMarker. The
variation in the mean microbubble diameter (both number and volume weighted) were
similar for Target‐Ready MicroMarker and our in‐house produced UCA formulation F. The
number weighted mean diameter for Target‐Ready MicroMarker was 1.8 ± 0.4, the volume‐
weighted mean diameter was 4.6 ± 0.8 while this was 1.2 ± 0.1 and 5.6 ± 1.0 for our in‐house
produced F type UCA (both n = 5 batches). The variability in microbubble size and
concentration can be caused by vial handling, even within manufacturer’s recommended
procedures, as has been suggested by Goertz et al. [276].
Repeated bolus injections of UCA formulation F in the same animal resulted in
significantly less enhancement for the third injection. Others have reported differences
between consecutive injections in cats [288] and mice [289, 290]. In the kidney and spleen
of healthy cats, the second bolus injection of SonoVue resulted in higher peak intensities
[288]. Dizeux et al. [290] reported that the maximum intensity (peak enhancement) was
constant for four consecutive injections in the healthy renal murine cortex, but increased
from the second to the fourth injection in renal tumor tissue. In contrast, Rix et al. [289]
reported constant peak enhancement in murine liver tumors and decreasing peak
enhancement with consecutive injections in the healthy liver. We can only conclude that
variability in consecutive injections is a known issue for CEUS and differs between
organisms and organs.
Limitations
The main limitation of using in‐house produced UCAs is that it can be challenging to produce
them under Good Manufacturing Practice conditions [291]. For example, batch to batch
reproducibility may be an issue, as is sterility. However, for terminal preclinical experiments
as in our study, the UCAs do not have to be sterile. For longitudinal preclinical experiments,
there are options for sterilization of lipid formulations [292, 293]. In our in vivo experiments
we used nonlinear fundamental imaging at 18 MHz with amplitude modulation instead of SH
imaging with pulse inversion at 30 MHz as used in vitro. Although SH imaging is free from
nonlinear propagation artifacts, nonlinear fundamental imaging with amplitude modulation
provides higher contrast to tissue ratio with Vevo 2100 [257].
54

Microbubble composition and preparation for high‐frequency CEUS
3.6. CONCLUSION
Our results suggest that our UCA formulation F performs equally well as Target‐Ready
MicroMarker in hfCEUS imaging. This study shows that small UCAs having high nonlinear
responses for hfCEUS can be produced by mechanical agitation, a shell composition of
92.4% DSPC, 6.4% DSPE‐PEG(2000) and 1.2% DSPE‐PEG(2000)‐biotin encapsulating a C4F10 gas
core, in a PBS‐based liquid with 10% glycerol and 20% propylene glycol.
Acknowledgements
The authors greatly thank all colleagues who made the experiments possible for their help
and support, especially Y. Ince from the Department of Translational Physiology, Academic
Medical Center, Amsterdam, the Netherlands and the Dept. of Intensive Care Adults,
Erasmus MC, Rotterdam, the Netherlands; and M. Sorelli from the Dept. of Intensive Care
Adults, Erasmus MC, Rotterdam, the Netherlands and the Department of Information
Engineering, University of Florence, Florence, Italy.
55

56
DSPC or DPPC as main shell component influences ligand
distribution and binding area of lipid‐coated targeted microbubbles
Klazina Kooiman, Tom J.A. Kokhuis, Tom van Rooij, Ilya Skachkov, Alex Nigg, Johannes G. Bosch, Antonius F.W. van der Steen, Wiggert A. van Cappellen, Nico de Jong European Journal of Lipid Science and Technology, 116:9, 1217–1227 (2014)
4 Chapter
57

CHAPTER 4
4.1. ABSTRACT
Ultrasound contrast agents (UCA) consist of gas‐filled coated microbubbles with diameters
of 1‐10 µm. Targeted UCA can bind to biomarkers associated with disease through coating‐
incorporated ligands, making ultrasound molecular imaging possible. The aim of our
research was to compare the ligand distribution, binding area, and bound microbubble
shape of 1,2‐distearoyl‐sn‐glycero‐3‐phosphocholine (DSPC) based and 1,2‐dipalmitoyl‐sn‐
glycero‐3‐phosphocholine (DPPC) based lipid‐coated microbubbles using super‐resolution
microscopy. Ligand distribution was studied by conjugating the fluorescent streptavidin
Oregon Green 488 to the biotinylated microbubbles. An inhomogeneous streptavidin
distribution was found when DSPC was the main coating lipid. When DSPC was replaced by
DPPC, a more homogeneous streptavidin distribution was observed. Binding area of
targeted microbubbles was studied using biotinylated microbubbles bound to a
streptavidin‐coated surface. DSPC microbubbles had a significantly smaller binding area
than DPPC microbubbles. Whereas the bound DSPC microbubbles remained spherical, the
DPPC microbubbles were dome‐shaped. This study reveals that lipid‐coated microbubbles
differ in ligand distribution, binding area, and bound microbubble shape solely on the basis
of their main lipid component.
4.2. INTRODUCTION
Ultrasound imaging is a widely used non‐invasive diagnostic imaging modality. In the 1990s
the first ultrasound contrast agents (UCA) became available for clinical use [64, 294]. UCA
consist of a fluid comprised of coated gas microbubbles with diameters between 1 and 10
µm. Upon intravenous administration, UCA stay within the vascular tree as they are too
large to extravasate [64, 65]. Initially, UCA were mainly used to improve diagnostic
ultrasound imaging, such as enhancing the contrast for the detection of the heart wall
border. Current applications also include detailed analysis of blood volume and flow in
cardiology and radiology, for example to detect myocardium perfusion defects and tumors
[32, 62, 65, 295]. Recent research has also shown the potential of UCA for therapeutic
applications such as drug delivery and molecular imaging [296‐298].
The UCA shell improves the lifetime of the microbubbles after intravenous
administration. Current clinically available UCA are comprised of a lipid monolayer or
albumin coating with a gas core composed of a high molecular weight inert gas, for
example perfluorobutane (C4F10) [5, 299]. Ligands can be conjugated to the UCA shell,
resulting in targeted or functionalized microbubbles, making ultrasound molecular imaging
possible. Molecular imaging is an emerging field and aims to image molecular changes
associated with diseases by imaging biological processes in living systems at the cellular and
molecular level. Preclinically, ultrasound molecular imaging has shown its potential for
inflammation, ischemia‐reperfusion injury, angiogenesis, and thrombi [297, 298]. Recently,
58

DSPC vs DPPC: Ligand distribution and binding area
the successful first human phase 0 clinical trial for prostate cancer was presented [89],
using a lipid coated microbubble targeted to vascular endothelial growth factor receptor 2
(VEGFR2).
For ultrasound molecular imaging, two steps are important: 1) binding of the targeted
microbubble to the biomarker, and 2) imaging of the bound targeted microbubble using
ultrasound. Several groups have focused on increasing binding of targeted microbubbles by
applying acoustic radiation force to push the bubbles to the biomarkers on the vessel wall
[300], deflating the microbubble which results in excess shell surface area [95], conjugating
two [108] or three [109] different ligands to the coating, or varying ligand linker length [110].
Studies have not focused on the distribution of the ligand on the microbubble coating, even
though Borden et al reported an heterogeneous ligand distribution, where the ligand was
located in fine lines between domains [47]. However, this was reported for a microbubble
~20 μm in size, which is not a clinically relevant size. It is not thoroughly investigated
whether ligand distributions are also heterogeneous for microbubbles of clinically relevant
sizes or for different lipid coating compositions. A homogeneous ligand distribution could
be more advantageous than a heterogeneous ligand distribution due to an increased
probability of a successful binding event, especially in large vessels with high blood flow
[301].
Research is ongoing to distinguish bound from unbound targeted microbubbles using
ultrasound [136, 140, 302], and to determine the binding force of bound targeted
microbubbles [82, 121, 123]. Larger targeted microbubbles have a larger binding area and
therefore a higher binding force as more bonds can be formed. At the same time, the shear
forces on the bound microbubble as a result of blood flow will also be higher for larger
microbubbles, and thus persistence after binding will be lower for larger microbubbles.
Modeling has predicted the optimal targeted microbubble size for binding to be 2 – 4 μm in
diameter [111]. However, the shape of the bound microbubble was assumed spherical, but it
is not known if targeted microbubbles remain spherical upon binding.
The aim of our research was to compare the ligand distribution, binding area, and bound
microbubble shape of 1,2‐distearoyl‐sn‐glycero‐3‐phosphocholine (DSPC) based and 1,2‐
dipalmitoyl‐sn‐glycero‐3‐phosphocholine (DPPC) based lipid‐coated targeted microbubbles
using high‐resolution microscopy. The DSPC microbubble, which we previously used in a
drug delivery study [35], resembles the clinically approved UCA SonoVue in coating
composition (coating composition: polyethylene glycol (PEG(4000); Molecular weight (MW)
4000), DSPC, and 1,2‐dihexadecanoyl‐sn‐glycero‐3‐phospho‐(1'‐rac‐glycerol) (DPPG) [7]). The
DPPC based microbubbles resemble the clinically approved UCA Definity (coating
composition: DPPC, 1,2‐dihexadecanoyl‐sn‐glycero‐3‐phosphate (DPPA), and 1,2‐dipalmitoyl‐
sn‐glycero‐3‐phosphoethanolamine(polyethylene glycol) (DPPE‐PEG(5000); Molecular
weight 5000) [9]).
59

CHAPTER 4
4.3. MATERIALS AND METHODS
Materials
DPPC, 1,2‐distearoyl‐sn‐glycero‐3‐phosphoethanolamine‐N‐carboxy(polyethylene glycol)
(DSPE‐PEG(2000); MW 2000), 1,2‐distearoyl‐sn‐glycero‐3‐phosphoethanolamine‐N‐
biotinyl(polyethylene glycol) (DSPE‐PEG(2000)‐biotin; MW 2000) were purchased from
Avanti Polar Lipids, USA. DSPC, polyoxyethylene (40) stearate (PEG‐40 stearate) were
obtained from Sigma. Perfluorobutane (C4F10) was purchased from Linde Gas Benelux.
Streptavidin Oregon Green 488, streptavidin Oregon Green 514, 1,1'‐dioctadecyl‐3,3,3',3'‐
tetramethylindodicarbocyanine perchlorate (DiD), 100 nm yellow‐green fluorescent beads
were obtained from Molecular Probes (F8803), Life Technologies. PD‐10 desalting columns
were purchased from GE Healthcare Bio‐Sciences. Custom polycarboxylate hydrogel‐coated
(1.5 micron) quartz glasses (30 mm in diameter, 0.22 mm thickness), amine coupling kit
(containing EDC∙HCl, activation buffer, borate elution buffer, and quenching buffer) were
purchased from XanTec bioanalytics GmbH, Germany.
Preparation of microbubbles
Biotinylated lipid coated microbubbles (composition in mol%: DSPC or DPPC 59.4; PEG‐40
stearate 35.7; DSPE‐PEG(2000) 4.1, DSPE‐PEG(2000)‐biotin 0.8) with a C4F10 gas core were
made by sonication for 10 seconds using the method described by Klibanov et al [129]. DSPC
microbubbles refer to the microbubbles with DSPC as main coating component, DPPC
microbubbles to those with DPPC as main coating component.
Microbubble size distribution
Microbubble size distributions were measured on a Coulter Counter Multisizer 3 (n = 3)
(Beckman Coulter, Mijdrecht, the Netherlands). A 50 m aperture tube was used, allowing
quantification between 1 and 30 m using a linear spacing between the 256 channels.
Polydispersity of the samples was assessed by the SPAN, defined as (d90%‐d10%)/d50%
where d90%, d10% and d50% are the microbubble diameters below which 90, 10, and 50% of
the cumulative amount of microbubbles is found.
Ligand distribution within microbubble coating
Ligand conjugation
The ligand fluorescent streptavidin Oregon Green 488 was conjugated to the biotinylated
microbubbles as described by Lindner et al [132]. Briefly, microbubbles were washed by
flotation by placing the microbubble solution in a 3 mL syringe with one‐way tap and leaving
to stand. After 45 min, the subnatant was drained, and the microbubbles were suspended in
1 mL of PBS saturated with C4F10 and drained. Then, 110 μL of streptavidin (1 mg/mL) was
60

DSPC vs DPPC: Ligand distribution and binding area
quickly spinned using a Microspin FV‐2400 (Biosan Ltd), and 90 μL of the streptavidin
solution was added to 7×10⁸ microbubbles. This was incubated on ice for 30 minutes. Excess
streptavidin was washed by flotation as above.
Ligand distribution visualization
The streptavidin‐conjugated microbubbles were mounted in 87% glycerol (v/v in PBS) and
were visualized three dimensionally with super resolution on a Leica TCS 4Pi confocal laser‐
scanning microscope [303, 304] using a matched pair of aligned opposing 100× glycerol HCX
PL APO objective lenses (Numerical aperture 1.35). The lenses were aligned using 100 nm
fluorescent beads [305]. Image stacks were recorded as y‐stacked xz‐scans in a green (500‐
550 nm) spectral channel. Each xz‐slice consisted of 512×512 pixels with a pixel size of 30×30
nm and was averaged twofold. The y‐distance between neighboring xz‐slices was 90 nm. An
Argon laser (488 nm) was used for excitation. Volume rendering of the image stacks was
performed using the “voltex” function of the program AMIRA (Version 5.2.2, FEI, Mérignac
Cedex, France).
Semi‐automatic analysis of ligand distribution heterogeneity
The heterogeneity of the ligand distribution was analyzed with custom software written in
MATLAB (Mathworks, Natick, MA, USA) using the 3D‐stacks described before. For both
microbubble types, 30 randomly chosen microbubbles were analyzed. In a first step, the
center point of the microbubble was manually annotated in one of the xz‐slices. Next, the
program computed the radial intensity profiles for 100 angles (i.e. at multiples of 2 π/100
radians), using the manually selected center as starting point. After this, a circle was fitted
through the intensity maxima using a MATLAB routine based on the method as described by
Taubin [306], from which the radius (Rfit) and origin (Ofit) of the fluorescent contour within
the xz‐slice were obtained. All the pixels located within 90 nm from Rfit, defined as the
region of interest (ROI), were included in the heterogeneity analysis. The ROI was
subdivided in 32 angular parts (i.e. each π/16 radians); for each angular part the mean
fluorescence pixel intensity (Ipart) was calculated. This procedure was repeated for a range
of xz‐slices spatially distributed around the equatorial plane of the bubble, whereby the
origin of the best circle fit (Ofit) within a slice was used as starting center point for the radial
intensity profiles in the adjacent xz‐slice. Only xz‐slices with a value for Rfit which was larger
than 75% of the value of Rfit in the equatorial plane of that particular bubble were included in
the analysis. This was because towards the caps of the microbubbles, the xz‐slices had a
fluorescence pattern of filled circles, instead of a fluorescent rim surrounding a dark core,
which could not be processed with the same contour tracking algorithm. On average, 35 xz‐
slices were included per bubble, resulting in on average 35 × 32 = 1120 angular parts per
bubble, from which the median part intensity per bubble (Îmedian) was calculated. An
individual angular part was classified as an inhomogeneity when the absolute difference
61

CHAPTER 4
between the mean fluorescence intensity of this part (Ipart) and the median part intensity of
the bubble (Îmedian) was more than two‐third of the value of Îmedian (i.e. |Ipart ‐ Îmedian| >
2/3 × Îmedian). From this, the percentage of parts classified as an inhomogeneity per
microbubble, being a measure for inhomogeneous ligand distribution, was calculated for
both microbubble types.
Statistics
Statistical analysis was performed using IBM SPSS Statistics 20. First, Shapiro‐Wilk normality
tests were performed to determine if the standard deviation and mean were significantly
different from a normal distribution. Both distributions were not normally distributed
(DSPC: p = 0.001, DPPC: p < 0.001) and hence we used non‐parametric testing. The Mann‐
Whitney U test was used to identify whether the percentages of parts classified as an
inhomogeneity were significantly different between both microbubble types. A p‐
value < 0.05 was regarded as significant.
Binding area of targeted microbubbles
Targeted microbubbles and surface coating
The binding area of biotinylated microbubbles and a streptavidin surface was studied by
adding the lipid dye DiD to the microbubbles before sonication and covalently linking
fluorescent streptavidin Oregon Green 514 to the hydrogel‐coated quartz glass. For the
covalent linkage, streptavidin was first dissolved in acetate buffer (2 mM, pH 5.4) (1 mg/mL),
and desalted using a PD‐10 desalting column according to the manufacturer’s instructions.
After desalting, the concentration of streptavidin was determined spectrophotometrically
using a calibration curve on a VarioskanTM Flash (Thermo Scientific). The desalted
streptavidin was covalently linked to the hydrogel‐coated quartz glasses according to the
instructions of the manufacturer. Briefly, the quartz glass was placed in a 6‐well plate (BD)
and incubated with 2.5 mL of borate elution buffer (1 M sodium chloride, 0.1 M sodium
carbonate buffer, pH 10) for 10 min on a rotating shaker (model KM‐2, Edmund Bűhler
GmbH, 125 Mot 1/min). After three washes with 3 mL MilliQ, the glasses were rinsed with
2 mL of 1.0% (w/v) EDC∙HCl in activation buffer, and then incubated for 15 minutes in the dark
in 3 mL of 1.0% (w/v) EDC∙HCl in activation buffer. After three washes with MilliQ, the glasses
were incubated for two hours with 1.6 mL of desalted streptavidin Oregon Green 514
(40 μg/mL) on the rotating shaker. This was followed by 30 minutes incubation with 2.5 mL
quenching buffer. Then, the glasses were washed three times with PBS. Just before adding
the microbubbles, the glass was washed once with PBS containing calcium and magnesium
(PBS +/+) and the microbubbles were allowed to adhere to the streptavidin‐coated surface
by flotation. For this, the glasses were placed in a custom‐made holder with a 10 mL volume
filled with PBS +/+. The microbubbles were injected under the glass using a bended blunt
19 G‐needle. After 5 minutes, the glass was gently washed three times with PBS +/+ using a
62
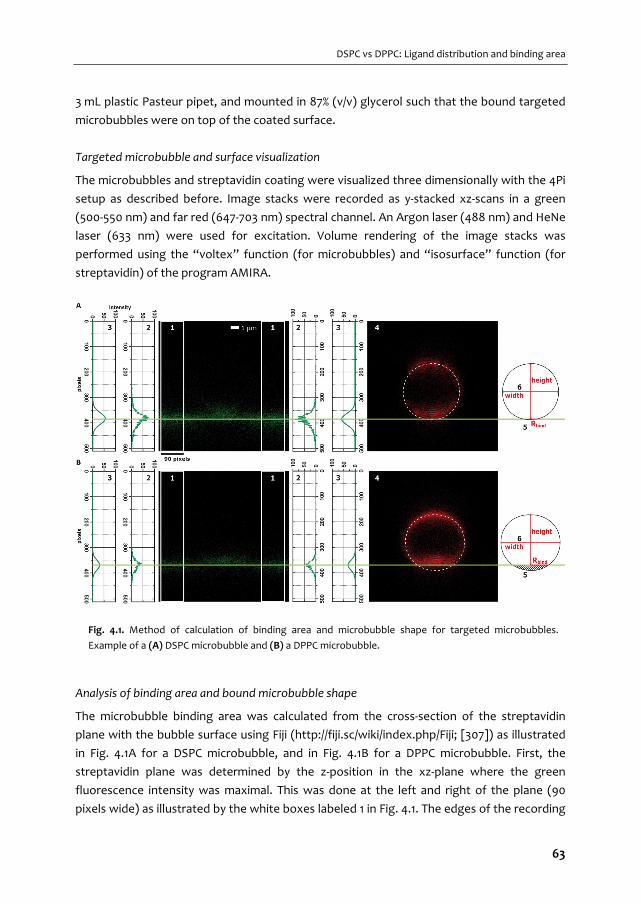
DSPC vs DPPC: Ligand distribution and binding area
3 mL plastic Pasteur pipet, and mounted in 87% (v/v) glycerol such that the bound targeted
microbubbles were on top of the coated surface.
Targeted microbubble and surface visualization
The microbubbles and streptavidin coating were visualized three dimensionally with the 4Pi
setup as described before. Image stacks were recorded as y‐stacked xz‐scans in a green
(500‐550 nm) and far red (647‐703 nm) spectral channel. An Argon laser (488 nm) and HeNe
laser (633 nm) were used for excitation. Volume rendering of the image stacks was
performed using the “voltex” function (for microbubbles) and “isosurface” function (for
streptavidin) of the program AMIRA.
Analysis of binding area and bound microbubble shape
The microbubble binding area was calculated from the cross‐section of the streptavidin
plane with the bubble surface using Fiji (http://fiji.sc/wiki/index.php/Fiji; [307]) as illustrated
in Fig. 4.1A for a DSPC microbubble, and in Fig. 4.1B for a DPPC microbubble. First, the
streptavidin plane was determined by the z‐position in the xz‐plane where the green
fluorescence intensity was maximal. This was done at the left and right of the plane (90
pixels wide) as illustrated by the white boxes labeled 1 in Fig. 4.1. The edges of the recording
Fig. 4.1. Method of calculation of binding area and microbubble shape for targeted microbubbles.
Example of a (A) DSPC microbubble and (B) a DPPC microbubble.
63
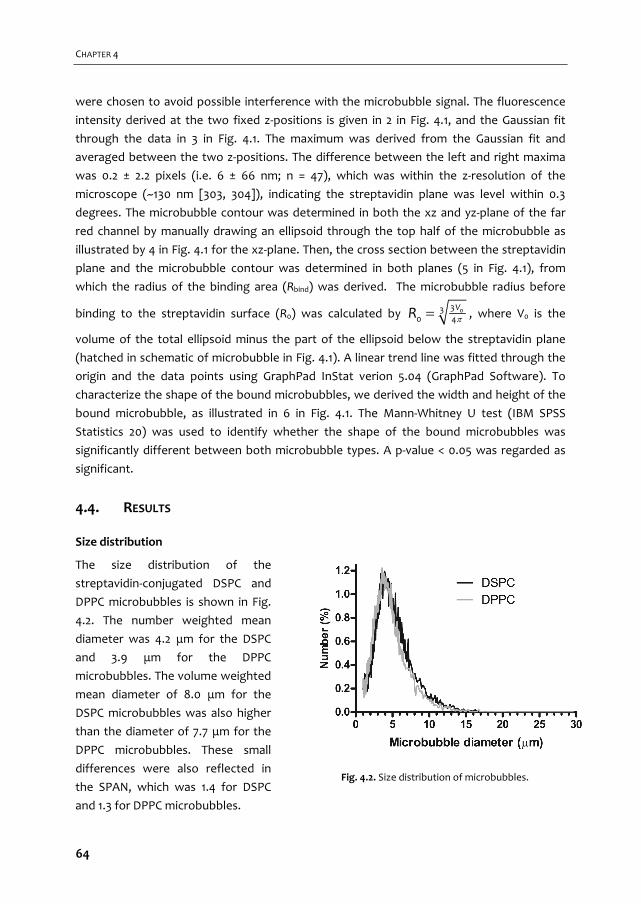
CHAPTER 4
were chosen to avoid possible interference with the microbubble signal. The fluorescence
intensity derived at the two fixed z‐positions is given in 2 in Fig. 4.1, and the Gaussian fit
through the data in 3 in Fig. 4.1. The maximum was derived from the Gaussian fit and
averaged between the two z‐positions. The difference between the left and right maxima
was 0.2 ± 2.2 pixels (i.e. 6 ± 66 nm; n = 47), which was within the z‐resolution of the
microscope (~130 nm [303, 304]), indicating the streptavidin plane was level within 0.3
degrees. The microbubble contour was determined in both the xz and yz‐plane of the far
red channel by manually drawing an ellipsoid through the top half of the microbubble as
illustrated by 4 in Fig. 4.1 for the xz‐plane. Then, the cross section between the streptavidin
plane and the microbubble contour was determined in both planes (5 in Fig. 4.1), from
which the radius of the binding area (Rbind) was derived. The microbubble radius before
binding to the streptavidin surface (R0) was calculated by 0330 4
VR , where V0 is the
volume of the total ellipsoid minus the part of the ellipsoid below the streptavidin plane
(hatched in schematic of microbubble in Fig. 4.1). A linear trend line was fitted through the
origin and the data points using GraphPad InStat verion 5.04 (GraphPad Software). To
characterize the shape of the bound microbubbles, we derived the width and height of the
bound microbubble, as illustrated in 6 in Fig. 4.1. The Mann‐Whitney U test (IBM SPSS
Statistics 20) was used to identify whether the shape of the bound microbubbles was
significantly different between both microbubble types. A p‐value < 0.05 was regarded as
significant.
4.4. RESULTS
Size distribution
The size distribution of the
streptavidin‐conjugated DSPC and
DPPC microbubbles is shown in Fig.
4.2. The number weighted mean
diameter was 4.2 μm for the DSPC
and 3.9 μm for the DPPC
microbubbles. The volume weighted
mean diameter of 8.0 μm for the
DSPC microbubbles was also higher
than the diameter of 7.7 μm for the
DPPC microbubbles. These small
differences were also reflected in
the SPAN, which was 1.4 for DSPC
and 1.3 for DPPC microbubbles.
Fig. 4.2. Size distribution of microbubbles.
64
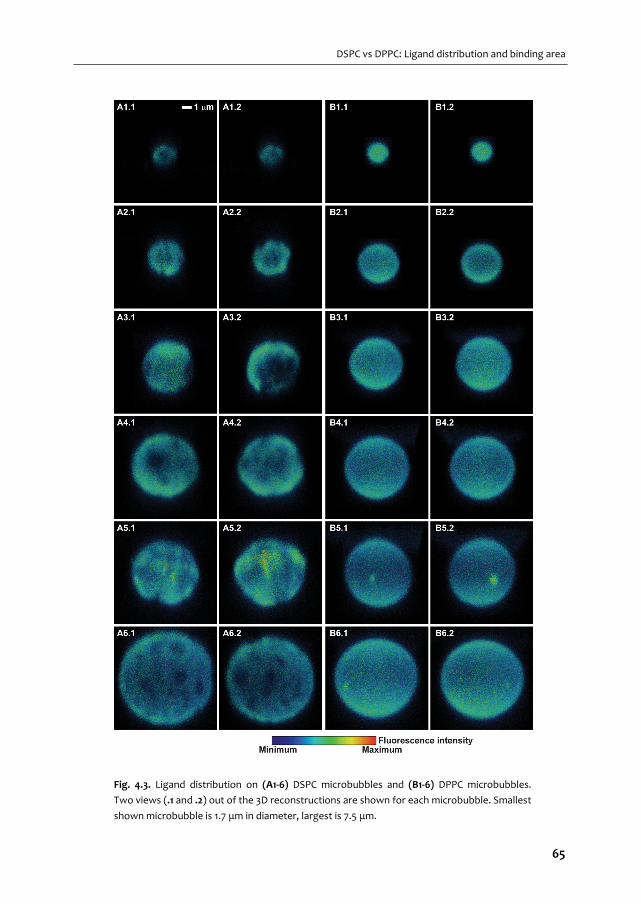
DSPC vs DPPC: Ligand distribution and binding area
Fig. 4.3. Ligand distribution on (A1‐6) DSPC microbubbles and (B1‐6) DPPC microbubbles.
Two views (.1 and .2) out of the 3D reconstructions are shown for each microbubble. Smallest
shown microbubble is 1.7 μm in diameter, largest is 7.5 μm.
65
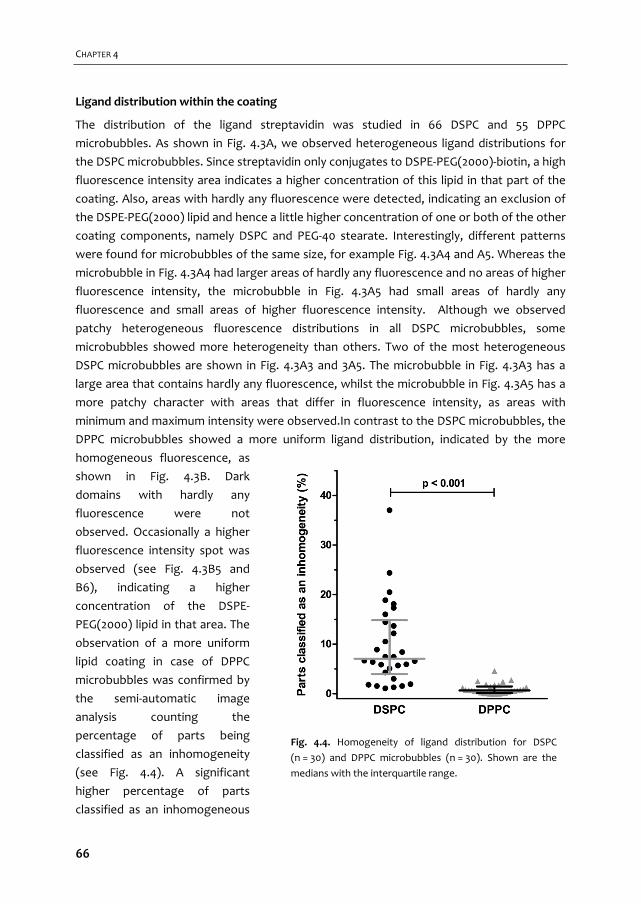
CHAPTER 4
Ligand distribution within the coating
The distribution of the ligand streptavidin was studied in 66 DSPC and 55 DPPC
microbubbles. As shown in Fig. 4.3A, we observed heterogeneous ligand distributions for
the DSPC microbubbles. Since streptavidin only conjugates to DSPE‐PEG(2000)‐biotin, a high
fluorescence intensity area indicates a higher concentration of this lipid in that part of the
coating. Also, areas with hardly any fluorescence were detected, indicating an exclusion of
the DSPE‐PEG(2000) lipid and hence a little higher concentration of one or both of the other
coating components, namely DSPC and PEG‐40 stearate. Interestingly, different patterns
were found for microbubbles of the same size, for example Fig. 4.3A4 and A5. Whereas the
microbubble in Fig. 4.3A4 had larger areas of hardly any fluorescence and no areas of higher
fluorescence intensity, the microbubble in Fig. 4.3A5 had small areas of hardly any
fluorescence and small areas of higher fluorescence intensity. Although we observed
patchy heterogeneous fluorescence distributions in all DSPC microbubbles, some
microbubbles showed more heterogeneity than others. Two of the most heterogeneous
DSPC microbubbles are shown in Fig. 4.3A3 and 3A5. The microbubble in Fig. 4.3A3 has a
large area that contains hardly any fluorescence, whilst the microbubble in Fig. 4.3A5 has a
more patchy character with areas that differ in fluorescence intensity, as areas with
minimum and maximum intensity were observed.In contrast to the DSPC microbubbles, the
DPPC microbubbles showed a more uniform ligand distribution, indicated by the more
homogeneous fluorescence, as
shown in Fig. 4.3B. Dark
domains with hardly any
fluorescence were not
observed. Occasionally a higher
fluorescence intensity spot was
observed (see Fig. 4.3B5 and
B6), indicating a higher
concentration of the DSPE‐
PEG(2000) lipid in that area. The
observation of a more uniform
lipid coating in case of DPPC
microbubbles was confirmed by
the semi‐automatic image
analysis counting the
percentage of parts being
classified as an inhomogeneity
(see Fig. 4.4). A significant
higher percentage of parts
classified as an inhomogeneous
Fig. 4.4. Homogeneity of ligand distribution for DSPC
(n = 30) and DPPC microbubbles (n = 30). Shown are the
medians with the interquartile range.
66

DSPC vs DPPC: Ligand distribution and binding area
were found for DSPC microbubbles than for DPPC microbubbles. No relation was found
between the inhomogeneity and the microbubble diameters.
Binding area of targeted microbubbles
Fig. 4.5A shows examples of targeted DSPC microbubbles (in red) bound to the
streptavidin‐coated surface (in green) and Fig. 4.5B shows examples of targeted DPPC
microbubbles. In these cases, the streptavidin was covalently linked to the hydrogel‐coated
quartz glass, and we observed no streptavidin fluorescence on the microbubble surface.
This in contrast to when we coated an Opticell membrane with streptavidin by
physisorption (as previously described [123]), when we also observed streptavidin on both
the DSPC and DPPC microbubbles, most likely due to rolling of the microbubbles before
binding.
When the binding area of the targeted microbubbles to the covalently linked
streptavidin was calculated, we found a factor of ~2.3 smaller binding radii for DSPC
microbubbles (factor ~5.3 for binding area) than for DPPC microbubbles, based on the
slope of the fit as shown in Fig. 4.6. For both microbubble types, the binding radii increased
with the microbubble size, albeit that the increase was larger for the DPPC than for the
DSPC microbubbles. To characterize the shape of the bound microbubbles, we derived the
Fig. 4.5. (A) Targeted DSPC and (B) DPPC microbubbles (red fluorescent) bound to streptavidin‐coated
surface (green fluorescent; covalently linked).
67
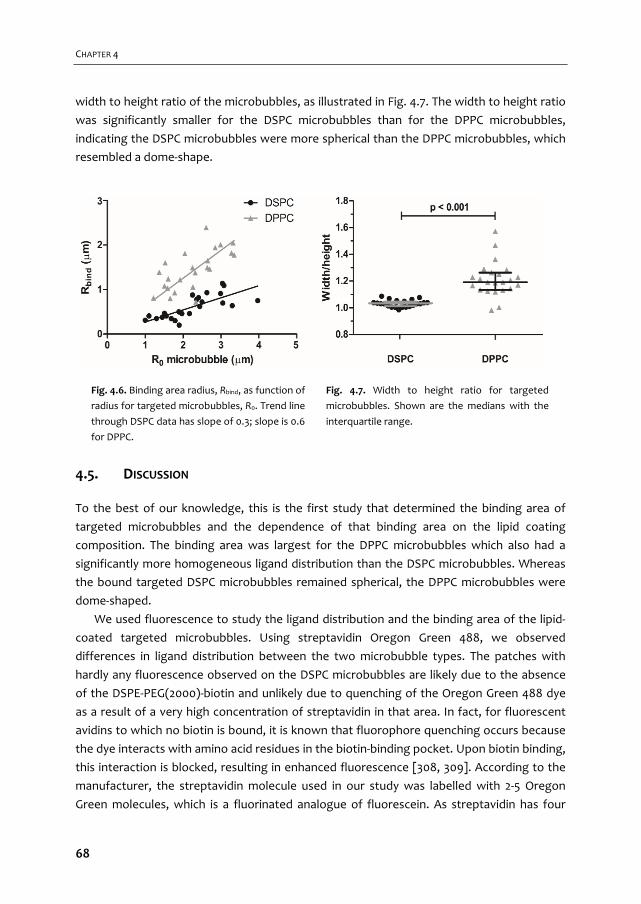
CHAPTER 4
width to height ratio of the microbubbles, as illustrated in Fig. 4.7. The width to height ratio
was significantly smaller for the DSPC microbubbles than for the DPPC microbubbles,
indicating the DSPC microbubbles were more spherical than the DPPC microbubbles, which
resembled a dome‐shape.
4.5. DISCUSSION
To the best of our knowledge, this is the first study that determined the binding area of
targeted microbubbles and the dependence of that binding area on the lipid coating
composition. The binding area was largest for the DPPC microbubbles which also had a
significantly more homogeneous ligand distribution than the DSPC microbubbles. Whereas
the bound targeted DSPC microbubbles remained spherical, the DPPC microbubbles were
dome‐shaped.
We used fluorescence to study the ligand distribution and the binding area of the lipid‐
coated targeted microbubbles. Using streptavidin Oregon Green 488, we observed
differences in ligand distribution between the two microbubble types. The patches with
hardly any fluorescence observed on the DSPC microbubbles are likely due to the absence
of the DSPE‐PEG(2000)‐biotin and unlikely due to quenching of the Oregon Green 488 dye
as a result of a very high concentration of streptavidin in that area. In fact, for fluorescent
avidins to which no biotin is bound, it is known that fluorophore quenching occurs because
the dye interacts with amino acid residues in the biotin‐binding pocket. Upon biotin binding,
this interaction is blocked, resulting in enhanced fluorescence [308, 309]. According to the
manufacturer, the streptavidin molecule used in our study was labelled with 2‐5 Oregon
Green molecules, which is a fluorinated analogue of fluorescein. As streptavidin has four
Fig. 4.6. Binding area radius, Rbind, as function of
radius for targeted microbubbles, R0. Trend line
through DSPC data has slope of 0.3; slope is 0.6
for DPPC.
Fig. 4.7. Width to height ratio for targeted
microbubbles. Shown are the medians with the
interquartile range.
68
DSPC vs DPPC: Ligand distribution and binding area
biotin binding pockets, multiple biotins could have bound per streptavidin if the biotinylated
lipid concentration was high enough, resulting in an even higher, not a lower, fluorescence
intensity in areas with a high concentration of the DSPE‐PEG(2000)‐biotin lipid. This may
have caused the higher intensity patches observed in the shell of the DSPC microbubbles.
Surface microstructures are common for lipid‐coated microbubbles, and have also been
reported for a mixture of two out of the three components of our DSPC microbubbles,
namely a mixture of DSPC and DSPE‐PEG(2000) [46, 47], and a mixture of DSPC and PEG‐40
stearate [48, 49]. As lipid coatings on microbubbles are monolayers, the results of
microbubble studies can be compared to monolayer films formed at an air/water interface.
The observed heterogeneous lipid distributions in the coating of our and previously
reported microbubbles is in agreement with studies of lipid monolayer films as immiscibility
has been reported for all different mixtures of DSPC and DSPE‐PEG(2000). PEG‐40‐stearate
is reported to be in the expanded phase only and mixes with other expanded phase lipids,
but is immiscible with lipids in the condensed phase [48]. Since DSPC is in the condensed
phase only [280], PEG‐40 stearate is immiscible with this lipid. DSPE‐PEG(2000) can be in the
expanded or condensed phase [280]. When it is in the expanded phase it will be miscible
with PEG‐40 stearate, but when it is in the condensed phase it will be immiscible with PEG‐
40 stearate. Lozano and Longo [280] showed miscibility of DPPC and DSPE‐PEG(2000) in
both the expanded and condensed phase, suggesting this mixture would result in a
homogeneous lipid coating for microbubbles. When we replaced DSPC by DPPC, we indeed
observed a homogeneous distribution of DSPE‐PEG(2000) within the coating of the
microbubbles. This supports our assumption that in our experiments the lipids are
immiscible (DSPC microbubbles) or miscible (DPPC microbubbles) which is the explanation
for respectively the presence and absence of surface microstructures. The occasionally
observed small higher intensity fluorescence spots on the DPPC microbubbles could be
explained by folds or buckles that form locally on the microbubble coating due to excess
lipids [310].
In our study we observed different patterns for DSPC microbubbles of the same size,
which is in contrast to what has previously been reported for microbubble coating mixtures
of DSPC and PEG‐40 stearate [49]. A different coating composition for our microbubbles
could be the reason, as could be the variation in lipid concentrations per microbubble. Both
could also be the explanation why we did not observe the DSPE‐PEG(2000) in fine lines
between domains, as previously reported by others [47].
Surface microstructures resulting in inhomogeneous lipid distributions could be
disadvantageous for microbubbles used as drug carrier system when drugs are conjugated
to the lipids. One such drug carrier system is drug‐filled liposomes conjugated to the coating
via DSPE‐PEG(2000) [311]. A homogeneous DSPE‐PEG(2000) distribution would be optimal
to avoid competition during the conjugation of the liposomes. A maximum amount of drug
69
CHAPTER 4
can therefore be loaded onto the microbubbles, which based on our current study favors
DPPC over DSPC as main lipid for the coating.
Several strategies have been reported to improve binding of targeted microbubbles [95,
108‐110, 300] , but these have not included varying the lipid coating composition. In addition
to differences in ligand distribution, we also found differences in binding area between both
microbubble types. DSPE‐PEG(2000) is often used to conjugate ligands to the microbubble
coating, either by coupling via streptavidin or by covalent coupling [138]. For the binding
area experiment, we used the lipid dye DiD to fluorescently label the microbubbles. As this
type of lipid dye co‐localizes with the DSPE‐PEG(2000)‐biotin lipid [47], it is a good indicator
for the binding area. We indeed observed a similar dye pattern as when streptavidin Oregon
Green 488 was conjugated to the microbubbles, namely a heterogeneous distribution for
the DSPC microbubbles and a homogeneous distribution for the DPPC microbubbles. It
needs to be further investigated whether a heterogeneous or homogeneous ligand
distribution or a smaller or larger binding area is best for binding probability, and binding
strength of targeted microbubbles. Differences between small microvessels, where
microbubbles will be in close proximity to the vessel wall on all sides, and larger vessels,
where the blood flow is also significantly higher [301], will have to be taken into account
when investigating the binding probability. Although the binding area for the DSPC
microbubbles was smaller, this does not imply that the binding force is weaker. As the
ligand distribution is heterogeneous throughout the coating of DSPC microbubbles, we also
frequently observed areas with high concentrations of the ligand. More ligand molecules
within a small area could therefore have a binding force equal to a lower amount of ligand
molecules distributed over a larger area. The shape of the bound microbubble could also be
very important as the effect of blood shear forces is expected to be stronger on spherical
than on domed‐shape microbubbles. This again favors DPPC over DSPC for targeting
microbubbles. The domed shape of the DPPC microbubbles suggests a more elastic coating,
which is in line with DPPC having a lower elastic compressibility modulus than DSPC [278,
279].
A limitation of our study is that microbubbles bound under static conditions using biotin‐
streptavidin as artificial ligand‐biomarker pair. Our future research will focus on binding
targeted microbubbles to disease related biomarker under flow conditions. However, our
findings can be used to improve the binding of targeted microbubbles and aid in the
ongoing research to distinguish bound from unbound targeted microbubbles using
ultrasound. Overvelde showed that the binding itself results in a resonance frequency shift
and a 30% difference in vibration amplitude [20]. It is therefore expected that a difference in
binding area will also change the acoustic behavior. Acoustic stability of the bound targeted
microbubbles is also important, and will have to be further investigated for both
microbubble types. The relation between the acoustic behavior of microbubbles and
surface microstructures is unknown [310] and will be subject for our future studies.
70

DSPC vs DPPC: Ligand distribution and binding area
Nonetheless, heterogeneous lipid distributions could be contributing to differences in
acoustical responses of similar sized bubbles [312]. In addition, our findings may be used for
modeling, as modeling has greatly aided the understanding and prediction of non‐targeted
microbubble behavior in an acoustic field [5], but is still in its infancy for targeted
microbubbles.
4.6. CONCLUSIONS
This study reveals that lipid‐coated microbubbles differ in DSPE‐PEG(2000) lipid and ligand
distribution, binding area, and bound microbubble shape solely on the basis of their main
lipid component. A homogeneous ligand distribution, larger binding area and dome‐shape
upon binding could be advantageous for binding of targeted microbubbles, thereby
favoring DPPC over DSPC as main lipid for UCA for ultrasound molecular imaging.
Acknowledgement
The authors are grateful to Prof. dr. A.L. Klibanov from the University of Virginia,
Cardiovascular Division, Charlottesville, Virginia, USA for discussions about the microbubble
preparation. The authors thank the Erasmus Optical Imaging Centre of Erasmus MC for use
of their facilities, and Michiel Manten from the Dept. of Biomedical Engineering, Erasmus
MC for technical assistance. We also thank Prof. dr. A. Blume, Dept. Biophysical Chemistry,
Martin Luther University Halle‐Wittenberg, Germany, for discussions about the results, and
Paul van den Berg from the Dept. of Clinical Genetics, Erasmus MC, for the
spectrophotometer measurements, and Dr. E. Gedig from XanTec bioanalytics GmbH,
Germany, for discussions about the covalent coating of streptavidin to the quartz glasses.
This research is supported by the Center for Translational Molecular Medicine and the Dutch
Heart Foundation (PARISk), the Dutch Technology Foundation STW, and NanoNextNL, a
micro and nanotechnology consortium of the Government of the Netherlands and 130
partners.
71

72

Non‐linear response and viscoelastic
properties of lipid‐coated microbubbles: DSPC versus DPPC
Tom van Rooij, Ying Luan, Guillaume Renaud, Antonius F.W. van der Steen, Michel Versluis, Nico de Jong, Klazina Kooiman Ultrasound in Medicine & Biology, 41:5, 1432–1445 (2015)
5 Chapter
73
CHAPTER 5
5.1. ABSTRACT
For successful in vivo contrast‐enhanced ultrasound imaging (CEUS) and ultrasound molecu‐
lar imaging, detailed knowledge of stability and acoustical properties of the microbubbles is
essential. Here, we compare these aspects of lipid‐coated microbubbles that have either
DSPC or DPPC as their main lipid; the other components were identical. The microbubbles
were investigated in vitro over a frequency range of 1‐4 MHz and at pressures between 10‐
100 kPa and their response to the applied ultrasound was recorded using ultra‐high‐speed
imaging (15 Mfps). Relative to DPPC‐coated microbubbles, DSPC‐coated microbubbles had 1)
higher acoustical stability; 2) higher shell elasticity as derived using the Marmottant model
(DSPC: 0.26 ± 0.13 N/m, DPPC: 0.06 ± 0.06 N/m); 3) pressure amplitudes twice as high at the
second harmonic frequency; and 4) a smaller amount of microbubbles that responded at
the subharmonic frequency. Due to their higher acoustical stability and higher nonlinear
response, DSPC‐coated microbubbles may be more suitable for CEUS.
5.2. INTRODUCTION
Ultrasound contrast agents (UCAs) consist of gas‐filled coated microbubbles with diameters
between 1 and 10 μm. Clinically, they have been used for several decades for contrast‐
enhanced ultrasound imaging (CEUS) [32, 62, 313]. More recent studies have shown their
potential for local drug delivery and ultrasound molecular imaging [36, 209, 297].
To increase their lifetime after injection into the bloodstream, the microbubbles are stabi‐
lized with a coating. Three lipid‐coated UCAs are approved for diagnostic CEUS: Definity
(Lantheus Medical Imaging, North Billerica, MA, USA), Sonazoid (Daiichi Sankyo Co. Ltd., GE
Healthcare, Tokyo, Japan), and SonoVue (Bracco Imaging S.p.A., Milan, Italy). A complete
and updated list of approving agencies can be found elsewhere [314]. The responses to
ultrasound of Definity and SonoVue have been thoroughly characterized [125‐128], as well as
the responses of several lipid‐coated microbubbles for research purposes [20, 135, 148, 285].
Although all of these microbubble types are coated with a combination of lipids, it is unclear
how the different lipids affect their stability, and the microbubbles’ response to ultrasound.
The hydrophobic chain length of the phospholipids incorporated in the microbubble shell
was found to influence the dissolution of the microbubbles; passive dissolution rates de‐
creased for chains of 16 C‐atoms (DPPC, 1,2‐dipalmitoyl‐sn‐glycero‐3‐phosphocholine) up to
22 C‐atoms (DBPC, 1,2‐dibehenoyl‐sn‐glycero‐3‐phosphocholine), but increased again for
chains of 24 C‐atoms [50, 285]. The influence of chain length on ultrasound‐driven dissolu‐
tion (i.e. acoustical stability) was different from that of passive dissolution. When exposed
to ultrasound, microbubbles that had lipids with 16 C‐atoms incorporated in their shell were
still least stable, whereas those with lipids having 18 C‐atoms (DSPC, 1,2‐distearoyl‐sn‐
glycero‐3‐phosphocholine) were equally stable as the microbubbles having lipids with chain
lengths of 22 C‐atoms. For even longer chains (24 C‐atoms) the acoustical stability decreased
74
DSPC vs DPPC: Non‐linear response and viscoelastic properties
again [50]. Next to dissolution or stability, other properties of microbubbles with different
lipid‐coatings have been studied. Helfield et al. [259] varied the shell microstructure using
different cooling rates and found a change in subharmonic response, but without a clear
relation to the shell microstructure. Shell viscosity was found to depend on the coating
composition and manufacturing method, and the viscosity was lower when higher concen‐
trations of emulsifier were used [315]. Wang and Yeh [316] explained this by the increased
movements of lipids due to the emulsifier. The bulk linear properties of monodisperse bub‐
bles produced using flow‐focusing microfluidic devices were reported to depend on both
the radius and the acoustic pressure [286, 317]. However, none of these studies investigated
the properties of one specific lipid on the acoustic response of the microbubbles. Under‐
standing the influence of this replacement on microbubbles’ acoustical stability and their
response to ultrasound may aid the design of circulating microbubbles for CEUS and of
targeted microbubbles for local drug delivery and ultrasound molecular imaging applica‐
tions.
Super‐resolution microscopy was used before to study the distribution of lipids in the
coating of two types of microbubbles, after changing only the main shell component [70].
In that particular study was chosen to use DPPC (1,2‐dipalmitoyl‐sn‐glycero‐3‐
phosphocholine, C16:0), which is the main coating component for Definity [9], or DSPC (1,2‐
distearoyl‐sn‐glycero‐3‐phosphocholine, C18:0), which is the main constituent of the coating
of SonoVue [7] and the experimental agent BR14 [318, 319]. The microbubbles with DSPC as
the main lipid had a heterogeneous lipid distribution throughout the shell, whereas the
DPPC microbubbles had a more homogeneous lipid distribution. Similar results were also
reported for mixtures of two out of three of the components [46, 47, 49, 280] that were
used for the microbubble coating in the study by Kooiman et al. [70].
In the present study we used the Brandaris 128 ultra‐high‐speed camera [52] to compare
the responses to ultrasound of microbubbles with either DSPC or DPPC as the main coating
lipid. More specifically, we focused on their acoustical stability, their nonlinear responses at
the subharmonic and second harmonic frequencies, and their shell elasticity and viscosity.
5.3. MATERIALS AND METHODS
Microbubble preparation
Biotinylated lipid‐coated microbubbles with a C4F10 gas core (F2 Chemicals Ltd, Preston, UK)
were made by sonication for 10 seconds as described previously [70, 129]. The lipid‐coating
was composed of 59.4 mol% 1,2‐distearoyl‐sn‐glycero‐3‐phosphocholine (DSPC) (P6517; Sig‐
ma‐Aldrich, Zwijndrecht, the Netherlands) or 1,2‐dipalmitoyl‐sn‐glycero‐3‐phosphocholine
(DPPC) (850355; Avanti Polar Lipids, Alabaster, AL, USA); 35.7 mol% polyoxyethylene‐40‐
stearate (PEG‐40 stearate) (P3440; Sigma‐Aldrich); 4.1 mol% 1,2‐distearoyl‐sn‐glycero‐3‐
phosphoethanolamine‐N‐[carboxy(polyethylene glycol)‐2000 (DSPE‐PEG(2000)) (880125;
75
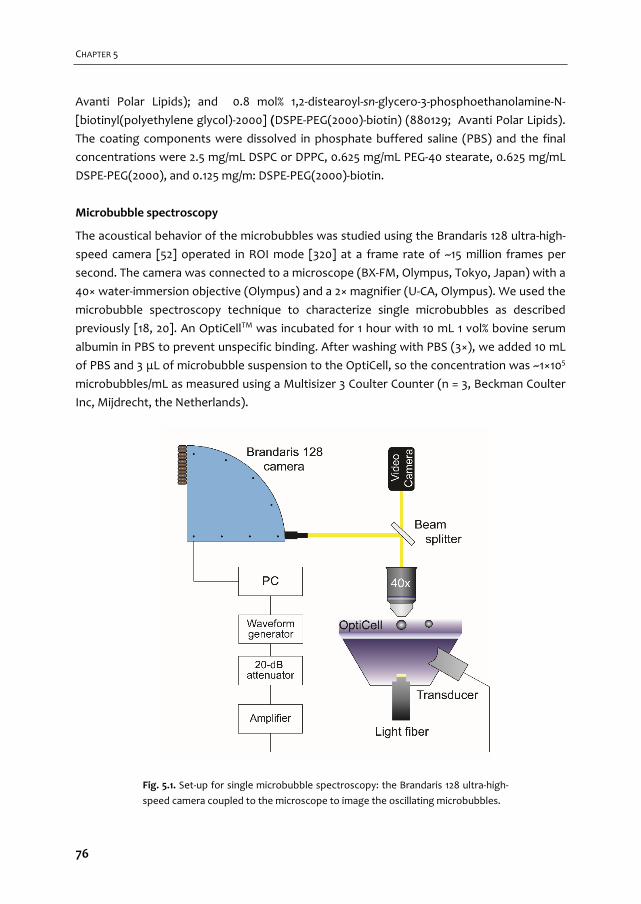
CHAPTER 5
Avanti Polar Lipids); and 0.8 mol% 1,2‐distearoyl‐sn‐glycero‐3‐phosphoethanolamine‐N‐
[biotinyl(polyethylene glycol)‐2000] (DSPE‐PEG(2000)‐biotin) (880129; Avanti Polar Lipids).
The coating components were dissolved in phosphate buffered saline (PBS) and the final
concentrations were 2.5 mg/mL DSPC or DPPC, 0.625 mg/mL PEG‐40 stearate, 0.625 mg/mL
DSPE‐PEG(2000), and 0.125 mg/m: DSPE‐PEG(2000)‐biotin.
Microbubble spectroscopy
The acoustical behavior of the microbubbles was studied using the Brandaris 128 ultra‐high‐
speed camera [52] operated in ROI mode [320] at a frame rate of ~15 million frames per
second. The camera was connected to a microscope (BX‐FM, Olympus, Tokyo, Japan) with a
40× water‐immersion objective (Olympus) and a 2× magnifier (U‐CA, Olympus). We used the
microbubble spectroscopy technique to characterize single microbubbles as described
previously [18, 20]. An OptiCellTM was incubated for 1 hour with 10 mL 1 vol% bovine serum
albumin in PBS to prevent unspecific binding. After washing with PBS (3×), we added 10 mL
of PBS and 3 μL of microbubble suspension to the OptiCell, so the concentration was ~1×10⁵
microbubbles/mL as measured using a Multisizer 3 Coulter Counter (n = 3, Beckman Coulter
Inc, Mijdrecht, the Netherlands).
Fig. 5.1. Set‐up for single microbubble spectroscopy: the Brandaris 128 ultra‐high‐
speed camera coupled to the microscope to image the oscillating microbubbles.
76
DSPC vs DPPC: Non‐linear response and viscoelastic properties
The ultrasound signal was a 10‐cycle Gaussian tapered sine wave burst generated by a
Tabor 8026 arbitrary waveform generator (AWG, Tabor Electronics Ltd, Tel Hanan, Israel).
This signal was then attenuated by a 20‐dB attenuator (Mini‐Circuits, Brooklyn, NY, USA),
amplified by a broadband amplifier (ENI A‐500, Electronics & Innovation Ltd., Rochester, NY,
USA), and coupled to a broadband single element transducer (25 mm focal distance, center
frequency 5 MHz, bandwidth 1‐9 MHz, PA275, Precision Acoustics Ltd, Dorchester, UK) for
the transmission of ultrasound (Fig. 5.1). Transmit frequencies were swept from 1 to 4 MHz
(in steps of 200 kHz) at a peak‐negative (PA) driving pressure of 10, 20, 50, or 100 kPa. The
pressures were calibrated with two calibrated PVDF needle hydrophones in a separate
measurement beforehand (0.2 mm diameter PA2030 and 1 mm diameter PA1875, Precision
Acoustics).
First, 16 movies of 128 frames were recorded at PA = 20 kPa followed by 16 recordings at
PA = 10 kPa of the same microbubble to determine its shell properties. Another series of 16
recordings at PA = 50 kPa with 16 subsequent recordings at PA = 100 kPa of the same mi‐
crobubble was used to study its nonlinear behavior. The ultrasound was triggered on the
second recording of each microbubble to obtain the initial resting diameter and the noise
level due to the uncertainty of the contour tracking algorithm in the first recording. All
measurements were performed at room temperature.
Data analysis
Diameter‐time (D‐t) curves from all recordings were obtained using custom‐designed image
analysis software [20]. The D‐t curves of a single experiment were used to determine the
acoustical stability of the microbubble, measured by its shrinkage due to the ultrasound
exposure: the difference between the mean diameter of the first and last recording divided
by the mean diameter of the first recording.
The D‐t curves were transformed to the frequency domain using a Fast Fourier Trans‐
formation (FFT), as analysis in this domain provides specific information on the frequency
content of the recorded signal. The maximum oscillation amplitude in a frequency band of
300 kHz centered around the transmit frequency (fT) was determined and fitted to the line‐
ar resonance curve by a least‐mean‐square method [20]:
02 22 2
0 01 / /tot
ReRe f
f f f f (5.1)
with Re the integral of the power spectrum in the specified frequency band and Re0 a scaling
factor. Following Eq. (2) in van der Meer et al. [20] yields Re0 = (F0/2πω0)2, with F0 = |PA|/ρR02
[45]. The total damping coefficient δtot, the eigenfrequency f0, and the resonance frequency
77
CHAPTER 5
1 2⁄ , were obtained from Eq. (5.1). The amplitude at the resonance fre‐
quency was divided by the diameter to obtain the maximum relative radial excursion.
The asymmetric and nonlinear behavior can be derived from the relative radial excursion
of the microbubble following de Jong et al. [321]. The relative expansion E and the relative
compression C of the microbubble were measured from the D‐t curves and the ratio E/C was
used to classify asymmetric behavior: compression‐only behavior (E/C < 0.5); normal excur‐
sion (0.5 ≤ E/C ≤ 2); or expansion‐only behavior (E/C > 2). Transforming the D‐t curves to the
frequency domain enables detailed analyses of subharmonic and second harmonic frequen‐
cy responses. Similar to the analysis of the fundamental response, FFTs were calculated and
the maximum amplitudes were determined in a 300 kHz frequency band centered around
½fT for the subharmonic frequency or 2fT for the second harmonic frequency. If at least two
consecutive D‐t curves of a microbubble showed a response at the subharmonic or second
harmonic frequency (at a level at least 6 dB above the maximum noise level), these mi‐
crobubbles were classified as responsive at the subharmonic or second harmonic frequency,
respectively. The amplitudes at these frequencies were then fitted to the resonance curve,
Eq. (5.1), to obtain the subharmonic resonance frequency (fsub) and the second harmonic
resonance frequency (fsec), respectively. The frequency spectrum of the first recording
without ultrasound exposure was taken as the noise level.
The theoretical acoustic pressures scattered by the nonlinear microbubble oscillations
were calculated using [312]:
2 20
S
RP
d (5.2)
where PS is the scattered pressure at a distance d from the microbubble, ρ = 1∙103 kg/m3 is
the density of the surrounding fluid (water), ω0 = 2πf0 the angular resonance frequency as
determined from the linearized harmonic resonance curve, R the corresponding radius, and
ε is the radial excursion amplitude at the resonance frequency.
The shell elasticity parameter χ was estimated by fitting the experimentally determined
eigenfrequency and the corresponding microbubble diameter to the shell‐buckling model
introduced by Marmottant et al. [19], as demonstrated in van der Meer et al. [20]:
0 02
2 3 11 1 43
2wf P
R R R (5.3)
The values used were the polytropic gas exponent γ = 1.07 for C4F10 defined as the ratio of
specific heats [6], the ambient pressure P0 = 1∙105 Pa, the surface tension σw = 0.072 N/m, and
the elasticity parameter χ [20, 180], while the other parameters were defined as above.
78
DSPC vs DPPC: Non‐linear response and viscoelastic properties
Microbubbles oscillating in an ultrasound field experience different forms of damping
which can be described as:
tot rad vis shell th (5.4)
The total damping δtot contains a contribution of the sound re‐radiated by the microbubble
δrad, a viscous contribution δvis, a shell viscosity contribution δshell, and a thermal contribution
δth. According to Leighton [44] and Medwin [322] δth ≈ δvis for microbubbles in the size range
for medical use. This assumption was incorporated in Eq. (5.4) by multiplying δvis by two,
resulting in Eq. (5.5):
0
2 30 0
442 s
tot
R
c R R (5.5)
The parameters used in Eq. (5.5) are δtot obtained from Eq. (5.1), the angular eigenfrequency
ω0 = 2πf0, the radius R, the speed of sound in water c = 1.5∙103 m/s, the viscosity of water
μ = 1∙10‐3 Pa∙s, the density of water ρ = 1∙103 kg/m3, and the shell viscosity κs. The re‐radiation
damping and viscous damping are microbubble properties—not of the lipids—and there‐
fore do not contribute to the properties of the shell. From the shell damping term the shell
viscosity κs was calculated similarly to the calculation in van der Meer et al. [20].
The validity of the shell properties was verified using the parameters we derived from
the experiments at a 20 kPa driving pressure to simulate the D‐t curves at a 50 kPa driving
pressure using the Marmottant model [19]. The parameters obtained experimentally can
then be used in the full nonlinear equations, incorporating different regimes of the surface
tension.
All calculations were performed in MATLAB (The MathWorks Inc., Natick, MA, USA).
Statistical analyses
The acquired data were not normally distributed as derived from Shapiro‐Wilk tests, so we
used nonparametric tests. The acoustical stability of each single microbubble expressed as
the difference between the initial diameter and the final diameter was compared using
Wilcoxon signed‐rank tests. For comparing acoustical stability, resonance frequencies, shell
elasticity, and shell viscosity between the two microbubble types we used Mann‐Whitney U
tests. We report the median and interquartile range (IQR) instead of the mean and standard
deviation; the median takes the skewness of the distribution into account and is less influ‐
enced by extreme values or outliers. Medians and IQR were calculated using Tukey´s Hinges
method. All statistical analyses were performed using SPSS (Statistics 20, IBM Corp., Ar‐
monk, NY, USA) and a p‐value < 0.05 was regarded as significant, unless stated otherwise.
79
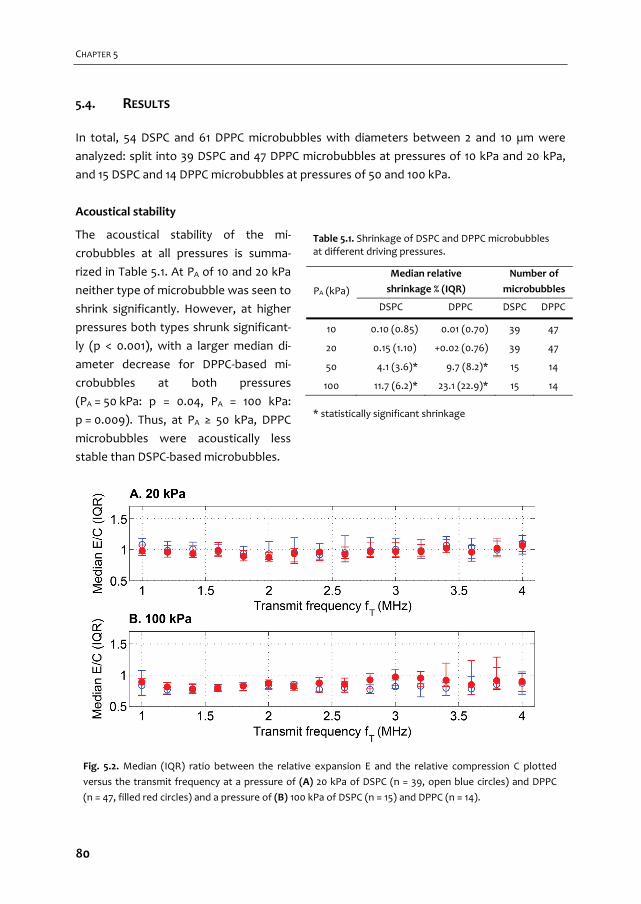
CHAPTER 5
5.4. RESULTS
In total, 54 DSPC and 61 DPPC microbubbles with diameters between 2 and 10 µm were
analyzed: split into 39 DSPC and 47 DPPC microbubbles at pressures of 10 kPa and 20 kPa,
and 15 DSPC and 14 DPPC microbubbles at pressures of 50 and 100 kPa.
Acoustical stability
The acoustical stability of the mi‐
crobubbles at all pressures is summa‐
rized in Table 5.1. At PA of 10 and 20 kPa
neither type of microbubble was seen to
shrink significantly. However, at higher
pressures both types shrunk significant‐
ly (p < 0.001), with a larger median di‐
ameter decrease for DPPC‐based mi‐
crobubbles at both pressures
(PA = 50 kPa: p = 0.04, PA = 100 kPa:
p = 0.009). Thus, at PA ≥ 50 kPa, DPPC
microbubbles were acoustically less
stable than DSPC‐based microbubbles.
PA (kPa)
Median relative
shrinkage % (IQR)
Number of
microbubbles
DSPC DPPC DSPC DPPC
10 0.10 (0.85) 0.01 (0.70) 39 47
20 0.15 (1.10) +0.02 (0.76) 39 47
50 4.1 (3.6)* 9.7 (8.2)* 15 14
100 11.7 (6.2)* 23.1 (22.9)* 15 14
Fig. 5.2. Median (IQR) ratio between the relative expansion E and the relative compression C plotted
versus the transmit frequency at a pressure of (A) 20 kPa of DSPC (n = 39, open blue circles) and DPPC
(n = 47, filled red circles) and a pressure of (B) 100 kPa of DSPC (n = 15) and DPPC (n = 14).
Table 5.1. Shrinkage of DSPC and DPPC microbubbles at different driving pressures.
* statistically significant shrinkage
80

DSPC vs DPPC: Non‐linear response and viscoelastic properties
Oscillation behavior
The asymmetry of radial excursion of the microbubbles was evaluated by means of the ratio
between the relative expansion E and relative compression C (E/C). As shown in Fig. 5.2, at
pressures of 10 and 20 kPa E/C ratios of both microbubble types were near 1: oscillations at
these pressures were considered to be symmetric and linear. At driving pressures of 50 and
100 kPa, oscillations of both types showed more compression than expansion, particularly
at a frequency fT < 2.5 MHz, see Fig. 5.2. Based on the definition of de Jong et al. [321] this
behavior is not classified as compression‐only behavior. We therefore termed the excursion
behavior observed at 50 and 100 kPa ‘compression‐dominated’, which was regarded as
asymmetric and nonlinear.
The resonance curve was fitted to the measured amplitudes at fT from 1 to 4 MHz, as
shown in Fig. 5.3 for a DSPC and DPPC microbubble of similar size. From the resonance
curves the resonance frequency (fres) and eigenfrequency (f0) were determined. Microbub‐
bles with their resonance peak below the measurement range (fT ≤ 1 MHz, i.e. D0 > ~6.5 µm)
were excluded from this analysis: their resonance frequency could not be determined and
these microbubbles were therefore also not taken into account for the calculation of the
shell properties. The resonance frequencies appeared to be slightly lower for
Fig. 5.3. The resonance curves of similar sized DSPC (open blue circles) and DPPC microbubbles (filled
red circles) at a pressure of 20 kPa. The DSPC‐based microbubble had a diameter of 3.4 μm and a reso‐
nance frequency of 3.4 MHz, the DPPC‐based microbubble had a diameter of 3.3 μm and a resonance
frequency of 2.2 MHz. Δf is the full width at half the maximum amplitude, fres the resonance frequency
and f0 the eigenfrequency.
81
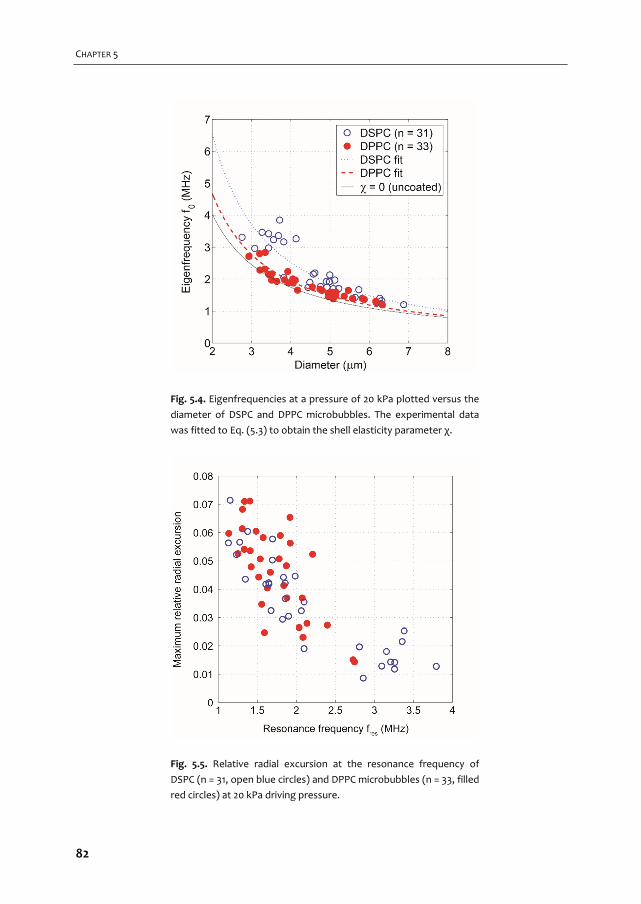
CHAPTER 5
Fig. 5.4. Eigenfrequencies at a pressure of 20 kPa plotted versus the
diameter of DSPC and DPPC microbubbles. The experimental data
was fitted to Eq. (5.3) to obtain the shell elasticity parameter χ.
Fig. 5.5. Relative radial excursion at the resonance frequency of
DSPC (n = 31, open blue circles) and DPPC microbubbles (n = 33, filled
red circles) at 20 kPa driving pressure.
82
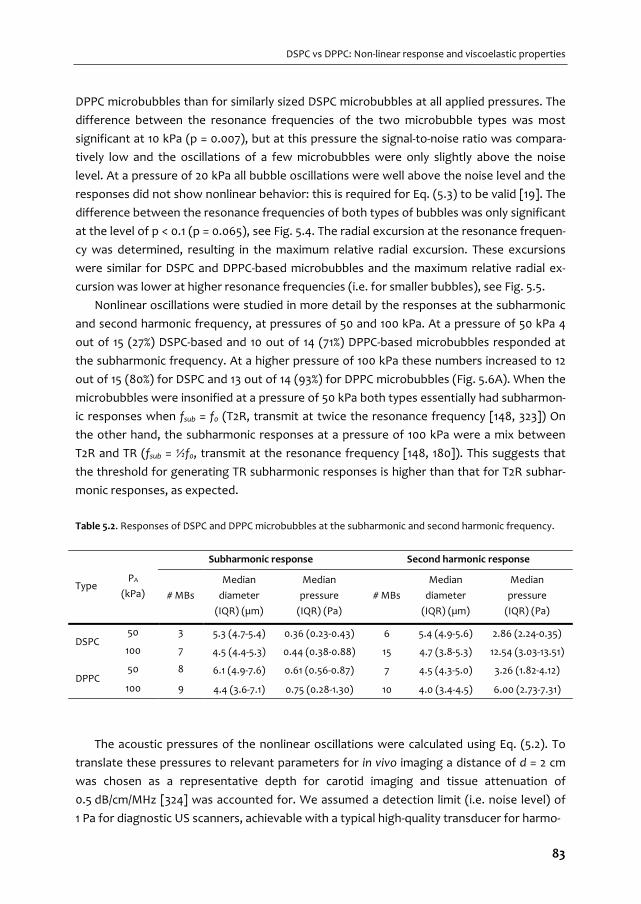
DSPC vs DPPC: Non‐linear response and viscoelastic properties
DPPC microbubbles than for similarly sized DSPC microbubbles at all applied pressures. The
difference between the resonance frequencies of the two microbubble types was most
significant at 10 kPa (p = 0.007), but at this pressure the signal‐to‐noise ratio was compara‐
tively low and the oscillations of a few microbubbles were only slightly above the noise
level. At a pressure of 20 kPa all bubble oscillations were well above the noise level and the
responses did not show nonlinear behavior: this is required for Eq. (5.3) to be valid [19]. The
difference between the resonance frequencies of both types of bubbles was only significant
at the level of p < 0.1 (p = 0.065), see Fig. 5.4. The radial excursion at the resonance frequen‐
cy was determined, resulting in the maximum relative radial excursion. These excursions
were similar for DSPC and DPPC‐based microbubbles and the maximum relative radial ex‐
cursion was lower at higher resonance frequencies (i.e. for smaller bubbles), see Fig. 5.5.
Nonlinear oscillations were studied in more detail by the responses at the subharmonic
and second harmonic frequency, at pressures of 50 and 100 kPa. At a pressure of 50 kPa 4
out of 15 (27%) DSPC‐based and 10 out of 14 (71%) DPPC‐based microbubbles responded at
the subharmonic frequency. At a higher pressure of 100 kPa these numbers increased to 12
out of 15 (80%) for DSPC and 13 out of 14 (93%) for DPPC microbubbles (Fig. 5.6A). When the
microbubbles were insonified at a pressure of 50 kPa both types essentially had subharmon‐
ic responses when fsub = f0 (T2R, transmit at twice the resonance frequency [148, 323]) On
the other hand, the subharmonic responses at a pressure of 100 kPa were a mix between
T2R and TR (fsub = ½f0, transmit at the resonance frequency [148, 180]). This suggests that
the threshold for generating TR subharmonic responses is higher than that for T2R subhar‐
monic responses, as expected.
Table 5.2. Responses of DSPC and DPPC microbubbles at the subharmonic and second harmonic frequency.
Type PA
(kPa)
Subharmonic response Second harmonic response
# MBs
Median
diameter
(IQR) (µm)
Median
pressure
(IQR) (Pa)
# MBs
Median
diameter
(IQR) (µm)
Median
pressure
(IQR) (Pa)
DSPC 50 3 5.3 (4.7‐5.4) 0.36 (0.23‐0.43) 6 5.4 (4.9‐5.6) 2.86 (2.24‐0.35)
100 7 4.5 (4.4‐5.3) 0.44 (0.38‐0.88) 15 4.7 (3.8‐5.3) 12.54 (3.03‐13.51)
DPPC 50 8 6.1 (4.9‐7.6) 0.61 (0.56‐0.87) 7 4.5 (4.3‐5.0) 3.26 (1.82‐4.12)
100 9 4.4 (3.6‐7.1) 0.75 (0.28‐1.30) 10 4.0 (3.4‐4.5) 6.00 (2.73‐7.31)
The acoustic pressures of the nonlinear oscillations were calculated using Eq. (5.2). To
translate these pressures to relevant parameters for in vivo imaging a distance of d = 2 cm
was chosen as a representative depth for carotid imaging and tissue attenuation of
0.5 dB/cm/MHz [324] was accounted for. We assumed a detection limit (i.e. noise level) of
1 Pa for diagnostic US scanners, achievable with a typical high‐quality transducer for harmo‐
83
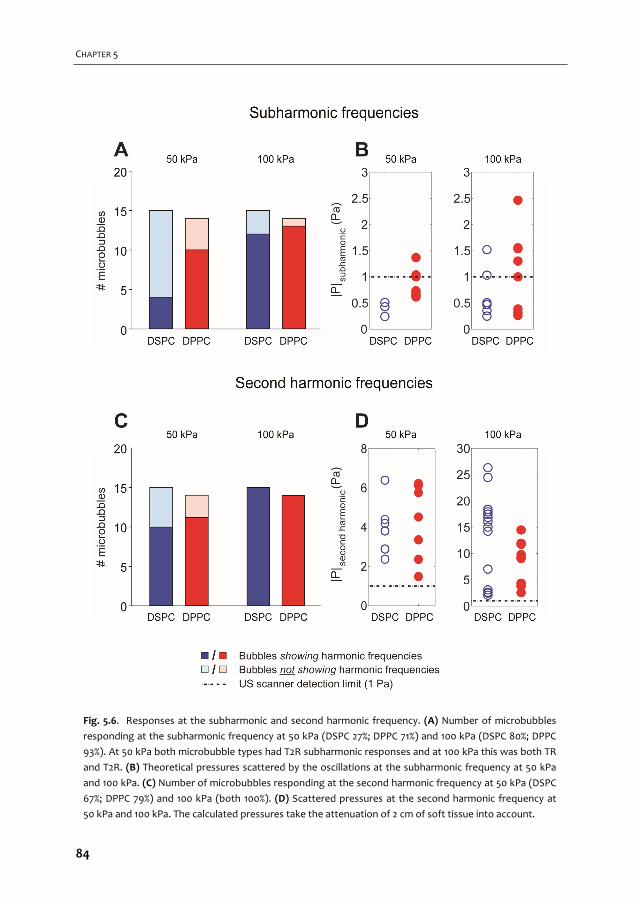
CHAPTER 5
Fig. 5.6. Responses at the subharmonic and second harmonic frequency. (A) Number of microbubbles
responding at the subharmonic frequency at 50 kPa (DSPC 27%; DPPC 71%) and 100 kPa (DSPC 80%; DPPC
93%). At 50 kPa both microbubble types had T2R subharmonic responses and at 100 kPa this was both TR
and T2R. (B) Theoretical pressures scattered by the oscillations at the subharmonic frequency at 50 kPa
and 100 kPa. (C) Number of microbubbles responding at the second harmonic frequency at 50 kPa (DSPC
67%; DPPC 79%) and 100 kPa (both 100%). (D) Scattered pressures at the second harmonic frequency at
50 kPa and 100 kPa. The calculated pressures take the attenuation of 2 cm of soft tissue into account.
84
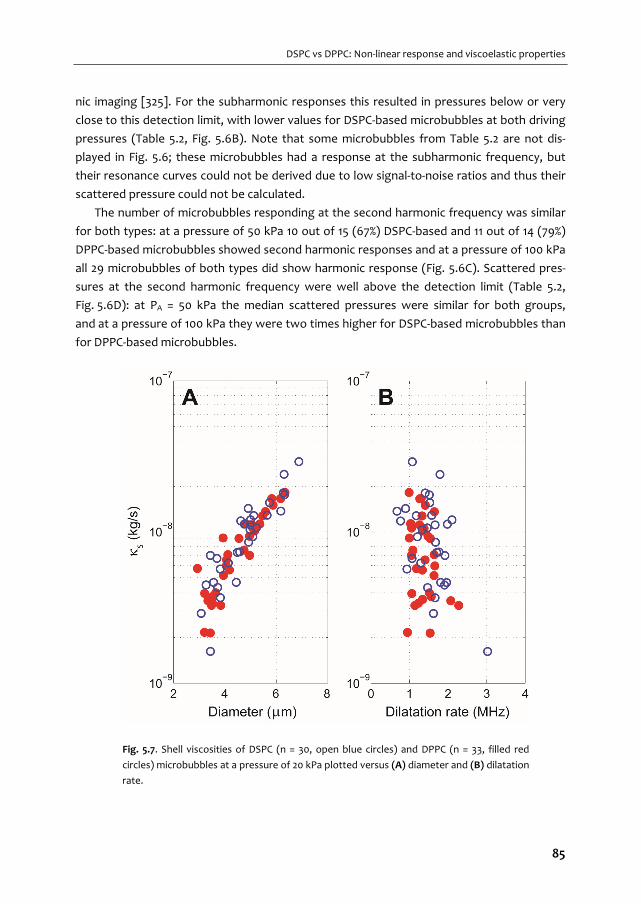
DSPC vs DPPC: Non‐linear response and viscoelastic properties
nic imaging [325]. For the subharmonic responses this resulted in pressures below or very
close to this detection limit, with lower values for DSPC‐based microbubbles at both driving
pressures (Table 5.2, Fig. 5.6B). Note that some microbubbles from Table 5.2 are not dis‐
played in Fig. 5.6; these microbubbles had a response at the subharmonic frequency, but
their resonance curves could not be derived due to low signal‐to‐noise ratios and thus their
scattered pressure could not be calculated.
The number of microbubbles responding at the second harmonic frequency was similar
for both types: at a pressure of 50 kPa 10 out of 15 (67%) DSPC‐based and 11 out of 14 (79%)
DPPC‐based microbubbles showed second harmonic responses and at a pressure of 100 kPa
all 29 microbubbles of both types did show harmonic response (Fig. 5.6C). Scattered pres‐
sures at the second harmonic frequency were well above the detection limit (Table 5.2,
Fig. 5.6D): at PA = 50 kPa the median scattered pressures were similar for both groups,
and at a pressure of 100 kPa they were two times higher for DSPC‐based microbubbles than
for DPPC‐based microbubbles.
Fig. 5.7. Shell viscosities of DSPC (n = 30, open blue circles) and DPPC (n = 33, filled red
circles) microbubbles at a pressure of 20 kPa plotted versus (A) diameter and (B) dilatation
rate.
85
CHAPTER 5
The theoretical scattered subharmonic and second harmonic pressures depend on the
microbubble sizes: the scattered pressure scales quadratically with its diameter. Although
the differences between the subharmonic pressure responses at a pressure of 50 kPa were
small, the larger median diameter of the DPPC microbubbles may have resulted in an over‐
estimation of the pressures. However, not enough DSPC microbubbles responded at this
pressure to test whether the diameters of both microbubble types were significantly differ‐
ent. The number of DSPC microbubbles responding at the second harmonic frequency at a
pressure of 50 kPa was also too low to test whether the diameters of both microbubble
types were significantly different. At a pressure of 100 kPa the diameters of the microbub‐
bles responding at the second harmonic frequency were not significantly different
(p = 0.346).
Shell properties
To determine the shell properties using Eq. (5.3), nonlinear behavior must be kept to a min‐
imum. Therefore the measurements performed at a pressure of 20 kPa (Fig. 5.4) were fitted
to Eq. (5.3). This resulted in shell elasticity parameters of χDSPC = 0.26 ± 0.13 N/m and
χDPPC = 0.06 ± 0.06 N/m. The elasticity parameter estimated for DPPC was an order of magni‐
tude lower than that for DSPC (p < 0.001), and approaches that of an uncoated bubble
(χ = 0); the consequence of the higher elasticity for DSPC is a stiffer lipid shell.
The shell damping term was calculated using Eq. (5.5), with the total damping
δtot = Δf / f0 [20] from the experimental resonance curves (Fig. 5.3) at a driving pressure of
20 kPa. Median (IQR) shell damping coefficients of both microbubble types were similar;
0.22 (0.10) for DSPC and 0.25 (0.07) for DPPC. From the individual shell damping coefficients
we derived the shell dilatational viscosities using Eq. (5.5). The median (IQR) shell viscosities
were similar for both types: κDSPC = 1.0 (0.7) × 10‐8 kg/s and κDPPC = 0.7 (0.7) × 10‐8 kg/s (p =
0.148). The shell viscosity increased with increasing diameter for both microbubble types
(Fig. 5.7), but no significant relation was found between shell viscosity and dilatation rate,
as estimated from Eq. (5.6), given the very small variation of the dilatation rate in our exper‐
iments.
0 0 0 max min 0/ / 2 ( ) /D D D D f D D D (5.6)
The shell properties derived from the measurements at a pressure of 20 kPa were used
to simulate the response of the microbubble at a pressure of 50 kPa that responded at both
the subharmonic frequency and the second harmonic frequency. We assumed an initial
surface tension (σ(R0)) of 0.5σw, which is exactly in the middle of the elastic regime. Fig. 5.8a
shows good agreement between the experimentally obtained bubble oscillations (dots) of
a 5.5 μm DSPC microbubble close to resonance, and the simulated response using
fT = 1.35 MHz, χ = 0.26 N/m, and κs = 1.88 × 10‐8 kg/s (dashed line). In the compression phase,
however, the simulated response is slightly underestimated. Fig. 5.8b shows a similar level
86

DSPC vs DPPC: Non‐linear response and viscoelastic properties
of agreement of a 5.1 µm DPPC microbubble at resonance and the corresponding simulation
using fT = 1.53 MHz, χ = 0.06 N/m, and κs = 1.32 × 10‐8 kg/s.
5.5. DISCUSSION
We compared the responses to ultrasound of two types of microbubbles with either DSPC
or DPPC lipid as the main coating component. We found higher stability, higher responses at
the second harmonic frequency, and a higher shell elasticity for DSPC than for DPPC‐based
microbubbles. On the other hand, less DSPC microbubbles responded at the subharmonic
frequency and the magnitude of their response was slightly lower than those of the DPPC‐
based microbubbles. The shell viscosities were similar for both types of bubbles.
Stability
The lower acoustical stability of DPPC‐based microbubbles can be explained by the shorter
acyl chain length of DPPC, which lowers the attractive intermolecular van der Waals forces
between the lipids in the shell, and thus decreases the overall cohesiveness of the monolay‐
er [49].
Fig. 5.8. Agreement between experimental results (dots) and simulated responses (dashed line) at 50
kPa driving pressure of (A) a DSPC microbubble (diameter = 5.5 μm, fT = 1.35 MHz, χ = 0.26 N/m and
κs = 1.88 ∙ 10‐8 kg/s) (B) and a DPPC microbubble (diameter = 5.1 μm, fT = 1.53 MHz, χ = 0.06 N/m and
κs = 1.32 ∙ 10‐8 kg/s).
87
CHAPTER 5
The miscibility of lipids in the coating is influenced by the phase‐behavior of the lipids in
the coating and might therefore also play a role in the acoustical stability differences we
measured. At room temperature DSPC lipid is in the condensed phase [280], PEG‐40 stea‐
rate is in the expanded phase [48], and DSPE‐PEG(2000) can be in either of these phases
[280]. As also discussed by Kooiman et al. [70] DSPC is immiscible with the components in
the expanded phase; ordered and condensed DSPC domains are formed [281]. These do‐
mains are more tightly packed and may prevent gas escape and thus increase the acoustical
stability. DPPC lipid on the other hand (at room temperature), may be in the phase transi‐
tion area between the condensed phase [280], and the less ordered and less densely
packed expanded phase [281]. This can decrease the acoustical stability of DPPC microbub‐
bles.
Small changes in the size (< 10%) before and after insonification at PA of 10 and 20 kPa
were measured for both microbubble types. Based on the estimates by van der Meer et al.
[20] that suggest that the contour tracking algorithm has an error of 10%, we can conclude
that both microbubble types are stable at these low pressures. When the microbubbles
were insonified at higher pressures of 50 and 100 kPa the size‐changes were larger than 10%
and microbubbles of both types were acoustically unstable.
As pointed out in the Introduction, lipids with chains up to 24 C‐atoms have also been
used to produce microbubbles [50]. In the absence of ultrasound the formulation of mi‐
crobubbles containing DBPC (C22‐lipid) was found to have lower dissolution rates than
those based on DSPC and DPPC. However, in the presence of ultrasound the in vitro acous‐
tical stability of DSPC and DBPC‐based microbubbles was similar, and both were more stable
than DPPC. The in vivo contrast persistence of DBPC‐based microbubbles was found to be
~20× higher than that of DPPC‐based microbubbles and ~5× higher than that of DSPC‐based
microbubbles. Based on these results future studies should focus on investigating lipids
with longer carbon chains such as DBPC and focus on nonlinear behavior rather than acous‐
tical stability or in vivo half‐life.
Oscillation behavior
The resonance frequencies of the DSPC microbubbles were higher than those of the DPPC
microbubbles. This may be due to the lower compressibility modulus of DPPC lipid than that
of DSPC lipid [278, 279], which results in a higher deformability of the DPPC‐based bubbles
as shown by [70]. The compressibility modulus (Cs‐1) that is used in surface rheology is iden‐
tical to the elastic compressibility modulus (χ) that is used in the Marmottant model [19].
Since a lower elasticity is related to lower resonance frequencies (Fig. 5.4), the lower com‐
pressibility modulus of DPPC lipid is thus the likely cause for the measured down‐shift in
resonance frequency.
For the sake of comparison with other DSPC‐based microbubbles we consider a typical
4 μm SonoVue (fres = 2.9 MHz) [127] and a 4 μm BR14 (fres = 3.2 MHz) [20] microbubble: their
88
DSPC vs DPPC: Non‐linear response and viscoelastic properties
resonance frequencies were slightly higher than those of our DSPC microbubbles
(fres = 2.7 MHz). Our single DPPC microbubbles, on the other hand, had much lower reso‐
nance frequencies than Definity: the resonance frequencies of bulk measurements were in
the range of 10 to 18 MHz [126, 276, 326]. Since Definity microbubbles are smaller than our
DPPC microbubbles (Definity: 1.1 – 3.3 μm [9], DPPC: 3.9 μm), their resonance frequency is
higher. Extrapolating the fit through the eigenfrequencies in Fig. 5.4 predicted a frequency
of 12 MHz for DPPC microbubbles of 1 μm, which indeed is of the same order of magnitude
as found for Definity. The single microbubble measurements of the DPPC‐based microbub‐
bles by Luan et al. [18] are easier to compare with our microbubbles: the higher frequencies
they found (fres = 2.7 MHz versus fres = 2.0 MHz) are likely due to the difference in coating
composition (65 mol% DPPC, 35 mol% DSPE‐PEG(2000)) and the preparation method (dis‐
solved in chloroform and high‐speed shaking using the Vialmix).
The maximum relative radial excursion at the resonance frequency decreased with in‐
creasing frequency and thus with decreasing size. At resonance, Eq. (5.1) reduces to
Re = Re0 / δtot 2, and as described in the Materials and Methods section Re0 = (PA / 2πω0ρR02)2
and Re = |x|2, hence, the amplitude x scales with 1/δtot. Since δtot decreases with increasing
microbubble diameter [44, 146] and thus with decreasing resonance frequency, the lower
amplitude at higher resonance frequencies, as shown in Fig. 5.5, is explained by the higher
damping coefficient. Indeed, van der Meer et al. [20] reported resonance curves of bubbles
with lower amplitudes (Re/Re0) for increasing resonance frequencies, which is in line with
our observations and the increased damping.
For successful in vivo CEUS and molecular imaging, discriminating the microbubble sig‐
nal from tissue signal is a key factor [158]. This discrimination can be accomplished by non‐
linear contrast imaging, for example by detecting the responses of the microbubbles at the
subharmonic or second harmonic frequencies. The second harmonic response is higher in
frequency than the subharmonic response and the second harmonic response is therefore
attenuated to a higher degree [324]. In addition, tissue signals can also contain second har‐
monic frequencies due to nonlinear propagation [327, 328], which makes discrimination
based on second harmonics less specific. Thus the subharmonic response is of great interest
for microbubble imaging [181]. For the generation of oscillations at the subharmonic fre‐
quency a rapid change in elasticity is required, which is highest near its buckled state [180,
323]. From theory, similar correspondence was found between the occurrence of compres‐
sion‐only behavior and [329, 330]. Faez et al. [180] confirmed that compression‐only behav‐
ior generates responses at the subharmonic frequency. But although compression‐only
behavior, buckling, and a response at the subharmonic frequency are related, we did not
observe a direct correspondence between the compression‐dominated behavior (E/C ratio)
and the response at the subharmonic frequency. In addition, microbubbles with an initial
surface tension close to that of the buckled regime have a higher subharmonic response
than those with a surface tension in the elastic regime [323]. Since the DPPC‐based mi‐
89
CHAPTER 5
crobubbles shrank more due to gas diffusion, this might yield a higher local concentration of
lipids in the shell. This over‐concentration of lipids can induce buckling, which may have
generated the response at the subharmonic frequency we observed in this study.
Helfield et al. [259] previously investigated the subharmonic response of individual
DSPC‐based microbubbles (DSPC:PEG‐40 stearate (9:1)) with different microstructures due
to variable cooling rates during the preparation process. They reported a variability in the
subharmonic response based on the number and size of lipid islands, but no clear depend‐
ence between the shell microstructure and subharmonic response could be deduced
(PA = 0.02‐1.2 MPa at 25 MHz). Their most homogeneous composition resulted in the highest
rate of subharmonic responses. This may suggest that the few DSPC‐based bubbles in our
investigated population that were responsive at the subharmonic frequency at a driving
pressure of 50 kPa (Fig. 5.6A) were actually the most homogeneous DSPC‐based bubbles.
The heterogeneity of individual DSPC‐based microbubbles indeed varies, as shown previous‐
ly by Kooiman et al. [70]. Whereas Helfield et al. [259] found only a minor effect of the
subharmonic threshold based on heterogeneity within their DSPC microbubbles, we saw a
clear difference at 50 kPa between DPPC and DSPC microbubbles, but a similar level of re‐
sponse at 100 kPa. This suggests that the threshold for the generation of subharmonics is
lower in our DPPC‐based microbubbles than in our DSPC‐based microbubbles.
While differences in the radial excursion between DSPC and DPPC microbubbles could
introduce a bias in the scattered pressures we calculated, the higher subharmonic pressures
of the DPPC microbubbles and the higher second harmonic pressures of the DSPC mi‐
crobubbles were not caused by a difference in maximum relative radial excursions, as
shown in Fig. 5.5. Since neither the diameter distributions, nor the relative radial excursions
were different, the calculated pressures were assumed to be valid.
Shell properties
The elasticity of our DPPC microbubbles was lower than that of our DSPC microbubbles, and
close to that of a free bubble: the influence of the shell on the elasticity is thus minimal for
the DPPC microbubbles. One explanation for the lower shell elasticity of the DPPC bubbles
is the shorter DPPC acyl chain: this results in a thinner shell, lower van der Waals forces
[135], and thus a less stiff shell. In addition to this, fluorescence microscopy [70] revealed a
larger binding area and domed shape of bound targeted DPPC microbubbles: this is con‐
sistent with a less stiff coating and in line with a lower elastic compressibility modulus of
DPPC lipid [278, 279]. One of the underlying reasons can be phase‐behavior of the different
components that influences their miscibility within the coating. As discussed before DPPC
may be in the phase transition area between the condensed phase and the less ordered and
less densely packed expanded phase. Therefore DPPC lipid may change from the condensed
phase to the expanded phase especially upon expansion of the microbubble, decreasing the
stiffness of the shell and lowering the elasticity. DSPC on the other hand is immiscible with
90

DSPC vs DPPC: Non‐linear response and viscoelastic properties
PEG‐40 stearate and DSPE‐PEG(2000) in the expanded phase, therefore ordered and less
compressible condensed DSPC domains are formed [281]. These domains increase locally
the stiffness and thus the elasticity of the lipid shell and may explain why we found a higher
elasticity for our DSPC microbubbles.
The elasticity parameters we found for both our DPPC (0.06 ± 0.06 N/m at PA = 20 kPa)
and DSPC‐based (0.26 ± 0.13 N/m at PA = 20 kPa) microbubbles appeared to be lower than
those reported in many other studies. However, the elasticity highly depends on the used
driving pressure and decreases with increasing pressure [317, 330]. When comparing the
elasticities of DPPC‐based microbubbles such as Definity (0.7‐0.9 N/m, PA between 6 and
31 kPa) [128, 326] and those used in the study by Luan et al. [18] (0.19 ± 0.07 N/m, PA =
50 kPa), the latter is already ~4× lower. Next to the dependence on the pressure, the elastic‐
ity is likely influenced by the differences in microbubble composition. Where we used a
three‐component composition, Luan et al. [18] used a two‐component composition, where‐
as Definity consists of only lipids (DPPA and DPPC) and a lipopolymer (DPPE‐MPEG(5000))
[9]. As shown in multiple studies, differences in composition alter the microbubble proper‐
ties [50, 70, 259, 285, 286, 315, 317]. The elasticity of DSPC‐based bubbles is generally higher
than that reported for DPPC‐based microbubbles. Values determined for SonoVue (0.55 N/m
at PA < 10 kPa; 0.22 N/m at PA = 150 kPa) [127, 331], BR14 (0.54 ± 0.10 N/m at PA < 40 kPa ) [20],
and DSPC:DSPE‐PEG(2000) microbubbles (0.50 N/m at PA = 25 kPa) [317] were similar and
~2× higher than we determined in our study for DSPC‐based microbubbles. The contrast
agents SonoVue and BR14 are both produced by Bracco and consist of lipids (DSPC, DPPG)
and an emulsifier (PEG(4000)) [7, 318, 319], whereas our bubbles also have a lipopolymer
incorporated in their shell (DSPE‐PEG(2000)). Since we already see a large difference in
elasticity when only the main lipid is replaced, the influence of two other components can
thus have an even larger effect. The microbubbles used by Gong et al. [317] consist of two
of the components that are incorporated in the coating of our DSPC‐based microbubbles,
but in different ratios (9:1) and without the presence of PEG‐40 stearate. As discussed be‐
fore, DSPC is immiscible with PEG‐40 stearate and the microstructure will be different from
that of our bubbles, thus influencing the acoustical response.
The estimated shell viscosities of the DSPC‐based microbubbles (1.0 (0.7) × 10‐8 kg/s) were
similar to those of SonoVue (0.5 × 10‐8 kg/s; 2.5 × 10‐9 kg/s) [127, 331] and BR14 microbubbles
(10‐8 kg/s) [20]. The viscosities of the DPPC‐based microbubbles were also similar (10‐8 – 10‐9
kg/s) to those of Definity [128, 326] and the DPPC microbubbles of Luan et al. [18]. Shear‐
thinning—a decrease in shell viscosity with increasing dilatation rate—could not be ob‐
served in our DSPC microbubbles, or in our DPPC microbubbles, due to the limited range of
dilatation rates applied.
The simulations using the Marmottant model [19] as shown in Fig. 5.8 have been per‐
formed assuming an initial surface tension half of that of the gas/liquid interface (σ(R0) =
0.5σw); this is in the middle of the elastic regime. Several other values for the initial surface
91
CHAPTER 5
tension have also been used to simulate the experimental response (0.01σw < σ(R0) < σw),
which influenced the relative compression and expansion. Using values for the surface ten‐
sion higher than 0.5σw resulted in a better fit in the expansion phase, but a less good fit in
the compression phase. As expected, for a surface tension lower than 0.5σw this was exactly
the other way around. However, none of the values for the surface tension were able to
capture the bubble oscillations properly in both the expansion and compression phase; the
peak‐to‐peak value did not significantly change. Next to varying the initial surface tension,
the shell elasticity was also varied. Although the elasticity we estimated from our experi‐
ments was lower than that reported in literature, modeling the response using higher val‐
ues for the elasticity, such as those reported for SonoVue and BR14 (0.5 N/m), did not result
in a better fit to the experimentally measured results.
Limitations of this study
For valid use of the Marmottant model we assumed that the microbubble remained spheri‐
cal when it oscillated [19]. However, Vos et al. [332] showed that microbubbles near a wall
can oscillate nonspherically, through jetting and the presence of surface modes [333]; a few
microbubbles indeed had surface modes at one or two transmit frequencies. Although
some surface modes were present, as shown in Fig. 5.8 the agreement between the model
and the experimental data is quite good.
The proximity of a wall also influences the acoustical responses of the microbubbles
[124, 136, 334]. The consensus of these papers is a decrease in radial excursions when the
microbubbles are brought closer to a wall. The main focus in our present paper is the com‐
parison of DPPC‐based microbubbles with DSPC‐based microbubbles and the boundary
proximity was similar for both types of bubbles, but should be kept in mind when compar‐
ing our results to those of others.
DPPC vs DSPC: implications for CEUS and molecular imaging
Next to the characterization of the microbubbles, we aimed at identifying whether DSPC or
DPPC‐based microbubbles would be more suitable for CEUS and ultrasound molecular imag‐
ing. For both applications the microbubbles need to circulate in the bloodstream long
enough for imaging [335, 336]. This was quantified in our study as the acoustical stability,
which was found to be equal for DSPC and DPPC‐based microbubbles at low pressures
(< 20 kPa). With increasing pressures (50 ‐ 100 kPa), the higher acoustical stability of DSPC
favored the DSPC‐based microbubbles, as confirmed by others [50, 285]. Another require‐
ment is that the microbubbles need to be distinguishable from tissue on the basis of their
nonlinear oscillations [29, 209]. More specifically, the amplitudes of these oscillations must
be high enough for detection by the ultrasound scanners used in clinical practice. Although
more DPPC microbubbles were responsive at the subharmonic frequency at a driving pres‐
sure of 50 kPa, this advantage of DPPC microbubbles disappeared at a driving pressure of
92
DSPC vs DPPC: Non‐linear response and viscoelastic properties
100 kPa. In addition, the scattered pressures at the second harmonic frequency were much
higher than those as the subharmonic frequency: up to ~30× higher for DSPC and ~8× for
DPPC‐based microbubbles at a driving pressure of 100 kPa. Since the scattered pressure at
the second harmonic pressure for DSPC‐based microbubbles is almost four times higher
than that of DPPC‐based microbubbles, this clearly favors DSPC to be used as coating mate‐
rial.
The requirements listed above make DSPC‐based microbubbles the better choice for
CEUS, even though subharmonic imaging might be preferred above second harmonic imag‐
ing due to its higher specificity for contrast [181]. Since the scattered pressures at the sec‐
ond harmonic frequency, measured at 2 cm away from the microbubbles, were above the
detection limit (Fig. 5.6), e.g. in vivo carotid imaging could be performed successfully.
For ultrasound molecular imaging on the other hand, care should be taken of properties
related to targeting of the microbubbles, such as ligand distribution, binding area, and bind‐
ing force. Kooiman et al. [70] determined the ligand distribution and binding area by using
super‐resolution fluorescence microscopy, and they favored DPPC over DSPC as the main
lipid for ultrasound molecular imaging, on the basis of its more homogeneous ligand distri‐
bution, larger binding area, and dome‐shape upon binding. A more homogeneous distribu‐
tion of the ligands may result in a higher possibility of contact between a ligand attached to
the shell and its molecular target. The larger binding area also resulted in a different shape
of the bound microbubbles, which may be advantageous in terms of sustaining a higher
blood shear stress.
5.6. CONCLUSION
This study showed that the acoustical stability, the responses at the second harmonic fre‐
quency, and the shell elasticity are higher for DSPC than for DPPC‐based microbubbles. The
higher acoustical stability and the higher responses at the second harmonic frequency sug‐
gest that microbubble formulations based on DSPC are more suitable for clinical CEUS imag‐
ing than those based on DPPC.
Acknowledgements
The authors thank Robert Beurskens, Frits Mastik, Michiel Manten, and Geert Springeling
for technical assistance, and Tom Kokhuis and Rik Vos for fruitful discussions (all from the
Department of Biomedical Engineering, Erasmus MC). Special thanks to prof. Alfred Blume
(Department of Biophysical Chemistry, Martin Luther University Halle‐Wittenberg, Germa‐
ny) for fruitful discussions on lipid behavior. This work is supported by NanoNextNL, a micro
and nanotechnology consortium of the Government of the Netherlands and 130 partners
and by the Center for Translational Molecular Medicine (CTMM) and the Netherlands Heart
Foundation (PARISk).
93

94
Impulse response method for characterization of echogenic
liposomes
Jason L. Raymond, Ying Luan, Tom van Rooij, Klazina Kooiman, Shao‐Ling Huang, David D. McPherson, Michel Versluis, Nico de Jong, Christy K. Holland Journal of the Acoustical Society of America, 137:4, 1693–1703 (2015)
6 Chapter
95

CHAPTER 6
6.1. ABSTRACT
An optical characterization method is presented based on the use of the impulse response
to characterize the damping imparted by the shell of an air‐filled ultrasound contrast agent
(UCA). The interfacial shell viscosity was estimated based on the unforced decaying re‐
sponse of individual echogenic liposomes (ELIP) exposed to a broadband acoustic impulse
excitation. Radius versus time response was measured optically based on recordings ac‐
quired using an ultra‐high‐speed camera. The method provided an efficient approach that
enabled statistical measurements on 106 individual ELIP. A decrease in shell viscosity, from
2.1×10‐8 kg/s to 2.5×10‐9 kg/s, was observed with increasing dilatation rate, from 0.5×10⁶ s‐1 to
1×10⁷ s‐1. This nonlinear behavior has been reported in other studies of lipid‐shelled UCAs and
is consistent with rheological shear‐thinning. The measured shell viscosity for the ELIP for‐
mulation used in this study, κs = (2.1 ± 1.0)×10‐8 kg/s, was in quantitative agreement with
previously reported values on a population of ELIP and is consistent with other lipid‐shelled
UCAs. The acoustic response of ELIP therefore is similar to other lipid‐shelled UCAs, despite
loading with air instead of perfluorocarbon gas. The methods described here can provide an
accurate estimate of the shell viscosity and damping for individual UCA microbubbles.
6.2. INTRODUCTION
Physical models for encapsulated ultrasound contrast agent (UCA) microbubbles have been
developed and improved over the past two decades. The models give accurate predictions
of the nonlinear radial dynamics of individual UCA microbubbles, particularly under forced,
or acoustically driven, conditions [5]. Such models are largely based on Rayleigh‐Plesset‐
type equations, which describe the dynamics of a gas bubble in response to pressure varia‐
tions. The effects of the shell encapsulation on the microbubble motion are incorporated by
adding additional terms that describe the viscoelastic behavior of the shell [337]. The pres‐
ence of the shell increases the resonance frequency from that of a free bubble and damps
the oscillations in response to the acoustic forcing [146]. The shell also affects the nonlinear
response of microbubbles, a key property of UCAs which is often exploited in diagnostic
imaging modes for enhanced discrimination between the contrast agent and surrounding
tissue [338].
In addition to traditional diagnostic ultrasound imaging, there has been recent interest
in advancing the applications of microbubbles for molecular imaging and therapeutic appli‐
cations. These applications exploit the nonlinear response for selective detection of mi‐
crobubbles in a given volume for diagnosis and specific targeting of disease. Molecular
imaging techniques with targeted UCAs are being used increasingly for noninvasive diagno‐
sis of inflammation, thrombus, and neovascularization [94]. Targeted microbubble agents
are also being developed for controlled drug‐delivery applications [339]. Clinical application
of these UCAs necessitates accurate prediction of the frequency‐dependent response of
96
Impulse response of echogenic liposomes
single isolated microbubbles. A better understanding of the shell properties that can be
expected for individual UCA microbubbles within a population is also critical. The acoustic
response of microbubbles can depend on the morphology and viscoelastic properties of the
encapsulating shell [315], particularly if lipids are not homogeneously distributed through‐
out the shell [340]. Therefore, single microbubble characterization techniques and physical
models that accurately describe the dynamics of an encapsulated microbubble are increas‐
ingly important.
The introduction of optical methods to resolve microbubble oscillations has provided
new insights into the dynamic response of single microbubbles. Optical methods based on
direct measurement of the bubble radius versus time can be used due to availability of ultra‐
high‐speed imaging systems [56, 125] such as the Brandaris 128 fast‐framing (0.5–25 Mfps)
camera [52]. This system enables optical characterization studies by imaging single mi‐
crobubble dynamical phenomena occurring at multiple time‐scales [320]. Acoustic meas‐
urements of the scattered echo from an isolated microbubble have been simultaneously
recorded and compared to the optically measured radial dynamics to verify the effective‐
ness of this approach [341].
Optical studies of the radial dynamics of UCAs typically rely on measuring the steady‐
state forced response of a microbubble to a narrow‐band burst excitation. For example, the
amplitude response of a microbubble exposed to multiple‐cycle, low amplitude ultrasound
bursts at various frequencies can be analyzed to build up a resonance curve and fit to a
linearized model to derive the viscoelastic shell parameters [20]. This microbubble spectros‐
copy technique [18, 20, 330, 342] requires multiple recordings to characterize the frequency‐
dependent response of an individual microbubble. In addition, the shell morphology can be
altered or destroyed due to multiple burst excitations [343]. A method using a single excita‐
tion would improve the efficiency of UCA characterization techniques and would minimize
the effect of alterations to the microbubble shell under successive excitations.
In this study, we investigated the use of the impulse response to characterize the damp‐
ing imparted by the encapsulation of microbubbles stabilized by a lipid shell, echogenic
liposomes (ELIP) [344]. The shell viscosity is the dominant mechanism affecting the damp‐
ing of microbubble response to acoustic excitation and most directly influences the onset of
nonlinear oscillations. An understanding of this physical property of the shell encapsulation
can be exploited for optimization of contrast‐enhanced imaging and therapeutic applica‐
tions. Through this technique, we aim to acquire a better understanding of the transient
dynamics of ELIP in response to short‐pulse excitations for both diagnostic and therapeutic
applications. This method is also of particular interest to improve the efficiency of UCA
characterization techniques in general as it requires only a single acoustic excitation when
the impulse response is recorded using an ultra‐high‐speed camera.
ELIP are under development as theranostic ultrasound contrast agents and differ from
other commercially available ultrasound contrast agents primarily in shell material and gas
97
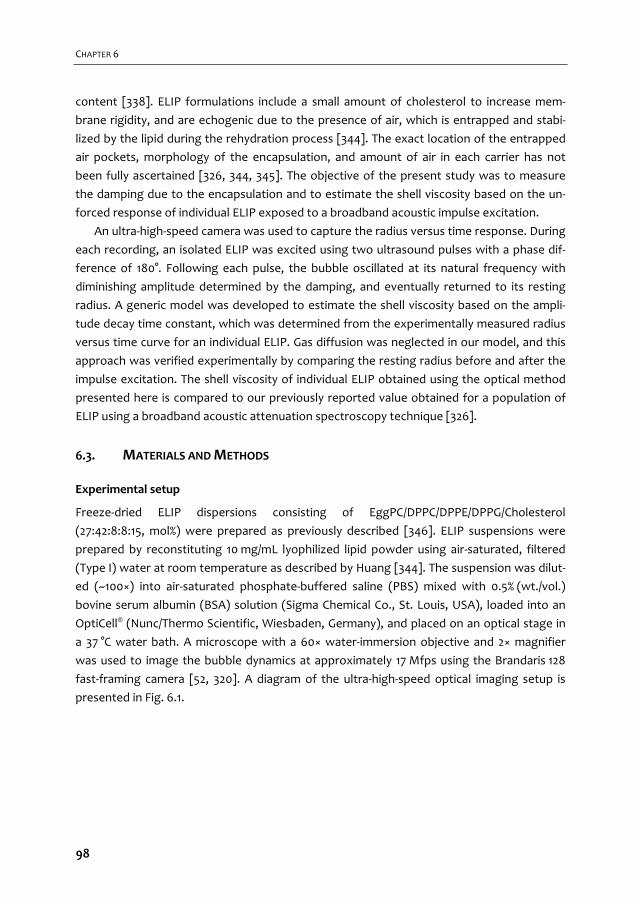
CHAPTER 6
content [338]. ELIP formulations include a small amount of cholesterol to increase mem‐
brane rigidity, and are echogenic due to the presence of air, which is entrapped and stabi‐
lized by the lipid during the rehydration process [344]. The exact location of the entrapped
air pockets, morphology of the encapsulation, and amount of air in each carrier has not
been fully ascertained [326, 344, 345]. The objective of the present study was to measure
the damping due to the encapsulation and to estimate the shell viscosity based on the un‐
forced response of individual ELIP exposed to a broadband acoustic impulse excitation.
An ultra‐high‐speed camera was used to capture the radius versus time response. During
each recording, an isolated ELIP was excited using two ultrasound pulses with a phase dif‐
ference of 180°. Following each pulse, the bubble oscillated at its natural frequency with
diminishing amplitude determined by the damping, and eventually returned to its resting
radius. A generic model was developed to estimate the shell viscosity based on the ampli‐
tude decay time constant, which was determined from the experimentally measured radius
versus time curve for an individual ELIP. Gas diffusion was neglected in our model, and this
approach was verified experimentally by comparing the resting radius before and after the
impulse excitation. The shell viscosity of individual ELIP obtained using the optical method
presented here is compared to our previously reported value obtained for a population of
ELIP using a broadband acoustic attenuation spectroscopy technique [326].
6.3. MATERIALS AND METHODS
Experimental setup
Freeze‐dried ELIP dispersions consisting of EggPC/DPPC/DPPE/DPPG/Cholesterol
(27:42:8:8:15, mol%) were prepared as previously described [346]. ELIP suspensions were
prepared by reconstituting 10 mg/mL lyophilized lipid powder using air‐saturated, filtered
(Type I) water at room temperature as described by Huang [344]. The suspension was dilut‐
ed (~100×) into air‐saturated phosphate‐buffered saline (PBS) mixed with 0.5% (wt./vol.)
bovine serum albumin (BSA) solution (Sigma Chemical Co., St. Louis, USA), loaded into an
OptiCell® (Nunc/Thermo Scientific, Wiesbaden, Germany), and placed on an optical stage in
a 37 °C water bath. A microscope with a 60× water‐immersion objective and 2× magnifier
was used to image the bubble dynamics at approximately 17 Mfps using the Brandaris 128
fast‐framing camera [52, 320]. A diagram of the ultra‐high‐speed optical imaging setup is
presented in Fig. 6.1.
98

Impulse response of echogenic liposomes
Fig. 6.2A shows an optical image of a dilute suspension of ELIP suspended in an Opti‐
Cell® using a 40× objective to obtain a larger field of view. A single frame from a Brandar‐
is 128 recording using the 60× objective and 2× magnifier is shown in Fig. 6.2B. Fig. 6.2C and
6.2D show super‐resolution fluorescence microscope images of fluorescently‐labeled ELIP
obtained using the methods outlined by Kooiman et al [70]. Briefly, a 4Pi confocal laser‐
scanning microscope (Leica TCS 4Pi) with two opposing objective lenses (100×, HCX PL APO,
1.35 NA) was used to generate super‐resolution 3‐D image stacks. For this supporting study,
2 mol% fluorescently‐labeled rhodamine‐DPPE was substituted into the ELIP formulation and
the reconstituted liposomes were suspended in 87% (vol./vol.) glycerol between quartz
cover slips at room temperature. The images show the distribution of the lipid molecules in
the shell encapsulation of the ELIP. The size distribution of the microbubbles deduced from
optical images presented in Figs. 6.2A and 6.2C is consistent with Coulter Counter meas‐
urements of the particle size distribution for this ELIP formulation, which indicated a vol‐
ume‐weighted mean diameter of 2 μm [326]. Previously published transmission electron
Fig. 6.1. Schematic of the setup used to optically record the microbubble oscillation.
99
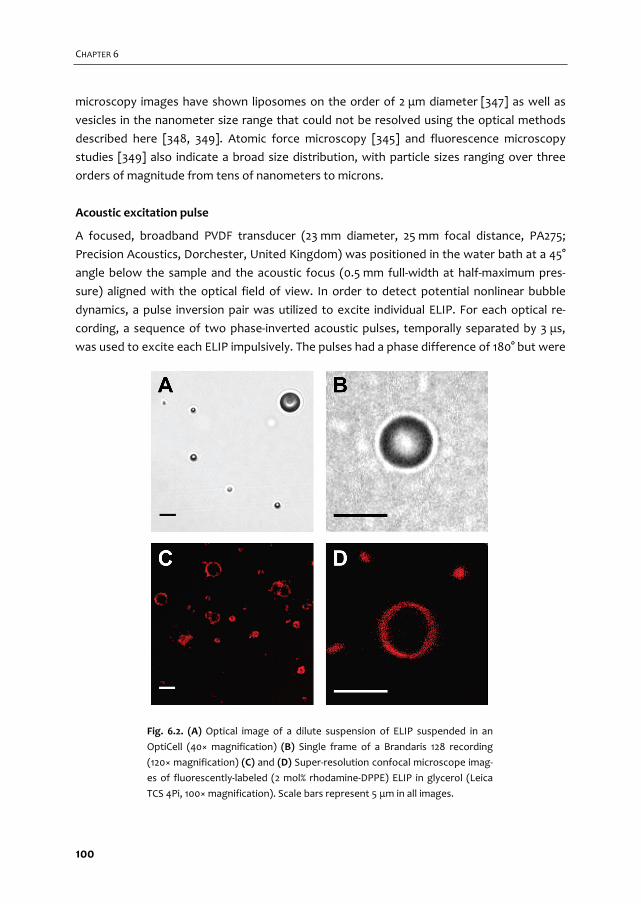
CHAPTER 6
microscopy images have shown liposomes on the order of 2 μm diameter [347] as well as
vesicles in the nanometer size range that could not be resolved using the optical methods
described here [348, 349]. Atomic force microscopy [345] and fluorescence microscopy
studies [349] also indicate a broad size distribution, with particle sizes ranging over three
orders of magnitude from tens of nanometers to microns.
Acoustic excitation pulse
A focused, broadband PVDF transducer (23 mm diameter, 25 mm focal distance, PA275;
Precision Acoustics, Dorchester, United Kingdom) was positioned in the water bath at a 45°
angle below the sample and the acoustic focus (0.5 mm full‐width at half‐maximum pres‐
sure) aligned with the optical field of view. In order to detect potential nonlinear bubble
dynamics, a pulse inversion pair was utilized to excite individual ELIP. For each optical re‐
cording, a sequence of two phase‐inverted acoustic pulses, temporally separated by 3 μs,
was used to excite each ELIP impulsively. The pulses had a phase difference of 180° but were
Fig. 6.2. (A) Optical image of a dilute suspension of ELIP suspended in an
OptiCell (40× magnification) (B) Single frame of a Brandaris 128 recording
(120× magnification) (C) and (D) Super‐resolution confocal microscope imag‐
es of fluorescently‐labeled (2 mol% rhodamine‐DPPE) ELIP in glycerol (Leica
TCS 4Pi, 100× magnification). Scale bars represent 5 μm in all images.
100
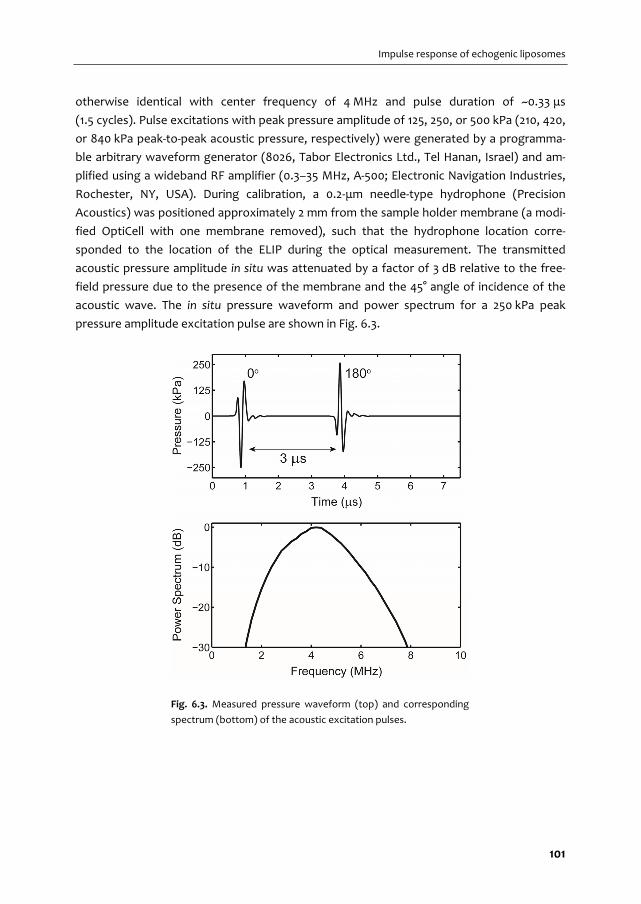
Impulse response of echogenic liposomes
otherwise identical with center frequency of 4 MHz and pulse duration of ~0.33 μs
(1.5 cycles). Pulse excitations with peak pressure amplitude of 125, 250, or 500 kPa (210, 420,
or 840 kPa peak‐to‐peak acoustic pressure, respectively) were generated by a programma‐
ble arbitrary waveform generator (8026, Tabor Electronics Ltd., Tel Hanan, Israel) and am‐
plified using a wideband RF amplifier (0.3–35 MHz, A‐500; Electronic Navigation Industries,
Rochester, NY, USA). During calibration, a 0.2‐μm needle‐type hydrophone (Precision
Acoustics) was positioned approximately 2 mm from the sample holder membrane (a modi‐
fied OptiCell with one membrane removed), such that the hydrophone location corre‐
sponded to the location of the ELIP during the optical measurement. The transmitted
acoustic pressure amplitude in situ was attenuated by a factor of 3 dB relative to the free‐
field pressure due to the presence of the membrane and the 45° angle of incidence of the
acoustic wave. The in situ pressure waveform and power spectrum for a 250 kPa peak
pressure amplitude excitation pulse are shown in Fig. 6.3.
Fig. 6.3. Measured pressure waveform (top) and corresponding
spectrum (bottom) of the acoustic excitation pulses.
101
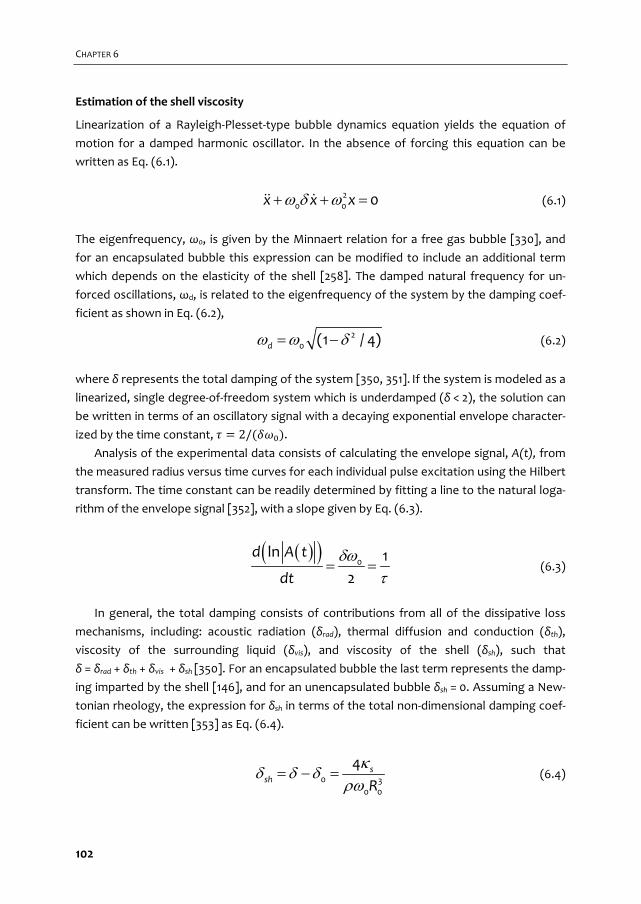
CHAPTER 6
Estimation of the shell viscosity
Linearization of a Rayleigh‐Plesset‐type bubble dynamics equation yields the equation of
motion for a damped harmonic oscillator. In the absence of forcing this equation can be
written as Eq. (6.1).
20 0 0x x x (6.1)
The eigenfrequency, ω0, is given by the Minnaert relation for a free gas bubble [330], and
for an encapsulated bubble this expression can be modified to include an additional term
which depends on the elasticity of the shell [258]. The damped natural frequency for un‐
forced oscillations, ωd, is related to the eigenfrequency of the system by the damping coef‐
ficient as shown in Eq. (6.2),
20 (1 / 4)d (6.2)
where δ represents the total damping of the system [350, 351]. If the system is modeled as a
linearized, single degree‐of‐freedom system which is underdamped (δ < 2), the solution can
be written in terms of an oscillatory signal with a decaying exponential envelope character‐
ized by the time constant, 2/ .
Analysis of the experimental data consists of calculating the envelope signal, A(t), from
the measured radius versus time curves for each individual pulse excitation using the Hilbert
transform. The time constant can be readily determined by fitting a line to the natural loga‐
rithm of the envelope signal [352], with a slope given by Eq. (6.3).
0
ln 1
2
d A t
dt (6.3)
In general, the total damping consists of contributions from all of the dissipative loss
mechanisms, including: acoustic radiation (δrad), thermal diffusion and conduction (δth),
viscosity of the surrounding liquid (δvis), and viscosity of the shell (δsh), such that
δ = δrad + δth + δvis + δsh [350]. For an encapsulated bubble the last term represents the damp‐
ing imparted by the shell [146], and for an unencapsulated bubble δsh = 0. Assuming a New‐
tonian rheology, the expression for δsh in terms of the total non‐dimensional damping coef‐
ficient can be written [353] as Eq. (6.4).
0 3
0 0
4 ssh
R (6.4)
102
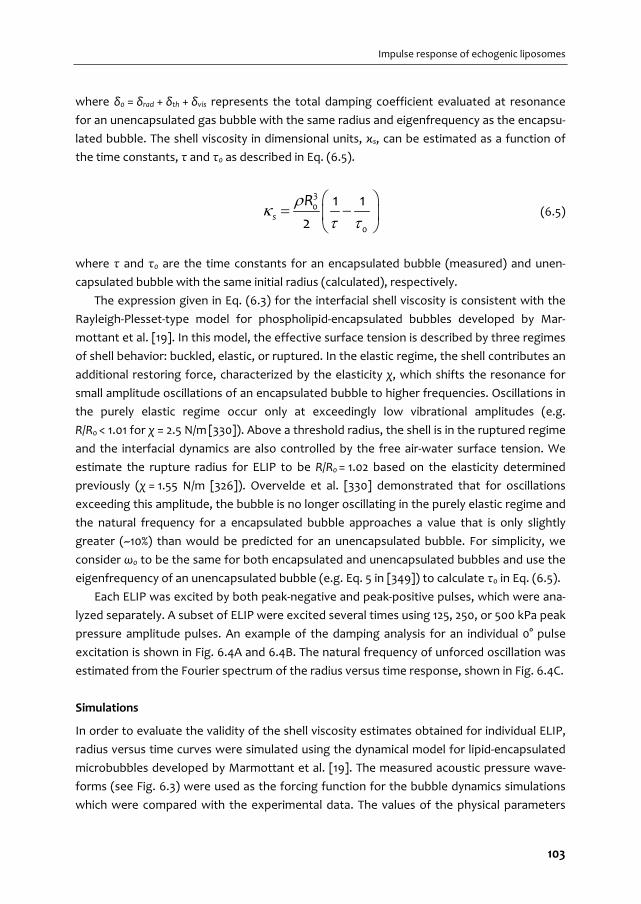
Impulse response of echogenic liposomes
where δ0 = δrad + δth + δvis represents the total damping coefficient evaluated at resonance
for an unencapsulated gas bubble with the same radius and eigenfrequency as the encapsu‐
lated bubble. The shell viscosity in dimensional units, κs, can be estimated as a function of
the time constants, τ and τ0 as described in Eq. (6.5).
30
0
1 1
2s
R (6.5)
where τ and τ0 are the time constants for an encapsulated bubble (measured) and unen‐
capsulated bubble with the same initial radius (calculated), respectively.
The expression given in Eq. (6.3) for the interfacial shell viscosity is consistent with the
Rayleigh‐Plesset‐type model for phospholipid‐encapsulated bubbles developed by Mar‐
mottant et al. [19]. In this model, the effective surface tension is described by three regimes
of shell behavior: buckled, elastic, or ruptured. In the elastic regime, the shell contributes an
additional restoring force, characterized by the elasticity χ, which shifts the resonance for
small amplitude oscillations of an encapsulated bubble to higher frequencies. Oscillations in
the purely elastic regime occur only at exceedingly low vibrational amplitudes (e.g.
R/R0 < 1.01 for χ = 2.5 N/m [330]). Above a threshold radius, the shell is in the ruptured regime
and the interfacial dynamics are also controlled by the free air‐water surface tension. We
estimate the rupture radius for ELIP to be R/R0 = 1.02 based on the elasticity determined
previously (χ = 1.55 N/m [326]). Overvelde et al. [330] demonstrated that for oscillations
exceeding this amplitude, the bubble is no longer oscillating in the purely elastic regime and
the natural frequency for a encapsulated bubble approaches a value that is only slightly
greater (~10%) than would be predicted for an unencapsulated bubble. For simplicity, we
consider ω0 to be the same for both encapsulated and unencapsulated bubbles and use the
eigenfrequency of an unencapsulated bubble (e.g. Eq. 5 in [349]) to calculate τ0 in Eq. (6.5).
Each ELIP was excited by both peak‐negative and peak‐positive pulses, which were ana‐
lyzed separately. A subset of ELIP were excited several times using 125, 250, or 500 kPa peak
pressure amplitude pulses. An example of the damping analysis for an individual 0° pulse
excitation is shown in Fig. 6.4A and 6.4B. The natural frequency of unforced oscillation was
estimated from the Fourier spectrum of the radius versus time response, shown in Fig. 6.4C.
Simulations
In order to evaluate the validity of the shell viscosity estimates obtained for individual ELIP,
radius versus time curves were simulated using the dynamical model for lipid‐encapsulated
microbubbles developed by Marmottant et al. [19]. The measured acoustic pressure wave‐
forms (see Fig. 6.3) were used as the forcing function for the bubble dynamics simulations
which were compared with the experimental data. The values of the physical parameters
103

CHAPTER 6
Fig. 6.4. Schematic of the damping analysis. (A) Radius versus time
curve measured in response to 0° impulse excitation (the response
due to 180° excitation is truncated for clarity). (B) The amplitude
decay envelope (solid line) is calculated using the discrete Hilbert
transform. The time constant is obtained by fitting an exponential
decay (dash‐dot line) to the envelope using Eq. (6.1). For this
example, R0 = 2.5 μm, τ = 0.85 μs, κs = 5.6×10‐9 kg/s. (C) Amplitude
spectrum of the radius versus time curve.
104

Impulse response of echogenic liposomes
used for the simulations were: ambient pressure P0 = 100 kPa, density of the liquid,
ρ = 1007 kg/m3, viscosity of the liquid (at 37 °C), μ = 0.76×10‐3 kg/(m∙s), surface tension of the
free air‐water interface, σwater = 0.072 N/m, and speed of sound, c = 1536 m/s. These parame‐
ters correspond to air‐filled microbubbles suspended in PBS with 0.5% BSA solution at 37 °C
[326]. The effective polytropic exponent was calculated from the ratio of specific heats
using the expression given by Hoff et al. [354] following other researchers who have used
similar expressions [355]. The parameters used in the Marmottant model for describing the
interfacial rheological properties of the shell are the elasticity, χ = 0.1–1.55 N/m, and the shell
surface viscosity, κs, which was estimated based on experimental measurements as de‐
scribed in the previous section. Marmottant [19] and others [330] have demonstrated that a
phospholipid shell stabilizes a quiescent gas bubble by counteracting the Laplace pressure,
therefore most microbubbles have an initial surface tension much lower than the surface
tension of the free air‐water interface, σwater [310]. In this study, we assume the shell encap‐
sulation is initially in the pre‐buckled state (i.e. the transition between the elastic and buck‐
led regions) and consequently the initial surface tension was taken as σ0 = 0 for all numerical
simulations.
Excitation of ELIP with a tone burst
A subset of ELIP was also excited using a 3 MHz tone burst to record the radius versus time
response to acoustic forcing. Burst excitations were generated using the same arbitrary
waveform generator and transducer, but consisted of a 10‐cycle, 3‐MHz sinusoidal wave
with a 2‐cycle Gaussian ramp and taper. The in situ acoustic pressure amplitude for the tone
burst excitation was 180 kPa, calibrated using the same methods as described above. An
impulse response excitation was recorded prior to the tone burst excitation in order to
obtain an estimate of the shell viscosity using the methods described above. This data ac‐
quisition scheme enabled a post hoc comparison of the measured forced response to simu‐
lations using the estimated value of shell viscosity for a particular liposome.
6.4. RESULTS
A total of 476 radius versus time curves for 106 individual ELIP were analyzed. The equilibri‐
um radii of the individual ELIP ranged between 0.9–3.4 μm. Only trials for which the mi‐
crobubble did not show any dissolution were analyzed in this study (|Δr| < 0.1 μm, where Δr
is the difference between the bubble resting radius before and after the acoustic excita‐
tion). A small number of recordings (12 in total, <3%) with |Δr| > 0.1 were therefore not in‐
cluded in the analysis.
105
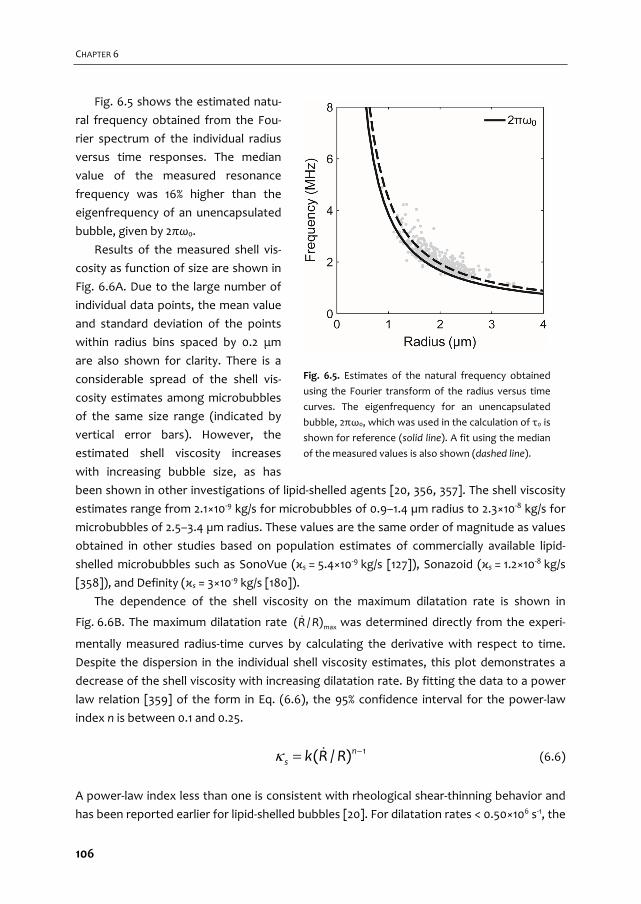
CHAPTER 6
Fig. 6.5 shows the estimated natu‐
ral frequency obtained from the Fou‐
rier spectrum of the individual radius
versus time responses. The median
value of the measured resonance
frequency was 16% higher than the
eigenfrequency of an unencapsulated
bubble, given by 2πω0.
Results of the measured shell vis‐
cosity as function of size are shown in
Fig. 6.6A. Due to the large number of
individual data points, the mean value
and standard deviation of the points
within radius bins spaced by 0.2 μm
are also shown for clarity. There is a
considerable spread of the shell vis‐
cosity estimates among microbubbles
of the same size range (indicated by
vertical error bars). However, the
estimated shell viscosity increases
with increasing bubble size, as has
been shown in other investigations of lipid‐shelled agents [20, 356, 357]. The shell viscosity
estimates range from 2.1×10‐9 kg/s for microbubbles of 0.9–1.4 µm radius to 2.3×10‐8 kg/s for
microbubbles of 2.5–3.4 µm radius. These values are the same order of magnitude as values
obtained in other studies based on population estimates of commercially available lipid‐
shelled microbubbles such as SonoVue (κs = 5.4×10‐9 kg/s [127]), Sonazoid (κs = 1.2×10‐8 kg/s
[358]), and Definity (κs = 3×10‐9 kg/s [180]).
The dependence of the shell viscosity on the maximum dilatation rate is shown in
Fig. 6.6B. The maximum dilatation rate max( / )R R was determined directly from the experi‐
mentally measured radius‐time curves by calculating the derivative with respect to time.
Despite the dispersion in the individual shell viscosity estimates, this plot demonstrates a
decrease of the shell viscosity with increasing dilatation rate. By fitting the data to a power
law relation [359] of the form in Eq. (6.6), the 95% confidence interval for the power‐law
index n is between 0.1 and 0.25.
1( / )ns k R R (6.6)
A power‐law index less than one is consistent with rheological shear‐thinning behavior and
has been reported earlier for lipid‐shelled bubbles [20]. For dilatation rates < 0.50×10⁶ s‐1, the
Fig. 6.5. Estimates of the natural frequency obtained
using the Fourier transform of the radius versus time
curves. The eigenfrequency for an unencapsulated
bubble, 2πω0, which was used in the calculation of τ0 is
shown for reference (solid line). A fit using the median
of the measured values is also shown (dashed line).
106

Impulse response of echogenic liposomes
Fig. 6.6. Shell viscosity versus (A) radius and (B) dilatation rate. Horizontal bars represent the bin width
and vertical error bars represent one standard deviation of the points within each radius bin.
Fig. 6.7. Example of simulated and experimentally measured radius versus time
curves for ELIP with equilibrium radii of 1.5, 2.3, and 3.0 μm. The excitation peak
pressure amplitude for all cases was 250 kPa. Estimates of the shell viscosity were
derived from the experimental measurements for each case and used as inputs for
the numerical simulation, yielding κs = 3.3 ± 0.4×10‐9, 6.0 ± 0.3×10‐9 and 2.15 ± 0.2×10‐8
kg/s, respectively. Other simulation parameters were R0 = 1.5, 2.3 and 3.0 μm and χ =
0.1, 0.2 and 1.55 N/m, respectively.
107

CHAPTER 6
mean value and standard deviation of the shell viscosity estimates in this study was
κs = (2.1 ± 1.0)×10‐8 kg/s (n = 23).
Fig. 6.7 shows three examples of numerically simulated and experimentally measured
radius versus time curves for individual ELIP with equilibrium radii of 1.5, 2.3, and 3.0 μm. The
excitation peak pressure amplitude for all cases was 250 kPa. Simulations were carried out
using the experimentally derived shell viscosity (κs) for each individual ELIP (i.e. the average
of the estimates derived from both 0° and 180° impulses). The shell elasticity (χ) was varied
over one order of magnitude, with the upper limit corresponding to the value previously
determined for ELIP in the linear regime, χ = 0.1–1.55 N/m [326] The numerical simulations
show good agreement with the experimentally measured transient impulse response dy‐
namics for each case.
Fig. 6.8 shows an example of simulated and experimentally measured radius versus time
curves for a single ELIP exposed to three different peak pressure amplitude pulses: 125, 250
and 500 kPa. As expected, the shell viscosity values obtained from each independent excita‐
tion are similar. The estimates of κs for each pressure are 5.7, 5.6, and 5.6×10‐9 kg/s, respec‐
tively.
6.5. DISCUSSION
The goal of this study was to improve the understanding of the transient oscillation dynam‐
ics and shell properties of ELIP. We estimated the damping and shell viscosity from the
Fig. 6.8. Example of experimental and simulated radius‐time curves for a single ELIP (R0 = 2.5 μm,
χ = 0.25 N/m) excited by (A) 125 kPa, (B) 250 kPa and (C) 500 kPa peak pressure amplitude pulses
(0° pulse). Vertical bars represent the relative error of the radius tracking algorithm, which was deter‐
mined by the difference between the maximum and minimum radius measured from a recording of the
same ELIP without ultrasound exposure.
108
Impulse response of echogenic liposomes
unforced response of individual ELIP excited by a broadband acoustic impulse excitation
measured using ultra‐high‐speed imaging. This technique can achieve the measurement of
individual ELIP in a single run using the Brandaris 128 ultra‐high‐speed framing camera, and
provides an efficient alternative approach to the microbubble spectroscopy technique as
reported previously [18, 20, 342]. The results derived from estimates for individual ELIP were
in good agreement with our previously obtained values based on bulk acoustic attenuation
measurements. Overall, the shell viscosity estimates for ELIP in this study are consistent
with values reported for commercially available lipid‐shelled UCAs. Furthermore, we found
that the Marmottant model accurately describes the transient dynamics of an individual
ELIP when compared with radius versus time measurements obtained from ultra‐high‐speed
recordings. Thus, despite the encapsulation of air instead of perfluorocarbon gas, the visco‐
elastic shell properties of ELIP are similar to other lipid‐shelled agents such as SonoVue and
Definity.
Natural frequency of unforced oscillations
The eigenfrequency of an unencapsulated bubble is used to calculate the time constant, τ0,
in Eq. (6.5). To evaluate the validity of the assumption that the surface tension dominates
the bubble dynamics, we obtained estimates of the natural frequency from the Fourier
transform of the radius versus time curves (Fig. 6.5). The median natural frequency meas‐
ured was 16% higher than the eigenfrequency for an unencapsulated bubble, given by 2πω0.
A 16% error in the natural frequency translates to a ~4% change in τ0 (and therefore in our
estimates of κs) for the size range of bubbles studied.
Contributions to damping effects
The total damping coefficient is the summation of the shell damping (δsh) and three other
damping terms: the radiation damping (δrad), the thermal damping (δth), and the viscous
damping due to the surrounding liquid (δvis). Theoretical expressions for predicting the
damping factors of a spherically oscillating gas bubble are well‐established [350], and the
latter three terms can be readily calculated based on the known equilibrium size and eigen‐
frequency of the microbubble. Fig. 6.9 shows the resonance damping coefficients versus
radius for an air bubble under the experimental conditions used in this study. Viscous damp‐
ing (δvis or δsh) dominates and the radiation damping is approximately an order of magnitude
smaller for bubbles in the size range considered in this study. However, thermal damping
can be appreciable and is included in our model for air‐filled microbubbles at resonance.
Thermal damping is not accounted for explicitly in the Rayleigh‐Plesset formulation and
is often neglected in linearized models of UCAs as well [5]. However, thermal damping can
be significant for resonant bubbles larger than about 1 μm and is dominant for resonant
bubbles larger than ~10 μm [146]. Fig. 6.9 shows that for a 1.3 μm radius bubble, δth is ap‐
proximately equal to δrad and only amounts to 15% of the viscous term δvis. For a bubble of
109
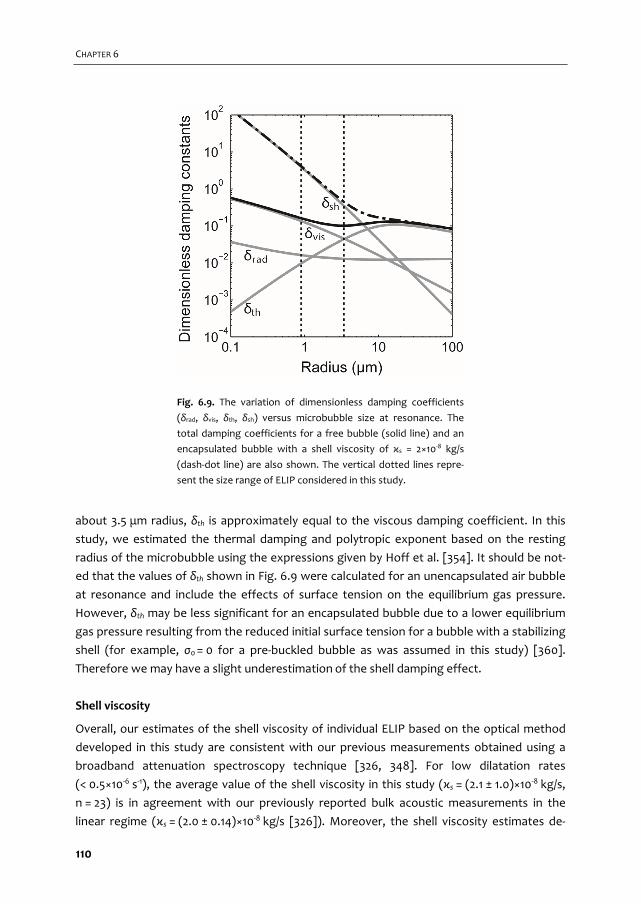
CHAPTER 6
about 3.5 μm radius, δth is approximately equal to the viscous damping coefficient. In this
study, we estimated the thermal damping and polytropic exponent based on the resting
radius of the microbubble using the expressions given by Hoff et al. [354]. It should be not‐
ed that the values of δth shown in Fig. 6.9 were calculated for an unencapsulated air bubble
at resonance and include the effects of surface tension on the equilibrium gas pressure.
However, δth may be less significant for an encapsulated bubble due to a lower equilibrium
gas pressure resulting from the reduced initial surface tension for a bubble with a stabilizing
shell (for example, σ0 = 0 for a pre‐buckled bubble as was assumed in this study) [360].
Therefore we may have a slight underestimation of the shell damping effect.
Shell viscosity
Overall, our estimates of the shell viscosity of individual ELIP based on the optical method
developed in this study are consistent with our previous measurements obtained using a
broadband attenuation spectroscopy technique [326, 348]. For low dilatation rates
(< 0.5×10‐6 s‐1), the average value of the shell viscosity in this study (κs = (2.1 ± 1.0)×10‐8 kg/s,
n = 23) is in agreement with our previously reported bulk acoustic measurements in the
linear regime (κs = (2.0 ± 0.14)×10‐8 kg/s [326]). Moreover, the shell viscosity estimates de‐
Fig. 6.9. The variation of dimensionless damping coefficients
(δrad, δvis, δth, δsh) versus microbubble size at resonance. The
total damping coefficients for a free bubble (solid line) and an
encapsulated bubble with a shell viscosity of κs = 2×10‐8 kg/s
(dash‐dot line) are also shown. The vertical dotted lines repre‐
sent the size range of ELIP considered in this study.
110
Impulse response of echogenic liposomes
rived from damping measurements on 106 individual ELIP in this study indicate an apparent
increase of the shell viscosity with increasing radius, and a decrease with increasing dilata‐
tion rate, indicative of shear‐thinning behavior. This observation is consistent with previous
measurements on commercially available lipid‐shelled microbubbles such as SonoVue [20]
and Definity [357], but is not explained by existing shell models where the viscosity is as‐
sumed to be constant over all radii. However, there have recently been attempts to account
for this behavior using ad‐hoc rheological models [361, 362].
The shell viscosity estimates based on the optical approach also showed considerable
variations among ELIP of the same size range (see Fig. 6.6). Variations in shell properties
and acoustic response have also been reported in previous studies on lipid‐shelled mi‐
crobubbles. Kwan and Borden [310] and Kooiman et al. [70] present convincing microscopic
images of heterogeneous lipid domains and ascribe this phenomenon to phase separation
of the different lipid species on the bubble surface. Similar variations in the local lipid con‐
centration on the shell have been found to affect the nonlinear behavior of DSPC mi‐
crobubbles at high frequencies [259], although no clear relation between the nonlinear
response and shell microstructure was evident. Hosny et al. [315] quantified the spatial dis‐
tribution of viscosity in the microbubble shell using a fluorescence lifetime imaging tech‐
nique and also found a large variation in viscosity that was correlated to differences in the
ultrasound response of microbubbles of similar size. Based on the chemical composition
and preparation method of ELIP, we expect similar inhomogeneities in local lipid concentra‐
tion, as well as variation between individual ELIP particles within a population. Moreover,
lipid diffusion and the phase transition influenced by the surrounding temperature can be
other key factors affecting the heterogeneity of the ELIP shell [340, 346].
Nanostructural surface morphology which could not be resolved using the optical tech‐
niques in this study (e.g. Fig. 6.2) may nevertheless play a large role in the dynamic behavior
of ELIP. For lipid‐encapsulated bubbles the shell is usually assumed to be a monolayer due
to thermodynamic considerations [310]. However, the shell thickness has not been directly
measured for microscopic encapsulated gas bubbles and estimates based on the dynamic
response of the microbubble only give information about the interfacial rheological proper‐
ties of the microbubble (i.e. zero‐thickness interface model) [345]. Therefore, the large
variation in viscosity estimates could be due to the number of lipid layers surrounding the
encapsulated microbubbles [315]. The resolution of the fluorescence images presented in
Fig. 6.2 is limited by the focal spot size, which is about 220 nm in the lateral dimension. Thus,
we are unable to conclude whether the shell is a lipid monolayer or if it is multilamellar.
Multilamellar vesicles, in which the lipid monolayer immediately adjacent to the gas bubble
is surrounded by one or more bilayers, have been observed in transmission electron micros‐
copy images of ELIP [348]. The spread of the shell viscosity estimates for ELIP of similar size
may indicate the presence of multilamellar vesicles, where the apparent viscosity depends
on the number of lamallae.
111

CHAPTER 6
Another factor affecting the interpretation of the variation in the shell viscosity esti‐
mates is the uncertainty, which can be approximated as the random error associated with
separate measurements on the same ELIP. We calculated the random error by considering
the relative difference between the values obtained from separate analysis of the two
phase‐inverted excitation pulses (0° and 180°), i.e. the absolute difference between the two
shell viscosity estimates normalized by the average of the two estimates. The median ran‐
dom error was 40% which is approximately the same as the standard deviation shown in
Figure 6.6A and 6.6B.
Fig. 6.10. Experimentally measured radius‐time curve for a bubble in response to narrow‐band forcing
(f = 3 MHz, dashed lines). Theoretical radius versus time curves for two different values of the damping
coefficient are shown. The solid line represents the simulated damping using (A) the method described in
this paper (κs = 3.0 × 10‐9 kg/s) and (B) the shell damping estimated from bulk acoustic measurements
(κs = 2 × 10‐8 kg/s). The shell elasticity parameter was taken to be χ = 1.55 N/m as reported in [345].
Impulse response measurements and analysis
Evaluation of the damping coefficient based on the impulse response is a new and efficient
approach applied to characterization of lipid‐shelled ELIP in this study. A broadband pulse
was applied to acquire the radius versus time impulse response of an individual ELIP, requir‐
ing only a single exposure of a few microseconds using an ultra‐high‐speed camera. Using
the Brandaris 128, we were able to record the unforced, exponentially decaying amplitude
response from two acoustic impulse excitations, a pulse inversion pair, during each high
speed recording (128 frames). This method provides an efficient approach which enabled
statistical measurements on a large number of individual ELIP. Additionally, data analysis
was straightforward and the simulated transient response of the lipid‐encapsulated mi‐
crobubble accurately tracked the measured radius versus time curves (Figs. 6.7 and 6.8).
112
Impulse response of echogenic liposomes
We also assessed the validity of this technique by comparing the forced response meas‐
ured using an 10‐cycle narrow‐band burst excitation with numerical simulations. An example
is shown in Fig. 6.10 in which simulations using two different shell viscosity values (derived
from the optical method described here or the bulk acoustic method reported in Raymond
et al. [326], respectively) are compared with experimental measurements. Excellent agree‐
ment was found between the simulated and measured radius versus time curves when the
effect of the shell was taken into account using the viscosity estimate obtained in this study.
For the example shown in Fig. 6.10A, the shell viscosity estimate (κs = 3.0×10‐9 kg/s) was
obtained during a previous impulse response exposure of the same particular liposome.
Alternatively, using the population‐averaged shell viscosity obtained in Raymond et al. [326]
(κs = 2.0×10‐8 kg/s) results in an under‐prediction of the amplitude of the response to nar‐
row‐band forcing (Fig. 6.10B). Use of the estimated value obtained for a specific ELIP in this
study allows one to obtain much more precise agreement between the experimental theo‐
retical data using the Marmottant model.
Implications for contrast‐enhanced ultrasound imaging
The size range of ELIP is known to be polydisperse, with particle sizes ranging from tens of
nanometers to several microns [326, 347, 348]. Differences in the characteristics of na‐
noscale versus microscale ELIP vesicles may play a role in the scattering properties of indi‐
vidual ELIP. This study found that smaller ELIP are characterized by a substantially lower
shell viscosity, which may contribute to increase nonlinear scattering, especially at higher
frequencies. Such nonlinear behavior of the smaller populations of ELIP could be exploited
for diagnostic ultrasound applications which utilize higher frequencies, such as intravascular
ultrasound. For example, the nonlinear acoustic signatures of ELIP could be utilized for
improved imaging of pathology in the vasa vasorum, the proliferative small vessels that play
a role in atheroma progression in the cardiovascular system.
Goertz et al. [276] demonstrated that sub‐populations of the lipid‐shelled clinical UCA
Definity® exhibited different frequency‐dependent scattering properties as a function of
size. These authors hypothesized that differences in the encapsulation microstructure for
small and large bubbles may be a key factor influencing the nonlinear scattering at high
frequencies. A subsequent study by Helfield et al. [275] demonstrated that smaller sub‐
populations of lipid‐shelled microbubbles were not only resonant at higher frequencies, but
were also characterized by a substantially lower shell viscosity, suggesting a possible fre‐
quency dependence of the lipid shell properties. It is still not clear whether this effect is due
solely to the size or if frequency‐dependent considerations need to be taken into account in
the dynamical models. Doinikov et al. [362] point out that existing shell models may not
capture the observed radius‐ or frequency‐dependence of the shell material properties, and
that full description of the rheological properties of the shell may require the use of more
113

CHAPTER 6
complex models in order to describe the shear‐thinning behavior. A more detailed explora‐
tion of alternative rheological models could be explored in future studies.
Limitations
Inherent limitations of the optical system resolution result in a bias of the size range of ELIP
selected for analysis in this study. The optical resolution of the ultra‐high‐speed imaging
system was 0.4 μm [52] and the smallest individual ELIP that was measured in this study
was several times larger than the optical resolution limit. The size range of ELIP considered
here focused on measurable particles larger than 0.9 μm in radius only and smaller ELIP
were not considered for investigation.
The proximity of the microbubble to the OptiCell membrane may affect the measured
response of ELIP to acoustic excitation. Previous studies have found that the presence of a
membrane near an oscillating microbubble can affect the resonance frequency and oscilla‐
tion amplitude in response to acoustic forcing [124, 334]. Functionalized UCAs such as ELIP
are being developed for targeted imaging and drug‐delivery applications, and therefore
similar effects are expected to play a role in vivo. The acoustic response of adherent target‐
ed bubbles may be influenced by the ligand distribution and bubble‐wall interaction [70].
Therefore, future work to investigate the damping for adherent targeted agents using this
approach is recommended.
The simulations presented in Figs. 6.7, 6.8 and 6.10 are not unique solutions because
there is more than one free parameter in the Marmottant model, namely the shell elastici‐
ty, χ, and initial surface tension, σ0. We have chosen to assume the phospholipid shell stabi‐
lizes a gas bubble by counteracting the Laplace pressure, so that σ0 = 0, throughout this
paper. Using empirical fits, the values for the data presented in Fig. 6.7 are: χ = 0.1, 0.2 and
1.55 N/m for R0 = 1.5, 2.3 and 3.0 μm, respectively. A radius‐dependent shell elasticity param‐
eter has also been observed and modeled by Chetty et al. [125] and Doinikov et al. [362]. The
measured oscillation amplitudes were not always in the 'elastic' regime range of the Mar‐
mottant model (R/R0 < 1.02). However, the 3.0 μm bubble did behave near this regime
(R/R0 ~ 1.07) and the shell elasticity determined from the optical measurements agreed with
previous measurements [326].
6.6. CONCLUSIONS
In this study a model based on time domain analysis was developed to estimate the shell
viscosity for individual ELIP using optically measured radius versus time curves. The decay
time constant was measured from the unforced response of the ELIP following excitation
by a short acoustic pulse. At low dilatation rates, the shell viscosity is in quantitative agree‐
ment with our previously determined values for ELIP. The viscoelastic shell of ELIP was
found to behave similarly to other lipid‐shelled agents. We demonstrated that qualitative
114

Impulse response of echogenic liposomes
agreement between the measured and simulated radius versus time curves under transient
and steady‐state acoustic forcing is highly dependent on the shell viscosity. The methods
described here can provide accurate estimates of the shell viscosity and damping for indi‐
vidual UCA microbubbles. In contrast to acoustic measurements of a microbubble popula‐
tion with a relatively wide size distribution, this method provides some insight on the varia‐
tion of properties among single particles within a population. This method also enables
efficient measurements on a large number or individual UCA microbubbles because it is
based on the response to a single acoustic impulse excitation.
Acknowledgements
The authors would like to thank Robert Beurskens and Frits Mastik from the Dept. of Bio‐
medical Engineering, Erasmus MC for technical assistance with Brandaris experiments. The
authors would also like to thank the Erasmus Optical Imaging Centre of Erasmus MC for use
of their facilities, and Wiggert A. van Cappellen and Alex Nigg from the Erasmus Optical
Imaging Centre, Department of Pathology, Erasmus MC for technical assistance. JLR was
supported by a fellowship from the Whitaker International Program administered by the
Institute of International Education (IIE). This work was supported in part by the U.S. De‐
partment of Health and Human Services, National Institutes of Health (NIH R01HL74002,
NIH R01HL059586) and NanoNextNL, a micro and nanotechnology consortium of the Gov‐
ernment of the Netherlands and 130 partners.
115

116
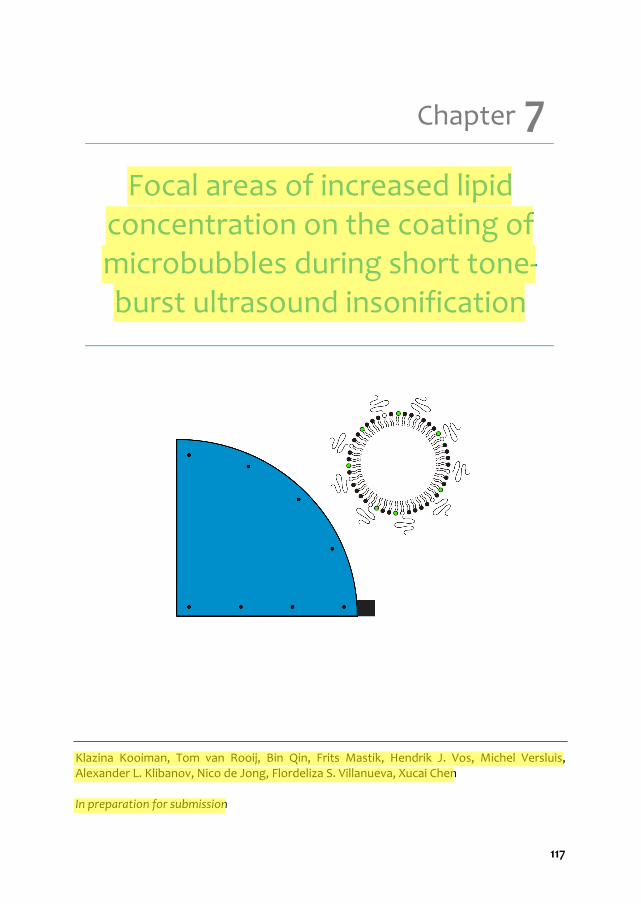
Focal areas of increased lipid
concentration on the coating of microbubbles during short tone‐burst ultrasound insonification
Klazina Kooiman, Tom van Rooij, Bin Qin, Frits Mastik, Hendrik J. Vos, Michel Versluis, Alexander L. Klibanov, Nico de Jong, Flordeliza S. Villanueva, Xucai Chen In preparation for submission
7 Chapter
117
EMBARGO - UNTIL PUBLISHED
EMBARGO - UNTIL PUBLISHED
EMBARGO - UNTIL PUBLISHED
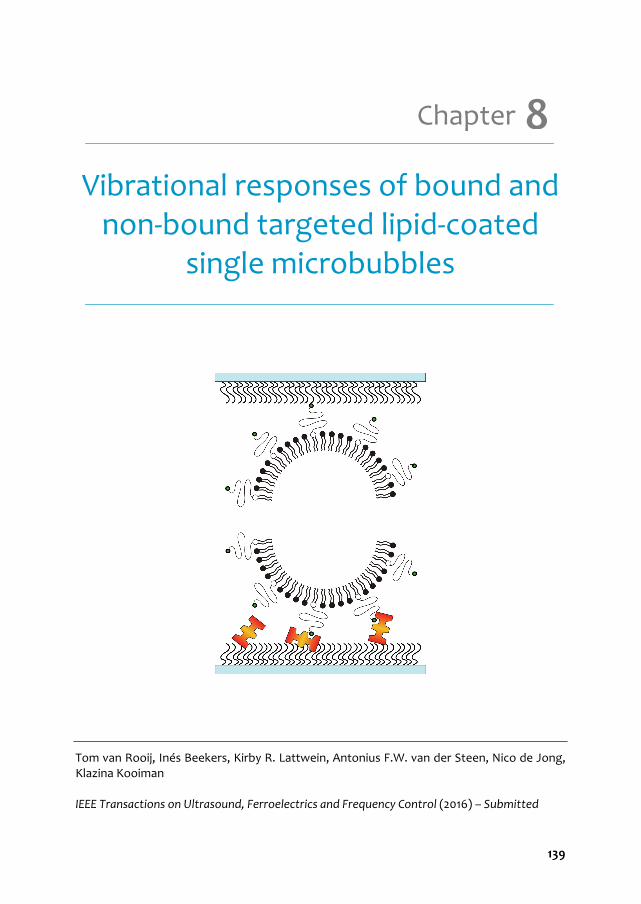
Vibrational responses of bound and non‐bound targeted lipid‐coated
single microbubbles
Tom van Rooij, Inés Beekers, Kirby R. Lattwein, Antonius F.W. van der Steen, Nico de Jong, Klazina Kooiman IEEE Transactions on Ultrasound, Ferroelectrics and Frequency Control (2016) – Submitted
8 Chapter
139
CHAPTER 8
8.1. ABSTRACT
One of the main challenges for ultrasound molecular imaging is acoustically distinguishing
non‐bound microbubbles from those bound to their molecular target. In this in vitro study,
we compared two types of in‐house produced targeted lipid‐coated microbubbles, either
consisting of DPPC or DSPC lipid as the main lipid, using the Brandaris 128 ultra‐high‐speed
camera to determine vibrational response differences between bound and non‐bound bio‐
tinylated microbubbles. In contrast to previous studies that studied vibrational differences
upon binding, we used a covalently bound model biomarker (i.e., streptavidin) rather than
physisorption, to ensure binding of the biomarker to the membrane. The microbubbles
were insonified at frequencies between 1 and 4 MHz at pressures of 50 and 150 kPa. This
study shows lower acoustic stability of bound microbubbles, of which DPPC‐based mi‐
crobubbles deflated most. For DPPC microbubbles with diameters between 2 and 4 μm
driven at 50 kPa, resonance frequencies of bound microbubbles were all higher than
1.8 MHz, whereas those of non‐bound microbubbles were significantly lower. In addition,
the relative radial excursions at resonance were also higher for bound DPPC microbubbles.
These differences did not persist when the pressure was increased to 150 kPa, except for
the acoustic stability which further decreased. No differences in resonance frequencies
were observed between bound and non‐bound DSPC microbubbles. Nonlinear responses in
terms of emissions at the subharmonic and second harmonic frequencies were similar for
bound and non‐bound microbubbles at both pressures. In conclusion, we identified differ‐
ences in vibrational responses of bound DPPC microbubbles with diameters between 2 and
4 μm that distinguish them from non‐bound ones.
8.2. INTRODUCTION
Ultrasound contrast agents that consist of targeted microbubbles are emerging in their
applications for ultrasound molecular imaging [31, 68, 390]. These microbubbles have a
ligand attached to their shell by which they can be targeted to a specific biomarker, for
example αvβ3 that is expressed on the cellular membrane of endothelial cells in neovascula‐
ture [17, 76]. For successful translation of ultrasound molecular imaging to the clinic, two
major problems still need to be tackled: 1) producing microbubbles of the same size that
also behave identical in an ultrasound field, and 2) distinguishing the response of a single
targeted microbubble bound to a specific biomarker from a non‐bound targeted microbub‐
ble. Since microbubbles of the same size can still have different acoustic properties [18, 20,
180, 260, 312], producing monodisperse microbubbles may not necessarily result in mi‐
crobubbles that have, for example, the same resonance frequency. But if it is possible to
determine the acoustic parameters that are specific for bound targeted microbubbles, they
may be distinguished from non‐bound targeted microbubbles based on their acoustic signal.
140
Vibrational responses of bound and non‐bound microbubbles
Several studies investigated the difference in acoustic properties of bound and non‐bound
microbubbles, but these studies reported conflicting results. In the low frequency range (2 ‐
4 MHz) a shift in resonance frequency was found for microbubbles after binding [136, 140],
whereas at 11 MHz and 25 MHz no shift was observed [142]. For the responses at the sub‐
harmonic frequency either a change in frequency [142] or no change in amplitude and fre‐
quency [139] was reported upon binding. In contrast, for the response at the second har‐
monic frequency the results reported by Zhao et al. [139] and Casey et al. [141] were in
agreement with each other: the amplitude increased for bound microbubbles. Finally, both
Zhao et al. and Overvelde et al. found a decrease in the vibrational response at the funda‐
mental frequency for bound microbubbles [136, 139].
All acoustic studies on bound versus non‐bound targeted microbubbles used either phy‐
sisorption as a method to attach a model biomarker to an artificial surface (membrane or
capillary) [136, 139‐141] or had the model biomarker embedded in agarose [142]. Physisorp‐
tion of a model biomarker can result in detachment of the biomarker from the membrane
or capillary which then can cover the whole targeted microbubble, including the area that is
not directly in contact with the membrane. This was reported by Kooiman et al. for the
model biomarker streptavidin that was physisorbed to an Opticell membrane [391]. Func‐
tionalization of lipid‐coated microbubbles with streptavidin changes the properties, such as
elasticity [130, 131, 262] and acoustic stability [262]. Consequently, the comparisons made in
previous studies between bound microbubbles and non‐bound microbubbles are in fact a
comparison between bound lipid‐coated microbubbles covered by streptavidin and non‐
bound lipid‐coated microbubbles, which did not have streptavidin on their shell. In addition,
both physisorption and embedding a model biomarker in agarose are far from the in vivo
situation, where biomarkers are incorporated into the cellular membrane.
We covalently linked a model biomarker to an artificial surface to study the vibrational
responses of single bound targeted microbubbles and non‐bound targeted microbubbles
aiming to find parameters to discriminate them acoustically. Super‐resolution confocal laser
scanning fluorescence microscopy showed that covalent coupling of the model biomarker
streptavidin to a hydrogel prevented the streptavidin to bind to the biotinylated lipid‐shell
of the microbubble outside the binding area [70]. That study compared the lipid distribution
and binding area of two types of targeted lipid‐coated microbubbles that were either coat‐
ed with mainly DPPC (1,2‐dipalmitoyl‐sn‐glycero‐3‐phosphocholine, C16:0) which is the main
shell component of Definity (Lantheus Medical Imaging, North Billerica, MA, USA) or mainly
DSPC (1,2‐distearoyl‐sn‐glycero‐3‐phosphocholine, C18:0) which is the main lipid component
of SonoVue, Lumason, and BR14 (Bracco Imaging S.p.A., Milan, Italy) [7‐9, 70, 260, 318]. It
was shown that the lipid distribution was more homogeneous for DPPC‐based microbub‐
bles than for DSPC‐based microbubbles and that the binding area for DPPC‐based mi‐
crobubbles was significantly larger than for DSPC‐based microbubbles [70]. We previously
determined the acoustic properties of these DPPC and DSPC‐based microbubbles in a set‐up
141
CHAPTER 8
where the microbubbles were floating against an OptiCell wall (non‐bound) [260] and hy‐
pothesized that the difference in ligand‐distribution and binding area could alter the acous‐
tic response after adherence of the microbubble to its molecular target. In the present
study we investigated the vibrational response of in‐house produced targeted DPPC‐based
and DSPC‐based microbubbles using the Brandaris 128 ultra‐high‐speed optical camera [52]
when they had bound to a streptavidin‐coated hydrogel and compared their responses to
those of non‐bound microbubbles floating against the hydrogel. We aimed to identify dif‐
ferences in vibrational responses that may be used to discriminate bound from non‐bound
microbubbles.
8.3. MATERIALS AND METHODS
Microbubble preparation
Biotinylated lipid‐coated microbubbles with a C4F10 gas core (F2 Chemicals Ltd, Preston, UK)
were made as previously described [70, 129] by sonication for 1 min. The coating was com‐
posed of 59.4 mol% DSPC (P6517, Sigma‐Aldrich, Zwijndrecht, the Netherlands) or DPPC
(850355, Avanti Polar Lipids, Alabaster, AL, USA), 35.7 mol% polyoxyethylene‐40‐stearate
(PEG‐40 stearate, P3440, Sigma‐Aldrich), 4.1 mol% 1,2‐distearoyl‐sn‐glycero‐3‐
phosphoethanolamine‐N‐[carboxy(polyethylene glycol)‐2000] (DSPE‐PEG(2000), 880125,
Avanti Polar Lipids); and 0.8 mol% 1,2‐distearoyl‐sn‐glycero‐3‐phosphoethanolamine‐N‐
[biotinyl(polyethylene glycol)‐2000] (DSPE‐PEG(2000)‐biotin, 880129, Avanti Polar Lipids).
A 25 μm thick polyester membrane was mounted on a custom‐made rectangular polyvi‐
nylchloride holder (same size as a microscope objective glass) and was custom coated with
a 1‐2 μm thick polycarboxylate hydrogel (XanTec bioanalytics GmbH, Düsseldorf, Germany).
For the bound targeted microbubbles, the hydrogel was activated and streptavidin (S4762,
Sigma‐Aldrich) was subsequently covalently attached to the hydrogel using the amine cou‐
pling kit (K AN‐50, XanTec bioanalytics GmbH) according to the instructions of the manufac‐
turer as previously described [70]. Briefly, streptavidin was dissolved in acetate buffer
(2 mM, pH 5.4) (1 mg/mL). After desalting the streptavidin by use of a PD‐10 desalting col‐
umn (GE Healthcare Bio‐Sciences), the concentration was determined spectrophotometri‐
cally at 570 nm using a PierceTM BCA Protein Assay kit (Thermo Scientific) and Thermo
Multiskan EX. Three polyester membranes were placed in a 5‐Slidemailer (Heathrow Scien‐
tific, Northgate, UK) with 18 mL of 1 M NaCl + 0.1 M NaB (pH 10) elution buffer (K AN‐50,
XanTec bioanalytics GmbH), followed by an incubation with 18 mL of 1.6 % (w/v) EDC∙HCL
(K AN‐50, XanTec bioanalytics GmbH) in activation NHS/MES buffer (K AN‐50, XanTec bioan‐
alytics GmbH), and 18 mL of 33 μg/mL desalted streptavidin in 2 mM acetate buffer at
pH 5.2‐5.4. Finally, 18 mL of 1 M ethanolamine hydrochloride (pH 8.5) quenching buffer
(K AN‐50, XanTec bioanalytics GmbH) was used to terminate the reaction. The targeted
microbubbles were allowed to adhere to the streptavidin‐coated membrane in air‐
142

Vibrational responses of bound and non‐bound microbubbles
equilibrated phosphate buffered saline (PBS) containing calcium and magnesium (DPBS,
14080, Invitrogen, Thermo Fischer Scientific, Landsmeer, the Netherlands) by flotation for
5 min. Then, the membrane was gently washed with air‐equilibrated PBS containing calcium
and magnesium three times using a 3 mL plastic Pasteur pipet. For the non‐bound targeted
microbubbles the hydrogel was treated in the same way, except for the addition of strep‐
tavidin. The targeted microbubbles were added below the hydrogel‐coated polyester mem‐
brane of the custom‐made holder and floated up due to buoyancy. The hydrogels with the
non‐bound targeted microbubbles and bound targeted microbubbles were orientated in the
set‐up as shown in Fig. 8.1.
Fig. 8.1. Configuration and composition of non‐bound targeted mi‐
crobubbles (top) floating against a hydrogel and targeted microbub‐
bles bound to this hydrogel via streptavidin in the experimental set up
(not to scale).
143
CHAPTER 8
Microbubble spectroscopy
The vibrational responses of the bound and non‐bound targeted microbubbles were cap‐
tured using the Brandaris 128 ultra‐high‐speed camera operated at ~15 million frames per
second [52]. Single microbubbles were investigated in ROI mode [320] using the microbub‐
ble spectroscopy technique [20] in combination with the exact same set‐up as in our previ‐
ous study [260], except for a higher magnification microscope objective (60×, NA = 0.9,
Olympus, Tokyo, Japan). Briefly, a broadband single element polyvinyl difluoride (PVDF)
transducer (25 mm focal distance, f‐number 1.1, center frequency 5 MHz, PA275, Precision
Acoustics Ltd, Dorchester, UK) transmitted a Gaussian tapered 8‐cycle sine wave burst at
transmit frequencies swept from 1 to 4 MHz (increment steps of 200 kHz) at a peak‐
negative pressure (PA) of 50 or 150 kPa at the focus. The pressures were calibrated with two
calibrated PVDF needle hydrophones in a separate measurement beforehand (0.2‐mm di‐
ameter PA2030 and 1‐mm‐diameter PA1875, Precision Acoustics). The optic focus was
aligned with the acoustic focus, to ensure that the microbubble received the intended pres‐
sure. The ultrasound was triggered on the second recording of each microbubble to obtain
the initial resting diameter and the noise level with our contour tracking algorithm in the
first recording. The experiments were conducted at room temperature and the sample was
submersed in air‐equilibrated PBS containing calcium and magnesium. All microbubbles
were exposed to ultrasound within 2 h after addition to the custom‐made holder.
Data analysis
Diameter‐time (D‐t) curves were obtained using custom‐designed image analysis software
[20] that determines the vibrational responses as described elsewhere [260]. Briefly, the
acoustic stability of the microbubbles was quantified as the difference between the mean
diameter of the microbubble in the initial D‐t curve (D0) and the final D‐t curve (Dend). Next,
the asymmetry of the D‐t curves was measured as the ratio E/C between the relative expan‐
sion E, defined as (Dmax ‐ D0) / D0, and the relative compression C, defined as (D0 – Dmin) / D0, of
the microbubble. Where Dmax is the maximum diameter, Dmin the minimum diameter in the D‐
t curve, and D0 the resting diameter before vibration. The E/C ratios were used to classify the
asymmetry as: compression‐only behavior (E/C < 0.5); normal excursion (0.5 ≤ E/C ≤ 2); or
expansion‐only behavior (E/C > 2) [321].
Using the fast Fourier transformation (FFT) the frequency content of the D‐t curves was
analyzed in terms of the amplitude at the transmit frequency (fT). These amplitudes were
fitted to a resonance curve of a linear oscillator by a least‐mean‐squares method [20, 260] to
determine the resonance frequency (fres) of the microbubble. At fres, the diameter of the
microbubble is referred to as Dres. The maximum relative radial excursions (i.e. at fres) were
defined as the maximum amplitude of the FFT divided by the corresponding resting diame‐
ter of the microbubble [260]. The same approach was used to determine the subharmonic
resonance frequencies (fsub) and the second harmonic resonance frequencies and the corre‐
144
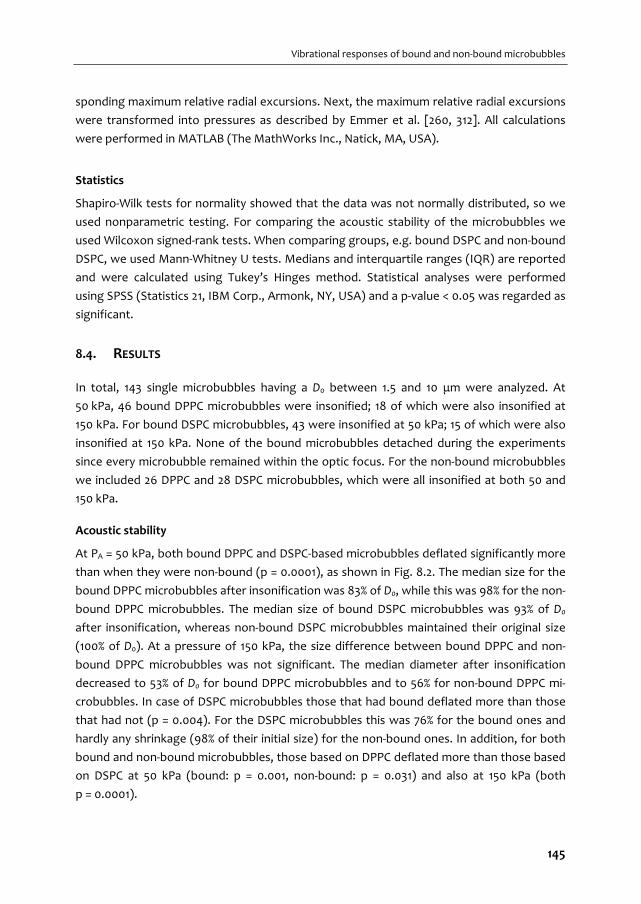
Vibrational responses of bound and non‐bound microbubbles
sponding maximum relative radial excursions. Next, the maximum relative radial excursions
were transformed into pressures as described by Emmer et al. [260, 312]. All calculations
were performed in MATLAB (The MathWorks Inc., Natick, MA, USA).
Statistics
Shapiro‐Wilk tests for normality showed that the data was not normally distributed, so we
used nonparametric testing. For comparing the acoustic stability of the microbubbles we
used Wilcoxon signed‐rank tests. When comparing groups, e.g. bound DSPC and non‐bound
DSPC, we used Mann‐Whitney U tests. Medians and interquartile ranges (IQR) are reported
and were calculated using Tukey’s Hinges method. Statistical analyses were performed
using SPSS (Statistics 21, IBM Corp., Armonk, NY, USA) and a p‐value < 0.05 was regarded as
significant.
8.4. RESULTS
In total, 143 single microbubbles having a D0 between 1.5 and 10 μm were analyzed. At
50 kPa, 46 bound DPPC microbubbles were insonified; 18 of which were also insonified at
150 kPa. For bound DSPC microbubbles, 43 were insonified at 50 kPa; 15 of which were also
insonified at 150 kPa. None of the bound microbubbles detached during the experiments
since every microbubble remained within the optic focus. For the non‐bound microbubbles
we included 26 DPPC and 28 DSPC microbubbles, which were all insonified at both 50 and
150 kPa.
Acoustic stability
At PA = 50 kPa, both bound DPPC and DSPC‐based microbubbles deflated significantly more
than when they were non‐bound (p = 0.0001), as shown in Fig. 8.2. The median size for the
bound DPPC microbubbles after insonification was 83% of D0, while this was 98% for the non‐
bound DPPC microbubbles. The median size of bound DSPC microbubbles was 93% of D0
after insonification, whereas non‐bound DSPC microbubbles maintained their original size
(100% of D0). At a pressure of 150 kPa, the size difference between bound DPPC and non‐
bound DPPC microbubbles was not significant. The median diameter after insonification
decreased to 53% of D0 for bound DPPC microbubbles and to 56% for non‐bound DPPC mi‐
crobubbles. In case of DSPC microbubbles those that had bound deflated more than those
that had not (p = 0.004). For the DSPC microbubbles this was 76% for the bound ones and
hardly any shrinkage (98% of their initial size) for the non‐bound ones. In addition, for both
bound and non‐bound microbubbles, those based on DPPC deflated more than those based
on DSPC at 50 kPa (bound: p = 0.001, non‐bound: p = 0.031) and also at 150 kPa (both
p = 0.0001).
145
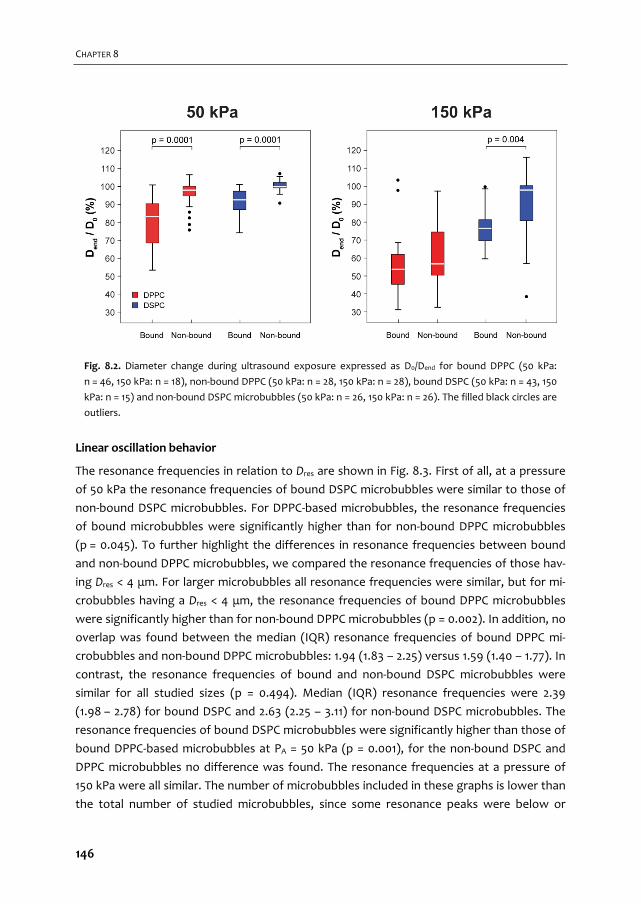
CHAPTER 8
Linear oscillation behavior
The resonance frequencies in relation to Dres are shown in Fig. 8.3. First of all, at a pressure
of 50 kPa the resonance frequencies of bound DSPC microbubbles were similar to those of
non‐bound DSPC microbubbles. For DPPC‐based microbubbles, the resonance frequencies
of bound microbubbles were significantly higher than for non‐bound DPPC microbubbles
(p = 0.045). To further highlight the differences in resonance frequencies between bound
and non‐bound DPPC microbubbles, we compared the resonance frequencies of those hav‐
ing Dres < 4 μm. For larger microbubbles all resonance frequencies were similar, but for mi‐
crobubbles having a Dres < 4 μm, the resonance frequencies of bound DPPC microbubbles
were significantly higher than for non‐bound DPPC microbubbles (p = 0.002). In addition, no
overlap was found between the median (IQR) resonance frequencies of bound DPPC mi‐
crobubbles and non‐bound DPPC microbubbles: 1.94 (1.83 – 2.25) versus 1.59 (1.40 – 1.77). In
contrast, the resonance frequencies of bound and non‐bound DSPC microbubbles were
similar for all studied sizes (p = 0.494). Median (IQR) resonance frequencies were 2.39
(1.98 – 2.78) for bound DSPC and 2.63 (2.25 – 3.11) for non‐bound DSPC microbubbles. The
resonance frequencies of bound DSPC microbubbles were significantly higher than those of
bound DPPC‐based microbubbles at PA = 50 kPa (p = 0.001), for the non‐bound DSPC and
DPPC microbubbles no difference was found. The resonance frequencies at a pressure of
150 kPa were all similar. The number of microbubbles included in these graphs is lower than
the total number of studied microbubbles, since some resonance peaks were below or
Fig. 8.2. Diameter change during ultrasound exposure expressed as D0/Dend for bound DPPC (50 kPa:
n = 46, 150 kPa: n = 18), non‐bound DPPC (50 kPa: n = 28, 150 kPa: n = 28), bound DSPC (50 kPa: n = 43, 150
kPa: n = 15) and non‐bound DSPC microbubbles (50 kPa: n = 26, 150 kPa: n = 26). The filled black circles are
outliers.
146

Vibrational responses of bound and non‐bound microbubbles
above the measuring range (< 1 MHz or > 4 MHz); the resonance frequency could therefore
not be determined.
For bound DPPC microbubbles, the median maximum relative radial excursions (median
(IQR) of 0.14 (0.11 – 0.18)) at the resonance frequency at a pressure of 50 kPa was signifi‐
cantly higher than for the non‐bound DPPC microbubbles (0.09 (0.06 – 0.13), p = 0.002,
Fig. 8.4,). Although the median maximum relative radial excursions of bound DSPC mi‐
crobubbles 0.11 (0.08 – 0.12) were not significantly different from non‐bound DSPC mi‐
crobubbles 0.05 (0.03 – 0.13, p = 0.157) over the whole resonance frequency range, the
maximum relative radial excursions for bound DSPC microbubbles were significantly higher
for resonance frequencies > 2 MHz (bound: 0.11 (0.08 – 0.12), non‐bound: 0.03 (0.02 – 0.04),
p = 0.001). In addition, the maximum relative radial excursions of bound DSPC microbubbles
were significantly lower than of bound DPPC microbubbles (p = 0.0001), but similar for the
non‐bound DSPC and DPPC microbubbles. At a driving pressure of 150 kPa the median max‐
imum relative radial excursions of bound and non‐bound DPPC microbubbles at fres were
similar, but significantly higher for bound DSPC than non‐bound DSPC microbubbles
(p = 0.001). The median (IQR) of the maximum relative radial excursions was similar for the
bound microbubbles: 0.28 (0.22 – 0.33) for DPPC and 0.28 (0.23 – 0.35) for DSPC‐based mi‐
crobubbles (Fig. 8.4). For non‐bound microbubbles the maximum relative radial excursions
were significantly higher (p = 0.03) for DPPC microbubbles than for DSPC microbubbles:
0.25 (0.18 – 0.28) versus 0.11 (0.09 – 0.23).
Fig. 8.3. Resonance frequencies (fres) of bound DPPC (filled red circles), non‐bound DPPC (red crosses),
bound DSPC (blue open circles), and non‐bound DSPC (blue crosses) microbubbles plotted versus the
diameter at resonance (Dres) at PA = 50 kPa (top panel) and PA = 150 kPa (bottom panel).
147
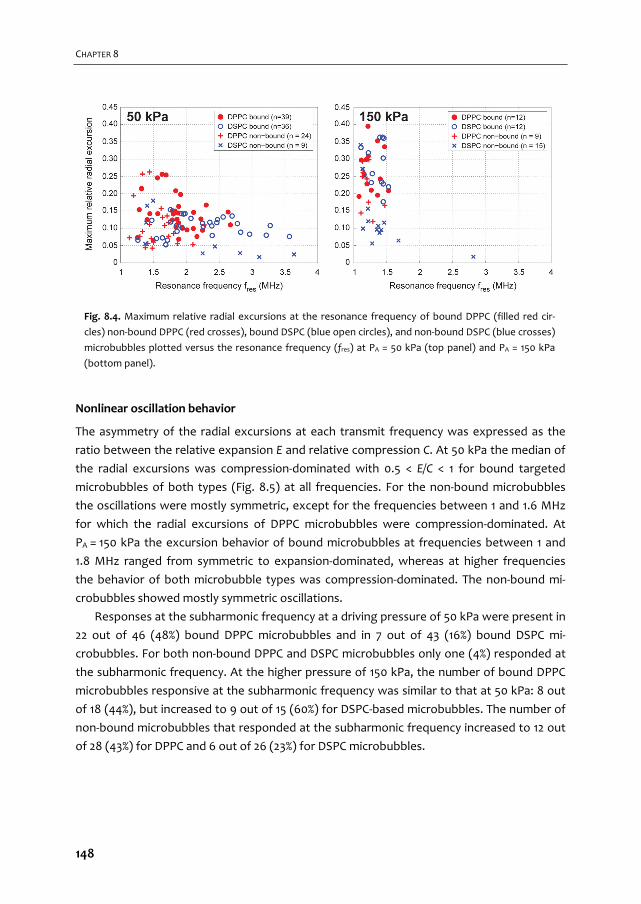
CHAPTER 8
Nonlinear oscillation behavior
The asymmetry of the radial excursions at each transmit frequency was expressed as the
ratio between the relative expansion E and relative compression C. At 50 kPa the median of
the radial excursions was compression‐dominated with 0.5 < E/C < 1 for bound targeted
microbubbles of both types (Fig. 8.5) at all frequencies. For the non‐bound microbubbles
the oscillations were mostly symmetric, except for the frequencies between 1 and 1.6 MHz
for which the radial excursions of DPPC microbubbles were compression‐dominated. At
PA = 150 kPa the excursion behavior of bound microbubbles at frequencies between 1 and
1.8 MHz ranged from symmetric to expansion‐dominated, whereas at higher frequencies
the behavior of both microbubble types was compression‐dominated. The non‐bound mi‐
crobubbles showed mostly symmetric oscillations.
Responses at the subharmonic frequency at a driving pressure of 50 kPa were present in
22 out of 46 (48%) bound DPPC microbubbles and in 7 out of 43 (16%) bound DSPC mi‐
crobubbles. For both non‐bound DPPC and DSPC microbubbles only one (4%) responded at
the subharmonic frequency. At the higher pressure of 150 kPa, the number of bound DPPC
microbubbles responsive at the subharmonic frequency was similar to that at 50 kPa: 8 out
of 18 (44%), but increased to 9 out of 15 (60%) for DSPC‐based microbubbles. The number of
non‐bound microbubbles that responded at the subharmonic frequency increased to 12 out
of 28 (43%) for DPPC and 6 out of 26 (23%) for DSPC microbubbles.
Fig. 8.4. Maximum relative radial excursions at the resonance frequency of bound DPPC (filled red cir‐
cles) non‐bound DPPC (red crosses), bound DSPC (blue open circles), and non‐bound DSPC (blue crosses)
microbubbles plotted versus the resonance frequency (fres) at PA = 50 kPa (top panel) and PA = 150 kPa
(bottom panel).
148
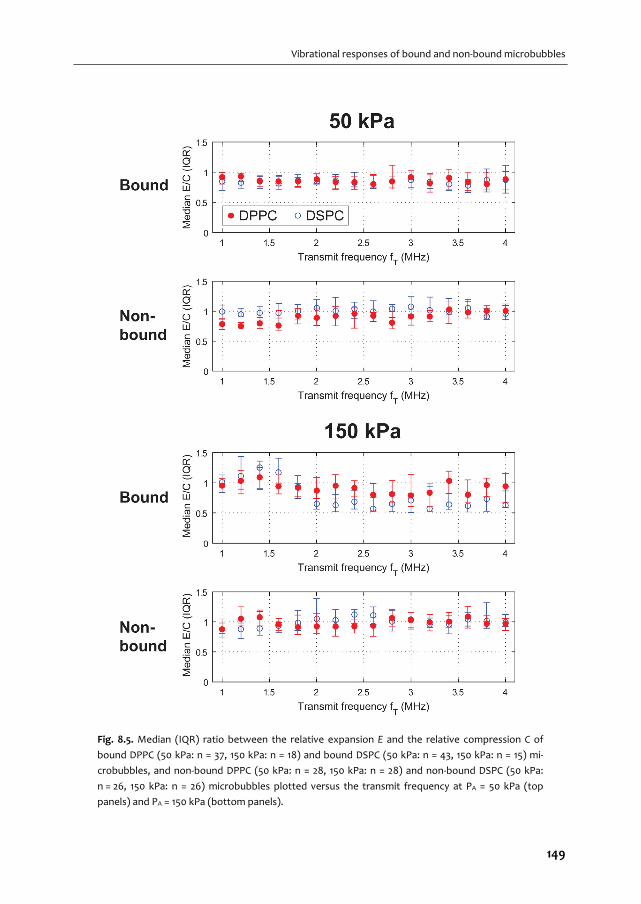
Vibrational responses of bound and non‐bound microbubbles
Fig. 8.5. Median (IQR) ratio between the relative expansion E and the relative compression C of
bound DPPC (50 kPa: n = 37, 150 kPa: n = 18) and bound DSPC (50 kPa: n = 43, 150 kPa: n = 15) mi‐
crobubbles, and non‐bound DPPC (50 kPa: n = 28, 150 kPa: n = 28) and non‐bound DSPC (50 kPa:
n = 26, 150 kPa: n = 26) microbubbles plotted versus the transmit frequency at PA = 50 kPa (top
panels) and PA = 150 kPa (bottom panels).
149

CHAPTER 8
Although quite some microbubbles had a response at the subharmonic frequency, only
for the ones shown in Fig. 8.6 a subharmonic resonance curve could be determined. Rea‐
sons for not being able to determine the subharmonic resonance curve were not enough
points for a fit or the peak was below or above the measuring range. Emitted subharmonic
pressures were similar irrespective of binding and the type of lipid coating at each acoustic
pressure (Fig. 8.6). At 50 kPa, of the 17 bound DPPC microbubbles shown in Fig. 8.6, nine
had a response at T2R (transmit at twice the resonance frequency with fsub = fres [148, 323])
and four at TR (transmit at the resonance frequency, fsub = ½fres [148, 180]). Of the seven
bound DSPC microbubbles, three had a clear response at T2R and none had a response at
TR. At 150 kPa, of the eight bound DPPC microbubbles seven had a response at T2R and one
at TR. Of the seven bound DSPC microbubbles four had a response at T2R and none at TR. In
the case of non‐bound microbubbles at 50 kPa the only microbubble responsive at fsub was a
DSPC microbubble with a response at T2R. At 150 kPa, one out of the ten DPPC microbub‐
bles had a response at T2R and two out of ten at TR. For the four non‐bound DSPC mi‐
crobubbles two had a response at T2R and none at TR. For the other microbubbles respond‐
ing at fsub, the relation between TR or T2R could not be determined; either because no clear
relation was found between the subharmonic and fundamental frequency, or because the
fundamental frequency had not been determined since the peak was located outside the
measuring range. We assumed a detection limit of 1 Pa (black dashed line in Fig. 8.6) for
diagnostic ultrasound scanners, achievable with a typical high‐quality transducer for har‐
Fig. 8.6. Absolute pressures emitted at the subharmonic frequency of bound
DPPC (50 kPa: n = 17, 150 kPa: n = 8), bound DSPC microbubbles (50 kPa: n = 7,
150 kPa: n = 7), non‐bound DPPC (50 kPa: n = 0, 150 kPa: n = 10), and non‐bound
DSPC microbubbles (50 kPa: n = 1, 150 kPa: n = 4).
150
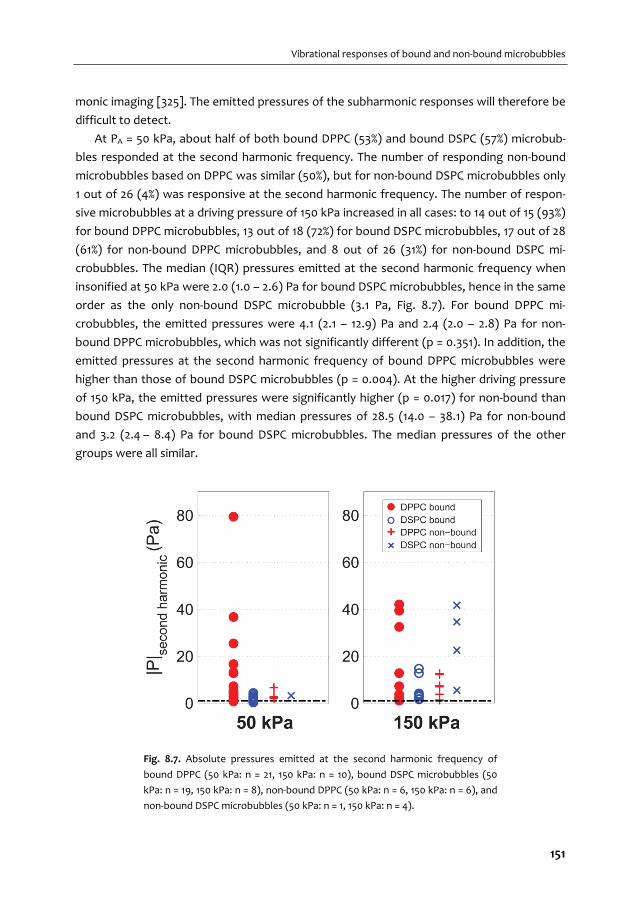
Vibrational responses of bound and non‐bound microbubbles
monic imaging [325]. The emitted pressures of the subharmonic responses will therefore be
difficult to detect.
At PA = 50 kPa, about half of both bound DPPC (53%) and bound DSPC (57%) microbub‐
bles responded at the second harmonic frequency. The number of responding non‐bound
microbubbles based on DPPC was similar (50%), but for non‐bound DSPC microbubbles only
1 out of 26 (4%) was responsive at the second harmonic frequency. The number of respon‐
sive microbubbles at a driving pressure of 150 kPa increased in all cases: to 14 out of 15 (93%)
for bound DPPC microbubbles, 13 out of 18 (72%) for bound DSPC microbubbles, 17 out of 28
(61%) for non‐bound DPPC microbubbles, and 8 out of 26 (31%) for non‐bound DSPC mi‐
crobubbles. The median (IQR) pressures emitted at the second harmonic frequency when
insonified at 50 kPa were 2.0 (1.0 – 2.6) Pa for bound DSPC microbubbles, hence in the same
order as the only non‐bound DSPC microbubble (3.1 Pa, Fig. 8.7). For bound DPPC mi‐
crobubbles, the emitted pressures were 4.1 (2.1 – 12.9) Pa and 2.4 (2.0 – 2.8) Pa for non‐
bound DPPC microbubbles, which was not significantly different (p = 0.351). In addition, the
emitted pressures at the second harmonic frequency of bound DPPC microbubbles were
higher than those of bound DSPC microbubbles (p = 0.004). At the higher driving pressure
of 150 kPa, the emitted pressures were significantly higher (p = 0.017) for non‐bound than
bound DSPC microbubbles, with median pressures of 28.5 (14.0 – 38.1) Pa for non‐bound
and 3.2 (2.4 – 8.4) Pa for bound DSPC microbubbles. The median pressures of the other
groups were all similar.
Fig. 8.7. Absolute pressures emitted at the second harmonic frequency of
bound DPPC (50 kPa: n = 21, 150 kPa: n = 10), bound DSPC microbubbles (50
kPa: n = 19, 150 kPa: n = 8), non‐bound DPPC (50 kPa: n = 6, 150 kPa: n = 6), and
non‐bound DSPC microbubbles (50 kPa: n = 1, 150 kPa: n = 4).
151
CHAPTER 8
8.5. DISCUSSION
This study investigated vibrational responses of bound and non‐bound microbubbles to
identify differences to acoustically discriminate them. For DPPC‐based microbubbles with
diameters between 2 and 4 μm the resonance frequencies and relative radial excursions
were higher than for non‐bound DPPC‐based microbubbles (PA = 50 kPa). In contrast, at an
insonifying pressure of 150 kPa the relative radial excursions for bound and non‐bound
DPPC‐based microbubbles were similar. Interestingly, at this higher pressure the radial ex‐
cursions for bound DSPC‐based microbubbles were higher than for non‐bound DSPC mi‐
crobubbles, whereas these were similar at 50 kPa. We also found compression‐dominated
behavior and a higher number of responsive microbubbles at the second harmonic frequen‐
cy for bound microbubbles, irrespective of the main coating lipid.
Acoustic stability
Bound microbubbles were acoustically less stable than non‐bound microbubbles, irrespec‐
tive of their main coating component. Further we found that the acoustic stability for DPPC‐
based microbubbles was lower than that for DSPC‐based microbubbles. This was previously
attributed to the shorter acyl chain length of the DPPC lipid than that of the DSPC lipid
[260]. This shorter chain results in lower intermolecular van der Waals forces between the
different lipids and results in less attraction and cohesion of the microbubble shell [49, 260].
The maximum relative radial excursions of bound microbubbles were higher at the reso‐
nance frequency than those of non‐bound microbubbles (for DPPC at 50 kPa and DSPC at
150 kPa). This means that the radial excursions after binding were more prominent, which
resulted in more shrinkage and therefore a lower acoustic stability. Others have reported
lower radial excursions after binding for DSPC‐based microbubbles [136, 139], but those
studies had not covalently linked their model biomarker to their membrane. As a result, the
biomarker that attached to the microbubble shell increased the stiffness [262] and there‐
fore limits the radial oscillations.
Some non‐bound DSPC microbubbles appeared to increase in diameter after insonifica‐
tion at 150 kPa. The microbubbles in which this was observed were all relatively small
(< 2.5 μm). This apparent increase may be due to small changes in optical focus due to radia‐
tion forces, in combination with the error in the tracking algorithm which was previously
estimated to be approximately 10% [20].
Linear oscillation behavior
The resonance frequencies for bound DPPC microbubbles were higher than for non‐bound
DPPC microbubbles at a pressure of 50 kPa for microbubbles with diameters between 2
and 4 μm at resonance. Based on the IQRs, the resonance frequencies of most bound DPPC
microbubbles of this size were higher than 1.8 MHz, whereas those of non‐bound DPPC
152
Vibrational responses of bound and non‐bound microbubbles
microbubbles were lower than 1.8 MHz. In terms of shell properties, a higher resonance
frequency is related to an increase in elasticity (i.e., a stiffer shell) by the Marmottant model
[19]. It is not likely that the elasticity changes upon binding, but the apparent stiffness may
increase due to binding of the microbubble to the biomarker. We may not have found a
change in apparent stiffness for DSPC‐based microbubbles, because their surface binding
area is smaller than for DPPC‐based microbubbles as previously determined by our group
for the same type of microbubbles and same streptavidin biomarker [70]. Next, the initial
elasticity of DSPC microbubbles is already higher than for DPPC microbubbles [260], and it
has been shown that the resonance frequencies for DSPC microbubbles did not change
after conjugating the relatively heavy molecule streptavidin to the lipid shell, whereas for
DPPC microbubbles the resonance frequencies increased [262]. In addition, the resonance
frequency exponentially decreases for increasing microbubble size [274]. As a consequence,
the difference in resonance frequencies for microbubbles with diameters between 2 and
4 μm is larger than for microbubbles with diameters between 5 and 7 μm [260]. An increase
in resonance frequency for bound microbubbles will therefore be more pronounced for
smaller than for larger microbubbles. This may explain why the apparent increase in stiff‐
ness was only present for bound DPPC microbubbles having diameters between 2 and 4,
and not for DSPC microbubbles or larger DPPC microbubbles. At 150 kPa, however, all reso‐
nance frequencies appeared the same. The microbubble oscillations at this pressure start of
very violently in the first insonifications between 1 and 1.5 MHz, thereby largely decreasing
the microbubble size and shifting its original resonance frequency towards higher frequen‐
cies. Since the mechanical index (MI) was ~2× lower for the insonifications at the end of the
frequency sweep, the resulting relative radial excursions were lower at the new resonant
microbubble size. Therefore, the oscillations of the first insonifcations dominated the reso‐
nance behavior, leading to an apparent resonance frequency between 1 and 1.5 MHz before
shrinkage.
Others have also reported differences in resonance frequencies between bound and non‐
bound microbubbles. Casey et al. [141] reported an increase in resonance frequency for their
bound in‐house produced biotinylated microbubbles, but for DSPC microbubbles (C3F8 gas
core and same components as our DSPC‐based microbubbles, but unknown ratios) instead
of for DPPC‐based microbubbles as we report here. Overvelde et al. [136] found 30% lower
frequencies of maximum response for targeted BG‐6438 microbubbles bound to an OptiCell
wall than for non‐targeted BG‐6437 microbubbles floating against the wall at pressures <
40 kPa (both bubble types are from Bracco Research S.A., Geneva, Switzerland). The BG‐
6438 microbubbles were targeted to FITC‐BSA using an anti‐FITC antibody attached to the
microbubble shell using streptavidin‐biotin bridging. The main limitation of both studies is
the method of attaching the model biomarker streptavidin to the cellulose tube [141] or
FITC‐BSA to the OptiCell wall [136], namely by physisorption. As mentioned before, this
physisorbed biomarker is likely to bind to the microbubble shell creating a lipid‐coated mi‐
153

CHAPTER 8
crobubble covered with the model biomarker. These very large and heavy complexes are
expected to behave completely different in an ultrasound field than a bare lipid‐coated
targeted microbubble, as has been shown for microbubbles that were functionalized with
streptavidin depending on the initial stiffness of the microbubble coating [262]. In addition
to this, Overvelde et al. [136] did not block the OptiCells to prevent unspecific binding in
their experiments that compared free BG‐6437 microbubbles and BG‐6437 microbubbles
close to the wall: the latter may have actually bound to the wall. Next to that, the BG‐6437
microbubbles did not have anti‐FITC antibody attached to their shell, which is not a fair
comparison between microbubbles that have bound to the wall and that are floating
against the wall. In our present study the covalent coupling of streptavidin to the hydrogel,
and thus the membrane, was established and it was confirmed that no streptavidin was
present on the microbubble shell [70].
Nonlinear oscillation behavior
For nonlinear contrast‐enhanced ultrasound imaging the responses at the subharmonic and
second harmonic frequencies are usually exploited [161]. At 50 kPa more bound than non‐
bound microbubbles responded at the subharmonic frequency, for both the DPPC and
DSPC‐based coatings. At 150 kPa more microbubbles—both bound and non‐bound—were
responsive at the subharmonic frequency, but the emitted pressures were close to or below
the assumed detection limit for clinical use of 1 Pa [325]. The subharmonic emissions seem
therefore of limited use for nonlinear contrast‐enhanced imaging and discrimination of
bound from non‐bound microbubble based on our experimental conditions.
We found similar amplitudes at the subharmonic frequency for bound and non‐bound
microbubbles, in line with findings of Zhao et al. [139] for microbubbles with a coating of
82 mol% DSPC, 9 mol% DSPEPEG(2000), and 9 mol% DSPE‐PEG(2000)‐biotin [392]. Helfield et
al. [142] reported similar amounts of bound and non‐bound Target‐Ready MicroMarker
microbubbles that were responsive at the subharmonic frequency, whereas we found more
bound microbubbles that responded. The different composition and gas core of Target‐
Ready MicroMarker likely contributed to these differences. As suggested by
Helfield et al. [142], the membrane material could have frequency‐dependent effects and
their results might be biased due to aggregation of microbubbles that may have changed
the echogenicity [393]. We previously performed the exact same experiments as described
here for non‐bound microbubbles in an OptiCell [394]. Indeed, a membrane dependent
effect was observed, but was not found to be frequency related. The maximum relative
radial excursions of non‐bound microbubbles in an OptiCell (both DPPC and DSPC) were 2‐
2.5 times higher than for non‐bound microbubbles floating against the hydrogel. Because
the microbubbles may be partly embedded in the polymer‐based hydrogel, this can damp
the microbubble oscillations and therefore result in lower maximum relative radial excur‐
sions.
154
Vibrational responses of bound and non‐bound microbubbles
Another difference between our study and that of Helfield et al. [142], is that they coat‐
ed their cellulose tube with streptavidin using physisorption, with the disadvantage of
streptavidin covering the microbubble shell, which may have influenced the amplitude of
the subharmonic signal. Indeed, their acoustic measurements showed a 20% higher subhar‐
monic signal of Target‐Ready MicroMarker, a streptavidin‐functionalized lipid‐coated mi‐
crobubble, when bound to a biotinylated agarose phantom. The difference between the
results of Helfield et al. and our results presented in this study might also be due to the used
techniques: ultra‐high‐speed optical imaging versus acoustic measurements. In our set‐up
we were only able to image the top‐view of the microbubble oscillations, whereas acoustic
measurements can detect out‐of‐plane signals as well. If a larger portion of the subharmon‐
ic excursions were generated in the perpendicular plane, we might have missed those vibra‐
tions with our set‐up.
Numerical simulations have shown that the subharmonic signal is optimal when the mi‐
crobubble is insonified at T2R [395]. Experimental validation showed that the threshold for
generating TR subharmonic responses is higher than that for T2R subharmonic responses in
lipid‐coated microbubbles [148, 181]. The absence of DSPC responders at TR may suggest
that the threshold for generating TR subharmonic responses is lower for DPPC microbub‐
bles than for DSPC microbubbles, irrespective of them being bound or not. On the other
hand, due to the applied frequency range and studied microbubble sizes the majority of the
resonance frequencies were between 1.5 and 3.5 MHz, which limits the possibility to insoni‐
fy microbubbles at T2R within the frequency range we applied.
The higher second harmonic amplitudes we measured for non‐bound DSPC‐based mi‐
crobubbles at 150 kPa are in contrast with results reported by others [140, 141]. The study by
Casey et al. [141] used microbubbles similar to our DSPC microbubbles, but with a C3F8 core
and attachment to a capillary wall using the physisorbed streptavidin as biomarker
(fT = 2 MHz, PA = 90 kPa). The study by Zhao et al. [140] also used DSPC‐based microbubbles,
with a set‐up and parameters comparable to those of Casey et al. [141]. Both studies used
somewhat lower pressures, but may also have effectively studied bound targeted DSPC‐
based microbubbles coated with a streptavidin layer, which may explain the different find‐
ings. In our study, the emitted pressure amplitudes of bound microbubbles were similar or
lower than for non‐bound microbubbles and acoustic discrimination based on the second
harmonic pressures does therefore not seem feasible.
DSPC vs DPPC for ultrasound molecular imaging applications
The differences between bound targeted DPPC and DSPC‐based microbubbles were not as
pronounced as we expected from the differences in shape change upon adherence and
their surface binding areas, as previously determined by our group for the same type of
microbubbles and same streptavidin biomarker [70]. The most prominent differences we
did find were higher acoustic stability for non‐bound microbubbles, higher resonance fre‐
155

CHAPTER 8
quencies (for DPPC microbubbles with diameters between 2 and 4 μm) and radial excur‐
sions for bound DPPC microbubbles at 50 kPa, and higher amplitudes at the second harmon‐
ic frequency for non‐bound DSPC microbubbles than for bound DSPC microbubbles at
150 kPa. The lower resonance frequencies for DPPC microbubbles than for DSPC microbub‐
bles were already observed for non‐bound DPPC microbubbles [260], and were thus main‐
tained upon binding.
For in vivo ultrasound molecular imaging the ideal targeted microbubble: 1) can effective‐
ly bind to the biomarker of interest; 2) persists binding to the biomarker after initial binding,
i.e. the binding strength is larger than the shear stress induced by the flowing blood; 3) is
stable during the course of the ultrasound examination; 4) nonlinearly scatters ultrasound
that is microbubble specific; 5) can be discriminated acoustically from non‐bound mi‐
crobubbles; 6) has the same resonance frequency as the other microbubbles that are inject‐
ed, i.e., all microbubbles in the population respond in the same way to ultrasound. Concern‐
ing the first two points, Kooiman et al [70] favored targeted DPPC microbubbles over DSPC
microbubbles because of their larger surface binding area to a streptavidin‐coated mem‐
brane, their dome shape after binding, and a more homogeneous distribution of fluores‐
cently labeled ligands attached to DSPE‐PEG(2000). The more homogeneous lipid distribu‐
tion might aid the initial attachment, whereas the larger binding area and difference in
shape might be able to better sustain blood shear forces. However, binding of the mi‐
crobubbles was performed under static conditions and experiments in the presence of flow
are needed to verify which of the two microbubble types binds best under flow. Based on
the acoustic stability (point 3), DSPC‐based microbubbles are favored over DPPC‐based
microbubbles. This also means that the size is better maintained during insonification and
the resonance frequency will therefore be more consistent throughout the investigation. In
terms of nonlinear scattering of ultrasound (point 4), the maximum relative radial excur‐
sions at the subharmonic frequency for both our DPPC and DSPC microbubbles resulted in
~20 dB lower scattered pressures than the second harmonic responses. The subharmonic
responses were too low and unpredictable to discriminate bound from non‐bound mi‐
crobubbles. In contrast, the responses at the second harmonic frequency were sufficiently
high to be detected, but amplitudes were similar for bound and non‐bound microbubbles,
or higher for the non‐bound ones in terms of DSPC‐based microbubbles (point 5). At 50 kPa,
bound and non‐bound DPPC microbubbles with diameters between 2 and 4 μm at reso‐
nance could be separated based on their resonance frequencies: bound DPPC microbubbles
had resonance frequencies above 1.8 MHz, whereas those were significantly lower for non‐
bound DPPC microbubbles. Lastly (point 6), as mentioned in the introduction one of the
main challenges for successful translation of ultrasound molecular imaging to the clinic is
the production of microbubble populations that have the same acoustic signature. Both the
DPPC and DSPC‐based microbubbles can have different resonance frequencies and radial
excursions although their sizes are similar. Several studies showed that monodisperse lipid‐
156

Vibrational responses of bound and non‐bound microbubbles
coated microbubble distributions can be produced using flow‐focusing devices [385, 396‐
398]. Talu et al. [398] and Kaya et al. [397] studied the difference between echo amplitudes
of these monodisperse single microbubbles when insonified at a frequency close to reso‐
nance, and found a lower standard deviation than for polydisperse microbubbles. Segers
and Versluis [399] developed an acoustic sorting chip that separated monodisperse mi‐
crobubbles based on the radiation force they experienced, which resulted in an overall
contrast enrichment of more than 10 dB. This is an important step towards improving the
quality of in vivo ultrasound molecular imaging, especially if microbubbles with low shell
elasticity and a diameter between 2 and 4 μm can be produced to distinguish bound from
non‐bound microbubbles, as shown in our study. However, this approach is still limited to
specific microbubble compositions that can be produced monodispersely by means of flow‐
focusing devices.
Summing up all the aforementioned similarities, differences, advantages, and disad‐
vantages of DPPC and DSPC‐based microbubbles, this results in a favor for DSPC‐based
microbubbles for ultrasound molecular imaging solely based on a higher acoustic stability.
Studying the adherence of the microbubbles under flow should reveal whether the hetero‐
geneous lipid distribution in the DSPC shell hinders binding. On the other hand, bound DPPC
microbubbles (diameters between 2 and 4 μm) at 50 kPa had resonance frequencies higher
than 1.8 MHz, whereas those of non‐bound DPPC microbubbles were lower than 1.8 MHz. In
addition, the relative radial excursions of bound DPPC microbubbles were also higher. When
monodisperse DPPC microbubbles with a diameter between 2 and 4 μm are produced,
these could acoustically be discriminated based on their resonance frequency.
Limitations and outlook
Although we aimed to create a more in vivo‐like set‐up using covalent biomarker binding
versus physisorption, the membrane we used in our experiments was still artificial. The 1‐
2 μm thick hydrogel created a softer layer between the microbubble and the polyester
membrane, but to have a real in vivo‐like membrane one would need to develop a material
with exactly the same stiffness, viscosity, etc. to an actual cell layer or perform in vivo exper‐
iments. In addition, in vivo one can also study microbubble vibration when microbubbles are
in contact with cells and under flow, for which the chorioallantoic membrane model could
be used. This model has proven to be useful to study non‐targeted microbubble vibration
using ultra‐high‐speed imaging and targeted‐microbubble mediated drug delivery [233, 342].
For in vivo ultrasound molecular imaging multiple microbubbles may bind in closer range
with each other than investigated in the present study. However, the binding range actually
depends on the availability of the biomarker on the cell surface, which depends both on the
cell type and the biomarker of interest. When the interbubble distance is ≤ 10 μm, this will
cause interaction of the bubbles in terms of secondary Bjerknes forces, and due to the sec‐
ondary Bjerknes forces a bubble will deform in the direction of their neighboring bubble
157
CHAPTER 8
[123]. Next to that, two similar sized bubbles that are close to each other result in a shift in
resonance frequency and therefore a decrease in maximum relative radial excursions [124].
As a consequence, for abundant biomarkers on the cell membrane these observations may
counteract the increase in resonance frequency and maximum relative radial excursions we
observed for DPPC microbubbles between 2 and 4 μm at 50 kPa. This, however, should first
be experimentally verified using a setup comprising of a biomarker distribution that is com‐
parable to the in vivo situation. The chorioallantoic model would be a good approach to
study this.
8.6. CONCLUSION
This study shows that binding of in‐house produced DPPC‐based microbubbles to a strep‐
tavidin‐coated surface increased the resonance frequencies (for microbubbles with diame‐
ters between 2 and 4 μm) and the corresponding relative radial excursions at relatively low
pressure (50 kPa). At this pressure, the bound 2 to 4 μm microbubbles resonated above
1.8 MHz, whereas the non‐bound 2 to 4 μm DPPC microbubbles were resonant below this
frequency. At higher pressure (150 kPa) this difference did not persist. No differences in
resonance frequency were observed between bound and non‐bound DSPC microbubbles. In
terms of non‐linear responses, only the responses at the second harmonic frequency of
bound DSPC microbubbles at 150 kPa were lower than of non‐bound DSPC microbubbles.
Our in‐house produced DPPC‐based microbubbles were acoustically less stable than our
DSPC‐based microbubbles, which is the major advantage of this type of microbubble for
ultrasound molecular imaging applications.
Acknowledgements
The authors thank Robert Beurskens, Frits Mastik, Michiel Manten, and Geert Springeling
for technical assistance, Dr. Tom Kokhuis for valuable discussions (all from the Dept. of
Biomedical Engineering, Thorax Center, Erasmus MC), and Dr. Jason L. Raymond for exper‐
imental assistance (visiting fellow Whitaker program). We also thank Ihsan Chrifi from the
Dept. of Experimental Cardiology, Thorax Center, Erasmus MC, for the spectrophotometer
measurements, and Dr. E. Gedig from XanTec bioanalytics GmbH, Germany, for discussions
about the covalent coating of streptavidin to the polyester membranes. The authors are
grateful to Prof. Dr. A.L. Klibanov from the University of Virginia, Cardiovascular Division,
Charlottesville, Virginia, USA for discussions about the microbubble preparation.
158
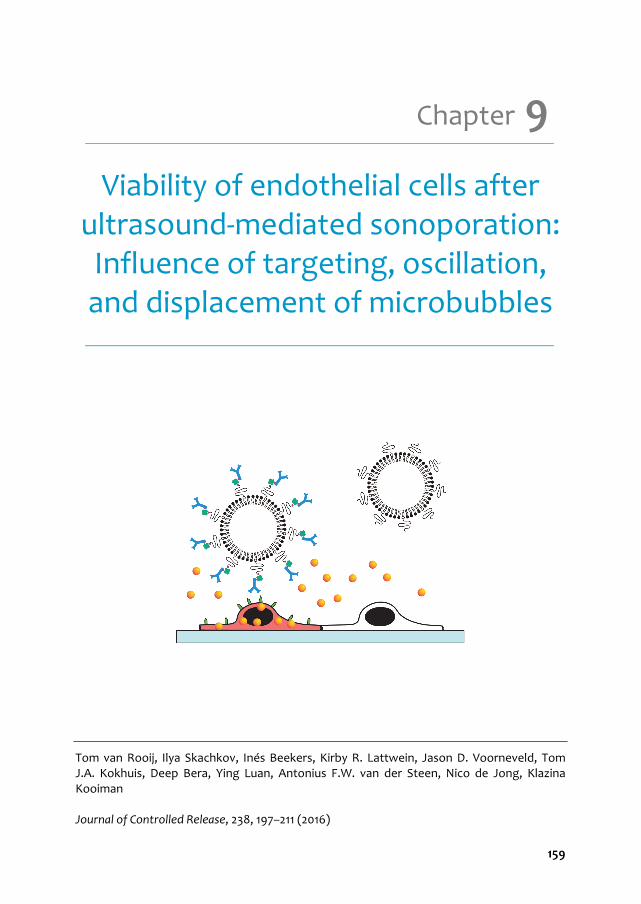
Viability of endothelial cells after
ultrasound‐mediated sonoporation: Influence of targeting, oscillation, and displacement of microbubbles
Tom van Rooij, Ilya Skachkov, Inés Beekers, Kirby R. Lattwein, Jason D. Voorneveld, Tom J.A. Kokhuis, Deep Bera, Ying Luan, Antonius F.W. van der Steen, Nico de Jong, Klazina Kooiman Journal of Controlled Release, 238, 197–211 (2016)
9 Chapter
159
CHAPTER 9
9.1. ABSTRACT
Microbubbles (MBs) have been shown to create transient or lethal pores in cell membranes
under the influence of ultrasound, known as ultrasound‐mediated sonoporation. Several
studies have reported enhanced drug delivery or local cell death induced by MBs that are
either targeted to a specific biomarker (targeted microbubbles, tMBs) or that are not
targeted (non‐targeted microbubbles, ntMBs). However, both the exact mechanism and
the optimal acoustic settings for sonoporation are still unknown. In this study we used real‐
time uptake patterns of propidium iodide, a fluorescent cell impermeable model drug, as a
measure for sonoporation. Combined with high‐speed optical recordings of MB
displacement and ultra‐high‐speed recordings of MB oscillation, we aimed to identify
differences in MB behavior responsible for either viable sonoporation or cell death. We
compared ntMBs and tMBs with identical shell compositions exposed to long acoustic
pulses (500‐50,000 cycles) at various pressures (150‐500 kPa).
Propidium iodide uptake highly correlated with cell viability; when the fluorescence
intensity still increased 120 s after opening of the pore, this resulted in cell death. Higher
acoustic pressures and longer cycles resulted in more displacing MBs and enhanced
sonoporation. Non‐displacing MBs were found to be the main contributor to cell death,
while displacement of tMBs enhanced reversible sonoporation and preserved cell viability.
Consequently, each therapeutic application requires different settings: non‐displacing
ntMBs or tMBs are advantageous for therapies requiring cell death, especially at 500 kPa
and 50,000 cycles, whereas short acoustic pulses causing limited displacement should be
used for drug delivery.
9.2. INTRODUCTION
Microbubbles (MBs) are ultrasound (US) contrast agents that consist of gas bubbles with
diameters between 1 and 10 μm, which are encapsulated by a stabilizing coating. Non‐
targeted microbubbles (ntMBs) are clinically used as blood pool agents for contrast‐
enhanced US imaging in cardiology and radiology [32, 313] and also have therapeutic
potential [45, 296]. Targeted microbubbles (tMBs) are promising agents for US molecular
imaging and therapy; in particular for diseases that can alter the endothelium, such as
cancer and inflammation. The tMBs can adhere to specific disease‐associated intravascular
biomarkers by the addition of targeting ligands to the MB coating [31, 262].
When MBs are insonified by US, they oscillate due to the acoustic pressure wave [45].
Oscillating MBs can increase cell membrane permeability to facilitate intracellular drug
uptake (sonoporation), stimulate endocytosis, and open cell‐cell junctions [36, 45].
Although the exact mechanisms of MB‐mediated drug uptake still remain unknown, many
studies have attempted to pinpoint the US settings that best stimulate intracellular drug
uptake [45, 400]. So far the key findings are: 1) cell membrane pores induced by oscillating
160
Viability of endothelial cells after ultrasound‐mediated sonoporation
MBs can be reversible or irreversible [38]; 2) a MB has to oscillate with sufficient amplitude
to induce sonoporation [35]; 3) tMBs stimulate drug uptake better than ntMBs both in vitro
[232, 234, 235, 238, 239] and in vivo [236, 237, 240, 241]. Recently, it has also been shown
that the cell membrane pore size and pore resealing coefficient can be mathematically
obtained from real‐time observed MB‐mediated intracellular drug uptake [34].
While reversible sonoporation likely facilitates cellular drug uptake without causing
lethal damage to the cell, irreversible sonoporation is thought to lead to significant cell
damage and eventually cell death. Different therapeutic approaches may require reversible
or irreversible sonoporation, and a balance is expected between therapeutic effectiveness
and cell damage. Hu et al. [38] revealed the size of the created cell membrane pore to be a
predictor for reversible or irreversible sonoporation: pores < 30 μm2 successfully resealed
within 1 min after insonification, while pores > 100 μm2 had not resealed within 30 min. An
established method to study drug uptake by sonoporation relies on the intracellular uptake
of the model drug propidium iodide (PI) [34, 35, 37, 233, 401], because this molecule can
only pass the cell membrane of a live cell when it has been disrupted. After entering the cell
it binds to DNA and RNA and becomes fluorescent [402]. Fan et al. [34] showed that
intracellular PI fluorescence intensity directly relates to the amount of PI‐DNA and PI‐RNA
complexes that have formed in the cell. They proposed a model to relate intracellular
fluorescence intensity to the size of the created pore and its resealing time, which
corresponded well with their experimental in vitro results on kidney [34] and endothelial
cells [403].
For MB‐mediated drug uptake, MB dynamics also have to be considered. The frequency
generally used for MB‐mediated drug delivery is 1 MHz [45], which means that the MBs
oscillate one million times per second. These MB oscillations can only be resolved using an
ultra‐high‐speed camera, capable of recording at least two million frames per second (Mfps)
to satisfy the Nyquist sampling criterion [404]. While our group used ultra‐high‐speed
recordings to determine that the relative oscillation amplitude of tMBs had to be above 50%
to successfully sonoporate a cell [35] (6× 10 cycles at 1 MHz and 80‐200 kPa peak negative
acoustic pressure), others used high‐speed cameras (in the order of a few thousand fps) to
reveal that MB displacement is an important contributor to sonoporation‐mediated cell
death (1.25 MHz, 60‐600 kPa, pulse repetition frequency (PRF) 10‐1000 kHz, duty
cycles 0.016‐20%) [405]. MBs displace due to acoustic radiation forces, especially when
longer acoustic pulses are used [81, 406]. Long acoustic pulses have sparsely been used in
MB‐mediated drug delivery studies [40, 407‐409], even though one of these studies
reported that 7,000 cycles resulted in significantly more luciferase activity than 1,000 and
5,000 cycles in endothelial cells in vitro (2.25 MHz, 330 kPa, PRF 20 Hz, 120 s treatment) [40].
On the other hand, no significant differences between 1,000, 5,000, and 10,000 cycles were
observed; different US pulse lengths thus affected luciferase activity. So far, in depth
sonoporation studies on the effect of longer acoustic pulses at different acoustic pressures
161
CHAPTER 9
are lacking, as is the relation between MB oscillation and sonoporation efficiency. In
addition, the effect of the same type of ntMBs and tMBs on endothelial cells has never been
directly compared in vitro. All prior studies comparing ntMBs and tMBs were performed on
cancer [232, 235, 238, 239] and smooth muscle cells [234], despite that MBs are primarily in
contact with endothelial cells when injected intravenously [31, 45].
In this study we used long US pulses (500‐50,000 cycles) at various pressures (150‐
500 kPa) to investigate how these settings affect US‐mediated endothelial cell membrane
permeability and cell death. In order to properly compare ntMBs and tMBs, we used home‐
made MBs with identical shell compositions to investigate their effect. The real‐time
observed PI uptake patterns were fit to the previously proposed diffusion model of Fan et
al. [34] and additional Principal Component Analysis was used to determine whether cells
were reversibly or irreversibly damaged. In combination with high‐speed optical recordings
of MB displacement and ultra‐high‐speed recordings of MB oscillation, we aimed to identify
MB behavior responsible for viable sonoporation or cell death.
9.3. MATERIALS AND METHODS
Microbubble preparation
Lipid‐coated MBs with a C4F10 gas core (F2 Chemicals, Preston, UK) were made by sonication
as described previously [129, 233]. The coating of the non‐targeted MBs (ntMBs) consisted
of 1,2‐distearoyl‐sn‐glycero‐3‐phosphocholine (DSPC; 59.4 mol%; P6517; Sigma‐Aldrich,
Zwijndrecht, the Netherlands), polyoxyethylene‐(40)‐stearate (PEG‐40 stearate; 35.7 mol%;
P3440; Sigma‐Aldrich), and 1,2‐distearoyl‐sn‐glycero‐3‐phosphoethanolamine‐N‐
carboxy(polyethylene glycol) (DSPE‐PEG(2000); MW 2000; 4.9 mol%; 880125P; Avanti Polar
Lipids, Alabaster, AL, USA). Before the experiment, the ntMBs were washed three times
using centrifugation for 1 min at 400 g. After washing the ntMBs, the size distribution and
concentration were measured using a Coulter Counter (n = 3; Multisizer 3; Beckman Coulter,
Mijdrecht, the Netherlands). The mean (± standard deviation, SD) diameter of the ntMB was
2.54 (± 0.02) µm.
The same components were used for the targeted MBs (tMBs), except 0.8% of DSPE‐
PEG(2000) was replaced with DSPE‐PEG(2000)‐biotin (MW2000; 880129C; Avanti Polar
Lipids). This allows for adding targeting moieties to the MBs via biotin‐streptavidin bridging
as previously described [132, 233]. Briefly, after three washing steps by centrifugation at
400 g for 1 min, the concentration of the MBs was measured using a Coulter Counter (n = 3)
and 1 x 10⁹ biotinylated MBs were incubated with 20 μg of streptavidin (S4762; Sigma‐
Aldrich) on ice for 30 min. Following incubation, the streptavidin‐conjugated MBs were
washed once to remove non‐bound streptavidin. Next, 5 μg of biotinylated anti‐human
CD31‐antibody (BAM3567; R&D Systems, Abingdon, United Kingdom) were conjugated to
the MB shell, during incubation for 30 min on ice. Following this, tMBs were washed once to
162

Viability of endothelial cells after ultrasound‐mediated sonoporation
remove non‐bound antibodies. Directly afterwards the size distribution and concentrations
were measured using a Coulter Counter (n = 3) and mean (± SD) diameter for the tMBs was
2.82 (± 0.09) µm.
Endothelial cell culture
Human umbilical vein endothelial cells (HUVECs; C2519A; Lonza, Verviers, Belgium) were
cultured in EGM‐2 medium (CC‐3162; Lonza) in T‐75 flasks (353136; BD Falcon Fisher
Scientific, Breda, the Netherlands), and maintained in a humidified incubator under
standard conditions (37 °C, 5% CO2). Thereafter the cells were trypsinized using trypsin in
EDTA (CC‐5012; Lonza) and replated on one side of an OptiCellTM (Thermo Scientific, NUNC
GmbH & Co, Wiesbaden, Germany). Experiments were performed two days later with 100%
confluence of HUVECs in the OptiCell.
Experimental set‐up
For visualization of the MBs and HUVECs, the microscopic set‐up consisted of a fluorescence
microscope (Olympus, Zoeterwoude, the Netherlands) equipped with a 5× objective
(LMPlanFl 5X, NA 0.13, Olympus) for the sonoporation and cell viability assays or a 40×
objective (LUMPlanFl 40XW, NA 0.80, water immersion, Olympus) to capture MB behavior.
For bright field imaging the sample was illuminated from below via a light fiber using a
continuous light source and for fluorescence imaging a mercury lamp and a suitable set of
fluorescent filters were used for the detection of propidium iodide (U‐MWG2 filter,
Olympus), Hoechst 33342 (U‐MWU2 filter, Olympus), and calcein (U‐MWIB2, Olympus). On
top of the microscope three different cameras were mounted: 1) a high sensitivity CCD
camera (AxioCam MRc, Carl Zeiss, Germany) for fluorescence imaging, 2) a high‐speed
Redlake Motion Pro Camera (10K, San Diego, CA, USA), and 3) the ultra‐high‐speed
Brandaris 128 camera [52]. The experimental set‐up is illustrated in Fig. 9.1.
For the acoustical set‐up, a 1 MHz single‐element, focused transducer (focal distance
75 mm; V303; Panametrics‐NDTTM, Olympus NDT, Waltham, MA, USA) was mounted in the
water bath at a 45° angle below the sample (Fig. 9.1). Each OptiCell was divided into eight
equally sized, acoustically non‐overlapping sections (19 × 33 mm each; for schematic see
Fig. 9.1), which covered the beam area (‐6 dB beam width of 6.5 mm) at the focus of the
transducer, as verified in advance with a calibrated 0.2 mm PVDF needle hydrophone
(Precision Acoustics Ltd, Dorchester, UK). The acoustic focus was aligned with the optic
focus.
During the experiment, the position of the OptiCell was adjusted to place the center of
each subsection in the focal zone. The sample was insonified by a single Gaussian tapered
sine wave burst generated by an arbitrary waveform generator (33220A, Agilent, Palo Alto,
CA, USA) and amplified using a broadband amplifier (ENI A‐500, Electronics & Innovation,
Rochester, NY, USA). The peak negative acoustic pressure of the US burst (150, 300, or
163

CHAPTER 9
500 kPa) was kept constant for the entire OptiCell, whereas the number of cycles in the
single US burst (500; 1,000; 2,000; 5,000; 10,000; 20,000; and 50,000) varied per OptiCell
subsection (Fig. 9.1). For each Opticell one of the subsections was used as a control where
no US was applied.
Time‐lapse sonoporation assay
The time‐lapse sonoporation assay was used to monitor sonoporation over time for the
different US pressures and number of cycles and is illustrated in Fig. 9.2. First, calcein‐AM
(C3100MP; Invitrogen; prepared in DMSO (Sigma‐Aldrich)) was added to the HUVECs in the
OptiCell in a final concentration of 0.25 μg/mL. We used calcein‐AM as a live‐cell stain as it
passively crosses into cellular membranes, has high cell retention, and is only converted to
fluorescent calcein in living cells [410]. After 30 min of incubation (37 °C, 5% CO2) of the
HUVECs with calcein‐AM, we added propidium iodide (PI; final concentration 25 µg/mL; P‐
4864; Sigma‐Aldrich) and Hoechst 33342 (final concentration 5 µg/mL; H3570; Invitrogen,
Breda, the Netherlands) to the OptiCell. PI, which is live cell‐impermeable, was used to
determine the presence and intensity of sonoporation, or disruption of cell membranes,
since it only becomes fluorescent when bound to DNA and RNA inside cells [402]. The
Hoechst 33342 fluorescent dye was used to stain the nuclei of living and dead HUVECs, as it
Fig. 9.1. Experimental set‐up. (A) Illustration of the optical imaging systems combined with the acoustical
set‐up. Brandaris 128 is the ultra‐high‐speed camera, Redlake the high‐speed camera, and AxioCam the
fluorescence and bright field CCD camera. The enlarged OptiCell shows the insonification scheme. (B)
Orientation of the microbubbles (MBs) with respect to the cells and the direction of ultrasound (US)
insonification. Non‐targeted MBs (ntMBs) were floating against the cells, targeted MBs (tMBs) were
adhered on top of the cells, or tMBs adhered below the cells (tMBB), similar to the ntMB orientation.
164
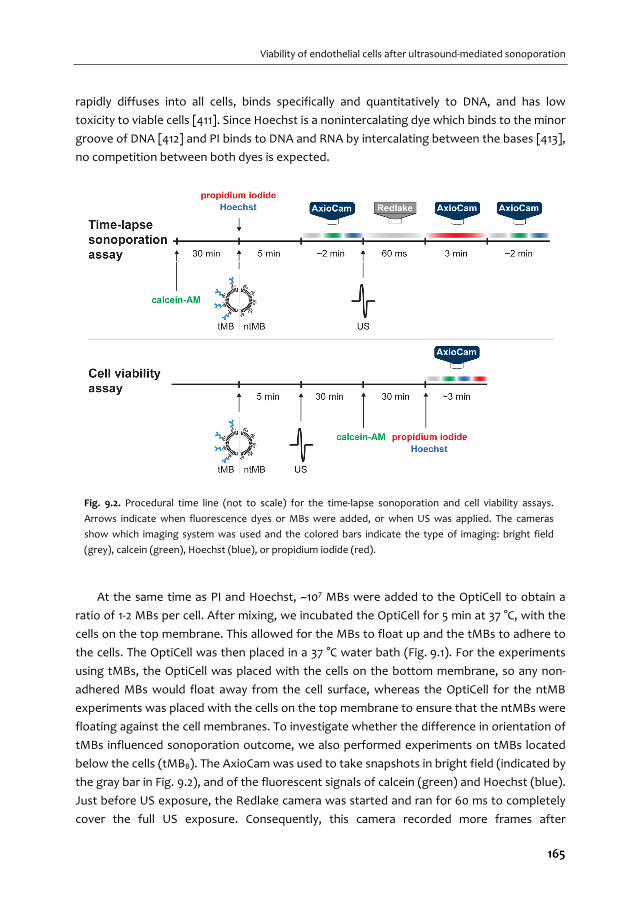
Viability of endothelial cells after ultrasound‐mediated sonoporation
rapidly diffuses into all cells, binds specifically and quantitatively to DNA, and has low
toxicity to viable cells [411]. Since Hoechst is a nonintercalating dye which binds to the minor
groove of DNA [412] and PI binds to DNA and RNA by intercalating between the bases [413],
no competition between both dyes is expected.
At the same time as PI and Hoechst, ~107 MBs were added to the OptiCell to obtain a
ratio of 1‐2 MBs per cell. After mixing, we incubated the OptiCell for 5 min at 37 °C, with the
cells on the top membrane. This allowed for the MBs to float up and the tMBs to adhere to
the cells. The OptiCell was then placed in a 37 °C water bath (Fig. 9.1). For the experiments
using tMBs, the OptiCell was placed with the cells on the bottom membrane, so any non‐
adhered MBs would float away from the cell surface, whereas the OptiCell for the ntMB
experiments was placed with the cells on the top membrane to ensure that the ntMBs were
floating against the cell membranes. To investigate whether the difference in orientation of
tMBs influenced sonoporation outcome, we also performed experiments on tMBs located
below the cells (tMBB). The AxioCam was used to take snapshots in bright field (indicated by
the gray bar in Fig. 9.2), and of the fluorescent signals of calcein (green) and Hoechst (blue).
Just before US exposure, the Redlake camera was started and ran for 60 ms to completely
cover the full US exposure. Consequently, this camera recorded more frames after
Fig. 9.2. Procedural time line (not to scale) for the time‐lapse sonoporation and cell viability assays.
Arrows indicate when fluorescence dyes or MBs were added, or when US was applied. The cameras
show which imaging system was used and the colored bars indicate the type of imaging: bright field
(grey), calcein (green), Hoechst (blue), or propidium iodide (red).
165
CHAPTER 9
insonification for the shorter pulses than for the longest pulse. The Redlake camera
recorded the MB displacement and clustering at 2,000 frames per second (fps). After these
60 ms, the AxioCam recorded the fluorescence intensity change over time for 3 min (1.5 s
exposure and 5 s time intervals) caused by cellular PI uptake after US application. At the end
of the protocol, snapshots in bright field and of calcein and Hoechst signal were taken for
comparison with the initial situation. This procedure was repeated for each subsection and
the experiment was performed in triplicate.
Cell viability assay
For each US setting, cell viability was determined as shown in Fig. 9.2. The same amount of
MBs as described in the previous section (~107) were added to the OptiCell and left in the
incubator (37 °C) for 5 min. Within 3 to 4 min after the US treatment of all eight subsections
of the OptiCell, HUVECs were incubated at 37 °C, 5% CO2. Thirty minutes after the US
treatment, calcein‐AM was added to the OptiCell and incubated for another 30 min under
the same conditions. After the final incubation, PI and Hoechst were added to the Opticell.
This procedure was followed directly with bright field and fluorescent (calcein, Hoechst, and
PI) microscopic examination using the AxioCam (Fig. 9.2). For each condition, five different
fields of view were acquired within a 6 mm circle around the center of the insonified area.
All experiments were done in triplicate.
Oscillatory behavior of microbubbles
To relate MB behavior to sonoporation, high imaging speeds in the range of a few million
frames per second (Mfps) are required. Since these high speeds cannot be achieved using
the Redlake camera, we used the Brandaris 128 ultra‐high‐speed camera [52] in segmented
mode [320]. The protocol was similar to the time‐lapse sonoporation assay, but the Redlake
camera was replaced by the Brandaris 128 camera. The segmented mode of the
Brandaris 128 allows for optical recording of long US pulses by dividing the CCD sensor arc
into four segments. During each exposure all four segments were illuminated, however only
one segment was triggered to transfer the data to the buffer channel. These triggered
transfers from the consecutive segments were equally spaced over the time span of the
applied US pulse. The start of the acquisition was triggered at a frame rate of 3.85 Mfps,
resulting in a corresponding intersegment time of ~328 µs. During one US pulse a full
recording then captured four equally spaced movies of ~8 µs in bright field using a Xenon
flash source (MVS‐7010, Perkin‐Elmer Optoelectronics, Wiesbaden, Germany). These
settings resulted in a total acquisition time of 1017 µs. The recording time of the ultra‐high‐
speed movies was a few μs longer than the US pulse to ensure that the start and end of the
MB oscillations were fully captured. MB behavior was recorded for both tMBs and ntMBs, at
1,000 cycles for pressures of 150 and 300 kPa. The number of cycles was limited to 1,000
cycles (i.e. 1 ms duration), because the Xenon flash duration could not be extended.
166

Viability of endothelial cells after ultrasound‐mediated sonoporation
Analysis of fluorescence images
All images acquired with the Axiocam (bright field and fluorescence) were analyzed using a
custom‐built plugin for ImageJ [414]. To segment the nuclei, first a composite image of the
Hoechst image after insonification and the final PI image was produced, to ensure clear
visibility of all nuclei. We chose to use the Hoechst image after insonification, since less cell
displacement was expected between this image and the first PI image. The composite
image was thresholded using the method of Otsu [415], resulting in a binary image with
white nuclei on a black background. A mask of this image was created and watershedding
was applied to separate overlapping nuclei. The watershedding algorithm calculates the
centers of the nuclei and dilates them until touching another dilated boundary or a white
pixel. At the meeting point, a watershed line is drawn. Using the Analyze Particles function,
the nuclei and the area of the nuclei were located and stored in the ROI manager. The
center of the nuclei was found using the Find Maxima function, added to the ROI manager,
and copied to a blank image. Next, the cell borders were automatically segmented using
Voronoi tessellation [416] which is a built‐in option in the Find Maxima function. Voronoi
tessellation is based on the theory that every point p has a distance to another point q that
is less than or equal to its distance to any other point r. The lines in a Voronoi diagram are
thus equidistant to two points in space (i.e., the cell nuclei) and correspond to the most
likely position of the cell boundaries. The resulting Voronoi segmentation was transformed
into a mask and stored in the ROI manager. The ROI manager now contained the center of
each nucleus, the area of each nucleus, and the cell borders.
For assessing cell death using the cell viability assay, the number of cells that showed PI
uptake on the images without the application of US was analyzed as described above. Next,
the number of cells that had taken up PI after receiving US was normalized to the number
of cells that had taken up PI in the control sections, to correct for cells that were already
dead when the experiment started.
For assessing the dynamic uptake of PI after sonoporation the segmented nuclei and cell
borders were overlaid on every frame of the PI fluorescence time‐lapse recording after the
application of US. The mean signal intensity of PI for each nucleus and each cell was
obtained frame by frame. The nuclear PI uptake was used for further analysis because the
segmentation of the nuclei was based on intensity thresholding of Hoechst stained nuclei,
which is more accurate than the segmentation of cell borders that is based on the highest
probability of a cell border being present.
PI model fit and data classification
The temporal PI intensity values in the nuclei were loaded into RStudio (RStudio, Inc.,
Boston, MA, USA) for further quantification of sonoporation. Fan et al. [34] derived Eq. (9.1)
167

CHAPTER 9
to model sonoporation dynamics of a single cell, based on the resealing of the created pore
and the diffusion rate of PI into the cell.
0
1 1 t
oF t DC r e
(9.1)
In Eq. (9.1), F(t) is the fluorescence intensity as a function of time, α is a coefficient that
relates the amount of PI molecules to the fluorescence intensity of PI‐DNA and PI‐RNA. This
coefficient is determined by the sensitivity of the fluorescence imaging system. The other
parameters are the diffusion coefficient of PI, D, the extracellular PI concentration, C0, the
initial radius of the pore, r0, the pore resealing coefficient, , and time, t. The pore size
coefficient, α∙π∙D∙C0∙r0, determines the initial slope of the PI uptake pattern and is the
scaling factor for the exponential increase. Therefore, a steep initial slope corresponds to a
larger pore size. The overall slope follows ∙ ∙ ∙ , in which the pore
resealing coefficient is the time constant that determines the time to reach the
asymptotic value of the maximum PI intensity. This asymptotic maximal PI intensity value is
given by the inverse relationship between the pore size and pore resealing coefficients (Eq.
(9.2)). Therefore a cell with a high pore resealing coefficient quickly reaches the asymptotic
value, resulting from quick resealing of the pore.
0 oDC rF
(9.2)
To obtain the pore size coefficient, α∙π∙D∙C0∙r0, and the pore resealing coefficient, , the
PI intensities recorded in the time‐lapse sonoporation assay were fit to Eq. (9.1) using a
nonlinear least‐squares approach. Classification, based on the distributions of both
coefficients, was performed using Principal Component Analysis (PCA) [417, 418] on the
complete data set (all settings, both ntMB and tMB). We chose PCA because this method
captures as much of the variation in the data as possible by computing eigenvectors (for
determining the direction in which the data has largest variance) and corresponding
eigenvalues (to determine how much variance there is in the data in that direction). The
principal components (PCs) are uncorrelated with each other since the eigenvectors are
perpendicular to each other. In this data set we chose two PCs because we only used the
pore size coefficients and pore resealing coefficients to fit the data to Eq. (9.1).
Classification thresholding was applied on the PC with the largest variance, separating the
complete data set in two groups. Using these PCs, the cell populations at each different
setting were classified. Based on Eq. (9.1), two additional thresholds were chosen to classify
the cells that were most likely irreversibly damaged based on very low pore resealing
coefficients. In these cells, PI intensities still increased at the end of the time‐lapse
168
Viability of endothelial cells after ultrasound‐mediated sonoporation
sonoporation assay (i.e. at 180 s), or > 120 s. Because pores remaining open for more than 1
min would not close [38], we assumed these pores to most likely result in cell death.
Displacement of microbubbles
Tracking of displacing MBs was implemented in Python™ (v2.7, Python Software
Foundation). The recordings on which the tracking was performed were obtained with the
Redlake camera and had an isotropic spatial resolution of 0.63 µm/pixel. Gaussian Mixture‐
based background subtraction [419] was applied to remove all but the displacing MBs from
each frame. This was required to correct for illumination fluctuations among the frames and
in different regions of the image, which hindered accurate MB tracking. The remaining MBs
were tracked using Trackpy [420], an open source blob tracking algorithm, to obtain the
trajectory of each displacing MB.
To differentiate between sonoporation due to displacing or non‐displacing MBs, the
latter were segmented from the AxioCam bright field images before US application. Since
the FOV of the Redlake camera was smaller than that of the AxioCam, only the part of the
FOV that overlapped was analyzed. We used the Laplacian of Gaussian (LoG) blob detection
algorithm (scikit‐image [421]); this algorithm convolves Gaussian kernels of a range of
standard deviations with an image. In this way it determines the centroid and diameter of
non‐displacing MBs, approximated by the standard deviation of the corresponding Gaussian
kernel. In order to detect most MBs, their diameters were limited to a range between 1.7
and 5.0 µm, and a 20% overlap was allowed to properly deal with clusters and focal
differences.
After locating the displacing and non‐displacing MBs, their effect on cellular PI uptake
was assessed. For segmentation of the nuclei from the Hoechst images, we also used the
LoG blob detection algorithm, which performed best when the range to detect nuclei was
limited between 5.0 and 6.7 µm in diameter, and overlapping at most 20%, to separate nuclei
with seemingly overlapping borders. Centroids of the segmented cell nuclei were used as
seeding points for cell border segmentation using Voronoi tessellation. For segmenting
regions with PI uptake in the initial and final frame of the PI stained image sequences, the
LoG blob detection algorithm was limited to diameters between 5.0 and 8.3 µm, and
allowed 25% overlap. More overlap and larger regions were allowed than for nuclei
segmentation since PI can also stain the cytoplasm by binding to RNA. Regions in which PI
uptake was detected in both the first and last frame were neglected, because these cells
had already taken up PI before US application. Cells were defined as sonoporated when 70%
of their equivalent circular diameter overlapped with a region showing PI uptake. This
percentage was used to compensate for the overestimation of cellular diameters due to
odd shaped cells, e.g. rectangular shaped cells. If a cell’s equivalent diameter intersected
with 1.25 times a MB diameter (to account for MB expansion) it was considered to be in
contact with a non‐displacing MB. Similarly, contact with displacing MBs occurred when the
169

CHAPTER 9
cell’s full equivalent diameter intersected with a MB’s trajectory (the lines connecting a MB
between frames, as determined by Trackpy).
The relations between MB displacement and sonoporation outcome at all acoustic
settings were visualized using scatter plots and linear fits through these data using a least‐
squares approach in MATLAB (The MathWorks, Natick, MA, USA).
Statistics
To compare the various acoustical settings, we performed statistical testing using Student’s
t‐tests to identify significantly different outcomes. All statistics were performed using
Student’s t‐tests for independent samples, where a p‐value of 0.05 was regarded as
significant.
For both sonoporation and cell death, different insonifying pressures were compared at
the same number of cycles for both ntMBs and tMBs. One‐sided t‐tests were used to reveal
whether higher pressures at the same number of cycles resulted in more sonoporation and
cell death. The same t‐tests were performed to verify whether the experimental acoustic
settings resulted in more sonoporation than in the control experiments. For comparing
sonoporation with cell death, we used 2‐sided t‐tests to verify whether the percentage of
sonoporated cells was different from the percentage of cell death. The effect of ntMBs,
tMBs, and tMBB on the amount of sonoporated cells and on cell death were tested using 2‐
sided t‐tests.
The cells that were classified as non‐resealing within 120 s were compared to the cells
that were determined as dead by the cell viability assay. We used 2‐sided t‐tests to verify
whether the assumption that both populations were equal was true.
9.4. RESULTS
Sonoporation and cell death
The influence of various acoustic settings on cellular responses, for both ntMBs and tMBs,
was evaluated by the amount of sonoporated cells and cell death, as illustrated in Fig. 9.3.
The sonoporation and cell death data are presented as the mean of three experiments at
the same settings, with a mean (± SD) of 1,727 (± 338) cells in the FOV for ntMBs and
3,104 (± 130) cells for tMBs. The amount of injected microbubbles was adjusted accordingly,
resulting in 1.9 (± 0.8) ntMBs per cell and 1.6 (± 0.3) tMBs per cell. No controls are shown for
the cell death data, since these were already subtracted at all settings to correct for natural,
non‐US related, cell death (6.7 ± 1.1%).
The data show that applying higher acoustic pressures and more cycles increased both
the number of sonoporated cells (Fig. 9.3A, C) and the number of dead cells (Fig. 9.3B, D).
This trend was seen for both ntMBs (Fig. 9.3A, B) and tMBs (Fig. 9.3C, D). However, when
statistically comparing the same number of cycles at increasing pressures, the increase in
170
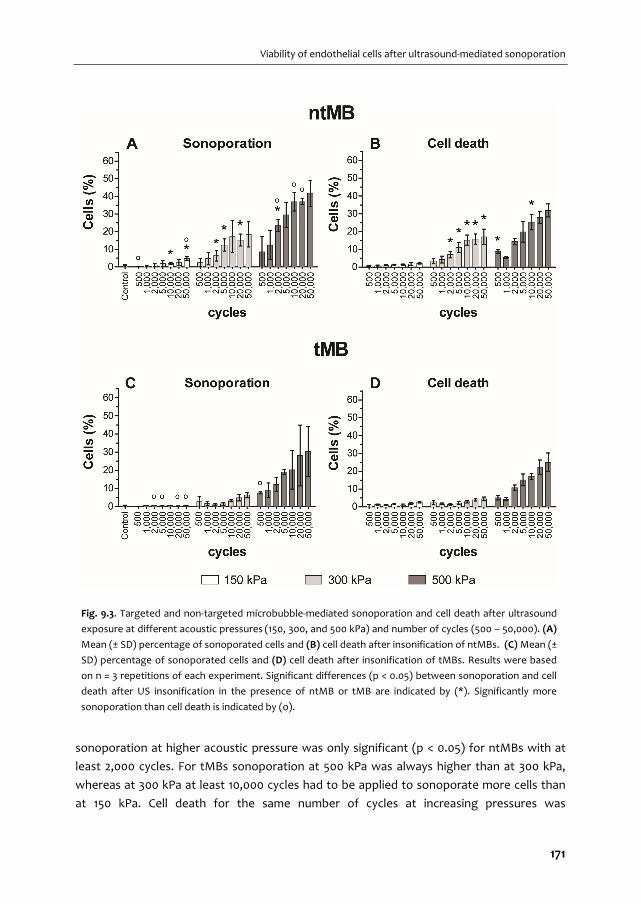
Viability of endothelial cells after ultrasound‐mediated sonoporation
sonoporation at higher acoustic pressure was only significant (p < 0.05) for ntMBs with at
least 2,000 cycles. For tMBs sonoporation at 500 kPa was always higher than at 300 kPa,
whereas at 300 kPa at least 10,000 cycles had to be applied to sonoporate more cells than
at 150 kPa. Cell death for the same number of cycles at increasing pressures was
Fig. 9.3. Targeted and non‐targeted microbubble‐mediated sonoporation and cell death after ultrasound
exposure at different acoustic pressures (150, 300, and 500 kPa) and number of cycles (500 – 50,000). (A)
Mean (± SD) percentage of sonoporated cells and (B) cell death after insonification of ntMBs. (C) Mean (±
SD) percentage of sonoporated cells and (D) cell death after insonification of tMBs. Results were based
on n = 3 repetitions of each experiment. Significant differences (p < 0.05) between sonoporation and cell
death after US insonification in the presence of ntMB or tMB are indicated by (*). Significantly more
sonoporation than cell death is indicated by (o).
171
CHAPTER 9
significantly higher when using ntMBs, in all cases. For tMBs, cell death at 500 kPa was
always significantly higher than at 300 kPa. Conversely, when comparing 300 kPa and
150 kPa, cell death was not significantly different between 1,000 and 5,000 cycles.
The amount of sonoporated cells, in the presence of ntMBs at 150 kPa, only resulted in
significantly more sonoporation than in control experiments (0.4% sonoporation) when
applying 10,000 or 50,000 cycles (2.0% or 4.7%, respectively). At 300 kPa at least 2,000 cycles
were required to significantly yield more PI uptake than in the control experiments,
whereas at 500 kPa pressure, 1,000 cycles were already sufficient. For tMBs, 150 kPa did not
result in significantly more sonoporation than in the experiments without US. However,
application of 300 or 500 kPa sonoporated significantly more cells than in the control
experiments for all cycles considered.
The amount of sonoporated cells was expected to be higher than the amount of dead
cells, because cells that are sonoporated can also remain viable. However, for most of the
settings we applied, cell death was similar to the amount of sonoporated cells. The settings
for which the difference between cell death and sonoporation was significant are indicated
by (o) in Fig. 9.3A and C. Since cell death was assessed from the viability assays—which
were performed separately from the sonoporation assays—cell death could even be higher
than the amount of sonoporated cells. This was the case for the 150 kPa experiments in the
presence of tMBs.
To validate whether ntMBs or tMBs were more efficient in inducing sonoporation and
cell death, we statistically compared them for significance. The asterisks () in Fig. 9.3 indicate significant differences between ntMB and tMB for sonoporation (A) and cell death
(B). Although Fig. 9.3A and C may suggest that ntMB more efficiently sonoporated cells
than tMB at 500 kPa using long US pulses, this difference was not significant, probably due
to the high standard deviations in the tMB sonoporation experiments. Cell death due to
ntMBs was significantly higher for almost all number of cycles at a pressure of 300 kPa, and
comparable for all settings at 150 kPa and for most settings at 500 kPa.
Sonoporation‐induced PI uptake over time
Before US exposure, bright field imaging was used to discern MB locations (Fig. 9.4A); the
black dots in this figure are the MBs, examples indicated by white arrows. The grey
background of the image shows spherical structures; these are the nuclei of the endothelial
cells in the monolayer. Fluorescence microscopy established individual cell nuclei locations
by Hoechst staining (Fig. 9.4B), cell membrane integrity by the absence of PI fluorescence
(Fig. 9.4C), and live cells by the presence of calcein (Fig. 9.4D). After US insonification, less
MBs were present because they had dissolved, coalesced, or displaced (Fig. 9.4E).
Intracellular PI uptake was observed by increase of fluorescence signal, thus indicating
sonoporation (Fig. 9.4G).
172
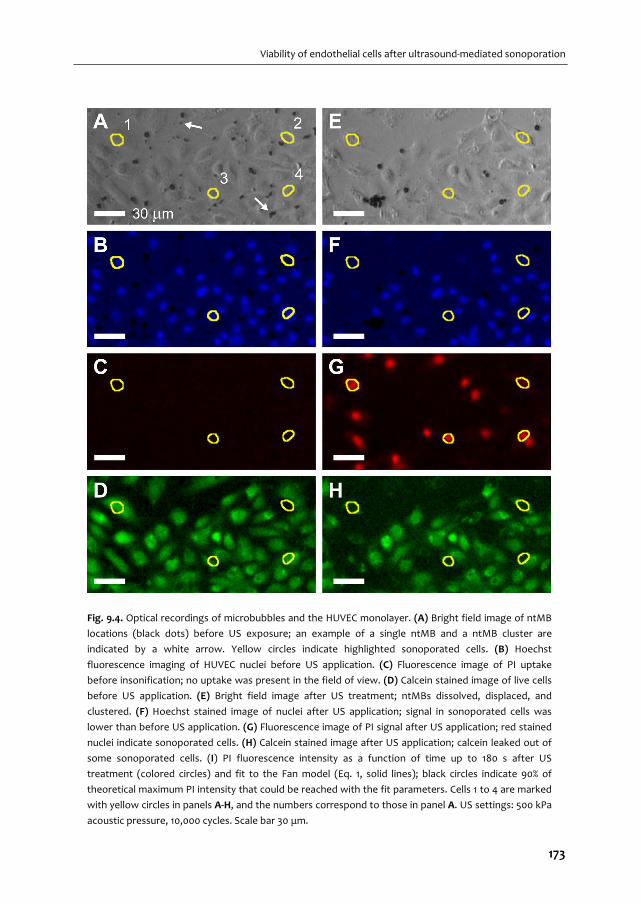
Viability of endothelial cells after ultrasound‐mediated sonoporation
Fig. 9.4. Optical recordings of microbubbles and the HUVEC monolayer. (A) Bright field image of ntMB
locations (black dots) before US exposure; an example of a single ntMB and a ntMB cluster are
indicated by a white arrow. Yellow circles indicate highlighted sonoporated cells. (B) Hoechst
fluorescence imaging of HUVEC nuclei before US application. (C) Fluorescence image of PI uptake
before insonification; no uptake was present in the field of view. (D) Calcein stained image of live cells
before US application. (E) Bright field image after US treatment; ntMBs dissolved, displaced, and
clustered. (F) Hoechst stained image of nuclei after US application; signal in sonoporated cells was
lower than before US application. (G) Fluorescence image of PI signal after US application; red stained
nuclei indicate sonoporated cells. (H) Calcein stained image after US application; calcein leaked out of
some sonoporated cells. (I) PI fluorescence intensity as a function of time up to 180 s after US
treatment (colored circles) and fit to the Fan model (Eq. 1, solid lines); black circles indicate 90% of
theoretical maximum PI intensity that could be reached with the fit parameters. Cells 1 to 4 are marked
with yellow circles in panels A‐H, and the numbers correspond to those in panel A. US settings: 500 kPa
acoustic pressure, 10,000 cycles. Scale bar 30 μm.
173
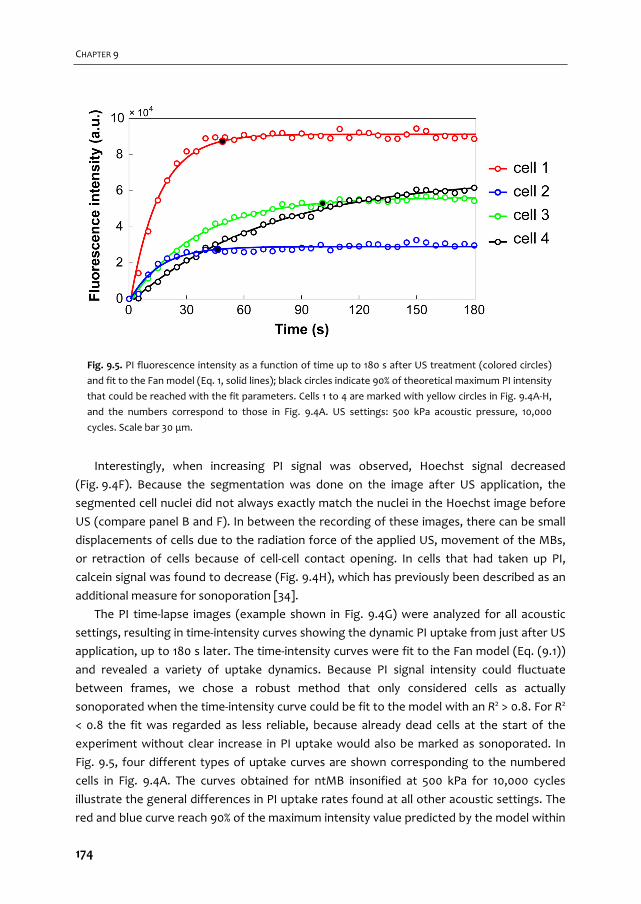
CHAPTER 9
Interestingly, when increasing PI signal was observed, Hoechst signal decreased
(Fig. 9.4F). Because the segmentation was done on the image after US application, the
segmented cell nuclei did not always exactly match the nuclei in the Hoechst image before
US (compare panel B and F). In between the recording of these images, there can be small
displacements of cells due to the radiation force of the applied US, movement of the MBs,
or retraction of cells because of cell‐cell contact opening. In cells that had taken up PI,
calcein signal was found to decrease (Fig. 9.4H), which has previously been described as an
additional measure for sonoporation [34].
The PI time‐lapse images (example shown in Fig. 9.4G) were analyzed for all acoustic
settings, resulting in time‐intensity curves showing the dynamic PI uptake from just after US
application, up to 180 s later. The time‐intensity curves were fit to the Fan model (Eq. (9.1))
and revealed a variety of uptake dynamics. Because PI signal intensity could fluctuate
between frames, we chose a robust method that only considered cells as actually
sonoporated when the time‐intensity curve could be fit to the model with an R2 > 0.8. For R2
< 0.8 the fit was regarded as less reliable, because already dead cells at the start of the
experiment without clear increase in PI uptake would also be marked as sonoporated. In
Fig. 9.5, four different types of uptake curves are shown corresponding to the numbered
cells in Fig. 9.4A. The curves obtained for ntMB insonified at 500 kPa for 10,000 cycles
illustrate the general differences in PI uptake rates found at all other acoustic settings. The
red and blue curve reach 90% of the maximum intensity value predicted by the model within
Fig. 9.5. PI fluorescence intensity as a function of time up to 180 s after US treatment (colored circles)
and fit to the Fan model (Eq. 1, solid lines); black circles indicate 90% of theoretical maximum PI intensity
that could be reached with the fit parameters. Cells 1 to 4 are marked with yellow circles in Fig. 9.4A‐H,
and the numbers correspond to those in Fig. 9.4A. US settings: 500 kPa acoustic pressure, 10,000
cycles. Scale bar 30 μm.
174
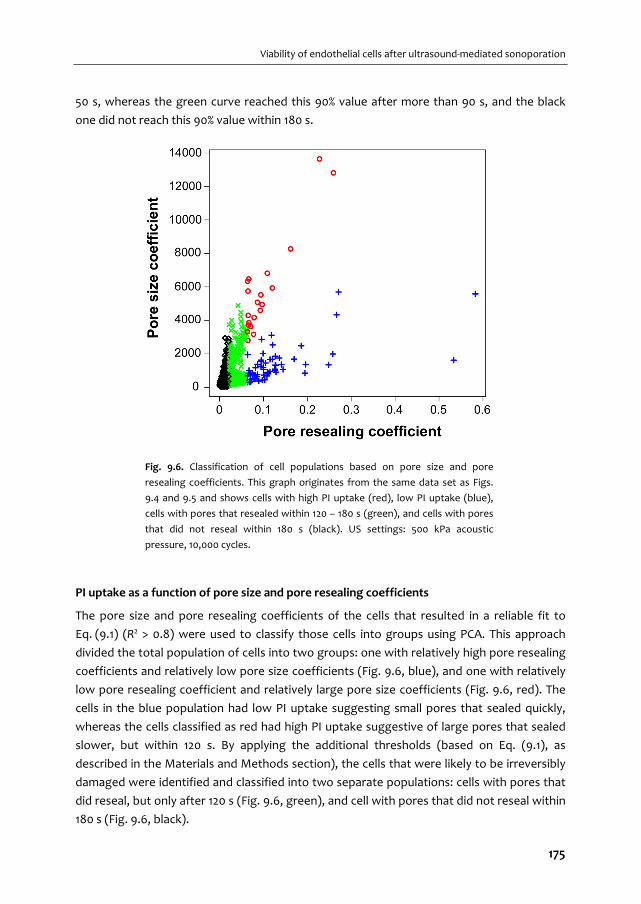
Viability of endothelial cells after ultrasound‐mediated sonoporation
50 s, whereas the green curve reached this 90% value after more than 90 s, and the black
one did not reach this 90% value within 180 s.
PI uptake as a function of pore size and pore resealing coefficients
The pore size and pore resealing coefficients of the cells that resulted in a reliable fit to
Eq. (9.1) (R2 > 0.8) were used to classify those cells into groups using PCA. This approach
divided the total population of cells into two groups: one with relatively high pore resealing
coefficients and relatively low pore size coefficients (Fig. 9.6, blue), and one with relatively
low pore resealing coefficient and relatively large pore size coefficients (Fig. 9.6, red). The
cells in the blue population had low PI uptake suggesting small pores that sealed quickly,
whereas the cells classified as red had high PI uptake suggestive of large pores that sealed
slower, but within 120 s. By applying the additional thresholds (based on Eq. (9.1), as
described in the Materials and Methods section), the cells that were likely to be irreversibly
damaged were identified and classified into two separate populations: cells with pores that
did reseal, but only after 120 s (Fig. 9.6, green), and cell with pores that did not reseal within
180 s (Fig. 9.6, black).
Fig. 9.6. Classification of cell populations based on pore size and pore
resealing coefficients. This graph originates from the same data set as Figs.
9.4 and 9.5 and shows cells with high PI uptake (red), low PI uptake (blue),
cells with pores that resealed within 120 – 180 s (green), and cells with pores
that did not reseal within 180 s (black). US settings: 500 kPa acoustic
pressure, 10,000 cycles.
175
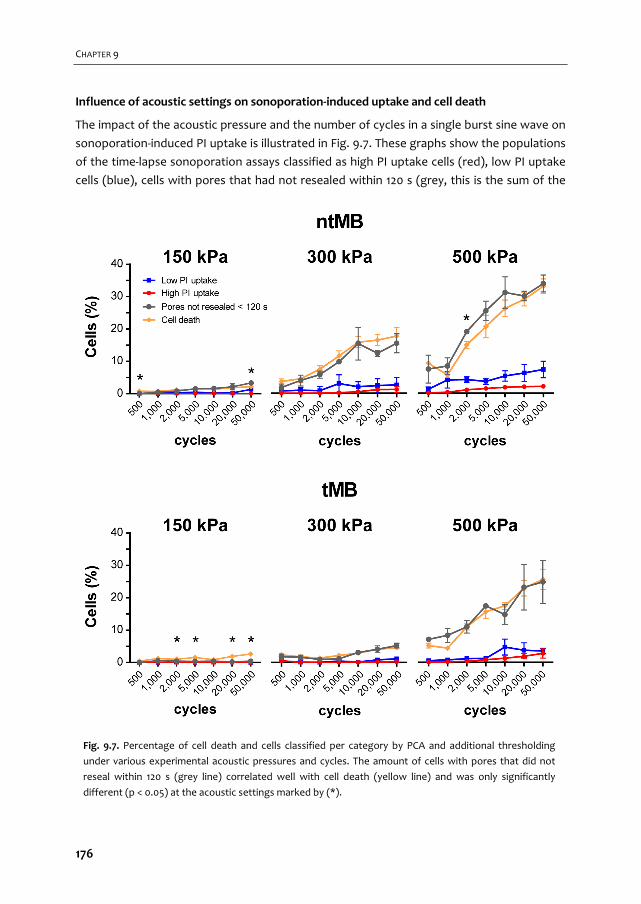
CHAPTER 9
Influence of acoustic settings on sonoporation‐induced uptake and cell death
The impact of the acoustic pressure and the number of cycles in a single burst sine wave on
sonoporation‐induced PI uptake is illustrated in Fig. 9.7. These graphs show the populations
of the time‐lapse sonoporation assays classified as high PI uptake cells (red), low PI uptake
cells (blue), cells with pores that had not resealed within 120 s (grey, this is the sum of the
Fig. 9.7. Percentage of cell death and cells classified per category by PCA and additional thresholding
under various experimental acoustic pressures and cycles. The amount of cells with pores that did not
reseal within 120 s (grey line) correlated well with cell death (yellow line) and was only significantly
different (p < 0.05) at the acoustic settings marked by (*).
176
Viability of endothelial cells after ultrasound‐mediated sonoporation
cells previously classified as green or black), and cell death (yellow) determined from the
cell viability assays for each corresponding treatment. The cells with pores that did not
reseal within 120 s were expected to be dead, and statistical comparison with cell death
indeed confirmed that these two populations were not significantly different except for a
few settings, mainly those with very low amounts of sonoporated cells (indicated by () in Fig. 9.7). The proportion of cells with low and high PI uptake (blue and red, respectively)
significantly increased with increasing pressure, but did not significantly increase when only
more cycles were applied. These cells were determined to be reversibly sonoporated and
viable. On the other hand, the amount of cells with slow resealing pores (> 120 s, grey) and
cell death (yellow), continued to increase with increasing pressure and cycles. Only
increasing the number of cycles resulted in more cell death, but not necessarily in more cells
that were viably sonoporated.
Oscillatory behavior of microbubbles
The ultra‐high‐speed movies recorded by the Brandaris 128 camera were qualitatively
analyzed per segment. For each segment the number of single MBs and the number of MB
clusters were counted and classified into four categories: 1) non‐oscillating (white), 2)
oscillating (dark grey), 3) oscillating with coalescence of MBs (black), and 4) oscillating with
separation of MBs (light grey), as illustrated in Fig. 9.8. The time line shows the US signal
(for visualization purposes, only 20 cycles are shown in the schematic instead of the 1,000
cycles that were actually applied) and the segments of the US pulse at which the ultra‐high‐
speed movies were recorded. The FOV of Brandaris is smaller than that of the AxioCam or
Redlake camera, therefore we could only study oscillatory behavior of a subset of MBs.
When ntMBs were insonified at 150 kPa and 1,000 cycles, more single MBs were counted
than MB clusters. In the first segment about 60% of single MBs oscillated, whereas > 90% of
MB clusters were oscillating. Towards the end of the US burst, only 25% of single MBs and
60% of MB clusters were still oscillating. From segment a to segment b most coalescence
occurred (black). At a pressure of 300 kPa, more ntMBs oscillated: 75% of single MBs and all
MB clusters. The higher pressure ensured that MBs below resonance, i.e. smaller MBs, also
started oscillating. In segment a and b, most clusters coalesced into larger clusters that kept
oscillating until the end of the US pulse. This higher degree of clustering was probably
caused by more displacement of MBs, due to higher acoustic radiation forces. At the end of
the pulse, in segment 4, the large clusters split into smaller clusters or single MBs.
177
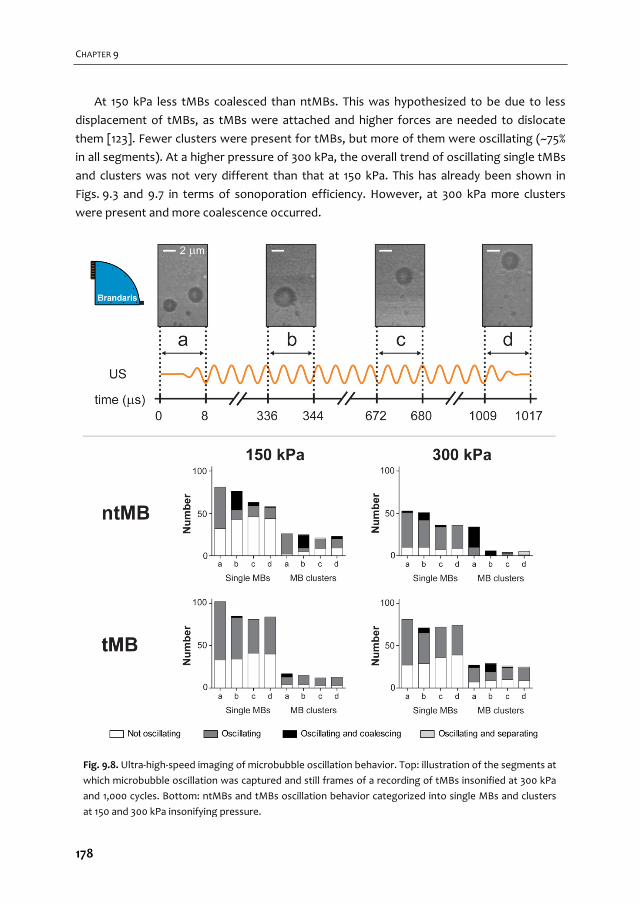
CHAPTER 9
At 150 kPa less tMBs coalesced than ntMBs. This was hypothesized to be due to less
displacement of tMBs, as tMBs were attached and higher forces are needed to dislocate
them [123]. Fewer clusters were present for tMBs, but more of them were oscillating (~75%
in all segments). At a higher pressure of 300 kPa, the overall trend of oscillating single tMBs
and clusters was not very different than that at 150 kPa. This has already been shown in
Figs. 9.3 and 9.7 in terms of sonoporation efficiency. However, at 300 kPa more clusters
were present and more coalescence occurred.
Fig. 9.8. Ultra‐high‐speed imaging of microbubble oscillation behavior. Top: illustration of the segments at
which microbubble oscillation was captured and still frames of a recording of tMBs insonified at 300 kPa
and 1,000 cycles. Bottom: ntMBs and tMBs oscillation behavior categorized into single MBs and clusters
at 150 and 300 kPa insonifying pressure.
178
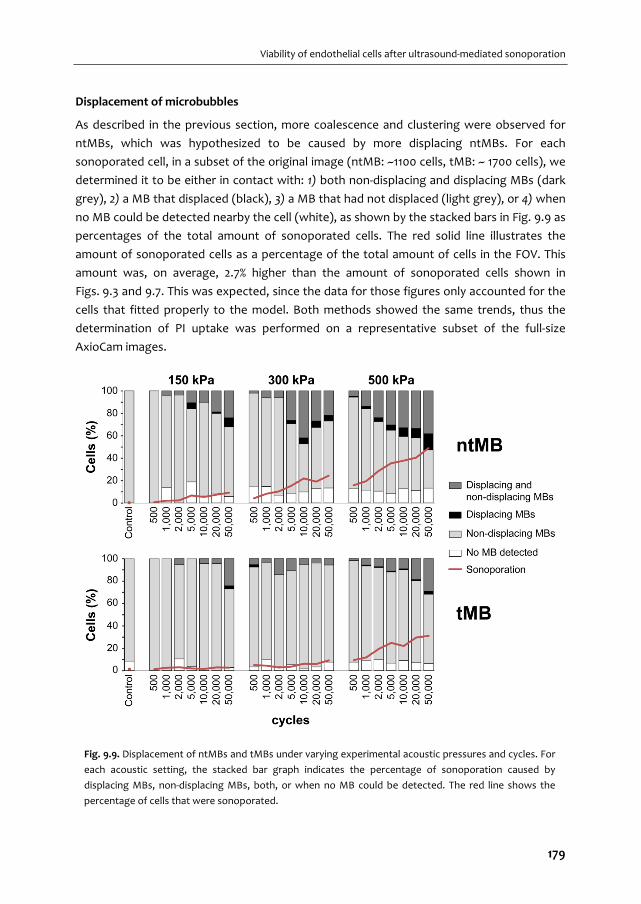
Viability of endothelial cells after ultrasound‐mediated sonoporation
Displacement of microbubbles
As described in the previous section, more coalescence and clustering were observed for
ntMBs, which was hypothesized to be caused by more displacing ntMBs. For each
sonoporated cell, in a subset of the original image (ntMB: ~1100 cells, tMB: ~ 1700 cells), we
determined it to be either in contact with: 1) both non‐displacing and displacing MBs (dark
grey), 2) a MB that displaced (black), 3) a MB that had not displaced (light grey), or 4) when
no MB could be detected nearby the cell (white), as shown by the stacked bars in Fig. 9.9 as
percentages of the total amount of sonoporated cells. The red solid line illustrates the
amount of sonoporated cells as a percentage of the total amount of cells in the FOV. This
amount was, on average, 2.7% higher than the amount of sonoporated cells shown in
Figs. 9.3 and 9.7. This was expected, since the data for those figures only accounted for the
cells that fitted properly to the model. Both methods showed the same trends, thus the
determination of PI uptake was performed on a representative subset of the full‐size
AxioCam images.
Fig. 9.9. Displacement of ntMBs and tMBs under varying experimental acoustic pressures and cycles. For
each acoustic setting, the stacked bar graph indicates the percentage of sonoporation caused by
displacing MBs, non‐displacing MBs, both, or when no MB could be detected. The red line shows the
percentage of cells that were sonoporated.
179
CHAPTER 9
Overall, most sonoporation was induced by non‐displacing MBs (light grey, Fig. 9.9),
whereas for ntMBs at 500 kPa and 50,000 cycles both displacing and non‐displacing MBs
accounted for similar amounts of sonoporation. The use of ntMBs resulted in the highest
amount of displacing MBs, which supports the previously stated hypothesis that the higher
degree of clustering was due to more displacing MBs. Overall, when comparing the
contribution of displacing MBs (dark grey and black in Fig. 9.9) to the amount of
sonoporated cells (red line in Fig. 9.9), they followed the same trend.
To relate MB displacement to sonoporation outcome, we compared the two cell
classifications: 1) reversibly sonoporated cells that had resealing pores < 120 s (Fig. 9.7, blue
and red lines) and 2) irreversibly sonoporated cells (Fig. 9.7, grey line) with A) cells that were
sonoporated by displacing MBs (Fig. 9.9, dark grey and black) and B) those that were
sonoporated by non‐displacing MBs (Fig. 9.9, dark grey and light grey as shown in Fig. 9.10).
The slope of the linear fit shows the ratio of increase between two groups; a ratio of 1
implies that the values are identical and increase proportionally (data follows the line y = x).
A proportional increase was found for the amount of irreversibly sonoporated cells and
the amount of cells that were sonoporated by non‐displacing MBs (slope 1.0 for ntMB in
Fig. 9.10A; slope 1.1 for tMB in Fig. 9.10B, both R2 = 0.99). In addition, the amount of
sonoporated cells that was in contact with non‐displacing MBs (Fig. 9.10C and D) increased
four times faster than the amount of reversibly sonoporated cells (slope of 3.7 and 4.1,
respectively). This strongly suggest that cells in contact with non‐displacing MBs were
irreversibly damaged.
On the other hand, the amount of sonoporation for cells in contact with displacing
ntMBs increased twice as fast as the amount of reversibly sonoporated cells (Fig. 9.10G,
slope of 2.1), while still contributing to irreversible sonoporation (Fig. 9.10E, slope of 0.57).
This suggest that displacing ntMBs can both induce reversible and irreversible
sonoporation. For cells in contact with displacing tMBs the amount of reversibly
sonoporated cells increased proportionally (Fig. 9.10H, slope of 1.0). Further, displacing
tMBs minimally contributed to irreversible sonoporation (Fig. 9.10F, slope of 0.27). This
suggests that displacing tMBs mainly resulted in reversible sonoporation.
The relation between the presence of displacing and non‐displacing MBs and the
classification of cells was confirmed on a single cell basis, as shown in Fig. 9.11 and Fig. 9.5.
Cells 1 and 2 were both reversibly sonoporated due to MBs displacing over their cell
membranes, of which cell 1 had high PI uptake and cell 2 low uptake. Cell 1 also had non‐
displacing MBs in its vicinity, which might be the reason for the higher uptake of PI. Cells 3
and 4 had slow resealing pores (> 120 s) and only non‐displacing MBs nearby their cell
membranes.
180

Viability of endothelial cells after ultrasound‐mediated sonoporation
Fig. 9.10. Scatter plots visualizing the relation between MB displacement and sonoporation
outcome. The slope of the linear fit shows the ratio of increase between each two groups.
Blue circles are the experimental data points at all 21 acoustic settings, the black dashed line
the linear fit. Irreversible sonoporation is the grey data set from Fig. 9.7; reversible
sonoporation is the sum of the red and blue data sets from Fig. 9.7.
181

CHAPTER 9
Orientation of tMBs
For all experiments concerning ntMBs, the cells were on the upper membrane of the
OptiCell with the MBs floating against the cells. For the tMB experiments described so far,
the cells were on the bottom membrane with the tMBs adhered on top of the cells. In
addition to the comparison between ntMBs and tMBs, we also investigated the effect of
the orientation of tMBs with respect to the cells and US application. We therefore placed
the OptiCell containing tMBs in the same orientation as the experiments on ntMBs, so the
cells were on the upper membrane with the tMBs below the cells (tMBB). These
experiments were repeated two times at 500 kPa for all investigated number of cycles with
on average 3,106 (± 139) cells in the FOV.
The amount of US‐induced sonoporated cells with tMBB was higher than for the control
experiments for the four settings with the smallest error bars: 1,000; 2,000; 10,000; and
50,000 cycles. Although, especially for the longer pulses, tMBB seemed to more efficiently
sonoporate cells than both tMBs and ntMBs, this was not statistically significant for most
cycles. Only with 10,000 cycles were tMBB more efficient than ntMBs (); and only with 500
cycles were tMBB more efficient than tMB (o) (Fig. 9.12A, p < 0.05). Cell death for tMBB was
significantly higher than for the tMBB controls after applying 2,000; 5,000; 20,000; and
50,000 cycles. In addition, cell death and the total amount of sonoporated cells were
significantly different for all experimental settings. For most settings cell death of tMBB was
similar to ntMBs or tMBs, except for 1,000 cycles with ntMBs () and 1,000 and 2,000 cycles with tMBs (o) as shown in Fig. 9.12B. Cell death controls are not shown, since these were
subtracted from cell death at the other settings to correct for natural cell death.
Fig. 9.11. Microbubble displacement. White arrows indicate displacing ntMBs and blue filled
circles indicate non‐displacing ntMBs, overlaid on the same PI stained image as shown in Fig.
9.4G. Cells 1‐4 (yellow lines) are the same ones as shown in Figs. 9.4 and 9.5. MB displacement
was not correlated to the direction of US application. US settings: 500 kPa acoustic pressure,
10,000 cycles. Scale bar indicates 30 μm.
182
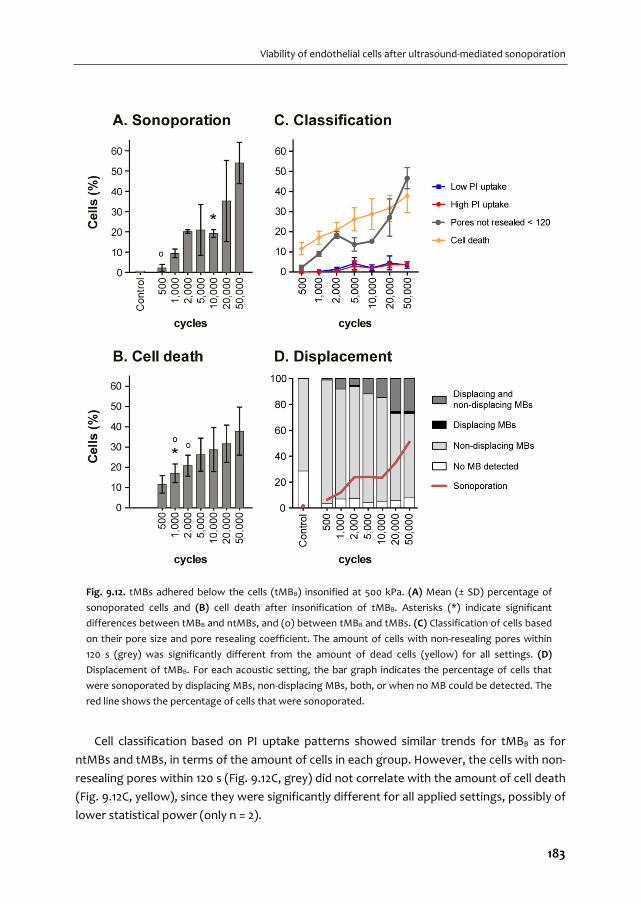
Viability of endothelial cells after ultrasound‐mediated sonoporation
Cell classification based on PI uptake patterns showed similar trends for tMBB as for
ntMBs and tMBs, in terms of the amount of cells in each group. However, the cells with non‐
resealing pores within 120 s (Fig. 9.12C, grey) did not correlate with the amount of cell death
(Fig. 9.12C, yellow), since they were significantly different for all applied settings, possibly of
lower statistical power (only n = 2).
Fig. 9.12. tMBs adhered below the cells (tMBB) insonified at 500 kPa. (A) Mean (± SD) percentage of
sonoporated cells and (B) cell death after insonification of tMBB. Asterisks (*) indicate significant
differences between tMBB and ntMBs, and (o) between tMBB and tMBs. (C) Classification of cells based
on their pore size and pore resealing coefficient. The amount of cells with non‐resealing pores within
120 s (grey) was significantly different from the amount of dead cells (yellow) for all settings. (D)
Displacement of tMBB. For each acoustic setting, the bar graph indicates the percentage of cells that
were sonoporated by displacing MBs, non‐displacing MBs, both, or when no MB could be detected. The
red line shows the percentage of cells that were sonoporated.
183

CHAPTER 9
As expected, displacement of tMBB was very similar to the displacement of tMBs
(Fig. 9.12D and Fig. 9.9), since the binding strength that has to be overcome to displace
them is identical.
9.5. DISCUSSION
This is the first study that directly compares ntMB and tMB‐mediated sonoporation in
primary endothelial cells in vitro using long acoustic pulses (500 – 50,000 cycles). At 1 MHz
and three different acoustic pressures (150 ‐ 500 kPa), we aimed to identify differences in
MB behavior responsible for either viable sonoporation or cell death. The real‐time
observed uptake of PI upon sonoporation was fit using a previously reported diffusion
model [34] and subsequently classified using PCA. Cell viability highly correlated with the
four different PI uptake patterns derived from this classification. Further, displacing tMBs
resulted in viably sonoporated cells, whereas non‐displacing tMBs and ntMBs accounted for
more cell death.
Cellular response dynamics
Four cell populations with different PI uptake profiles were found for ntMB and tMB‐
mediated sonoporation at each US setting. The cells that had non‐resealing pores within
120 s after US application were irreversibly damaged (Fig. 9.7, grey) as this correlated well
with cell death (Fig. 9.7, yellow). Further, cells having low PI uptake (Fig. 9.7, blue) and high
PI uptake (Fig. 9.7, red) had pores that resealed within 120 s. Other researchers have shown
that cells remained viable when pores resealed within a few seconds up to 60 s [37, 38, 422].
However, these studies were not performed on human endothelial cells, but on human
fibroblasts [38], bovine endothelial cells [37], and Xenopus oocytes [422]. Enhanced drug
uptake up to several hours has also been reported [423, 424], but cells having non‐resealed
pores for such long periods are not expected to be viable. We therefore believe that the
route of model drug uptake in their experiments was most likely not due to pore formation,
but possibly stimulated endocytosis. Our results suggest that human endothelial cells
showing increasing nuclear PI signal up to 120 s were also viably sonoporated. This may
imply that pores open for longer than 60 s can still result in viably sonoporated cells.
Cells that had taken up PI also showed an efflux of calcein, which is another indicator of
sonoporation [34]. Next to calcein efflux, those cells also revealed lower Hoechst signals in
the fluorescence images taken after US treatment than in those taken before (Fig. 9.4).
Since the literature agrees upon non‐competitive binding of PI and Hoechst [412, 413], we
believe this decrease in signal was caused by Förster resonance energy transfer (also known
as FRET) [425]. The emission spectrum of Hoechst (maximum intensity at 461 nm) overlaps
with the excitation spectrum of PI (491 ‐ 495 nm); the presence of PI can therefore result in
considerable quenching of the Hoechst signal [426]. Hoechst signal intensity was therefore
184
Viability of endothelial cells after ultrasound‐mediated sonoporation
lower in cells that had taken up PI. In addition, the amount of PI uptake was found to be
related to the level of quenching; cells 1, 3, and 4 had high PI uptake (Fig. 9.4G) and Hoechst
signal was almost completely quenched (Fig. 9.4F), whereas cell 2 had low PI uptake and
less quenching of Hoechst signal.
Influence of oscillation and displacement of microbubbles
Quantitative assessment of the displacement of MBs revealed more PI uptake when more
tMBs or ntMBs displaced (Fig. 9.9). We studied the relation between MB displacement and
reversibility of sonoporation and found a clear relation between non‐displacing MBs and
irreversible sonoporation (Fig. 9.10A and 9.10B); an increase in sonoporation by non‐
displacing MBs coincides with a similar increase in irreversible sonoporation. We therefore
concluded that irreversible sonoporation was mainly caused by non‐displacing MBs,
explained by prolonged MB oscillation at the same location on the cell membrane. The
relation between displacing MBs and sonoporation is less straightforward. For ntMBs
(Fig. 9.10G) the amount of cells sonoporated by displacing ntMBs increased twice as fast as
those that were reversibly sonoporated (slope of 2.1), which implies that displacing ntMBs
did not only induce reversible sonoporation, but also irreversible sonoporation (Fig. 9.10E).
Because longer pulses at higher acoustic pressure cause more displacement, the ntMBs can
affect multiple cells or multiple displacing ntMBs can affect a single cell.
For tMBs we found an increase in reversible sonoporation that coincides with a similar
increase in sonoporation caused by displacing tMBs (Fig. 9.10H). We therefore conclude
that displacing tMBs mainly resulted in reversible sonoporation. The amount of irreversibly
sonoporated cells by displacing tMBs is much smaller than for ntMBs (compare Fig. 9.10E
and 9.10F). When tMBs detach and displace, they float away from the cells and will not
contribute to more sonoporation.
Displacing tMBs resulted mainly in reversible sonoporation, whereas the much larger
amount of displacing ntMBs also induced irreversible sonoporation. This may imply that
reversibility is only achieved with limited displacement of MBs. Fan et al. [403, 405]
concluded that displacement of both ntMBs and tMBs correlated with irreversible
sonoporation, while we related displacement to reversibility. This difference may be
explained by larger MB displacements in their study because they used pulsed US (1.25 MHz,
60‐600 kPa, PRF 10‐1,000 Hz, duty cycles 0.016‐20%), whereas the single US burst we used
resulted in less and slower displacement for the second half of the pulse (Fig. 9.8).
In the high‐speed and ultra‐high‐speed recordings we observed clustering of MBs.
Higher pressures enhanced cluster formation, and ntMBs formed more clusters because
they displaced more than tMBs. Since the amount of sonoporated cells was similar for
ntMBs and tMBs (Fig. 9.3), clustering did thus not result in more sonoporation.
Mannaris and Averkiou [427] were the first to show acoustically that MBs remained
oscillating during 1,000 acoustic cycles at 100 kPa. Our ultra‐high‐speed recordings revealed
185

CHAPTER 9
the presence and oscillation of both single MBs and MB clusters at the end of the 1,000‐
cycle US burst at 150 and 300 kPa, albeit that we observed more oscillating MB clusters at
the end of the US pulse than single MBs. Chen, et al. [370] reported contrasting
observations. After 1,000 cycles their ultra‐high‐speed recordings only showed oscillating
clusters; no single MBs were present anymore. The most likely cause for these different
findings is the high pressure (up to 1.5 MPa) they applied, which resulted in more
displacement due to acoustic radiation force [81, 392] and more clustering.
Sonoporation efficiency: ntMB versus tMB
The sonoporation efficiency of ntMB and tMB showed the same trend: higher pressures and
more cycles resulted in more sonoporation (Fig. 9.3), as also shown by others [40, 41].
However, for tMBs the amounts of sonoporated and dead cells at 300 kPa were lower than
for ntMBs, which is most likely caused by MB displacement or oscillation behavior.
Increasing the pressure from 150 to 300 kPa resulted in more displacing ntMBs, but the
number of displacing tMBs did not increase (Fig. 9.9). In addition, the ultra‐high‐speed
recordings showed more oscillating ntMBs for increasing pressure, while no change was
observed for tMBs (Fig. 9.8). This is caused by functionalization of our tMBs with CD31
antibodies via streptavidin‐biotin binding, but we did not add streptavidin nor control‐
antibodies to our ntMBs, as clinical ntMBs would not have this either. Functionalization of
MBs alters shell properties [262] and therefore oscillation behavior [260]. Since our tMBs
and ntMBs had identical lipid shells with DSPC as the main lipid, the targeting moieties
would result in a higher elasticity and thus a stiffer shell of our tMBs [262]. As a
consequence, higher pressures are required for tMBs to obtain the same oscillation
amplitude as for ntMBs [45], which likely influences sonoporation efficiency.
The sonoporation experiments with tMBs at 500 kPa and 10,000 to 50,000 cycles
showed very large error bars (Fig. 9.3C). Two of the OptiCells in which the experiments
were done showed similar uptake percentages, but the amount of sonoporated cells in the
third OptiCell was almost twice as high. The underlying cause for this observation is unclear;
all cell layers were confluent, the total amount of cells and MB concentration was similar, as
well as the average number of MBs per cell. Hence, we can only conclude that sonoporation
caused by tMBs is less predictable than by ntMBs.
Our findings, that in general tMBs did not induce higher PI uptake than ntMBs,
contradict other in vitro studies that report tMBs to be more efficient for drug delivery than
ntMBs in a direct comparison. The five reported in vitro studies [232, 234, 235, 238, 239] all
show that the lipid‐shell tMBs are 1.1 [238] to 7.7 [239] fold more efficient for drug delivery
than ntMBs. Four out of these five studies describe drug‐loaded MBs (with paclitaxel or
plasmid DNA), the other one describes co‐administration of PI [232]. A direct comparison
between our study and the five reported studies is difficult, due to the differences in
experimental conditions. None of these studies assessed MB‐mediated drug delivery in
186
Viability of endothelial cells after ultrasound‐mediated sonoporation
endothelial cells. Instead, smooth muscle [234] or cancer cells were used. The study that
reported the largest difference between ntMBs and tMBs, rinsed the cells to remove free
MBs that had not adhered [239]. As a result, the ntMBs would almost all have been washed
away, which could explain the large difference. Another study treated cancer cells in
suspension [235], whereas we treated a fully confluent monolayer of endothelial cells. Two
studies [235, 238] used ntMBs with a different shell composition and smaller mean diameter
than their tMBs, which without doubt results in differences in MB behavior [45, 259, 260]. In
addition, one study reported that the 5.5 fold higher uptake could only be achieved with 70%
confluent cells [234]. Consequently, our results are not supported by other studies, since
none directly compared ntMB and tMB‐mediated drug delivery in endothelial cells in vitro.
Several studies reported more efficient drug delivery or transfection in vivo for tMBs than
for ntMBs [236, 237, 240, 241]. Due to blood flow, ntMBs flow by and thus have shorter
contact with tissue, thereby making ntMBs less efficient. Inclusion of flow in the in vitro
experiments is thought to result in more efficient sonoporation for tMB than for ntMB and
will be subject for future studies.
Microbubble orientation
We used a different orientation of MBs relative to the cells and US direction for tMBs and
ntMBs (Fig. 9.1B and Fig. 9.12). Therefore, the ntMBs could have been pushed towards the
cells by the US, while the tMBs could have been pushed away from the cells. To study
whether this influenced sonoporation efficiency, we performed experiments with tMBs in
the same orientation as the ntMBs, which we referred to as tMBB (tMB below cells).
Because tMBB adhered below the cells, non‐adhered tMBB would also be in contact with the
cells and could have contributed to sonoporation as well. Higher amounts of non‐adhered
tMBB would results in more displacing tMBB and thus enhance sonoporation. However,
since the amounts of tMBB and tMBs in the FOV were the same (~3,100 cells), we can
assume that all tMBB had adhered and that non‐adhered tMBB did not account for the
variation in PI uptake.
Sonoporation efficiency for tMBB seemed higher than for tMBs (compare Fig. 9.3C and
Fig. 9.12A), possibly caused by MBs that detached during insonification and remained in
contact with the cells. In contrast, the configuration for tMBs allowed them to float away
after detachment. The sonoporation efficiency, however, was not significantly different to
conclude that tMBB were more efficient than tMBs. To the best of our knowledge, no
previously published studies investigated the orientation of MBs relative to the cells and US
direction. Others that directly compared the effect of ntMBs and tMBs either did not
mention the orientation [235, 238], had the MBs on top of the cells with US applied from the
MB‐side [239], or had the MBs below the cells and applied US from below [232, 234].
187

CHAPTER 9
Experimental considerations
To obtain the amount of sonoporation from the nuclear PI uptake and the associated model
fit, we used algorithms implemented in ImageJ and RStudio, whereas a different algorithm
in Python was used to obtain sonoporation from PI uptake in the entire cell and its relation
to displacing and non‐displacing MBs. Although this is not ideal, we chose this approach to
optimally utilize the strengths of each method: segmentation (ImageJ) and tracking of
moving particles (Python). Since both methods relied heavily on correct detection of cell
nuclei, we manually counted the nuclei on the Hoechst images and compared this to the
outcomes of the ImageJ and Python algorithms: both detected, on average, only 6% of the
nuclei incorrectly (n = 6 images). Since the errors were small, the additional analyses were
expected to be comparable as well. Indeed, the segmented cell borders by Voronoi
tessellation closely overlapped between the two methods. As already mentioned,
sonoporation was slightly higher (2.7% on average) for the tracking method in Python, than
for the more robust fitting method using RStudio. This was caused by additional detection
of cytoplasmic PI uptake and by cells of which the model could not be fit (R2 < 0.8) to the
nuclear uptake profile.
In contrast to the paper by Fan et al. [34], we did not calculate the size of the pores,
since not all parameters of our system were known. However, if we would have done this,
possible multiple pores in a single cell could still have been detected as one larger pore. In
addition, we only included PI uptake in the nucleus because determination of the cell
borders was based on probability, whereas the nucleus could be more precisely segmented
from the Hoechst images.
On average, 7.4% of sonoporated cells that were found using the tracking algorithm
were classified as being sonoporated without the presence of a MB nearby (Fig. 9.9, white).
Since control experiments with only MBs showed sonoporation of < 0.9% of all cells, this
was not caused by spontaneous uptake of PI, but most likely due to the size of the MBs—
only a few pixels in diameter—and the quality of the images. Accurately detecting ntMBs
was more difficult due to the optical focus in the corresponding bright field images; the cells
were better in focus, resulting in lower discriminative power between cell structures and
MBs. The error for ntMB detection was therefore higher. Manual counting of the number of
MBs that was not counted by the algorithm resulted in an average of 9% more MBs per
image (n = 9). This is slightly higher than the average amount of sonoporated cells without
MBs nearby, because MBs that were in contact with non‐sonoporated cells could have also
been missed.
Limitations of this study
A limitation to our study is the use of CD31 as the ligand on our tMBs, because this is a
constitutively expressed adhesion molecule on endothelial cells [428]. It can therefore not
be used in vivo, since CD31‐tMBs would adhere to the entire vasculature. Also, the MBs
188
Viability of endothelial cells after ultrasound‐mediated sonoporation
circulate within the vasculature in vivo, while we performed our studies under static
conditions. Flow is expected to have an influence on the sonoporation efficiency, as ntMBs
will be taken away by the flow, while tMBs will still adhere to the cells under flow [301]. A
higher sonoporation efficiency for tMBs is therefore expected and shown [236, 237, 241]
under flow and in vivo conditions.
Therapeutic applications
Based on our results, ntMBs exposed to an acoustic pressure of 500 kPa and a pulse length
of 1,000 cycles would be most beneficial for drug delivery. These settings resulted in
relatively high amounts of viably sonoporated cells (Fig. 9.7, blue) and minimal cell death
(Fig. 9.7, grey/yellow). For drug delivery, high drug uptake would be most beneficial since
higher doses of therapeutics can be delivered (Fig. 9.7, red). Nevertheless, we always
observed equal or lower red uptake patterns in comparison to the blue uptake patterns of
lower PI uptake, implying there is not one US setting that favors one over the other. On the
other hand, for therapeutic applications where high cell death is desired, e.g. cancer
therapies, high pressures and long pulses should be applied (e.g., 500 kPa and 50,000
cycles). Both tMBs and ntMBs were shown to effectively kill cells, but ntMBs were more
efficient. For therapies requiring sonoporation of specific cells under flow, ntMBs would
need to be replaced with tMBs. ntMBs could sonoporate cells as they move along the cells,
or when pressed against a thrombus occluding a blood vessel, as in the case of
sonothrombolysis [296, 429]. On the other hand, for locally enhanced drug delivery in
tumors tMBs are required, since the MBs need to be close to the cell membrane [37, 242].
Hence, the choice of using either ntMBs or tMBs highly depends on the desired therapeutic
application.
9.6. CONCLUSION
In depth sonoporation studies on the effect of longer acoustic pulses at 1 MHz at different
acoustic pressures revealed a clear relation between sonoporation efficiency and MB
behavior. Different patterns of PI uptake derived from the diffusion model and subsequent
classification using PCA highly correlated with cell viability. Limited displacement of the MBs
enhanced drug delivery and preserved cell viability, while non‐displacing MBs were the main
contributor to cell death. Longer pulses resulted in more dead cells, but did not result in
significant increase in viably sonoporated cells. In addition, the effect of the same type of
ntMBs and tMBs to sonoporate endothelial cells was similar in vitro under static conditions.
Acknowledgements
The authors thank Robert Beurskens, Frits Mastik, Michiel Manten, and Geert Springeling
from the department of Biomedical Engineering, Thoraxcenter, Erasmus MC, the
189
CHAPTER 9
Netherlands for technical assistance. This work is financially supported by NanoNextNL, a
micro‐ and nanotechnology consortium of the Government of the Netherlands and 130
partners and by the Dutch Technology Foundation STW (Veni‐project 13669), which is part
of the Netherlands Organization for Scientific Research (NWO), and which is partly funded
by the Ministry of Economic Affairs.
190
Laser‐activated polymer
microcapsules for acoustic imaging and therapy:
an in vitro feasibility study
Tom van Rooij*, Guillaume Lajoinie*, Ilya Skachkov, Emilie Blazejewski, Gert Veldhuis, Nico de Jong, Klazina Kooiman, Michel Versluis (* both first authors contributed equally) Biophysical Journal (2016) – Submitted
10 Chapter
191

CHAPTER 10
10.1. ABSTRACT
Polymeric microcapsules with a light‐absorbing dye incorporated in their shell can generate
vapor microbubbles that can be spatiotemporally controlled by pulsed laser irradiation.
These contrast agents of 6‐8 μm in diameter can circulate through the vasculature offering
possibilities for ultrasound (molecular) imaging and targeted therapies. Here, we study the
impact of such vapor bubbles on human endothelial cells in terms of cell poration and cell
viability to establish the imaging and therapeutic windows. Two capsule formulations were
used: the first one consisted of a high boiling point oil (hexadecane), whereas the second
was loaded with a low boiling point oil (perfluoropentane, PFP). Poration probability was
already 40% for the smallest bubbles that were formed (< 7.5 µm diameter), and reached
100% for the larger bubbles. The hexadecane‐loaded capsules also produced bubbles while
their shell remained intact. These encapsulated bubbles could therefore be used for non‐
invasive ultrasound imaging after laser‐activation without inducing any cell damage. The
controlled and localized cell destruction achieved by activation of both capsule formulations
may provide an innovative approach for specifically inducing cell death in vivo, e.g for
cancer therapy.
10.2. INTRODUCTION
Commercially available ultrasound (US) contrast agents are primarily based on the highly
echogenic scattering of small stabilized gas spheres called microbubbles [314], for contrast
enhancement of the blood [313]. Next to contrast enhancement, microbubbles have also
been functionalized with targeting moieties that can adhere to specific clinically relevant
biomarkers [69, 262], hereby extending the applicability of microbubbles to molecular
imaging with US. Ultrasound contrast agents have also been developed that can be loaded
with drugs [45, 430] for improved delivery of genetic material and drug molecules to cells
[28, 36, 45, 431] for theranostic applications [237, 432, 433]. This improved delivery to cells is
enabled by microbubble oscillations that cause increased membrane permeability, termed
sonoporation [36, 45], which is considered as one of the most promising routes for US‐
mediated drug delivery [36].
The efficiency of ultrasound contrast agents for drug delivery has been shown in vivo
[434‐436], and extensive literature can be found that investigates the mechanisms by which
drugs are delivered to cells through the use of microbubbles and US [33, 35, 38, 41, 372, 422,
437, 438]. Although the mechanisms are still not fully understood, these studies clearly
showed that microbubble oscillations are key to a locally increased cell membrane
permeability resulting in enhanced drug delivery. However, a delicate balance between drug
delivery achieved through viable sonoporation and cell death has been shown [38, 372].
These studies reported that the therapeutic windows of irreversible sonoporation resulting
in cell death and reversible sonoporation resulting in viable cells suitable for drug delivery,
192
Laser‐activated polymer microcapsules
are associated with oscillation and displacement of microbubbles [372], and with the size of
the resulting pore [38].
Oscillation of microbubbles can either result in stable or inertial cavitation, both of
which play a role in enhancing sonoporation [439]. Next to microbubbles, other types of
agents such as phase‐change droplets [440], polymer nanoparticles [441] and microparticles
[45, 442] can also induce cavitation. In contrast to microbubbles, these agents offer longer
shelf life and prolonged stability [443]. Unlike microbubbles that are confined to the blood
pool, polymeric particles can be made small enough to extravasate into the interstitial tissue
[444, 445]. These polymeric micro‐ and nanoparticles also offer an unprecedented
versatility; they can, for example, carry a larger drug payload in their hydrophobic core than
microbubbles [14], they can stably entrap a multitude of elements such as metallic
nanoparticles [446], generate gas by hydrolysis of the shell material [447], or be shaped as a
porous matrix to be stable under sustained US exposure [448]. On the other hand,
polymeric microparticles have been shown to be less responsive to US than microbubbles
due their stiffer shell, which makes US imaging of intact polymeric microcapsules
challenging [13, 21].
To investigate the potential for laser activation of liquid particles and to improve their
imaging capabilities, previous studies have incorporated light absorbers either in
perfluorocarbon droplets [58] as plasmonic nanoparticles or as a dye in the shell of
polymeric capsules [57]. It was shown that single polymeric capsules can be triggered by a
laser, leading to vaporization and the formation of a bubble. The scattering strength of
these vapor bubbles is promising for US imaging applications. Downsizing the polymeric
capsules to nanometer sizes would allow them to extravasate into tumor tissue, which lies
beyond the endothelial cell layer lining the blood vessels and which may open up
possibilities for delivering cytostatics into the tumor [449]. Additionally, the use of an oil
with a low boiling point (i.e. perfluoropentane) appears as a viable approach to reduce the
vaporization threshold of these light‐absorbing particles below the FDA‐approved laser
intensity limit [450]. Until now, little is known on the biological effects of such confined and
controlled vaporization events in the vicinity of cells and the imaging and therapeutic
windows have to be assessed before these agents can be further developed for clinical use.
Here, we designed an experiment to study the effects of laser‐induced vaporization
bubbles in vitro, created by two types of light‐absorbing polymeric microcapsules. The first
type of capsules is loaded with a high boiling point oil (hexadecane) and the second type
contains a low boiling point oil (perfluoropentane). By means of ultra‐high‐speed bright
field imaging combined with fluorescence imaging, we studied the effects of these laser‐
activated polymeric microcapsules on human endothelial cells, and we particularly assessed
the resulting effect of the created vapor bubbles on the cells. All measured quantities were
therefore considered as a function of the vapor bubble properties, e.g. size and lifetime. For
example, we recorded the microsecond timescale dynamics of the vapor bubbles in order to
193
CHAPTER 10
relate these to both cell poration and cell viability. The uptake of a model drug upon cell
poration was quantified dynamically and was related to the vapor bubble size and cell
death.
10.3. MATERIALS AND METHODS
Capsule production
Hexadecane‐loaded polymethylmethacrylate (PMMA) microcapsules were prepared by an
emulsion solvent evaporation technique, using microsieve emulsification [451]. Prior to
emulsification, hexadecane (H6703, Sigma‐Aldrich, Zwijndrecht, the Netherlands), PMMA
(Tg = 103 oC, MW 120,000, Sigma‐Aldrich) and Sudan red 7B (Sigma‐Aldrich) dye were
dissolved in dichloromethane (Sigma‐Aldrich) in order to achieve a dye concentration of
4.85% w/w.
Poly(lactic‐co‐glycolic acid) Resomer RG502 microcapsules (hereafter called Resomer)
containing perfluoropentane oil (PFP, Fluoromed, Round Rock, TX, USA) were fabricated in
a similar way as the PMMA capsules. Poly(lactic‐co‐glycolic acid) (Tg = 50 oC, Corbion Purac,
Amsterdam, the Netherlands) was dissolved in dichloromethane along with PFP and Sudan
red 7B dye, and only with PFP for the control capsules, and was placed in a 20 oC bath to
ensure full miscibility of the oil in dichloromethane. Ultrapure water containing an emulsifier
(polyvinyl alcohol 4% (w/w) or sodium cholate 1.5% (w/w)) maintained below 15 oC was used
as continuous phase. The solutions were filtered through a 0.45 µm PTFE filter and
emulsified through a microsieve membrane (Nanomi B.V., the Netherlands) with uniform
pores. The emulsions were then spread in an aqueous solution containing the
aforementioned emulsifiers. This was left to stir at room temperature for at least 3 h to
evaporate the dichloromethane. The hardened microcapsules were concentrated and
washed repeatedly by vacuum filtration and 0.05% w/w Tween 20 solution (VWR,
Amsterdam, the Netherlands). Subsequently, the washed suspensions were stored at 4 oC.
Size distributions and concentrations were determined using a Multisizer 3 Coulter Counter
(average of n = 3, Beckman Coulter, Mijdrecht, the Netherlands) equipped with a 100 µm
aperture. Both capsule types were monodisperse, but PMMA‐hexadecane capsules were
smaller (average diameter 6.4 µm) than Resomer‐PFP capsules (average diameter 7.5 µm).
Undiluted concentrations were 7.3×10⁷ PMMA‐hexacecane capsules/mL and 6.8×10⁶
Resomer‐PFP capsules/mL.
Endothelial cell culture
Human umbilical vein endothelial cells (HUVEC) (C2519A, Lonza, Verviers, Belgium) were
cultured in T75 flasks (353136, BD Falcon Fisher Scientific, Breda, the Netherlands) in 10 mL
EGM‐2 medium (CC‐3162, Lonza) in a humidified incubator under standard conditions (37 oC
and 5% CO2). Cells were harvested (passage number 6) from the flask using trypsin in EDTA
194
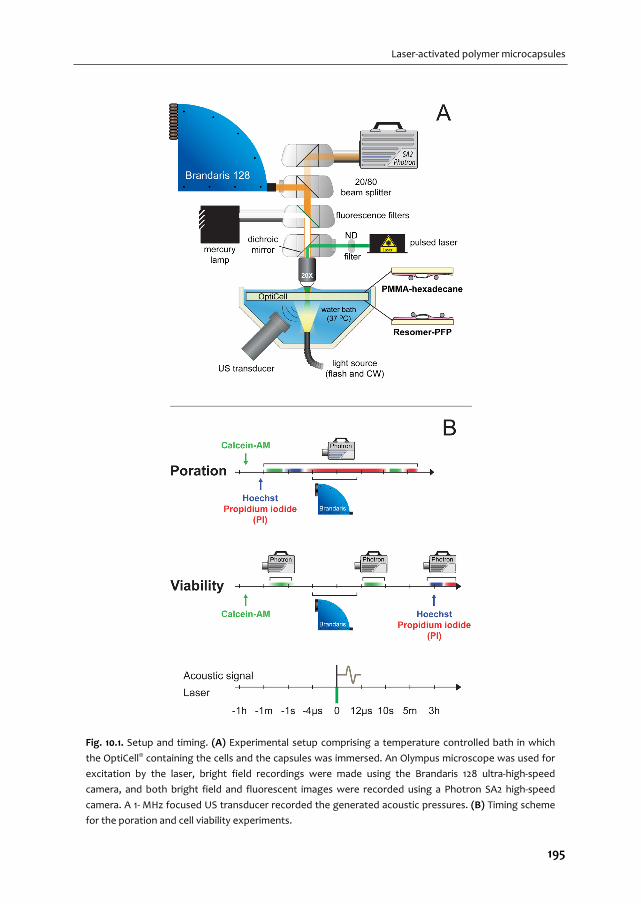
Laser‐activated polymer microcapsules
Fig. 10.1. Setup and timing. (A) Experimental setup comprising a temperature controlled bath in which
the OptiCell® containing the cells and the capsules was immersed. An Olympus microscope was used for
excitation by the laser, bright field recordings were made using the Brandaris 128 ultra‐high‐speed
camera, and both bright field and fluorescent images were recorded using a Photron SA2 high‐speed
camera. A 1‐ MHz focused US transducer recorded the generated acoustic pressures. (B) Timing scheme
for the poration and cell viability experiments.
195
CHAPTER 10
(CC‐5012, Lonza) and replated on one side of an OptiCell (Thermo Scientific, Nunc GmbH &
Co, Wiesbaden, Germany) in 10 mL EGM‐2 medium. Two days later the cells (passage
number 6) reached 100% confluence and were ready to be used in the experimental setup.
Experimental setup
The experimental setup is shown in Fig. 10.1A. For visualization of the capsules and the cells,
we used a fluorescence microscope (Olympus, Zoeterwoude, the Netherlands) equipped
with a 20× water‐immersion objective (UMPLFLN 20XW, N.A = 0.5, Olympus). For imaging in
bright field, the sample was illuminated from below via a light fiber using a continuous light
source (Schott, KL2500LED) and for fluorescence imaging we used a mercury lamp in an
epifluorescent setup. In addition, a set of fluorescence filters was used for the detection of
propidium iodide (PI, U‐MWG2 filter, Olympus), Hoechst 33342 (U‐MWU2 filter, Olympus),
and calcein (U‐MWIB2, Olympus). For excitation of the polymeric capsules a pulsed laser
(8 ns, 532 nm, Quantel Evergreen 150 mJ) was directed through the microscope on the
sample using a dichroic mirror. Different laser energies were used by adjusting the internal
settings of the laser, the settings of a polarized attenuator, and a set of neutral density
filters. The resulting energy coupled into the microscope was varied from 0.75 to 3.75 mJ for
the PMMA‐hexadecane capsules and from 0.23 to 2.25 mJ for the Resomer‐PFP capsules.
Two cameras were used for imaging: a FASTCAM SA2 high‐speed color camera (Photron
Europe Ltd, Bucks, UK) for bright field and fluorescence imaging, and the Brandaris 128
ultra‐high‐speed camera [52, 320] for bright field recording of the laser‐activated bubble
dynamics. For enabling simultaneous recordings of fluorescence and ultra‐high‐speed bright
field imaging a beamsplitter was used that directed 20% of the light to the high‐speed
camera and 80% of the light to the Brandaris 128 camera. The high‐speed camera recorded
at 50 frames per second (fps) and the Brandaris 128 ultra‐high‐speed camera recorded at 10
million frames per second (Mfps). Sufficient illumination was provided by a Xenon strobe
light through the same optical fiber as the continuous light source.
The acoustic signal was received by a focused 1 MHz transducer (C302, Panametrics, 90%
bandwidth) and was amplified 5× (SR445A, Stanford Research Systems Inc., Sunnyvale, CA,
USA). The transducer was mounted in the water bath (37 OC) at a 45o angle below the
OptiCell. The optical and acoustical foci were aligned using a 0.2 mm metal needle. The
acoustic signals were recorded using an oscilloscope (DPO4034, Tektronix, Beaverton, OR,
USA) and were automatically saved to a computer using MATLAB (The MathWorks, Natick,
MA, USA). The main trigger sent by the Brandaris 128 camera was received by a pulse‐delay
generator (BNC model 575) that in turn controlled the timing of the laser, the flash source,
exposure of both cameras, and recording of the acoustic signals.
196

Laser‐activated polymer microcapsules
Poration experiments
The poration experiments were used to study permeabilization of the cell membranes by
means of fluorescent stains. For visualization of live cells, we used calcein‐AM (C3100MP,
Molecular Probes, Life Technologies, Bleiswijk, the Netherlands), a dye that can passively
cross the cellular membranes and is enzymatically converted into fluorescent calcein by live
cells. We used the efflux of calcein also as a measure of poration [452], in combination with
the inflow of the membrane impermeable model drug PI, that can only enter a cell when the
membrane integrity is compromised [453, 454]. Before each experiment calcein‐AM was
added to the cells in the OptiCell (final concentration 0.4 μg/mL prepared from a 1 μg/mL
stock in dimethyl sulfoxide (D5879, Sigma‐Aldrich)) and was incubated for 40 min (37 oC, 5%
CO2). Prior to each experiment, PI (final concentration 25 μg/mL; P‐4864; Sigma‐Aldrich,
Zwijndrecht, the Netherlands) and Hoechst 33342 (final concentration 5 μg/mL; H3570;
Molecular Probes, Life Technologies) were added to the OptiCell. The Hoechst stain was
used to label the nuclei of all cells, allowing for accurate cell counting. For the capsules,
approximately 1×10⁷ PMMA‐hexadecane capsules or 2×10⁶ Resomer‐PFP capsules were
added to an OptiCell containing a monolayer of HUVECs. The OptiCell was placed in a 37 oC
water bath. The PMMA‐hexadecane capsules float, so in these experiments the OptiCell was
placed with the cells on the top membrane to ensure that the capsules were close to the
cells. For the experiments on Resomer‐PFP capsules, the OptiCell was placed with the cells
on the bottom membrane, because these capsules sink (Fig. 10.1A). The timing of the
poration experiments is illustrated in Fig. 10.1B. A field of view (FOV) with live cells, i.e.
presence of calcein signal and absence of PI signal before laser‐activation, was chosen and
the high‐speed camera recorded the initial Hoechst and calcein fluorescent signals.
Immediately after that, a Brandaris 128 recording was initiated, the capsules were activated
by the laser, and their dynamics were captured by the Brandaris 128 camera and PI uptake
was simultaneously recorded using the high‐speed camera. The fluorescence PI recording
lasted for approximately 10 s after the Brandaris recordings had finished. 1‐2 min after that,
another PI fluorescence image set was recorded to assess the prolonged uptake caused by
the vapor bubbles that were formed.
Assessment of cell viability
To assess long‐term (3 h) cell viability, separate experiments were required in which PI was
added 3 h after laser activation of the capsules, to visualize which cells had membranes that
were still disrupted. A custom made grid was put on an OptiCell with a confluent layer of
HUVECs to mark the same irradiated spot before and after incubation. Calcein‐AM was used
for staining live cells and was added 40 min before the experiment to a final concentration
of 0.4 μg/mL in the OptiCell. Prior to starting the experiment approximately 1×10⁷ PMMA‐
hexadecane capsules or 2×10⁶ Resomer‐PFP capsules were added. Directly after laser
irradiation, the Brandaris 128 camera recorded the bubble dynamics in bright field and the
197
CHAPTER 10
high‐speed camera recorded the calcein signal before and after activation to assess live cells
and poration. After the last recording the OptiCell was incubated for 3 h to study long‐term
cell viability. After this time had elapsed, PI and Hoechst were added to the OptiCell to a
final concentration of 25 μg/mL and 5 μg/mL, respectively. Fluorescence was recorded again
for calcein, Hoechst and PI at the same activation spot as before. The timing of the viability
experiments is shown in Fig. 10.1B.
Capsule and laser toxicity
Next to the effect of the created vapor bubbles, the capsule toxicity and the influence of
the laser intensity on the cells also had to be accounted for. Cell viability of HUVECs in the
presence of PMMA‐hexadecane and Resomer‐PFP capsules (i.e. capsule toxicity) was
assessed by means of PI staining in the viability experiments at locations without laser
activation. Cell viability was defined as the ratio of live cells and the total number of cells
((number of Hoechst‐stained nuclei ‐ number of cells showing PI uptake)/number of
Hoechst‐stained nuclei). The total cell death count in the viability experiments was
corrected for the cell death in the presence of the capsules alone, in principle to correct for
cell death due to handling of the cells during the experiments. Next to toxicity of the
capsules themselves, interaction with the laser could cause local heating of the cells due to
absorption of the laser energy. To assess this effect we used Resomer‐PFP capsules with
similar composition, but in which no Sudan red 7B was incorporated in the shell, which
prevented the capsules from vaporization upon laser irradiation. These experiments were
performed with the highest laser intensities that were applied in our experiments.
Image analysis and signal processing
Data processing was performed entirely in MATLAB (The MathWorks, Natick, MA, USA).
Image registration had to be performed, since the Brandaris 128 camera had a smaller FOV
and was rotated with respect to the high‐speed camera. A 2D cross‐correlation method was
used to register the fluorescence recordings with the corresponding bright field Brandaris
recordings. The fluorescence images were contrast‐enhanced to facilitate analysis, because
the calcein images had limited signal intensity.
Automatic counting of the Hoechst stained nuclei (live and dead cells) and PI stained
cells (porated or dead cells) was achieved through Gaussian convolution filtering (20 pixels,
Gaussian width = 10 pixels) and thresholding (10 levels for an image depth of 8 bits) to filter
the noise, and detection by counting the local image maxima (imregionalmax function).
In order to extract the PI uptake curves, images were filtered using singular value
decomposition (SVD) [455], after removal of the median pixel intensity taken from the part
of the image that was not exposed to the laser. Finally, the pixel intensity was summed for
each frame to produce a poration curve, which was later rescaled to the number of porated
cells in the FOV. First, free fitting to an exponential curve was applied. Since the noise was
198
Laser‐activated polymer microcapsules
too large to allow reliable fitting of the two independent parameters, for all curves the
characteristic time was fixed to be the median of the fitted characteristic times. This
allowed a fit the amplitude in a second step. As an objective measure of the poration speed
the initial velocity of the curve was calculated, which is represented by the prefactor (or
amplitude) divided by the characteristic time. In most cases more than one bubble was
formed within the FOV, we therefore report the average maximum radius of these bubbles.
The Brandaris recordings were used to extract the radius‐time curves of the vapor
bubbles, resulting from the laser activation. These radius‐time curves were extracted using
a MATLAB script developed in‐house that was based on contrast compensation, image
equalization, 2D convolution filtering, background subtraction and local thresholding. Pixel
sizes were converted into micrometers using recordings of a test target with known
resolution (USAF 1951 Resolution Test Targets, Edmund Optics, York, UK). The resulting set
of images, radius‐time curves, and cell counts were interpreted manually: PI uptake and
calcein efflux were attributed to a bubble when this was in close proximity to the affected
cell.
10.4. RESULTS
Endothelial cell membrane poration by PMMA‐hexadecane capsules
Fig. 10.2 shows the result of a typical poration experiment using PMMA‐hexadecane
microcapsules. This figure shows the overlay of calcein and corresponding Hoechst signal of
the cells (Fig. 10.2A) and the capsules and absence of PI uptake (Fig. 10.2B). The capsules
just after laser‐irradiation are shown in Fig. 10.2C, and an example of a radius‐time curve is
shown in Fig. 10.5E. The PI uptake curve of the sample, normalized to the number of
bubbles in the FOV, is shown in Fig. 10.2D, where a clear increase in intracellular PI
fluorescence intensity was observed after laser activation. Example frames from this
fluorescence recording are shown in Fig. 10.2E and F; the time points of these frames
correspond to the black dots in Fig. 10.2D. Panel E shows the same image as panel B, but
now with background subtraction to remove the capsules and focus on the PI signal only.
The contours of the vapor bubbles, which were tracked simultaneously, are superimposed
on the PI images. The different lines indicate the contour of the bubble in separate frames
of the recording. Another PI fluorescence image, taken after approx. 1 min is displayed in
Fig. 10.2H. The fluorescence intensity in Fig. 10.2H clearly increased locally, and four cell
nuclei became visible through increased PI fluorescence staining. The four affected cells
were observed to be in direct contact with the vapor bubbles. Because the concentration of
genetic material to which PI can bind is higher in the nucleus (DNA) than in the cytoplasm
(RNA) [456], we only observed a clear signal increase in the nucleus. The overlay of Hoechst
fluorescence recordings before and PI recordings after activation (Fig. 10.2G) clearly shows
poration of three cells that were alive before laser‐activation. The PI staining of the nucleus
199
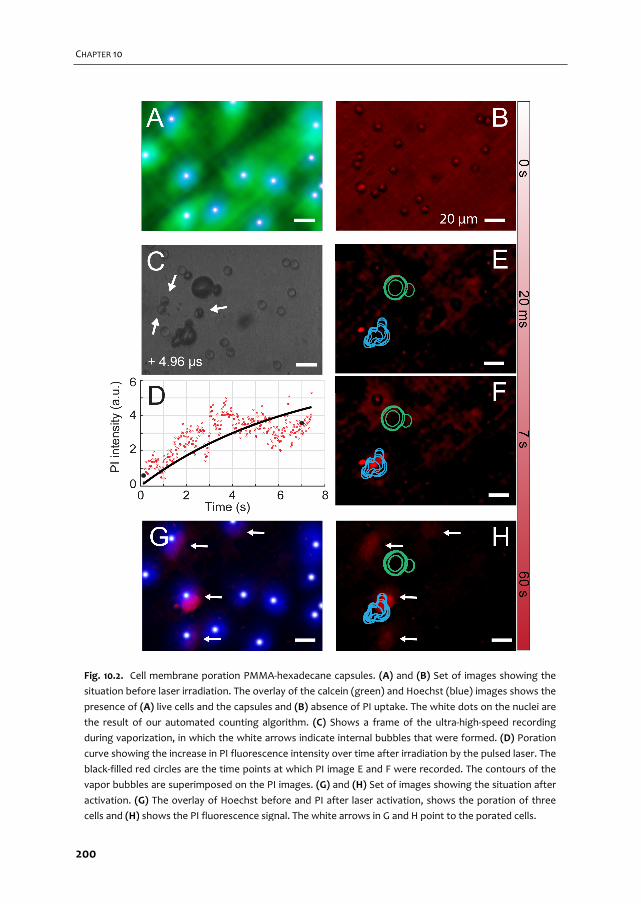
CHAPTER 10
Fig. 10.2. Cell membrane poration PMMA‐hexadecane capsules. (A) and (B) Set of images showing the
situation before laser irradiation. The overlay of the calcein (green) and Hoechst (blue) images shows the
presence of (A) live cells and the capsules and (B) absence of PI uptake. The white dots on the nuclei are
the result of our automated counting algorithm. (C) Shows a frame of the ultra‐high‐speed recording
during vaporization, in which the white arrows indicate internal bubbles that were formed. (D) Poration
curve showing the increase in PI fluorescence intensity over time after irradiation by the pulsed laser. The
black‐filled red circles are the time points at which PI image E and F were recorded. The contours of the
vapor bubbles are superimposed on the PI images. (G) and (H) Set of images showing the situation after
activation. (G) The overlay of Hoechst before and PI after laser activation, shows the poration of three
cells and (H) shows the PI fluorescence signal. The white arrows in G and H point to the porated cells.
200
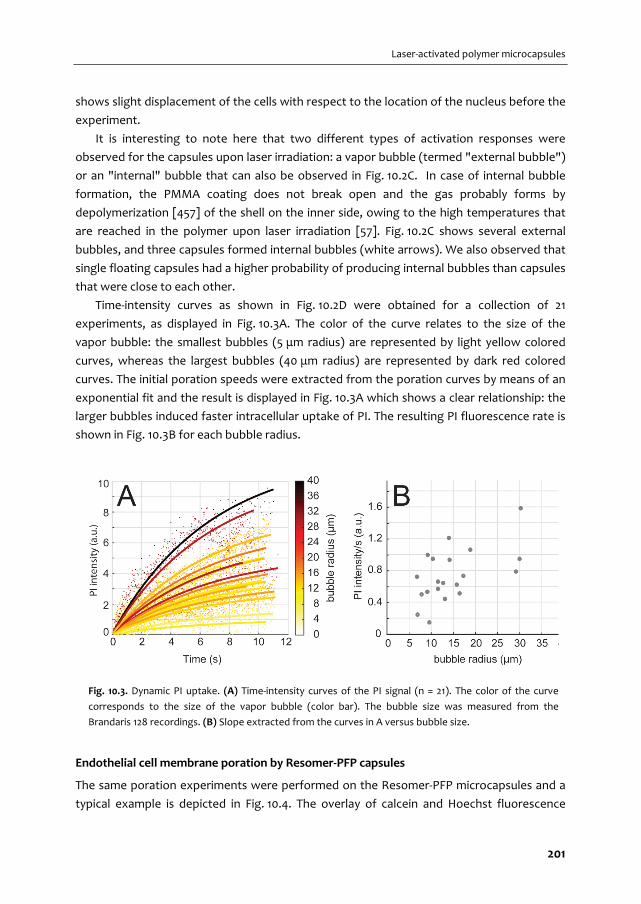
Laser‐activated polymer microcapsules
shows slight displacement of the cells with respect to the location of the nucleus before the
experiment.
It is interesting to note here that two different types of activation responses were
observed for the capsules upon laser irradiation: a vapor bubble (termed "external bubble")
or an "internal" bubble that can also be observed in Fig. 10.2C. In case of internal bubble
formation, the PMMA coating does not break open and the gas probably forms by
depolymerization [457] of the shell on the inner side, owing to the high temperatures that
are reached in the polymer upon laser irradiation [57]. Fig. 10.2C shows several external
bubbles, and three capsules formed internal bubbles (white arrows). We also observed that
single floating capsules had a higher probability of producing internal bubbles than capsules
that were close to each other.
Time‐intensity curves as shown in Fig. 10.2D were obtained for a collection of 21
experiments, as displayed in Fig. 10.3A. The color of the curve relates to the size of the
vapor bubble: the smallest bubbles (5 μm radius) are represented by light yellow colored
curves, whereas the largest bubbles (40 μm radius) are represented by dark red colored
curves. The initial poration speeds were extracted from the poration curves by means of an
exponential fit and the result is displayed in Fig. 10.3A which shows a clear relationship: the
larger bubbles induced faster intracellular uptake of PI. The resulting PI fluorescence rate is
shown in Fig. 10.3B for each bubble radius.
Endothelial cell membrane poration by Resomer‐PFP capsules
The same poration experiments were performed on the Resomer‐PFP microcapsules and a
typical example is depicted in Fig. 10.4. The overlay of calcein and Hoechst fluorescence
Fig. 10.3. Dynamic PI uptake. (A) Time‐intensity curves of the PI signal (n = 21). The color of the curve
corresponds to the size of the vapor bubble (color bar). The bubble size was measured from the
Brandaris 128 recordings. (B) Slope extracted from the curves in A versus bubble size.
201

CHAPTER 10
Fig. 10.4. Cell membrane poration Resomer‐PFP capsules. (A) and (B). Set of images showing the
situation before laser irradiation. The overlay of the calcein (green) and Hoechst (blue) images shows the
presence of live cells (A). The white dots on the nuclei are the result of our automated counting
algorithm. The PI fluorescence signal (B) shows that no dead cells were present in the FOV. (C)
Corresponding frame of the ultra‐high‐speed recording showing the vapor bubbles created upon
irradiation by the pulsed laser. (D) Radius‐time curves of the bubbles in C. (E) and (F). PI fluorescence
pictures at two time points showing the uptake of PI by two cells, with the contours of the vapor bubbles
superimposed on them. (G) and (H). Set of images showing the situation after activation. The overlay of
Hoechst before and PI after laser activation shows the poration of two cells (G), with the white arrows
indicating partial obstruction of PI signal. The PI fluorescence signal is shown in (H).
202

Laser‐activated polymer microcapsules
images is shown in Fig. 10.4A and the capsules and absence of PI uptake are shown in
Fig. 10.4B. The vapor bubbles generated by the capsules upon laser irradiation are shown in
Fig. 10.4C, and the corresponding radius‐time curves are shown in Fig. 10.4D. Fig. 10.4E and F
show the evolution of the PI fluorescence intensity as a consequence of PI uptake by the
cells that were porated, but now with background subtraction to remove the capsules and
focus on the PI signal only. The contours during oscillation of the vapor bubbles are
superimposed on Figs. 10.4E and F; the colors correspond to the colors of the curves in
Fig. 10.4D. The affected cells were always in direct contact with a vapor bubble. Those
bubbles created by Resomer‐PFP capsules did not collapse, but remained on top of the
cells. The bubbles then grew slowly over the few seconds during which the PI uptake was
recorded. In Fig. 10.4G the small white arrows indicate bubble contours that partly
obstructed the PI signal, and the difference between the green contour and the actual
vapor bubble size in Fig. 10.4H shows the bubble growth over 1 min. This growth, leading to
a false positive PI signal in the bubble core and to the partial obstruction of the PI signal
from the porated cells, prevented extraction of reliable poration curves (Fig. 10.4H). As said,
the bubbles did not float up which suggests that they adhered to the underlying cell layer.
Cell viability after PMMA‐hexadecane capsule activation
Control experiments (n = 10, on average 16 cells in FOV) showed cell viability over 96% in the
presence of PMMA‐hexadecane capsules, but without laser irradiation. When the capsules
were irradiated by the laser, both in the poration and viability experiments, some capsules
did not vaporize presumably because insufficient dye was encapsulated in their shell. This
offered a useful control experiment (n = 3, on average 18 cells in FOV) to assess how the
combination of capsules and laser irradiation affected the cells; no PI staining was observed.
As a consequence, cell death by means of PI staining in the viability experiments could be
directly attributed to the vapor bubbles that were formed.
The cell viability experiments after activation of PMMA‐hexadecane capsules (n = 29)
were performed to assess whether the produced bubbles induced cell death. Fig. 10.5A
shows a bright field image with the capsules floating below the cells before laser irradiation.
Fig. 10.5B shows a calcein image before laser irradiation, while Fig. 10.5D shows the
difference between the calcein image taken immediately after laser irradiation and that
taken before. Comparison of the calcein signal in the white dashed circles in Figs. 10.5B and
D reveal an intensity decrease after laser irradiation. This decrease is indicative of poration
since calcein can only leave the cell when the membrane has lost its integrity [452]. The
bubble contours extracted from the ultra‐high‐speed Brandaris recording are superimposed
on Fig. 10.5D. The sizes of the vapor bubbles in the viability experiments ranged from 6.5 µm
in radius for the smallest, up to 40 µm for the largest bubble. In the example shown in
Fig. 10.5, the radii were between 7.5 and 12.5 µm, and the corresponding radius‐time curves
(Fig. 10.5E) show that the vapor bubble expanded, compressed, and stopped oscillating.
203
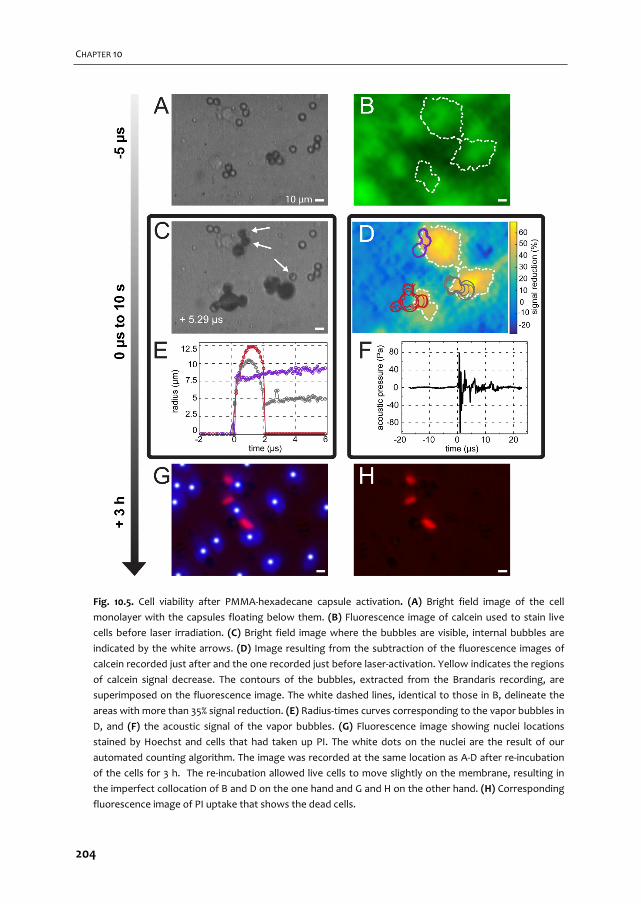
CHAPTER 10
Fig. 10.5. Cell viability after PMMA‐hexadecane capsule activation. (A) Bright field image of the cell
monolayer with the capsules floating below them. (B) Fluorescence image of calcein used to stain live
cells before laser irradiation. (C) Bright field image where the bubbles are visible, internal bubbles are
indicated by the white arrows. (D) Image resulting from the subtraction of the fluorescence images of
calcein recorded just after and the one recorded just before laser‐activation. Yellow indicates the regions
of calcein signal decrease. The contours of the bubbles, extracted from the Brandaris recording, are
superimposed on the fluorescence image. The white dashed lines, identical to those in B, delineate the
areas with more than 35% signal reduction. (E) Radius‐times curves corresponding to the vapor bubbles in
D, and (F) the acoustic signal of the vapor bubbles. (G) Fluorescence image showing nuclei locations
stained by Hoechst and cells that had taken up PI. The white dots on the nuclei are the result of our
automated counting algorithm. The image was recorded at the same location as A‐D after re‐incubation
of the cells for 3 h. The re‐incubation allowed live cells to move slightly on the membrane, resulting in
the imperfect collocation of B and D on the one hand and G and H on the other hand. (H) Corresponding
fluorescence image of PI uptake that shows the dead cells.
204

Laser‐activated polymer microcapsules
The lifetime of PMMA‐hexadecane bubbles was found to be approximately 2 µs. Fig. 10.5F
shows the acoustic signal emitted from the PMMA‐hexadecane capsules. Fig. 10.5G shows
the PI fluorescence image overlayed on the Hoechst stained cell nuclei. The cells that were
stained by PI in this experiment (Fig. 10.5G and H) died within 3 h after PMMA‐hexadecane
capsule activation. The Hoechst and PI stained images were both recorded after a 3 h
incubation period, so the cell nuclei exactly overlapped. However, the intensity of the
Hoechst signal of cells that were stained by PI was considerably lower than for the other
nuclei, which were therefore not detected using our tracking algorithm. This phenomenon
has recently been described [372] and was attributed to Förster resonance energy transfer
(also known as FRET) [425]. The PI stained nuclei in Fig. 10.5G appear smaller than the
Hoechst stained nuclei; this shrinkage of cells and their nuclei after sonoporation has been
described by others [458].
When comparing the cell nuclei locations in Fig. 10.5G to those depicted in Fig. 10.5D
(brightest green), they do not exactly match. Our grid‐approach ensured that the exact
same spot within the OptiCell was located, but cells could have displaced due to cell
division, cellular processes involving disruption of tight junctions, or simply by sample
handling, because the OptiCell had to be moved from the setup to the incubator and back.
Cell viability after Resomer‐PFP capsule activation
Control experiments of Resomer‐PFP capsules without laser irradiation showed cell viability
over 87% (n = 8, on average 20 cells in FOV). The control experiments with non‐absorbing
Resomer‐PFP capsules (n = 10, on average 18 cells in FOV) showed only one single cell that
had taken up PI. Since no bubbles were formed, this uptake of PI was not related to an
activation event.
In the cell viability experiments with Resomer‐PFP capsules (n = 37) similarly sized
bubbles were formed as for the PMMA‐hexadecane capsules (compare Figs. 10.5C, E and
Figs. 10.6C, E). Before and after laser irradiation, calcein fluorescence images were recorded
and the white dashed circles again indicate regions of interest where calcein signal had
decreased (Fig. 10.6B, D), suggesting poration. In contrast to the PMMA‐hexadecane vapor
bubbles, the Resomer‐PFP bubbles were capable of not only decreasing calcein signal, but
completely depleting the signal (Fig. 10.6D, bottom circle). Interestingly, Fig. 10.6D shows
that the PFP vapor bubble exactly co‐locates with the center of the ring shape of the calcein
fluorescent signal. The corresponding radius‐time curve (Fig. 10.6E) and acoustic signal
(Fig. 10.6F) of this PFP vapor bubble showed sustained oscillations after the laser was
turned off. Fluorescence imaging after the 3 h incubation period showed Hoechst stained
nuclei and PI staining of one cell. Due to the violent impact of the PFP vapor bubbles on the
cells, parts of the cell monolayer were disrupted. It was therefore not always possible to
correlate the cell nuclei (Hoechst) after laser activation (Fig. 10.6G), to the location of the
cells before activation. This hindered a quantitative assessment of cell viability.
205
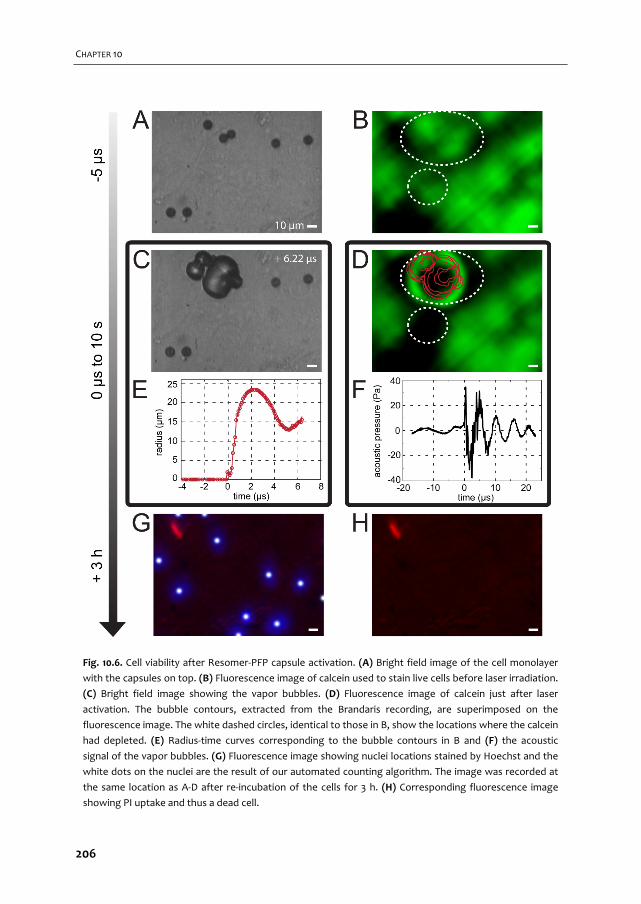
CHAPTER 10
Fig. 10.6. Cell viability after Resomer‐PFP capsule activation. (A) Bright field image of the cell monolayer
with the capsules on top. (B) Fluorescence image of calcein used to stain live cells before laser irradiation.
(C) Bright field image showing the vapor bubbles. (D) Fluorescence image of calcein just after laser
activation. The bubble contours, extracted from the Brandaris recording, are superimposed on the
fluorescence image. The white dashed circles, identical to those in B, show the locations where the calcein
had depleted. (E) Radius‐time curves corresponding to the bubble contours in B and (F) the acoustic
signal of the vapor bubbles. (G) Fluorescence image showing nuclei locations stained by Hoechst and the
white dots on the nuclei are the result of our automated counting algorithm. The image was recorded at
the same location as A‐D after re‐incubation of the cells for 3 h. (H) Corresponding fluorescence image
showing PI uptake and thus a dead cell.
206

Laser‐activated polymer microcapsules
The stable vapor bubbles (n = 44) that were observed in the calcein fluorescence
recordings (example in Fig. 10.6D) ranged from 7.5 to 27 µm in radius, measured within 1 min
after laser irradiation. The obtained size distribution of these stable bubbles is shown in
Fig. 10.7.
Comparison of formulations: PMMA‐hexadecane versus Resomer‐PFP
A summary of the poration and cell death probability is shown in Fig. 10.8A and B for the
PMMA‐hexadecane capsules and Fig. 10.8C and D for the Resomer‐PFP capsules. For the
PMMA‐hexadecane capsules only those that formed external bubbles were considered,
since the internal bubbles never induced any cell poration and could not be sized. The bars
in the figures are centered around the values on the x‐axis, with a bin width of 5 µm. The bar
centered at 5 µm thus includes bubbles between 2.5 and 7.5 µm. The numbers above the
bars represent the amount of bubbles within each bar and the height of the bar indicates
the average percentage of porated or dead cells due to a single bubble. The vapor bubbles
larger than 45 µm could not be accurately sized, since they often expanded beyond the FOV
of the Brandaris 128 camera (175.8 µm × 125.9 µm).
Fig. 10.7. Radii of remaining PFP bubbles. Bar diagram showing
the size distribution of microbubbles that remained on top of the
cells after laser‐activation of the Resomer‐PFP capsules.
207
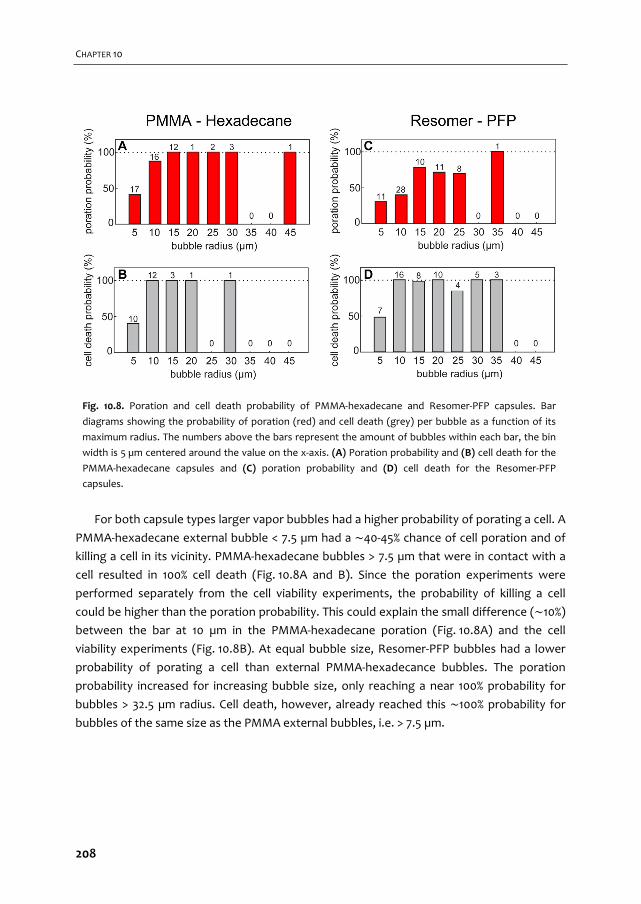
CHAPTER 10
For both capsule types larger vapor bubbles had a higher probability of porating a cell. A
PMMA‐hexadecane external bubble < 7.5 µm had a ∼40‐45% chance of cell poration and of
killing a cell in its vicinity. PMMA‐hexadecane bubbles > 7.5 µm that were in contact with a
cell resulted in 100% cell death (Fig. 10.8A and B). Since the poration experiments were
performed separately from the cell viability experiments, the probability of killing a cell
could be higher than the poration probability. This could explain the small difference (∼10%) between the bar at 10 µm in the PMMA‐hexadecane poration (Fig. 10.8A) and the cell
viability experiments (Fig. 10.8B). At equal bubble size, Resomer‐PFP bubbles had a lower
probability of porating a cell than external PMMA‐hexadecance bubbles. The poration
probability increased for increasing bubble size, only reaching a near 100% probability for
bubbles > 32.5 µm radius. Cell death, however, already reached this ∼100% probability for
bubbles of the same size as the PMMA external bubbles, i.e. > 7.5 µm.
Fig. 10.8. Poration and cell death probability of PMMA‐hexadecane and Resomer‐PFP capsules. Bar
diagrams showing the probability of poration (red) and cell death (grey) per bubble as a function of its
maximum radius. The numbers above the bars represent the amount of bubbles within each bar, the bin
width is 5 µm centered around the value on the x‐axis. (A) Poration probability and (B) cell death for the
PMMA‐hexadecane capsules and (C) poration probability and (D) cell death for the Resomer‐PFP
capsules.
208
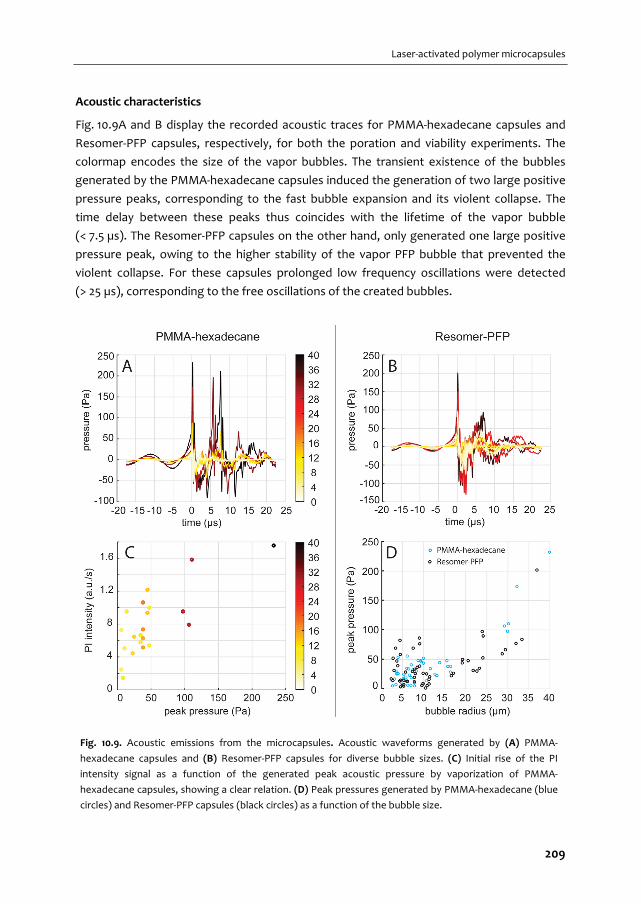
Laser‐activated polymer microcapsules
Acoustic characteristics
Fig. 10.9A and B display the recorded acoustic traces for PMMA‐hexadecane capsules and
Resomer‐PFP capsules, respectively, for both the poration and viability experiments. The
colormap encodes the size of the vapor bubbles. The transient existence of the bubbles
generated by the PMMA‐hexadecane capsules induced the generation of two large positive
pressure peaks, corresponding to the fast bubble expansion and its violent collapse. The
time delay between these peaks thus coincides with the lifetime of the vapor bubble
(< 7.5 µs). The Resomer‐PFP capsules on the other hand, only generated one large positive
pressure peak, owing to the higher stability of the vapor PFP bubble that prevented the
violent collapse. For these capsules prolonged low frequency oscillations were detected
(> 25 µs), corresponding to the free oscillations of the created bubbles.
Fig. 10.9. Acoustic emissions from the microcapsules. Acoustic waveforms generated by (A) PMMA‐
hexadecane capsules and (B) Resomer‐PFP capsules for diverse bubble sizes. (C) Initial rise of the PI
intensity signal as a function of the generated peak acoustic pressure by vaporization of PMMA‐
hexadecane capsules, showing a clear relation. (D) Peak pressures generated by PMMA‐hexadecane (blue
circles) and Resomer‐PFP capsules (black circles) as a function of the bubble size.
209
CHAPTER 10
Fig. 10.9C shows the initial PI influx speed into the cell as a function of the bubble radius
of PMMA‐hexadecane external vapor bubbles, showing faster PI influx with increasing
pressure. As a consequence, therapeutic effects may be monitored remotely by a measure
of the acoustic emissions, using both the frequency content and the emitted peak pressure.
Fig. 10.9D displays the peak pressure that was generated as a function of the bubble
size. It appears that vapor bubbles formed by both capsule types generated very similar
pressure amplitudes (up to Ppeak ∙ r = 10 Pa∙m, i.e. approximately 250 Pa for our transducer
with 1.63 inch focal distance), also with a clear dependency on the bubble size: small
bubbles (< 30 µm) generated up to 50‐100 Pa, whereas large bubbles (> 30 µm) generated
up to 250 Pa. One of our experiments resulted in only internal PMMA‐hexadecane bubbles.
The acoustic pressure emitted by these bubbles was ∼15 Pa, which would be detectable by
an US scanner [325].
10.5. DISCUSSION
Despite the capsules’ size monodispersity, their responses were found to vary from capsule
to capsule. Therefore, not all capsules could be activated upon irradiation at the same laser
intensity. We therefore focused on single bubble events related to cell outcome, i.e.
reporting bubble sizes rather than laser intensities. Less clustering of Resomer‐PFP capsules
was observerd than of PMMA‐hexadecane capsules. More reactive capsule clusters creating
multiple bubbles that merged were treated as a single bubble.
Since the boiling point Tb of hexadecane (Tb = 286,5 oC, PubChem CID 11006) is higher
than that of water, the PMMA‐hexadecane capsules vaporize the surrounding water [57],
resulting in a water vapor bubble. In contrast, the Resomer‐PFP capsules vaporize
preferentially the lower boiling point PFP core (Tb = 29 oC, PubChem CID 12675), which
requires substantially less energy. We therefore applied higher laser intensities in our
experiments on PMMA‐hexadecane capsules. We verified that the highest laser intensity in
the presence of non‐absorbing capsules was not sufficient to directly kill cells. Nevertheless,
the higher heat deposition on the cell monolayer could have influenced cell viability due to
the short thermal shock wave for a duration of several microseconds. On the other hand,
Fig. 10.8 showed no noticeable differences in cell death between PMMA‐hexadecane and
Resomer‐PFP capsules, suggesting that the increased heat deposition had no significant
influence on cell viability. It should be noted that because of the higher activation threshold,
the laser intensities required to vaporize the PMMA‐hexadecane capsules exceed the
clinically allowed FDA limit [450].
Differences between poration and cell death by Resomer‐PFP activated capsules were
larger than expected. This apparent discrepancy can partly be attributed to the optical
obstruction by the growing PFP bubbles, and partly by adsorption of the cell material onto
the bubble (as further discussed later on). Such violent cell destruction may induce the
210

Laser‐activated polymer microcapsules
stained genetic material to flow away in the medium, which then cannot be recorded. In
addition, cell death at the start of the cell viability experiments with the Resomer‐PFP
capsules was found to be already slightly higher than for the poration experiments, which
could have resulted in overestimation of cell death for these capsules as well.
The probability that a cell in contact with a PMMA‐hexadecane or Resomer‐PFP bubble
died, was as high as or higher than the probability that a cell was porated. This implies that
either a PMMA‐hexadecane or a Resomer‐PFP vapor bubble in direct contact with a cell is
lethal to this cell and viable poration was not achieved. In contrast, most studies on
ultrasound‐mediated sonoporation report that cells can be either viably porated or
irreversibly damaged [34, 38, 372]. In terms of vapor bubble formation, phase‐change
agents that rely on acoustic vaporization are closer to the polymeric laser‐activated
microcapsules we used. These phase‐change agents were smaller, and either showed
mainly cell death and cell detachment [440] or both viable sonoporation and cell death
[459]. The smaller vapor bubbles in our experiments resulted in less and slower PI uptake
(see Fig. 10.5). This implies that, here as well, smaller capsules may be more suitable for
inducing viable poration and may open up more possibilities for drug delivery. For the
formation of bubbles having diameters of ∼3 µm, the capsules should be down‐sized to
∼800 nm. Making them even smaller (< 200 nm) would allow for extravasation and
increased penetration of the capsules into the tumor tissue of interest [449]. However,
producing stable nano‐sized particles is challenging and requires optimization of the
manufacturing process. Consequently, here we first focused on micrometer‐sized capsules.
Secondly, the resolution of our ultra‐high‐speed imaging system is not sufficiently high for
visualization of nanocapsules. Downsizing to nanocapsules and their impact on endothelial
cells and extravasation capabilities should therefore be further investigated. For our PI
uptake curves we used a mono‐exponential fit, in line with Fan et al. [34] and van Rooij et
al. [372]. In the poration curves we extracted after activation of PMMA‐hexadecane some
variation can be observed (Fig. 10.3B) at the same bubble size, probably owing to
differences in the location of the capsules with respect to the surrounding cells. Next to
that, our method of averaging the bubble size could have influenced the relation we
observed. The x‐axis in Fig. 10.3B represents the average bubble size in the FOV.
Consequently, what appears as a 10 µm bubble could either be a single bubble of 10 µm or
an average of for example a bubble of 8 µm and one of 12 µm. Since Fig. 10.8 showed that
larger vapor bubbles induced more damage, the larger bubble of 12 µm would result in more
damage. Nonetheless, the plot clearly shows a faster PI intensity increase for larger vapor
bubbles.
After laser‐activation of the Resomer‐PFP capsules, the calcein fluorescence recordings
showed a ring of bright fluorescence signal surrounding a non‐dissolving vapor bubble
(Fig. 10.6D). In previous in vitro experiments without cells the stability of similar bubbles
was investigated [460]. Although these bubbles were generated acoustically, based on their
211
CHAPTER 10
results the lifetime of the Resomer‐PFP bubbles was expected to be less than a few
milliseconds, while the size was expected to be only several micrometers. The interesting
observation that Resomer‐PFP bubbles were stable for several seconds and adhered to the
underlying cells could possibly be exploited for additional contrast‐enhanced US imaging.
Further in vitro or in vivo studies should assess whether Resomer‐PFP bubbles are also
stabilized in the presence of flow. This observation aids further understanding of the
biophysical response of the cells to these types of vapor bubbles. Since calcein‐AM only
becomes fluorescent when the AM part is enzymatically cleaved off by a living cell, the ring
of fluorescence has to originate from the inside of a live cell of which the membrane was
disrupted. Although only calcein was visible, it is likely that other cell constituents were also
incorporated within the coating of these bubbles, since the cell had completely
disappeared. This particular aspect would be worthwhile to investigate in future studies to
aid better understand the interaction of the vapor bubble with the cellular membrane.
The activation energy could be even lower (up to 2×) by incorporating more Sudan
Red 7B in the polymer shell. This, however, resulted in a morphology change from spherical
capsules to acorn, or cup‐shaped particles [461]. The PFP core of these particles is not
completely enclosed by the Resomer, allowing easier access to the PFP core and thus a
lower activation energy. Here, we also found that the poration probability of HUVECs was
higher for the Resomer‐PFP cups than for the Resomer‐PFP capsules, consistent with the
decrease in activation energy.
The work presented here aimed at studying the effect of laser‐induced microbubbles on
cells, in particular poration for enhanced drug delivery and cell death. In that regard, this
study positions itself in the framework of photoacoustics where the penetration depth is
known to be limited to a few centimeters. Consequently, only superficial tissues could be
successfully treated. This represents the main limitation with respect to acoustically driven
microbubbles as an alternative for enhancing drug delivery and locally controlling cell death.
10.6. CONCLUSIONS
We showed that laser‐induced vaporization of polymeric microcapsules can porate and kill
human endothelial cells. We studied PMMA‐hexadecane capsules and Resomer‐PFP
capsules, of which the first formulation contained a high‐boiling point oil and resulted in a
higher degree of cell poration. Poration probability was already 40% for the smallest bubbles
that were formed (< 7.5 µm diameter), and reached 100% for the larger bubbles. Cells that
were in contact with a vapor bubble and that were porated, died. Because of the lower
activation threshold of Resomer‐PFP capsules, this type of capsules has the highest
potential to be used in vivo to induce and monitor cell death. The internal capsules
produced by laser‐activation of PMMA‐hexadecane microcapsules did not induce poration,
while still producing a detectable acoustic signal. Finally, a clear relationship between the
212

Laser‐activated polymer microcapsules
acoustic emissions and the cell poration efficiency indicated a potential application for
acoustic monitoring of the therapeutic action of such systems.
Acknowledgements
This work is supported by NanoNextNL, a micro and nanotechnology consortium of the
Government of the Netherlands and 130 partners.
213

214
Feasibility of quantitative in vivo contrast‐enhanced ultrasound imaging of the renal cortex in
hemorrhagic shock
Tom van Rooij, Verya Daeichin, Alexandre Lima, Patricia A. C. Specht, Bulent Ergin, Yasin Ince, Can Ince, Nico de Jong, Klazina Kooiman
11 Chapter
215
EMBARGO - UNTIL PUBLISHED
EMBARGO - UNTIL PUBLISHED
EMBARGO - UNTIL PUBLISHED
Renal contrast‐enhanced ultrasound and sublingual video‐microscopy
identify microcirculatory dysfunction in acute kidney injury
Tom van Rooij*, Alexandre Lima*, Bulent Ergin, Michele Sorelli, Yasin Ince, Patricia A. C. Specht, Egbert G. Mik, Leonardo Bocchi, Klazina Kooiman, Nico de Jong, Can Ince
(* both first authors contributed equally)
In preparation for submission
12 Chapter
231
EMBARGO - UNTIL PUBLISHED
EMBARGO - UNTIL PUBLISHED
EMBARGO - UNTIL PUBLISHED
Cellular to systemic impact of
microbubbles and ultrasound on the human body: potential risks and
how to control them
Tom van Rooij, Guillaume Lajoinie, Klazina Kooiman, Nico de Jong, Michel Versluis, Ine Lentacker
13 Chapter
251
CHAPTER 13
13.1. ABSTRACT
The injection of foreign substances into the blood stream of a patient comprises several
risks. Ultrasound contrast agents (UCAs), such as the microbubbles and echogenic
liposomes that are described in this thesis, can induce strong mechanical and chemical
effects on biological structures when combined with ultrasound. They therefore present
potential risks that ought to be controlled. Here, we review these potential issues on the
different length scales relevant to the problem to allow for safe use of UCAs.
13.2. INTRODUCTION
After decades of clinical use of UCAs [62, 68], clinicians and researchers have built‐up a
deeper knowledge of the behavior of microbubbles under ultrasound exposure [5, 31, 45,
68, 262, 511]. Extensive literature reporting on in vivo experiments [21, 120, 161, 271, 290, 335,
435, 512, 513] is available and clinical cohorts of tens of thousands of patients have been
analyzed and published on the safety of microbubbles combined with ultrasound in vivo [22,
283, 514‐516]. These datasets have been mainly used for retrospective analysis of scans
performed with all generations of UCAs and a wide range of ultrasound parameters.
These studies, however, either report very specific conditions or effects on short time
scales. Here, we review the information available concerning the potential risks of UCAs on
the different length scales in order to gain a better overview of the impact of UCAs in
combination with ultrasound on patients. We start with an overview of the impact of UCAs
on a cellular level, continue to the tissue level and end with the systemic risks in clinical
practice.
13.3. CELLULAR RISKS
Cell poration
UCAs and ultrasound have become widely recognized as interesting drug delivery tools, due
to the fact that oscillating microbubbles can increase cellular permeability and as such
stimulate the uptake of cell‐impermeable drugs [36]. Because microbubbles can temporarily
disturb cellular membranes, the main risk factor is the impact of these cellular disruptions
on cellular viability and functionality. As such, several methods have been used to study
cellular viability after sonoporation. In general, the viability of sonoporated cells has been
evaluated by including a small cell impermeable dye like propidium iodide during flow
cytometry measurements [39, 517‐522]. Because only irreversibly damaged cells will stay
permeable for more than a few minutes after sonoporation, cellular uptake of these small
molecular dyes allows for the determination of the percentage of dead cells. The main
advantage is that both drug delivery efficiency and cell toxicity can be determined within
252

Cellular to systemic impact of microbubbles and ultrasound
the same experiment. In general, cellular toxicity with these compounds has been reported
between 5 and 20% depending on acoustic conditions [39, 518] and microbubble
concentrations.
Ultrasound parameters
Since only direct microbubble‐cell interactions are responsible for pore formation, acoustic
conditions and microbubble concentrations [517, 522, 523] have been shown to have a major
impact on the sonoporated cell area and its recovery process. Lower ultrasound pressures
(50‐200 kPa) mainly induce stable microbubble oscillations (stable cavitation) resulting in
only small cell membrane disruptions originating from cavitation induced shear stresses that
may arise. In contrast, higher ultrasound intensities (> 200 kPa) can cause violent
microbubble collapse (inertial cavitation) leading to shock waves and jet formation [45].
These harsh conditions create micrometer‐sized cell membrane disruptions and require
complex cell membrane repair mechanisms to patch these disruptions [36, 524, 525]. The
length of the ultrasound pulse is another acoustic parameter that influences microbubble
behavior. Longer pulses at moderate ultrasound intensities can lead to microbubble
translation due to acoustic radiation force [81, 406]. Translating microbubbles can impact
cellular monolayers and may consequently cause direct cell disruption when they take part
of the lipid membrane with them while translating. It has even been described that intact
microbubbles can enter cells due to translational movements [41, 526]. A third ultrasound
parameter which determines the level of cellular toxicity is the pulse repetition frequency of
the applied ultrasonic wave. Karshafian et al. [39] showed that cell survival increases when
the time between successive ultrasound pulses increases. They attributed this to two
possible reasons: 1) the fact that cells might be able to restore cellular damage within two
pulses, or 2) the fact that uncoated gas bubbles that can arise after microbubble
fragmentation, already dissolve within the medium between two successive ultrasound
pulses. As a result, the amount of cavitation events that can affect cellular membranes
decreases.
Microbubble‐cell ratio
Another important player is the microbubble concentration in relation to the number of
cells. When higher microbubble concentrations are used, the microbubble to cell ratio
increases, thereby increasing the amount of cell membrane pores per cell [522]. Related to
this is the microbubble size, that can have a major influence on cell viability; larger
microbubbles will lead to larger cell membrane pores and increase cellular toxicity [527].
The reason for this may be the fact that above a certain sonoporation threshold, cellular
mechanisms fail to reseal the cell membrane as nicely demonstrated by Hu and colleagues
[38].
253
CHAPTER 13
Induction of cell death
The use of small cell impermeable dyes only allows for identifying permanently
permeabilized cells with flow cytometry, indicating the necrotic cell population. To gain
more insight in cell death mechanisms associated with sonoporation, cells can be stained
with annexin‐V to determine the fraction of apoptotic cells. During apoptosis,
phosphatidylserine, which is normally associated with the inner leaflet of the cell
membrane, is exposed on the outer cell membrane surface and can hence be detected by
annexin‐V staining. Because inertial cavitation due to microbubble oscillation mainly induces
cell necrosis when cell perforation becomes too violent, only a few sonoporation studies
have been performed with annexin‐V labeling. These studies reported the apoptotic
fraction of cells to be rather small and in the order of 2‐5% [528, 529].
Chemical effects
Although the biophysical aspects of cavitation and imploding microbubbles have been the
main subject of investigation when it comes to cellular toxicity, the influence of chemical
components in microbubble formulations has often been neglected in literature. Honda et
al. [529] used galactose‐coated Levovist microbubbles to study apoptosis induction and
found out that the fraction of apoptotic cells was elevated due to the hypertonicity of the
medium, due to the high galactose concentration in the microbubble formulation. However,
it is unlikely that clinically used doses are high enough to change blood isotonicity. It
remains however poorly investigated how polymer shell fragments can be cleared from the
body, while for lipid‐coated microbubbles it is believed that released lipids and lipid micelles
can enter normal lipid metabolism. The microbubble shell composition can also promote
cellular uptake. Sonazoid microbubbles consist mainly of egg phosphatidylserine and are
therefore recognized and quickly endocytosed by liver Kupffer cells and other phagocytic
cells [530]. This makes these specific cells very sensitive to ultrasound as intact gas cores are
remaining inside these cells [531]. On the other hand, the inclusion of PEGylated lipids within
the microbubble shell can prevent opsonization and recognition of microbubbles by the
immune system [262].
13.4. MEASURING CELL TOXICITY
Cytometry
Although flow cytometry has been widely applied as a quick and easy method to screen the
impact of acoustic variables on sonoporation‐induced cytotoxicity, it also has some major
disadvantages. Because only non‐fragmented cells become visible within the scatter plot,
cellular toxicity can be underestimated since completely lysed cells will not be detected
[531, 532]. Moreover, it has been demonstrated that a part of adherent cells detaches [12,
533] during sonoporation, which means that these cells are not taken into account when
254

Cellular to systemic impact of microbubbles and ultrasound
performing flow cytometry as they will be washed away during sample preparation. A good
alternative can be to measure cellular toxicity with colorimetric assays like the ones based
on the conversion of 3‐(4,5‐dimethylthiazol‐2‐yl)‐2,5‐diphenyltetrazolium bromide (MTT‐
assay) [534, 535]. These assays assess the metabolic activity of cells and account for the
metabolic activity of all cells, even detached ones, when comparing them to untreated
samples.
Confocal microscopy
Only recently, the impact of sonoporation on cellular morphology and functionality has
been more thoroughly studied using more advanced techniques, such as confocal scanning
microscopy. This enables not only registration of morphological changes like cell shrinkage
[458, 529] and cell membrane blebbing [525], but even allows for studying more complex
cellular mechanisms. Although a lot of debate is still ongoing on sonoporation induced
toxicity, it is becoming clear that depending on microbubble‐cell interactions, cellular
toxicity can be divided in three main categories: a) complete cell lysis b) cell poration and c)
more subtle effects like intracellular free radical production [536], endoplasmic reticulum
stress, or cytoskeleton disassembly [33], leading to apoptosis or necrosis at a longer time
scale. In this regard, Hutcheson et al. [527] have shown that cells which contained higher
amounts of model drug expelled it again after several hours while the cells underwent
apoptosis. These findings indicate the importance of evaluating clonogenic viability of
sonoporated cells as evidenced by Karshafian et al. [523], who found that only 50 and 70% of
the sonoporated cells was able to divide. In contrast, this might be less important for drug
delivery studies dealing with gene delivery such as plasmid DNA (pDNA) or messenger RNA
(mRNA) translation and subsequent protein expression, because these processes already
indicate cell functionality.
Acoustic monitoring
To predict sonoporation and sonoporation‐induced toxicity levels, researchers have also
tried to correlate these effects with the total acoustic energy that was applied to the cells
[518]. This, however, does not account for any differences in pulse length or pulse repetition
frequency which also influence microbubble cavitation, as already mentioned above. An
alternative and more realistic parameter is to register inertial cavitation activity by
measuring broadband noise [517]. Although this is an interesting parameter during
sonoporation studies, it still lacks several other variables like microbubble composition, size
distribution and concentration which will in the end all influence microbubble‐cell
interactions and therefore drug delivery efficiency and sonoporation‐induced cell damage.
255
CHAPTER 13
13.5. THERAPY AND TOXICITY
It is obvious that sonoporation events are inevitably associated with a certain level of
cellular toxicity. The balance between viably porated cells and irreversible damaged cells is
however very delicate and it remains difficult to predict in which direction it will drift.
Recently, van Rooij et al. [372] reported a relation between viably sonoporated cells and
displacing microbubbles, and cell death and non‐displacing microbubbles. They did,
however, not relate this to the cellular behavior. Prof. Yu’s group [33, 458, 525, 537] aims to
gain detailed knowledge of cellular behavior in response to sonoporation, which may
further clarify which microbubble‐cell interactions are favorable to induce reversible cell
membrane damage and maximal drug uptake. This knowledge can be used to select the
most optimal ultrasound settings to stimulate identical cavitation behavior of recently
developed monodisperse microbubbles and for achieving better controllable microbubble‐
cell interaction aiming to fully maximize sonoporation‐assisted drug delivery and minimize
the associated toxicity.
On the other hand, ultrasound induced membrane damage can be used as a major
advantage as well [536], more specifically when sonoporation is applied as a tool to deliver
chemotherapeutics to cancer cells. It has even been shown that this physical damage can be
used to revert chemoresistance [538] and render cancer cells again sensitive to
chemotherapeutics. This could be a very interesting strategy to treat blood cancers or
lymphomas that can benefit from direct microbubble‐cell interaction.
13.6. RISKS ON TISSUE LEVEL
Chemical effects due to cavitation
Microbubbles can oscillate gently, and in a controlled way (stable cavitation) or violently
and randomly (inertial cavitation). Inertial cavitation of a microbubble is typically achieved
with high pressures at low frequency [539]. Locally, pressures can increase up to 100 MPa
and temperatures can rise locally over 1000 K [539, 540]. These conditions are associated
with certain chemical effects that may pose a risk to living tissue, such as the production of
free radicals, sonoluminescence, and lysis of adjacent cells [539‐541]. Free radicals are highly
reactive molecules [539, 540] and can react with polyunsaturated fatty acids in cellular
membranes, nucleotides in DNA, and sulfhydryl bonds in proteins [542]. This can result in
cell damage and eventually cell death. Free radicals are produced in the final phase of
bubble collapse, when the temperature and density of the gas increase rapidly. This results
in the formation of ∙H and ∙OH free radicals, superoxide (H2O2), and nitrogen oxides [536,
540, 541] which react to stable molecules within only a few microseconds. Due to their high
reactivity their radius of action is rather small, and the free radicals produced in blood can
react with proteins and other molecules containing sulphhydryl groups (‐SH) that act as free
256

Cellular to systemic impact of microbubbles and ultrasound
radical scavengers. It has been shown in vitro that the aminoacids cysteine and cysteamine
can protect the cell against free radical damage. When present in the blood, it has the ability
to mostly cancel the effect of the free radicals produced by the cavitating bubble. Due to
the free radical production, ultrasound therapies that rely on producing cavitation bubbles
such as lithotripsy, could cause larger lesions when UCAs are still present in the blood.
Next to free radical production, inertial cavitation of microbubbles is also associated
with lysis of erythrocytes (hemolysis) [540]. However, in animal models this effect has been
shown to be lower than 4%, which means that it is almost without clinical importance.
Mornstein et al. studied hemolysis in the presence of Albunex (2.17 MHz, 22.4 W/cm2) and
the effect was only present with hematocrit values < 10% [541], which is unrealistically low to
be reached clinically. When the power was increased to 420 W/cm2 lysis was achieved up to
hematocrit values of 40%. Also, Hu et al. [244] reported reduced blood flow after
destruction of bound targeted microbubbles due to aggregation of platelets as a response
to endothelial damage (7 MHz, 2 or 4 MPa). Due to angiogenesis, this effect was expected
to play a larger role in tumor vessels.
Blood‐brain barrier disruption
In healthy individuals molecules larger than a few nm cannot cross the biological barrier
between the blood and the brain [543]. This barrier is better known as the blood‐brain
barrier (BBB). Ultrasound‐mediated blood‐brain barrier disruption (BBBD) using UCAs is a
promising technique for enabling drug delivery to the brain. This is generally only achievable
with relatively high acoustic pressures (> 0.5 MPa) and low frequencies (< 1 MHz) [34, 544,
545], exactly the combination of parameters that are also associated with inertial cavitation
and the production of free radicals, as discussed in the previous subsection. Other risks of
BBBD include intracranial hemorrhage (0.98 MPa, 0.4 MHz, MI 1.6, in rats) [544], reduced
cell viability in vitro (0.5 MPa, 10,000 cycles, on human embryonic kidney cells 293) [34],
inflammatory reactions (0.9 MPa, 1 MHz, single exposure, in rats), formation of vacuoles,
and degeneration (0.9 MPa, 1 MHz, two exposures, in rats) [545]. Although quite some risks
might be associated with BBBD, in 2015 a team at Sunnybrook Health Sciences Centre
(Toronto, Ontario, Canada) were the first to successfully open the BBB using a frequency of
220 kHz in a patient to deliver doxorubicin in a brain tumor, as part of a clinical trial
(ClinicalTrials.gov Identifier NCT02343991). In addition, Carpentier et al. [546] reported
monthly disruption of the BBB in 17 patients using an implantable US transducer
(SonoCloud) and pressures of 1.1 MPa. Opening of the BBB was assessed by means of MRI
and no detectable adverse effects were present. These studies show the feasibility and
possibilities of BBBD opening using ultrasound and UCAs, but the perfect set of acoustic
parameters and type of microbubbles still needs to be determined.
257

CHAPTER 13
Vascular damage
Cavitation caused by oscillating microbubbles has been shown to induce vascular damage.
Hwang et al. showed that in an in vivo rabbit model endothelial damage was induced in
blood vessels larger than capillaries when they contained UCAs [547]. This was attributed to
inertial cavitation rather than thermal damage (threshold at 1.1 MHz and pressures between
1 and 3.35 MPa). This vascular damage has been confirmed by others in ex vivo rat venules
(1 MHz, 1.5‐5.6 MPa, 1 cycle) [548], chorioallantoic membrane tissue (1 MHz, 2.3 MPa,
10 cycles, PRF 500 Hz for 5 s) [549] and after histology on rabbit arteries (4.7 MHz, 9.5 MPa
for 30 min) [550].
13.7. RISKS IN CLINICAL PRACTICE
Ultrasound contrast agent (UCA) injection has all kinds of possible risks associated with it
when injected into the blood stream. Due to the injection, the possibility of an embolism
cannot be ruled out (although unlikely as shown by animal studies) [551] and the patient
could be extremely sensitive or allergic to one the components which can result in
anaphylactic shock [22, 23, 552]. Next to that, a single burst of high intensity ultrasound
during a cardiac contrast‐enhanced ultrasound examination in diastole (T‐P segment) can
produce premature contraction in mammalian and amphibian hearts [553‐555].
Other concerns may rise on the obstruction of vessels and the clearance of the
microbubbles from the circulation; where does the gas end up, what happens to the coating
components, how quickly is everything cleared, when can another dose be administered,
what is the maximum dose, etc. Different UCAs that are marketed worldwide all have their
own potential risks [551]. They differ in the type of gas in the core, the coating that is used
for stabilization, and the solution in which the microbubbles are dispersed. Currently, five
agents are approved for clinical use by regulatory agencies: Definity, Lumason, Optison,
Sonazoid, and SonoVue [314]. In this section we evaluate the potential and proven risks that
are associated to contrast‐enhanced ultrasound (CEUS) examinations in clinical practice.
CEUS contraindications
Nowadays, CEUS is approved for application in most organs: heart, liver, breast, vascularity,
prostate, and many more [22, 23]. Especially in Europe, UCAs are used extensively off‐label
for other applications as long as no contraindications are present. These contraindications
mainly comprise cardiac diseases, which exclude 10‐35% of the world’s population from
undergoing CEUS examinations. Being overly careful in using UCAs for improving ultrasound
imaging, medical professionals might have even increased patient risk; due to suboptimal
image quality and the need for other techniques, such as CT and X‐ray, patients have been
subjected to ionizing radiation [551]. In addition to this, Kurt et al. [556] showed that UCAs
258

Cellular to systemic impact of microbubbles and ultrasound
even had a positive impact on cardiac examinations: additional procedures were avoided or
therapy changed in over 35% of patients.
Although, the risks of CEUS examinations have never been thoroughly and
systematically evaluated, general consensus has been reached that UCAs are very safe and
have a low incidence of side effects [23]. In contrast to contrast agents used for other
modalities, such as CT, X‐ray, or MRI, UCAs are not nephrotoxic, not toxic for the heart or
liver, do not interact with the thyroid gland, and anaphylactic reactions have only been
reported in less than 1 in 50,000 to 100,000 examinations [23, 557]. The risk for anaphylaxis
is lower than for CT and X‐ray, and similar to that for MRI contrast agents. However, as
discussed before, the combination of ultrasound and UCAs can induce cellular effects such
as sonoporation, hemolysis, and cell death. Although these effects have so far only been
observed in vitro, or in vivo in small animals, it can most likely also occur in patients [23].
These risks become higher for increasing mechanical index (MI) and in hyperthermia. The MI
is defined as the pressure (in MPa) divided by the square root of the frequency (in MHz)
( / ) and quantifies the probability to generate cavitation. According to the clinical
guidelines the MI cannot exceed 1.9 and the maximum temperature rise with the use of
ultrasound cannot exceed 1.5 oC [558].
Dosing and clearance of UCAs
The safety studies for the introduction of new agents as commissioned by the United
States Food and Drug Administration (FDA) provide specific risks for different agents, but
give an indication for the general safety of UCAs. First of all, the rules are much more
stringent than for general clinical use, as for the clinical trials preceding the approval of, for
example Definity, the maximum MI that could be used was only 0.8 [559]. In terms of
dosing, it is recommended that an intravenous (IV) bolus injection does not exceed 10 μL/kg
followed by a 10 mL saline flush, if necessary repeated 30 minutes later. For IV infusion the
recommended rate is 1.3 mL in 50 mL saline, not to exceed 10 mL/minute [559]. Definity
contains C3F8 gas which is stable and not metabolized. After injection of free C3F8 gas, i.e.
not encapsulated, it was undetectable after 10 minutes in the blood and in the expired air.
Blood concentrations declined monoexponentially with a mean half‐life of 1.3 minutes in
healthy subjects [559]. Definity is encapsulated by phospholipids [259] that are thought to
be metabolized by the normal lipid metabolism to free fatty acids [559]. Although these
tests have to be performed on each new agent, the results are not expected to be very
different.
Clinical experience
After the introduction of UCAs in clinical practice, adverse effects such as anaphylactic
shock and even death occurred, that could be associated to the CEUS examination. Several
large cohort studies have contradicted these adverse effects and showed that the use of
259

CHAPTER 13
UCAs is in fact very safe [283, 560, 561], even in children [562]. A retrospective study that
compared the number patients that died after receiving either CEUS examinations with
Definity (> 6000) or non‐CEUS (> 12,000) examinations showed no significant difference
between the two groups [561]. Another retrospective study at three different institutions
included 42,408 patients who received UCAs and had baseline suboptimal images and/or
underwent myocardial perfusion imaging and of which 18,749 underwent stress
echocardiography [283]. The outcomes (death and myocardial infarction) within 30 min,
24 h, and during long‐term follow‐up were recorded; no difference was found when
comparing this to a matched cohort of 15,989 patients who had not received contrast.
Another, even larger study, of 80,000 injections of Optison and Definity attributed no
deaths to the use of UCAs, and only 0.01% of the patients had probable severe reactions
[516]. This study included over 10,000 injections in critically‐ill patients in the ICU with acute
chest pain or suspected cardiac origin. Hauben et al. performed disproportionality analyses
on the adverse events that had been reported to the FDA between 1969 and 2014 on the
use of Definity [563]. No relation was found between major cardiovascular events that were
previously reported to be possibly associated with UCA injection, except for ventricular
tachycardia and ventricular tachyarrhythmia. Even in critically‐ill patients, the risks
associated with CEUS are lower or equal than for other cardiac imaging methods such as
transesophageal echo (TEE), and contrast‐enhanced CT or MRI. Other studies even
attributed a better survival rate to populations that underwent CEUS examinations versus a
population that had not [515]. However, since no systematic risk analysis has been
performed in different critically‐ill patient groups, usage of UCAs in these patients is still not
considered as completely safe. Soman et al. [564], studied the cardiopulmonary and
hemodynamic effects after bolus injections of SonoVue (2 or 4 mL) in patients with severe
left ventricular dysfunction, congestive heart failure, and in patients with pulmonary
hypertension. Even in these patient groups, no significant effects were found following
SonoVue injection. Other severe adverse events that have been reported in relation to UCAs
are cardiac arrest, sustained ventricular tachycardia, and other cardiac arrhythmias [565],
including premature ventricular contraction. Minor adverse events such as backache,
headache, abdominal pain, chest pain, nausea, vomiting, and dyspnea have also been
reported [514, 565].
13.8. CONCLUSIONS
Ultrasound parameters have been shown to be the main determinant for safe you use in
vitro and consequently also in clinical practice. At pressures < 200 kPa microbubbles mainly
undergo stable cavitation resulting in only minimal cell toxicity, whereas higher pressures
induce inertial cavitation that can result in sonoporation and severe cell toxicity. Several
research groups have aimed to pin point the acoustic parameters that results in maximum in
260
Cellular to systemic impact of microbubbles and ultrasound
vitro and in vivo drug delivery efficiency, with minimal cell toxicity. However, so far no
consensus on the optimal set of parameters for each specific application (e.g. local drug
delivery or sonothrombolysis) has been reached. Although less research has been
performed on tissue level than on single cells or cell populations, severe damage has only
been reported when using MI > 1.9 and thus exceeding the clinically allowed limit. Blood‐
brain barrier disruption is a hot topic for which the settings are delicate, because it is best
achieved at high acoustic pressures at low frequencies, ideal for inducing inertial cavitation.
Now the BBB has been successfully opened in a patient, the way is paved for more clinical
studies to establish the perfect set of acoustic parameters for this procedure and to map
the associated risks. For the clinical areas that have already recognized the usefulness of
UCAs, the risks associated with CEUS have been proven to be lower than for any other
imaging modality that uses contrast agents, such as CT or MRI.
13.9. OUTLOOK
Of the most innovative applications, e.g. enhanced gene therapy, local drug delivery, and
sonothrombolysis, little to no information is available on the long‐term effects on the tissue
or systemic level. Many biological pathways that can lead to cell survival or cell death have
been observed in vitro on single cells or cell populations, but future research should focus
on long‐term systemic risk assessment in order to successfully bring those techniques to the
clinic. In addition, for every new UCA formulation that will be marketed for clinical use, a
thorough risk analysis should be performed to assess possible toxicity and the specific
clearance pathways.
261

262

Discussion
& Outlook
14 Chapter
263
CHAPTER 14
14.1. OVERVIEW
The research in this thesis describes the oscillatory behavior of single microbubbles, both
targeted and non‐targeted and their use for local drug delivery and locally induced cell
death. A thorough evaluation of the contrast agents that have been used in our lab over the
past few years was performed in vitro and was also tested in our in vivo experimental model
of acute kidney injury. These in vivo experiments were conducted on pigs to study
hypovolemic shock due to hemorrhage and sepsis‐induced acute kidney injury, two major
causes of hospital deaths. In addition, two other classes of ultrasound contrast agents were
investigated: echogenic liposomes and laser‐activated polymer microcapsules. Lastly, we
focused on the risks associated with the use of microbubbles and ultrasound on the cellular
level, tissue level, and on clinical patient outcome.
14.2. PERFORMANCE OF DIFFERENT TYPES OF ULTRASOUND CONTRAST AGENTS
Nowadays, mostly the same contrast agents (e.g., SonoVue and Definity) are used for
applications in the clinic, as well as for preclinical research. Clinical investigations are
generally performed at low frequencies (typically around 1 – 2 MHz) to ensure significant
penetration depth. Especially for preclinical research in mice, rats, and other small animals,
high‐frequency ultrasound scanners such as the Vevo 2100 (FUJIFILM VisualSonics Inc,
Toronto, ON, Canada) are usually used to obtain high resolution images. Ultrasound
contrast agent detection with these high‐frequency scanners is optimal when the agents
comprise small microbubbles, because of their high resonance frequencies. Since SonoVue
contains microbubbles with relatively large diameters [7], these are not suited for high‐
frequency contrast imaging. Definity microbubbles, on the other hand, are smaller [9], and
provide good contrast in vivo. However, flexibility of commercially available ultrasound
contrast agents is low.
In Chapter 3 we compared different methods of ultrasound contrast agent (UCA)
fabrication for high‐frequency contrast‐enhanced ultrasound imaging (CEUS), either based
on DSPC (C:18) or DPPC (C:16). Although the most common method of UCA production is
sonication [264], the vial shaking method is easier and quicker. We showed that this method
is highly reproducible and resulted in small microbubbles with similar in vitro and in vivo
performance as Target‐Ready MicroMarker (FUJIFILM VisualSonics Inc). The first selection
criterion was the scattering power in vitro at 15 MHz in B‐mode (1% power, 1 cycle). After
selection of the two best performing UCAs made by sonication and the two best
performing UCAs made by vial shaking, their fundamental and subharmonic responses were
compared at 30 MHz transmit frequency (pulse inversion, 10% power, 20 cycles). Two UCAs
made by vial shaking were most similar to Target‐Ready MicroMarker: formulation F (DSPC‐
based) and L (DPPC‐based). The performance of those three UCAs was compared in an in
vivo pig model on the exposed kidney. We showed that contrast enhancement of our UCA
264
Discussion & Outlook
formulation L did not provide sufficient contrast to even distinguish the larger vessels. This
formulation was therefore not further studied. Contrast enhancement for formulation F
was slightly lower than for Target‐Ready MicroMarker, but also resulted in less signal loss
with increasing depth than Target‐Ready MicroMarker. The latter implies lower attenuation
for our formulation F. Our in‐house produced UCAs can therefore compete with the
commercially available Target‐Ready MicroMarker and offer additional options for other
targeting moieties than biotin‐streptavidin, which cannot be used clinically due to reactions
of the immune system [80]. The design and fabrication of smaller agents as described in
Chapter 3 offers increased versatility for targeting and can increase the resolution of high‐
frequency contrast‐enhanced ultrasound imaging. In addition, the possibility to produce
these agents in‐house could greatly reduce the costs of preclinical research. Our study also
shows that the development of new contrast agents should encompass both in vitro and in
vivo studies: imaging of microbubbles in vitro in a controlled and simplified setup is essential
before translation towards complex in vivo applications in which e.g. blood pressure, the
immune system, and clearance by the Reticulo Endothelial System (RES; i.e. the lung and
liver) play a role. In addition, agents performing well in vitro may not do so in vivo, as was
the case for our L formulation.
The underlying reason for the difference in contrast enhancement between the DSPC‐
based formulation F and the DPPC‐based formulation L is the difference in properties of the
microbubble shell and the subsequent acoustic behavior. In Chapter 4 we showed by means
of super‐resolution microscopy that the lipid distribution in the shell of DPPC‐based
microbubbles is more homogeneous than that of DSPC‐based microbubbles. Optical ultra‐
high‐speed Brandaris recordings revealed higher acoustic stability and a stiffer shell of
DSPC‐based microbubbles (Chapter 5) and may explain the longer contrast persistence of
UCA formulation F in vivo (Chapter 3). We attributed the lower acoustic stability to the
shorter acyl chain length of DPPC and the resulting lower intermolecular van der Waals
forces between the individual lipids [49]. Additional fluorescence ultra‐high‐speed
recordings using the UPMC Cam suggested irreversible collapse of the DSPC‐based
microbubble shell when the microbubble acoustically deflated (Chapter 7). Combined with
the higher compressibility rate [278, 279] and lower ability of DPPC lipids to re‐adsorb on
and re‐spread as a monolayer [376] over the microbubble surface during expansion, this
may also explain the lower acoustic stability of DPPC‐based microbubbles. Next to that,
Garg et al. [50] showed that without ultrasound application the in vivo contrast persistence
in rat kidneys of DSPC‐based microbubbles was ~5× higher than that of DPPC‐based
microbubbles. Our in vivo comparison in Chapter 3 also revealed higher mean intensities in
the three ROIs in the kidney; 15× higher in ROI 1, 6× higher in ROI 2, and 2.5× higher intensity
in ROI 3. Next to a higher stability, DSPC‐based microbubbles scattered four times higher
second harmonics than DPPC‐based microbubbles.
265
CHAPTER 14
Next to the DSPC and DPPC‐based microbubbles we also investigated echogenic
liposomes (ELIP) in Chapter 6, which are another type of lipid‐coated UCAs. For the first
time, individual ELIP were characterized and found to have similar viscoelastic properties as
other lipid‐shelled agents, such as SonoVue [127, 331], Definity [128, 326], and our own lipid‐
coated microbubbles (Chapter 5). This is surprising, since the air in the core was expected to
result in differences in oscillatory behavior. However, the main goal of this study was trying
to also identify whether the shell is a lipid monolayer or a multilamellar shell. Multilamellar
vesicles, in which the lipid monolayer immediately adjacent to the gas bubble is surrounded
by one or more bilayers, have been previously observed in transmission electron
microscopy images of ELIP [348]. The variation in the shell viscosity estimates for ELIP of
similar size may indicate the presence of multilamellar vesicles, where the apparent
viscosity depends on the number of lamallae. The new method we introduced to study the
damping coefficient based on the impulse response is a more efficient approach than the
spectroscopy technique used previously [18, 20, 342] and in Chapters 5 and 8.
14.3. LIPID COATING AND ACOUSTIC BEHAVIOR
The research described in this thesis has improved our understanding of the influence of
lipid composition on the microbubble microstructure, lipid movement, and acoustic
properties. This may aid in the quest for the perfect lipid coating that results in identical
microbubble behavior in order to accelerate the translation of ultrasound molecular
imaging and drug delivery towards the clinic. For these purposes the perfect lipid coating
should ensure 1) an identical shell composition for each single microbubble, 2) stability upon
ultrasound insonification, 3) a monodisperse size distribution, 4) effective binding to the
biomarker of interest, and 5) persistent binding under flow. These requirements have,
however, not all been met. To ensure a homogeneous and uniform shell (requirement 1), the
different components have to properly mix [70]. The components of our in‐house produced
DPPC microbubbles do mix as demonstrated by a homogeneous shell distribution, but lack
sufficient acoustic stability (requirement 2). Other lipids such as DSPC or 1,2‐dibehenoyl‐sn‐
glycero‐3‐phosphocholine (DBPC, C:22) increase the stability as shown in this thesis and by
others [50, 285], but result in heterogeneous shell distributions [47, 48, 377]. Another route
would be investigating other lipids as coating that are all in the same phase. Other types
than phosphocholines, the class of lipids to which DPPC and DSPC belong, for example
phosphoethanolamines such as DPPE, could be worth investigating further. DPPE lipids
have the same phase as DPPC, but have a smaller head group and may therefore increase
lipid packing and acoustic stability. This is also likely the reason why the clinically used
Definity microbubbles are stable in vivo because the coating formulation contains DPPE in
the form of DPPE‐PEG(5000) [9]. Monodisperse microbubbles can already be produced [16,
385, 397, 398] and have less variability in their response than polydisperse microbubbles
266

Discussion & Outlook
(requirement 3). Additional contrast‐enrichment methods such as acoustic bubble sorting by
means of their acoustic response [399], have further decreased the variability in their
resonance frequencies. In terms of biomarker binding (requirement 4) the surface area of
our DPPC‐based microbubbles was larger than that of our DSPC‐based microbubbles, but
studies on binding strength and persistence under flow (requirement 5) should be
performed in the future. Possible experimental approaches to study microbubble
adherence and persistence under flow could be the OrganoPlate® cell‐culture platform
(MIMETAS B.V., Leiden, the Netherlands) or the in vivo CAM model.
14.4. BOUND VERSUS NON‐BOUND MICROBUBBLES
For molecular imaging, the microbubbles need to be targeted to the desired point of action
by means of functionalization of the microbubbles, which is likely beneficial for
microbubble‐mediated local drug delivery and induced cell death. An overview of the
functionalization methods and techniques to enhance binding have been described in
Chapter 2 and include functionalization of the microbubble coating with antibodies,
nanobodies, or peptides. To increase the imaging speed of ultrasound molecular imaging
and to enhance specificity, it would be desirable to be able to discriminate microbubbles
that have bound to their biomarker from those that are freely floating in the blood vessel.
Previous studies described conflicting differences in the acoustic responses between bound
and non‐bound microbubbles [136, 139‐142]. One of the reasons for these discrepancies can
be found in the method of linking the biomarker to the surface, because most researchers
used physisorption, which was shown by Kooiman et al. [23] to result in detachment of the
biomarker from the surface and adherence to the microbubble shell. In Chapter 8 we
therefore covalently linked the biomarker to a hydrogel in order to prevent detachment.
Our study thus shows for the first time a fair comparison between identical bound and non‐
bound microbubbles, and also compared our in‐house produced DSPC‐based with DPPC‐
based microbubbles. Binding of DPPC‐based microbubbles to a streptavidin‐coated surface
induced acoustic deflation at both low and high pressures. In addition, the resonance
frequency and the corresponding relative radial excursions increased at relatively low
pressure (50 kPa). At this pressure, bound DPPC‐based microbubbles with diameters at
resonance between ~2 and 4 μm had resonance frequencies > 1.8 MHz, while those were
< 1.8 MHz for non‐bound DPPC‐based microbubbles. These findings may be useful in this
experimental setting, but these differences were not present at 150 kPa, a pressure closer
to those applied clinically. The differences in nonlinear responses did not significantly
change for bound microbubbles, which implies that the nonlinear responses cannot be
exploited to discriminate bound from non‐bound microbubbles. Since the differences in
resonance frequencies were not present at higher pressures, we could not provide
parameters to be used to discriminate bound from non‐bound microbubbles acoustically at
267
CHAPTER 14
clinically relevant pressures. Because the acoustic behavior of microbubbles in blood has
been shown to be different than in an aqueous solution [342], the next step in trying to
achieve this separation would be in vivo experiments, for example on the chorioallantoic
membrane (CAM) of a chicken embryo. This can be combined with ultra‐high‐speed imaging
[233, 342] to compare the responses of single bound and non‐bound microbubbles.
14.5. DRUG DELIVERY AND CELL DEATH
The effects of targeted (bound) and non‐targeted (non‐bound) microbubbles on human
endothelial cells is described in Chapter 9 in terms of microbubble oscillation and
displacement. We derived different patterns of PI uptake from the previously published
diffusion model by Fan et al. [34] and correlated these patterns with cell viability using
Principal Component Analysis and additional thresholding. Microbubble displacement
enhanced drug delivery and preserved cell viability, while non‐displacing microbubbles were
the main contributor to cell death. Although long ultrasound pulses have been shown to
increase sonoporation efficiency [40], these have only sparsely been used to study
sonoporation [40, 407‐409]. Therefore, we applied long pulses (500 – 50,000 cycles) at
pressures ranging from 150 – 500 kPa at a frequency of 1 MHz. Our results show that non‐
targeted microbubbles exposed to an acoustic pressure of 500 kPa and a pulse length of
1000 cycles would be most beneficial for drug delivery. For therapeutic applications where
high cell death is desired, such as cancer therapies, high pressures and long pulses should
be applied (e.g., 500 kPa and 50,000 cycles). Both targeted and non‐targeted microbubbles
were shown to effectively kill cells, but the non‐targeted ones were more efficient. Others
that used shorter pulses found higher cell viability [34, 403] which may be the direction to
improve sonoporation efficiency and thus drug delivery.
Based on all observations made in this thesis, DSPC‐based microbubbles are
recommended for CEUS imaging. On the other hand, the lower threshold for the generation
of subharmonics, the larger binding area, and the more homogeneous shell of DPPC‐based
microbubbles seem more advantageous for molecular imaging and targeted drug delivery.
However, the lower in vitro and in vivo stability might be the bottleneck.
As a different method for localized drug delivery and cell death, we studied polymer
microcapsules that were activated upon irradiation with a pulsed laser (Chapter 10). The
theory and experimental validation of the activation of these types of microcapsules have
been described by one of my collaborators [15, 57]. To assess the imaging and therapeutic
windows and the theranostic potential of these capsules, we performed the experiments in
the presence of human endothelial cells. We showed that laser‐induced vaporization
mediated by two different types of polymeric microcapsules can porate and kill human
endothelial cells. The PMMA‐hexadecane capsules contained a high‐boiling point oil and
resulted in more poration than the low‐boiling point Resomer‐PFP capsules. Poration
268

Discussion & Outlook
probability was already 40% for the smallest bubbles that were formed (< 7.5 µm diameter),
and reached 100% for the larger bubbles. Cells that were in contact with a vapor bubble and
that had taken up PI, all died. Because of the lower activation threshold of Resomer‐PFP
capsules, this type of capsules has the highest potential to be used in vivo to induce and
monitor cell death, for instance to monitor tumor treatment. The internal capsules
produced by PMMA‐hexadecane did not induce poration, while still producing a detectable
acoustic signal and may therefore open up opportunities for ultrasound contrast imaging.
The laser‐activated polymeric capsules (Chapter 10) more efficiently induced cell death
than lipid‐coated microbubbles (Chapter 9), but their effects were less controlled. When the
size of the capsules can be decreased to nanometer scales and when the dye concentration
in the coating of each microcapsule would be identical, their vaporization can be better
controlled. Due to the limited penetration depth of the laser that is required for activation
only superficial organs can be treated, such as superficial tumors. Because of their oil core
they also have a large reservoir that can be loaded with hydrophobic cytostatic drugs to not
only kill cells by the vaporization of the oil, but also aid drug delivery. In addition, the
feasibility of in vivo laser‐activation and the potential risks associated with the violent
vaporization of microcapsules should be assessed. Although currently used UCAs are very
safe (Chapter 13), for each new type of agent new risk assessments should be performed.
14.6. CLINICAL APPLICATION OF ULTRASOUND MOLECULAR IMAGING AND THERAPY
Although the therapeutic application of ultrasound contrast agents has already been shown
in vitro in 1997 by Bao et al. [231], sonoporation has still not found its way to daily clinical
practice. The first clinical trials for inducing sonoporation, however, have already been
conducted and used the commercially available non‐targeted contrast agents SonoVue
[546, 566] or Definity (ClinicalTrials.gov Identifier NCT02343991). The most efficient
approach towards clinical translation of drug delivery by means of sonoporation would be
using those clinically approved agents. In case of targeted microbubbles for ultrasound
molecular imaging and drug delivery the most logical step is using BR55 (Bracco
Diagnostics, Milan, Italy). These lipid‐coated microbubbles are targeted to the angiogenesis
biomarker VEGFR2 [84] and have been shown to effectively bind to HUVECs in vitro and
accumulated in vivo in tumors in mice. Since clinical trials with this agent have already been
carried out for ultrasound molecular imaging of the prostate (ClinicalTrials.gov Identifier NCT02142608), the chances of successful translation for molecular imaging are expected to
be the highest. As a next step, contrast agents targeted to other biomarkers can be
developed for ultrasound molecular imaging. For drug delivery additional steps have to be
taken; the risks and most efficient settings for sonoporation in different tissues need to be
evaluated in preclinical studies using BR55. Based on our own work (Chapter 9) and that of
others [34, 35, 37, 38, 234, 403], we recommend starting with the following settings: short
269
CHAPTER 14
pulses (< 100 cycles), moderate pressures (in‐situ < 200 kPa), a frequency between 1 and 2
MHz, and microbubbles with mean diameters between 4 and 5 μm .
The imaging and therapeutic windows of laser‐activated polymer microcapsules have
been assessed in Chapter 10, but several steps have to be taken before this technique can
be used in patients. Advantages of the microcapsules are their monodisperse size, efficacy
of inducing cell death, smaller microbubbles that resulted in slower uptake op the model
drug by the cell, and the stabilized Resomer‐PFP microbubbles that may be used for
imaging. These advantages could be further optimized by decreasing the size of the
capsules to < 200 nm to allow for extravasation into tumors by means of the enhanced
permeability and retention (EPR) effect, and possibly even enabling viable poration of cells
for drug delivery. What has to be further studied and understood is the mechanism
responsible for the large stabilized Resomer‐PFP microbubbles which may pose
embolization risks, due their size. Next, the internal PMMA‐hexadecane bubbles may be
used for imaging, but understanding of the formation process and how to control it
requires further research.
14.7. CEUS FOR DIAGNOSIS OF ACUTE KIDNEY INJURY
The potential of CEUS for diagnosis and monitoring of acute kidney injury in pigs was
studied in two models: hypovolemic shock induced by severe hemorrhage (Chapter 11) and
septic shock (Chapter 12). We were able to detect a larger difference in contrast arrival time
between the small arteries and the microcirculation in the renal cortex in hemorrhagic
shock, which increased again upon fluid resuscitation. This change in arrival time can be
used as a measure for the intrarenal velocity in hypovolemic shock and for fluid therapy
monitoring. In addition to that, the flow and peak‐enhancement in the microcirculation
were found to increase. This is possibly caused by a higher relative microbubble
concentration and opening of more capillaries in the microcirculation to ensure enough
transport of oxygen in shock and when the blood pressure drops below 50 mmHg
vasoconstriction to compensate for the decrease in flow. During resuscitation, flow
decreased again towards baseline values. In septic shock, flow and peak‐enhancement
decreased and further decreased during resuscitation. This decrease in peak‐enhancement
after fluid resuscitation shows that the microcirculatory alterations persisted, despite
restoring systemic hemodynamics and fluid balance. In addition to that, capillary vessels get
plugged in sepsis [488‐490] and we derived a new parameter (final plateau intensity/peak
intensity) in order to quantify this. In both studies, CEUS results were confirmed by laser‐
speckle imaging on the kidney and by sublingual Cytocam‐IDF imaging. We found that
sublingual Cytocam‐IDF is a non‐invasive and simple method to assess plugged capillaries
and to diagnose sepsis, which may also aid in diagnosis of hemorrhagic shock. The
advantage of Cytocam‐IDF imaging is that is can easily be implemented in routine clinical
270

Discussion & Outlook
workflow, while for CEUS imaging some additional translational steps may be required, as
discussed in the following section.
14.8. OUTLOOK AND FUTURE RESEARCH
CEUS and acute kidney injury
Future studies on acute kidney injury should focus on patient studies aiming to identify
whether clinical scanners are sensitive enough to detect the changes we measured with our
high‐resolution scanner. In our study we were able to detect changes in very small regions
in the microvasculature and in small arteries, which may not be visible when lower
frequencies are used because of their lower resolution. It would therefore be very helpful to
gain a full overview of parameters in the renal microcirculation, for example in terms of
peak‐enhancement, mean transit time, and wash‐in rate. To obtain this full overview of
parameters, i.e. real‐time parametric imaging, for example VueBox® analysis software
developed by Bracco could be used. This could aid in clinical validation and would also
simplify interpretation by clinicians. Next to parametric imaging, visually assessing contrast
persistence could already aid in the diagnosis of sepsis‐induced alterations.
The future of ultrasound contrast agents in the clinic
In the recent years, contrast‐enhanced ultrasound imaging has been approved for use in
more organs [23, 314] and is securing its position in routine clinical workflow. With the
recent approval of Lumason in the USA (branded as SonoVue in Europe), this is also the first
ultrasound contrast agent approved by the FDA for liver imaging and for use in pediatric
patients. Together with the re‐introduction of Definity in Europe this will likely further boost
the use of contrast‐enhanced ultrasound imaging. The next step is the introduction of
ultrasound molecular imaging in the clinic. As mentioned before, the first clinical trial has
been conducted which needs to be thoroughly evaluated in order to initiate more clinical
trials. The main advantage of ultrasound molecular imaging over for instance magnetic
resonance molecular imaging are a higher sensitivity, lower costs, and the possibility to
image in real‐time. Another advantage is the theranostic application: after adherence of a
targeted contrast agent to the biomarker of interest it can be imaged, and in the same
examination the therapy (e.g. local drug delivery by means of sonoporation) can be applied.
This can further decrease costs and is more time efficient. With the current focus on drug
delivery and molecular imaging this could well be clinically accepted within the coming ten
years.
271

272

Bibliography
BIBLIOGRAPHY
[1] A. C. Guyton and J. E. Hall, Textbook of Medical Physiology, 10th ed., 2000.
[2] S. Campbell. “A short history of sonography in obstetrics and gynaecology”, Facts Views Vis Obgyn,
5, 213‐229 (2013).
[3] R. Gramiak and P. M. Shah. “Echocardiography of the aortic root”, Invest Radiol, 3, 356‐366 (1968).
[4] C. C. Coussios, C. K. Holland, L. Jakubowska, S. L. Huang, R. C. MacDonald, A. Nagaraj, and D. D.
McPherson. “In vitro characterization of liposomes and Optison by acoustic scattering at 3.5 MHz”,
Ultrasound Med Biol, 30, 181‐190 (2004).
[5] T. Faez, M. Emmer, K. Kooiman, M. Versluis, A. van der Steen, and N. de Jong. “20 years of ultrasound
contrast agent modeling”, IEEE Trans Ultrason Ferroelectr Freq Control, 60, 7‐20 (2013).
[6] N. de Jong, L. Hoff, T. Skotland, and N. Bom. “Absorption and scatter of encapsulated gas filled
microspheres: theoretical considerations and some measurements”, Ultrasonics, 30, 95‐103 (1992).
[7] M. Schneider, M. Arditi, M. B. Barrau, J. Brochot, A. Broillet, R. Ventrone, and F. Yan. “BR1: a new
ultrasonographic contrast agent based on sulfur hexafluoride‐filled microbubbles”, Invest Radiol,
30, 451‐457 (1995).
[8] B. D. Inc.. “Lumason Safety Label”, FDA/Center for Drug Evaluation and Research, Silver Spring,
USAMarch 2016 2016.
[9] L. M. Imaging. “Definity Safety Label”, FDA/Center for Drug Evaluation and Research, Silver Spring,
USAOctober 2011 2011.
[10] C. K. Holland, R. A. Roy, R. E. Apfel, and L. A. Crum. “In vitro detection of cavitation induced by a
diagnostic ultrasound system”, IEEE Trans Ultrason Ferroelectr Freq Control, 39, 95‐101 (1992).
[11] P. C. Sontum. “Physicochemical characteristics of Sonazoid, a new contrast agent for ultrasound
imaging”, Ultrasound Med Biol, 34, 824‐833 (2008).
[12] C. D. Ohl, M. Arora, R. Ikink, N. de Jong, M. Versluis, M. Delius, and D. Lohse. “Sonoporation from
jetting cavitation bubbles”, Biophys J, 91, 4285‐4295 (2006).
[13] S. V. Kothapalli, V. Daeichin, F. Mastik, L. A. Brodin, B. Janerot‐Sjoberg, G. Paradossi, N. de Jong, and
D. Grishenkov. “Unique pumping‐out fracturing mechanism of a polymer‐shelled contrast agent: an
acoustic characterization and optical visualization”, IEEE Trans Ultrason Ferroelectr Freq Control, 62,
451‐462 (2015).
[14] K. Kooiman, M. R. Bohmer, M. Emmer, H. J. Vos, C. Chlon, W. T. Shi, C. S. Hall, S. H. de Winter, K.
Schroen, M. Versluis, N. de Jong, and A. van Wamel. “Oil‐filled polymer microcapsules for
ultrasound‐mediated delivery of lipophilic drugs”, J Control Release, 133, 109‐118 (2009).
[15] G. Lajoinie. “Ultrasound Contrast Agents ‐ Bubbles, Drops and Particles”, PhD thesis, Phyics of Fluids,
University of Twente, Enschede, 2015.
[16] T. Segers, L. de Rond, N. de Jong, M. Borden, and M. Versluis. “Stability of Monodisperse
Phospholipid‐Coated Microbubbles Formed by Flow‐Focusing at High Production Rates”, Langmuir,
32, 3937‐3944 (2016).
[17] A. L. Klibanov. “Ultrasound Contrast Materials in Cardiovascular Medicine: from Perfusion
Assessment to Molecular Imaging”, J Cardiovasc Transl Res, (2013).
[18] Y. Luan, T. Faez, E. Gelderblom, I. Skachkov, B. Geers, I. Lentacker, T. van der Steen, M. Versluis, and
N. de Jong. “Acoustical properties of individual liposome‐loaded microbubbles”, Ultrasound Med
Biol, 38, 2174‐2185 (2012).
273
Bibliography
[19] P. Marmottant, S. van der Meer, M. Emmer, M. Versluis, N. de Jong, S. Hilgenfeldt, and D. Lohse. “A
model for large amplitude oscillations of coated bubbles accounting for buckling and rupture”, J
Acoust Soc Am, 118, 3499‐3505 (2005).
[20] S. M. van der Meer, B. Dollet, M. M. Voormolen, C. T. Chin, A. Bouakaz, N. de Jong, M. Versluis, and
D. Lohse. “Microbubble spectroscopy of ultrasound contrast agents”, J Acoust Soc Am, 121, 648‐656
(2007).
[21] S. Fokong, B. Theek, Z. Wu, P. Koczera, L. Appold, S. Jorge, U. Resch‐Genger, M. van Zandvoort, G.
Storm, F. Kiessling, and T. Lammers. “Image‐guided, targeted and triggered drug delivery to tumors
using polymer‐based microbubbles”, J Control Release, 163, 75‐81 (2012).
[22] ICUS. “Comparison of Adverse Event Rates”, International Contrast Ultrasound Society, Chicago,
USA23/07/2016 2009.
[23] F. Piscaglia, C. Nolsoe, C. F. Dietrich, D. O. Cosgrove, O. H. Gilja, M. B. Nielsen, T. Albrecht, L. Barozzi,
M. Bertolotto, O. Catalano, M. Claudon, D. A. Clevert, J. M. Correas, M. D'Onofrio, F. M. Drudi, J.
Eyding, M. Giovannini, M. Hocke, A. Ignee, E. M. Jung, A. S. Klauser, N. Lassau, E. Leen, G. Mathis, A.
Saftoiu, G. Seidel, P. S. Sidhu, G. ter Haar, D. Timmerman, and H. P. Weskott. “The EFSUMB
Guidelines and Recommendations on the Clinical Practic of Contrast Enhanced Ultrasound (CEUS):
Update 2011 on non‐hepatic applications”, Ultraschall Med, 33, 33‐59 (2012).
[24] H. A. Al‐Mansour, S. L. Mulvagh, G. M. Pumper, K. W. Klarich, and D. A. Foley. “Usefulness of
harmonic imaging for left ventricular opacification and endocardial border delineation by optison”,
Am J Cardiol, 85, 795‐799, A710 (2000).
[25] E. Leen, P. Ceccotti, C. Kalogeropoulou, W. J. Angerson, S. J. Moug, and P. G. Horgan. “Prospective
multicenter trial evaluating a novel method of characterizing focal liver lesions using contrast‐
enhanced sonography”, AJR Am J Roentgenol, 186, 1551‐1559 (2006).
[26] W. Lepper, T. Belcik, K. Wei, J. R. Lindner, J. Sklenar, and S. Kaul. “Myocardial contrast
echocardiography”, Circulation, 109, 3132‐3135 (2004).
[27] D. M. McDonald and P. L. Choyke. “Imaging of angiogenesis: from microscope to clinic”, Nat Med, 9,
713‐725 (2003).
[28] S. Hernot and A. L. Klibanov. “Microbubbles in ultrasound‐triggered drug and gene delivery”, Adv
Drug Deliv Rev, 60, 1153‐1166 (2008).
[29] A. L. Klibanov. “Ultrasound molecular imaging with targeted microbubble contrast agents”, J Nucl
Cardiol, 14, 876‐884 (2007).
[30] F. Tranquart, M. Arditi, T. Bettinger, P. Frinking, J. M. Hyvelin, A. Nunn, S. Pochon, and I. Tardy.
“Ultrasound Contrast Agents For Ultrasound Molecular Imaging”, Z Gastroenterol, 52, 1268‐1276
(2014).
[31] L. Abou‐Elkacem, S. V. Bachawal, and J. K. Willmann. “Ultrasound molecular imaging: Moving
toward clinical translation”, Eur J Radiol, (2015).
[32] D. Cosgrove and C. Harvey. “Clinical uses of microbubbles in diagnosis and treatment”, Med Biol Eng
Comput, 47, 813‐826 (2009).
[33] X. Chen, R. S. Leow, Y. Hu, J. M. Wan, and A. C. Yu. “Single‐site sonoporation disrupts actin
cytoskeleton organization”, J R Soc Interface, 11, 20140071 (2014).
[34] Z. Fan, H. Liu, M. Mayer, and C. X. Deng. “Spatiotemporally controlled single cell sonoporation”, Proc
Natl Acad Sci U S A, 109, 16486‐16491 (2012).
[35] K. Kooiman, M. Foppen‐Harteveld, A. F. van der Steen, and N. de Jong. “Sonoporation of endothelial
cells by vibrating targeted microbubbles”, J Control Release, 154, 35‐41 (2011).
[36] I. Lentacker, I. De Cock, R. Deckers, S. C. De Smedt, and C. T. Moonen. “Understanding ultrasound
induced sonoporation: definitions and underlying mechanisms”, Adv Drug Deliv Rev, 72, 49‐64
(2014).
274

Bibliography
[37] A. van Wamel, K. Kooiman, M. Harteveld, M. Emmer, F. J. ten Cate, M. Versluis, and N. de Jong.
“Vibrating microbubbles poking individual cells: drug transfer into cells via sonoporation”, J Control
Release, 112, 149‐155 (2006).
[38] Y. Hu, J. M. Wan, and A. C. Yu. “Membrane perforation and recovery dynamics in microbubble‐
mediated sonoporation”, Ultrasound Med Biol, 39, 2393‐2405 (2013).
[39] R. Karshafian, P. D. Bevan, R. Williams, S. Samac, and P. N. Burns. “Sonoporation by Ultrasound‐
Activated Microbubble Contrast Agents: Effect of Acoustic Exposure Parameters on Cell Membrane
Permeability and Cell Viability”, Ultrasound Med Biol, 35, 847‐860 (2009).
[40] B. D. M. Meijering, R. H. Henning, W. H. Van Gilst, I. Gavrilovic, A. Van Wamel, and L. E. Deelman.
“Optimization of ultrasound and microbubbles targeted gene delivery to cultured primary
endothelial cells”, J Drug Target, 15, 664‐671 (2007).
[41] I. De Cock, E. Zagato, K. Braeckmans, Y. Luan, N. de Jong, S. C. De Smedt, and I. Lentacker.
“Ultrasound and microbubble mediated drug delivery: acoustic pressure as determinant for uptake
via membrane pores or endocytosis”, J Control Release, 197, 20‐28 (2015).
[42] L. Rayleigh. “VIII. On the pressure developed in a liquid during the collapse of a spherical cavity”,
Philosophical Magazine Series 6, 34, 94‐98 (1917).
[43] M. S. Plesset and A. Prosperetti. “Bubble Dynamics and Cavitation”, Annual Review of Fluid
Mechanics, 9, 145‐185 (1977).
[44] T. G. Leighton, The Acoustic Bubble. London: Academic Press Limited, 1994.
[45] K. Kooiman, H. J. Vos, M. Versluis, and N. de Jong. “Acoustic behavior of microbubbles and
implications for drug delivery”, Adv Drug Deliv Rev, 72C, 28‐48 (2014).
[46] M. M. Lozano and M. L. Longo. “Microbubbles coated with disaturated lipids and DSPE‐PEG2000:
phase behavior, collapse transitions, and permeability”, Langmuir, 25, 3705‐3712 (2009).
[47] M. A. Borden, G. V. Martinez, J. Ricker, N. Tsvetkova, M. Longo, R. J. Gillies, P. A. Dayton, and K. W.
Ferrara. “Lateral phase separation in lipid‐coated microbubbles”, Langmuir, 22, 4291‐4297 (2006).
[48] M. A. Borden, G. Pu, G. J. Runner, and M. L. Longo. “Surface phase behavior and microstructure of
lipid/PEG‐emulsifier monolayer‐coated microbubbles”, Colloids Surf B Biointerfaces, 35, 209‐223
(2004).
[49] D. H. Kim, M. J. Costello, P. B. Duncan, and D. Needham. “Mechanical properties and microstructure
of polycrystalline phospholipid monolayer shells: Novel solid microparticles”, Langmuir, 19, 8455‐
8466 (2003).
[50] S. Garg, A. A. Thomas, and M. A. Borden. “The effect of lipid monolayer in‐plane rigidity on in vivo
microbubble circulation persistence”, Biomaterials, 34, 6862‐6870 (2013).
[51] A. J. Mortimer, Physical Characteristics of Ultrasound. Clifton, NJ, USA: The Humana Press Inc., 1928.
[52] T. C. Chin, C. T. Lancee, J. Borsboom, F. Mastik, M. E. Frijlink, and N. de Jong. “Brandaris 128: A digital
25 million frames per second camera with 128 highly sensitive frames”, Rev Sci Instrum, 74, 5026‐
5034 (2003).
[53] S. L. Huang, A. J. Hamilton, A. Nagaraj, S. D. Tiukinhoy, M. E. Klegerman, D. D. McPherson, and R. C.
Macdonald. “Improving ultrasound reflectivity and stability of echogenic liposomal dispersions for
use as targeted ultrasound contrast agents”, J Pharm Sci, 90, 1917‐1926 (2001).
[54] S. L. Huang, D. D. McPherson, and R. C. Macdonald. “A method to co‐encapsulate gas and drugs in
liposomes for ultrasound‐controlled drug delivery”, Ultrasound Med Biol, 34, 1272‐1280 (2008).
[55] K. B. Bader, G. Bouchoux, T. Peng, M. E. Klegerman, D. D. McPherson, and C. K. Holland.
“Thrombolytic efficacy and enzymatic activity of rt‐PA‐loaded echogenic liposomes”, J Thromb
Thrombolysis, 40, 144‐155 (2015).
[56] X. Chen, J. Wang, M. Versluis, N. de Jong, and F. S. Villanueva. “Ultra‐fast bright field and
fluorescence imaging of the dynamics of micrometer‐sized objects”, Rev Sci Instrum, 84,(2013).
275
Bibliography
[57] G. Lajoinie, E. Gelderblom, C. Chlon, M. Bohmer, W. Steenbergen, N. de Jong, S. Manohar, and M.
Versluis. “Ultrafast vapourization dynamics of laser‐activated polymeric microcapsules”, Nat
Commun, 5, 3671 (2014).
[58] K. Wilson, K. Homan, and S. Emelianov. “Biomedical photoacoustics beyond thermal expansion
using triggered nanodroplet vaporization for contrast‐enhanced imaging”, Nat Commun, 3,(2012).
[59] R. Bellomo, J. A. Kellum, and C. Ronco. “Acute kidney injury”, Lancet, 380, 756‐766 (2012).
[60] E. A. Hoste, S. M. Bagshaw, R. Bellomo, C. M. Cely, R. Colman, D. N. Cruz, K. Edipidis, L. G. Forni, C.
D. Gomersall, D. Govil, P. M. Honore, O. Joannes‐Boyau, M. Joannidis, A. M. Korhonen, A.
Lavrentieva, R. L. Mehta, P. Palevsky, E. Roessler, C. Ronco, S. Uchino, J. A. Vazquez, E. Vidal
Andrade, S. Webb, and J. A. Kellum. “Epidemiology of acute kidney injury in critically ill patients: the
multinational AKI‐EPI study”, Intensive Care Med, 41, 1411‐1423 (2015).
[61] S. S. Waikar, K. D. Liu, and G. M. Chertow. “Diagnosis, epidemiology and outcomes of acute kidney
injury”, Clin J Am Soc Nephrol, 3, 844‐861 (2008).
[62] S. Kaul. “Myocardial contrast echocardiography: a 25‐year retrospective”, Circulation, 118, 291‐308
(2008).
[63] A. Alzaraa, G. Gravante, W. Y. Chung, D. Al‐Leswas, B. Morgan, A. Dennison, and D. Lloyd. “Contrast‐
enhanced ultrasound in the preoperative, intraoperative and postoperative assessment of liver
lesions”, Hepatol Res, 43, 809‐819 (2013).
[64] J. M. Correas, O. Helenon, L. Pourcelot, and J. F. Moreau. “Ultrasound contrast agents. Examples of
blood pool agents”, Acta Radiol Suppl, 412, 101‐112 (1997).
[65] C. Greis. “Ultrasound contrast agents as markers of vascularity and microcirculation”, Clin
Hemorheol Microcirc, 43, 1‐9 (2009).
[66] H. Wu, N. G. Rognin, T. M. Krupka, L. Solorio, H. Yoshiara, G. Guenette, C. Sanders, N. Kamiyama, and
A. A. Exner. “Acoustic characterization and pharmacokinetic analyses of new nanobubble
ultrasound contrast agents”, Ultrasound Med Biol, 39, 2137‐2146 (2013).
[67] L. Wang, L. Li, Y. Guo, H. Tong, X. Fan, J. Ding, and H. Huang. “Construction and in vitro/in vivo
targeting of PSMA‐targeted nanoscale microbubbles in prostate cancer”, Prostate, 73, 1147‐1158
(2013).
[68] A. Alzaraa, G. Gravante, W. Y. Chung, D. Al‐Leswas, M. Bruno, A. R. Dennison, and D. M. Lloyd.
“Targeted microbubbles in the experimental and clinical setting”, Am J Surg, 204, 355‐366 (2012).
[69] S. Unnikrishnan and A. L. Klibanov. “Microbubbles as Ultrasound Contrast Agents for Molecular
Imaging: Preparation and Application”, Am J Roentgenol, 199, 292‐299 (2012).
[70] K. Kooiman, T. J. A. Kokhuis, T. van Rooij, I. Skachkov, A. Nigg, J. G. Bosch, A. F. W. van der Steen, W.
A. van Cappellen, and N. de Jong. “DSPC or DPPC as main shell component influences ligand
distribution and binding area of lipid‐coated targeted microbubbles”, Eur J Lipid Sci Technol, 116, 1217‐
1227 (2014).
[71] T. van Rooij, Y. Luan, G. G. J. Renaud, A. F. W. van der Steen, N. De Jong, and K. Kooiman. “Acoustical
response of DSPC versus DPPC lipid‐coated microbubbles”, in IEEE Ultrasonics Symposium
Proceedings, Prague, Czech Republic (2013).
[72] A. H. Myrset, H. B. Fjerdingstad, R. Bendiksen, B. E. Arbo, R. M. Bjerke, J. H. Johansen, M. A. Kulseth,
and R. Skurtveit. “Design and characterization of targeted ultrasound microbubbles for diagnostic
use”, Ultrasound Med Biol, 37, 136‐150 (2011).
[73] D. Marsh, R. Bartucci, and L. Sportelli. “Lipid membranes with grafted polymers: physicochemical
aspects”, Biochim Biophys Acta, 1615, 33‐59 (2003).
[74] S. Ottoboni, R. E. Short, M. B. Kerby, E. G. Tickner, E. Steadman, and T. B. Ottoboni. “Characterization
of the in vitro adherence behavior of ultrasound responsive double‐shelled microspheres targeted
to cellular adhesion molecules”, Contrast Media Mol Imaging, 1, 279‐290 (2006).
276

Bibliography
[75] C. C. Chen and M. A. Borden. “The role of poly(ethylene glycol) brush architecture in complement
activation on targeted microbubble surfaces”, Biomaterials, 32, 6579‐6587 (2011).
[76] F. Kiessling, S. Fokong, J. Bzyl, W. Lederle, M. Palmowski, and T. Lammers. “Recent advances in
molecular, multimodal and theranostic ultrasound imaging”, Adv Drug Deliv Rev, 72, 15‐27 (2014).
[77] S. Hernot, S. Unnikrishnan, Z. M. Du, T. Shevchenko, B. Cosyns, A. Broisat, J. Toczek, V. Caveliers, S.
Muyldermans, T. Lahoutte, A. L. Klibanov, and N. Devoogdt. “Nanobody‐coupled microbubbles as
novel molecular tracer”, J Control Release, 158, 346‐353 (2012).
[78] M. A. Nakatsuka, R. F. Mattrey, S. C. Esener, J. N. Cha, and A. P. Goodwin. “Aptamer‐crosslinked
microbubbles: smart contrast agents for thrombin‐activated ultrasound imaging”, Adv Mater, 24,
6010‐6016 (2012).
[79] M. A. Wheatley, J. D. Lathia, and K. L. Oum. “Polymeric ultrasound contrast agents targeted to
integrins: Importance of process methods and surface density of ligands”, Biomacromolecules, 8,
516‐522 (2007).
[80] G. Paganelli, C. Belloni, P. Magnani, F. Zito, A. Pasini, I. Sassi, M. Meroni, M. Mariani, M. Vignali, A. G.
Siccardi, and F. Fazio. “Two‐step tumour targetting in ovarian cancer patients using biotinylated
monoclonal antibodies and radioactive streptavidin”, Eur J Nuc Med, 19, 322‐329 (1992).
[81] T. J. Kokhuis, I. Skachkov, B. A. Naaijkens, L. J. Juffermans, O. Kamp, K. Kooiman, A. F. van der Steen,
M. Versluis, and N. de Jong. “Intravital microscopy of localized stem cell delivery using microbubbles
and acoustic radiation force”, Biotechnol Bioeng, 112, 220‐227 (2015).
[82] D. H. Kim, A. L. Klibanov, and D. Needham. “The Influence of Tiered Layers of Surface‐Grafted
Poly(ethylene glycol) on Receptor‐Ligand‐Mediated Adhesion between Phospholipid Monolayer‐
Stabilized Microbubbles and Coated Glass Beads”, Langmuir, 16, 2808‐2817 (2000).
[83] X. Wei, Y. Li, S. Zhang, X. Gao, Y. Luo, and M. Gao. “Ultrasound targeted apoptosis imaging in
monitoring early tumor response of trastuzumab in a murine tumor xenograft model of her‐2‐
positive breast cancer(1.)”, Transl Oncol, 7, 284‐291 (2014).
[84] S. Pochon, I. Tardy, P. Bussat, T. Bettinger, J. Brochot, M. von Wronski, L. Passantino, and M.
Schneider. “BR55: a lipopeptide‐based VEGFR2‐targeted ultrasound contrast agent for molecular
imaging of angiogenesis”, Invest Radiol, 45, 89‐95 (2010).
[85] S. Fokong, A. Fragoso, A. Rix, A. Curaj, Z. J. Wu, W. Lederle, O. Iranzo, J. Gatjens, F. Kiessling, and M.
Palmowski. “Ultrasound Molecular Imaging of E‐Selectin in Tumor Vessels Using Poly n‐Butyl
Cyanoacrylate Microbubbles Covalently Coupled to a Short Targeting Peptide”, Invest Radiol, 48,
843‐850 (2013).
[86] J. K. Willmann, A. M. Lutz, R. Paulmurugan, M. R. Patel, P. Chu, J. Rosenberg, and S. S. Gambhir.
“Dual‐targeted contrast agent for US assessment of tumor angiogenesis in vivo”, Radiology, 248,
936‐944 (2008).
[87] H. Y. Jun, S. H. Park, H. S. Kim, and K. H. Yoon. “Long Residence Time of Ultrasound Microbubbles
Targeted to Integrin in Murine Tumor Model”, Acad Radiol, 17, 54‐60 (2010).
[88] K. Otani and K. Yamahara. “Feasibility of Lactadherin‐Bearing Clinically Available Microbubbles as
Ultrasound Contrast Agent for Angiogenesis”, Molecular Imaging and Biology, 15, 534‐541 (2013).
[89] H. Wijkstra, M. Smeenge, J. de la Rosette, S. Pochon, I. Tardy‐Cantalupi, and F. Tranquart. “Targeted
microbubble prostate cancer imaging with BR55”, in Abstract book of the 17th European Symposium
on Ultrasound Contrast Imaging, 2012.
[90] B. A. Kaufmann, J. M. Sanders, C. Davis, A. Xie, P. Aldred, I. J. Sarembock, and J. R. Lindner.
“Molecular imaging of inflammation in atherosclerosis with targeted ultrasound detection of
vascular cell adhesion molecule‐1”, Circulation, 116, 276‐284 (2007).
277
Bibliography
[91] B. A. Kaufmann, C. Lewis, A. Xie, A. Mirza‐Mohd, and J. R. Lindner. “Detection of recent myocardial
ischaemia by molecular imaging of P‐selectin with targeted contrast echocardiography”, Eur Heart
J, 28, 2011‐2017 (2007).
[92] H. Kim, M. R. Moody, S. T. Laing, P. H. Kee, S. L. Huang, M. E. Klegerman, and D. D. McPherson. “In
Vivo Volumetric Intravascular Ultrasound Visualization of Early/Inflammatory Arterial Atheroma
Using Targeted Echogenic Immunoliposomes”, Invest Radiol, 45, 685‐691 (2010).
[93] B. A. Kaufmann, C. L. Carr, J. T. Belcik, A. Xie, Q. Yue, S. Chadderdon, E. S. Caplan, J. Khangura, S.
Bullens, S. Bunting, and J. R. Lindner. “Molecular Imaging of the Initial Inflammatory Response in
Atherosclerosis Implications for Early Detection of Disease”, Arteriosclerosis Thrombosis and
Vascular Biology, 30, 54‐U132 (2010).
[94] Q. N. Wen, S. R. Wan, Z. L. Liu, S. Xu, H. R. Wang, and B. Yang. “Ultrasound Contrast Agents and
Ultrasound Molecular Imaging”, J Nanosci Nanotechnol, 14, 190‐209 (2014).
[95] J. J. Rychak, J. R. Lindner, K. Ley, and A. L. Klibanov. “Deformable gas‐filled microbubbles targeted
to P‐selectin”, J Control Release, 114, 288‐299 (2006).
[96] X. Wang, C. E. Hagemeyer, J. D. Hohmann, E. Leitner, P. C. Armstrong, F. Jia, M. Olschewski, A.
Needles, K. Peter, and I. Ahrens. “Novel single‐chain antibody‐targeted microbubbles for molecular
ultrasound imaging of thrombosis: validation of a unique noninvasive method for rapid and sensitive
detection of thrombi and monitoring of success or failure of thrombolysis in mice”, Circulation, 125,
3117‐3126 (2012).
[97] P. A. Schumann, J. P. Christiansen, R. M. Quigley, T. P. McCreery, R. H. Sweitzer, E. C. Unger, J. R.
Lindner, and T. O. Matsunaga. “Targeted‐microbubble binding selectively to GPIIb IIIa receptors of
platelet thrombi”, Invest Radiol, 37, 587‐593 (2002).
[98] C. Cheng, F. Helderman, D. Tempel, D. Segers, B. Hierck, R. Poelmann, A. van Tol, D. J. Duncker, D.
Robbers‐Visser, N. T. C. Ursem, R. van Haperen, J. J. Wentzel, F. Gijsen, A. F. W. van der Steen, R. de
Crom, and R. Krams. “Large variations in absolute wall shear stress levels within one species and
between species”, Atherosclerosis, 195, 225‐235 (2007).
[99] M. A. Nakatsuka, C. V. Barback, K. R. Fitch, A. R. Farwell, S. C. Esener, R. F. Mattrey, J. N. Cha, and A.
P. Goodwin. “In vivo ultrasound visualization of non‐occlusive blood clots with thrombin‐sensitive
contrast agents”, Biomaterials, 34, 9559‐9565 (2013).
[100] I. M. Thompson, D. K. Pauler, P. J. Goodman, C. M. Tangen, M. S. Lucia, H. L. Parnes, L. M. Minasian,
L. G. Ford, S. M. Lippman, E. D. Crawford, J. J. Crowley, and C. A. Coltman. “Prevalence of prostate
cancer among men with a prostate‐specific antigen level <= 4.0 ng per milliliter”, N Engl J Med, 350,
2239‐2246 (2004).
[101] S. Perner, M. D. Hofer, R. Kim, R. B. Shah, H. J. Li, P. Moller, R. E. Hautmann, J. E. Gschwend, R.
Kuefer, and M. A. Rubin. “Prostate‐specific membrane antigen expression as a predictor of prostate
cancer progression”, Human Pathology, 38, 696‐701 (2007).
[102] V. Sanna, G. Pintus, P. Bandiera, R. Anedda, S. Punzoni, B. Sanna, V. Migaleddu, S. Uzzau, and M.
Sechi. “Development of polymeric microbubbles targeted to prostate‐specific membrane antigen
as prototype of novel ultrasound contrast agents”, Mol Pharm, 8, 748‐757 (2011).
[103] J. K. Tsuruta, N. Klauber‐DeMore, J. Streeter, J. Samples, C. Patterson, R. J. Mumper, D. Ketelsen,
and P. Dayton. “Ultrasound Molecular Imaging of Secreted Frizzled Related Protein‐2 Expression in
Murine Angiosarcoma”, Plos One, 9,(2014).
[104] A. M. Lutz, S. V. Bachawal, C. W. Drescher, M. A. Pysz, J. K. Willmann, and S. S. Gambhir. “Ultrasound
Molecular Imaging in a Human CD276 Expression‐Modulated Murine Ovarian Cancer Model”, Clinical
Cancer Research, 20, 1313‐1322 (2014).
278
Bibliography
[105] K. Foygel, H. J. Wang, S. Machtaler, A. M. Lutz, R. Chen, M. Pysz, A. W. Lowe, L. Tian, T. Carrigan, T.
A. Brentnall, and J. K. Willmann. “Detection of Pancreatic Ductal Adenocarcinoma in Mice by
Ultrasound Imaging of Thymocyte Differentiation Antigen 1”, Gastroenterology, 145, 885‐+ (2013).
[106] J. A. Knowles, C. H. Heath, R. Saini, H. Umphrey, J. Warram, K. Hoyt, and E. L. Rosenthal. “Molecular
Targeting of Ultrasonographic Contrast Agent for Detection of Head and Neck Squamous Cell
Carcinoma”, Archives of Otolaryngology‐Head & Neck Surgery, 138, 662‐668 (2012).
[107] G. Koopman, C. P. M. Reutelingsperger, G. A. M. Kuijten, R. M. J. Keehnen, S. T. Pals, and M. H. J.
Vanoers. “Annexin‐V for Flow Cytometric Detection of Phosphatidylserine Expression on B‐Cells
Undergoing Apoptosis”, Blood, 84, 1415‐1420 (1994).
[108] E. A. Ferrante, J. E. Pickard, J. Rychak, A. Klibanov, and K. Ley. “Dual targeting improves microbubble
contrast agent adhesion to VCAM‐1 and P‐selectin under flow”, J Control Release, 140, 100‐107 (2009).
[109] J. M. Warram, A. G. Sorace, R. Saini, H. R. Umphrey, K. R. Zinn, and K. Hoyt. “A Triple‐Targeted
Ultrasound Contrast Agent Provides Improved Localization to Tumor Vasculature”, J Ultrasound
Med, 30, 921‐931 (2011).
[110] A. S. Ham, A. L. Klibanov, and M. B. Lawrence. “Action at a Distance: Lengthening Adhesion Bonds
with Poly(ethylene glycol) Spacers Enhances Mechanically Stressed Affinity for Improved Vascular
Targeting of Microparticles”, Langmuir, 25, 10038‐10044 (2009).
[111] T. M. Maul, D. D. Dudgeon, M. T. Beste, D. A. Hammer, J. S. Lazo, F. S. Villanueva, and W. R. Wagner.
“Optimization of Ultrasound Contrast Agents With Computational Models to Improve Selection of
Ligands and Binding Strength”, Biotechnol Bioeng, 107, 854‐864 (2010).
[112] K. Soetanto and H. Watarai. “Development of magnetic microbubbles for drug delivery system
(DDS)”, Jpn J Appl Phys, 39, 3230‐3232 (2000).
[113] E. Stride, C. Porter, A. G. Prieto, and Q. Pankhurst. “Enhancement of Microbubble Mediated Gene
Delivery by Simultaneous Exposure to Ultrasonic and Magnetic Fields”, Ultrasound Med Biol, 35, 861‐
868 (2009).
[114] K. Soetanto and H. Watarai. “Ferromagnetic ultrasound microbubbles contrast agent”, Proceedings
of the 25th Annual International Conference of the IEEE Engineering in Medicine and Biology Society,
Vols 1‐4, 25, 1226‐1229 (2003).
[115] J. Owen, Q. Pankhurst, and E. Stride. “Magnetic targeting and ultrasound mediated drug delivery:
Benefits, limitations and combination”, Int J Hyperthermia, 28, 362‐373 (2012).
[116] G. R. Torr. “The Acoustic Radiation Force”, Am J Phys, 52, 402‐408 (1984).
[117] M. A. Borden, M. R. Sarantos, S. M. Stieger, S. I. Simon, K. W. Ferrara, and P. A. Dayton. “Ultrasound
radiation force modulates ligand availability on targeted contrast agents”, Mol Imaging, 5, 139‐147
(2006).
[118] M. A. Borden, J. E. Streeter, S. R. Sirsi, and P. A. Dayton. “In Vivo Demonstration of Cancer Molecular
Imaging with Ultrasound Radiation Force and Buried‐Ligand Microbubbles”, Mol Imaging, 12,(2013).
[119] S. Y. Wang, J. A. Hossack, A. L. Klibanov, and F. W. Mauldin. “Binding dynamics of targeted
microbubbles in response to modulated acoustic radiation force”, Phys Med Biol, 59, 465‐484 (2014).
[120] P. J. Frinking, I. Tardy, M. Theraulaz, M. Arditi, J. Powers, S. Pochon, and F. Tranquart. “Effects of
Acoustic Radiation Force on the Binding Efficiency of BR55, a VEGFR2‐Specific Ultrasound Contrast
Agent”, Ultrasound Med Biol, 38, 1460‐1469 (2012).
[121] V. Sboros, E. Glynos, J. A. Ross, C. M. Moran, S. D. Pye, M. Butler, W. N. McDicken, S. B. Brown, and
V. Koutsos. “Probing microbubble targeting with atomic force microscopy”, Colloids and Surfaces B‐
Biointerfaces, 80, 12‐17 (2010).
[122] A. M. Takalkar, A. L. Klibanov, J. J. Rychak, J. R. Lindner, and K. Ley. “Binding and detachment
dynamics of microbubbles targeted to P‐selectin under controlled shear flow”, J Control Release, 96,
473‐482 (2004).
279

Bibliography
[123] T. J. Kokhuis, V. Garbin, K. Kooiman, B. A. Naaijkens, L. J. Juffermans, O. Kamp, A. F. van der Steen,
M. Versluis, and N. de Jong. “Secondary bjerknes forces deform targeted microbubbles”, Ultrasound
Med Biol, 39, 490‐506 (2013).
[124] V. Garbin, D. Cojoc, E. Ferrari, and E. Di Fabrizio. “Changes in microbubble dynamics near a boundary
revealed by combined optical micromanipulation and high‐speed imaging”, App Phys Lett, (2007).
[125] K. Chetty, E. Stride, C. A. Sennoga, J. V. Hajnal, and R. J. Eckersley. “High‐speed optical observations
and simulation results of SonoVue microbubbles at low‐pressure insonation”, IEEE Trans Ultrason
Ferroelectr Freq Control, 55, 1333‐1342 (2008).
[126] T. Faez, D. Goertz, and N. De Jong. “Characterization of Definity ultrasound contrast agent at
frequency range of 5‐15 MHz”, Ultrasound Med Biol, 37, 338‐342 (2011).
[127] J. M. Gorce, M. Arditi, and M. Schneider. “Influence of bubble size distribution on the echogenicity
of ultrasound contrast agents: a study of SonoVue”, Invest Radiol, 35, 661‐671 (2000).
[128] B. L. Helfield and D. E. Goertz. “Nonlinear resonance behavior and linear shell estimates for Definity
and MicroMarker assessed with acoustic microbubble spectroscopy”, J Acoust Soc Am, 133, 1158‐1168
(2013).
[129] A. L. Klibanov, P. T. Rasche, M. S. Hughes, J. K. Wojdyla, K. P. Galen, J. H. Wible, Jr., and G. H.
Brandenburger. “Detection of individual microbubbles of ultrasound contrast agents: imaging of
free‐floating and targeted bubbles”, Invest Radiol, 39, 187‐195 (2004).
[130] J. E. G. McKendry, C.A. Johnson, B.R.G. Coletta, P.L. Evans, J.A. Evans, S.D.. “Force spectroscopy of
streptavidin conjugated lipid coated microbubbles”, Bubble Sci Eng Technol, 2,(2010).
[131] R. H. Abou‐Saleh, S. A. Peyman, K. Critchley, S. D. Evans, and N. H. Thomson. “Nanomechanics of
lipid encapsulated microbubbles with functional coatings”, Langmuir, 29, 4096‐4103 (2013).
[132] J. R. Lindner, J. Song, J. Christiansen, A. L. Klibanov, F. Xu, and K. Ley. “Ultrasound assessment of
inflammation and renal tissue injury with microbubbles targeted to P‐selectin”, Circulation, 104, 2107‐
2112 (2001).
[133] S. Dieluweit, A. Csiszar, W. Rubner, J. Fleischhauer, S. Houben, and R. Merkel. “Mechanical
Properties of Bare and Protein‐Coated Giant Unilamellar Phospholipid Vesicles. A Comparative Study
of Micropipet Aspiration and Atomic Force Microscopy”, Langmuir, 26, 11041‐11049 (2010).
[134] S. A. Darst, M. Ahlers, P. H. Meller, E. W. Kubalek, R. Blankenburg, H. O. Ribi, H. Ringsdorf, and R. D.
Kornberg. “Two‐dimensional crystals of streptavidin on biotinylated lipid layers and their
interactions with biotinylated macromolecules”, Biophys J, 59, 387‐396 (1991).
[135] M. A. Borden, D. E. Kruse, C. F. Caskey, S. Zhao, P. A. Dayton, and K. W. Ferrara. “Influence of lipid
shell physicochemical properties on ultrasound‐induced microbubble destruction”, IEEE Trans
Ultrason Ferroelectr Freq Control, 52, 1992‐2002 (2005).
[136] M. Overvelde, V. Garbin, B. Dollet, N. de Jong, D. Lohse, and M. Versluis. “Dynamics of coated
microbubbles adherent to a wall”, Ultrasound Med Biol, 37, 1500‐1508 (2011).
[137] Life Technologies. Proteins and Amino Acids [Online]. Available:
http://www.lifetechnologies.com/nl/en/home/references/ambion‐tech‐support/rna‐tools‐and‐
calculators/proteins‐and‐amino‐acids.html
[138] A. L. Klibanov. “Preparation of targeted microbubbles: ultrasound contrast agents for molecular
imaging”, Med Biol Eng Comput, 47, 875‐882 (2009).
[139] S. Zhao, K. W. Ferrara, and P. A. Dayton. “Asymmetric oscillation of adherent targeted ultrasound
contrast agents”, Appl Phys Lett, 87, 1341031‐1341033 (2005).
[140] S. Zhao, D. E. Kruse, K. W. Ferrara, and P. A. Dayton. “Acoustic response from adherent targeted
contrast agents”, J Acoust Soc Am, 120, EL63‐69 (2006).
280
Bibliography
[141] J. Casey, C. Sennoga, H. Mulvana, J. V. Hajnal, M. X. Tang, and R. J. Eckersley. “Single bubble acoustic
characterization and stability measurement of adherent microbubbles”, Ultrasound Med Biol, 39,
903‐914 (2013).
[142] B. L. Helfield, E. Cherin, F. S. Foster, and D. E. Goertz. “The effect of binding on the subharmonic
emissions from individual lipid‐encapsulated microbubbles at transmit frequencies of 11 and 25
MHz”, Ultrasound Med Biol, 39, 345‐359 (2013).
[143] B. J. Schmidt, I. Sousa, A. A. van Beek, and M. R. Bohmer. “Adhesion and ultrasound‐induced delivery
from monodisperse microbubbles in a parallel plate flow cell”, J Control Release, 131, 19‐26 (2008).
[144] B. Cerroni, E. Chiessi, S. Margheritelli, L. Oddo, and G. Paradossi. “Polymer Shelled Microparticles for
a Targeted Doxorubicin Delivery in Cancer Therapy”, Biomacromolecules, 12, 593‐601 (2011).
[145] D. Grishenkov, L. Kari, L. A. Brodin, T. B. Brismar, and G. Paradossi. “In vitro contrast‐enhanced
ultrasound measurements of capillary microcirculation: Comparison between polymer‐ and
phospholipid‐shelled microbubbles”, Ultrasonics, 51, 40‐48 (2011).
[146] N. de Jong, A. Bouakaz, and P. Frinking. “Basic acoustic properties of microbubbles”,
Echocardiography, 19, 229‐240 (2002).
[147] A. I. Eller and H. G. Flynn. “Generation of Subharmonics of Order One‐Half by Bubbles in a Sound
Field”, J Acoust Soc Am, 46, 722‐727 (1969).
[148] J. Chomas, P. Dayton, D. May, and K. Ferrara. “Nondestructive subharmonic imaging”, IEEE Trans
Ultrason Ferroelectr Freq Control, 49, 883‐892 (2002).
[149] D. E. Goertz, M. E. Frijlink, D. Tempel, V. Bhagwandas, A. Gisolf, R. Krams, N. de Jong, and A. F. W.
van der Steen. “Subharmonic contrast intravascular ultrasound for vasa vasorum imaging”,
Ultrasound Med Biol, 33, 1859‐1872 (2007).
[150] A. Needles, D. E. Goertz, R. Karshafian, E. Cherin, A. S. Brown, P. N. Burns, and F. S. Foster. “High‐
frequency subharmonic pulsed‐wave Doppler and color flow imaging of microbubble contrast
agents”, Ultrasound Med Biol, 34, 1139‐1151 (2008).
[151] C. Y. Wu, J. Tsao, and Y. H. Chou. “An ultrasonic microbubble semi‐intermodulated imaging
technique”, Ultrasound Med Biol, 31, 1199‐1210 (2005).
[152] C. X. Deng, F. L. Lizzi, A. Kalisz, A. Rosado, R. H. Silverman, and D. J. Coleman. “Study of ultrasonic
contrast agents using a dual‐frequency band technique”, Ultrasound Med Biol, 26, 819‐831 (2000).
[153] W. T. Shi and F. Forsberg. “Ultrasonic characterization of the nonlinear properties of contrast
microbubbles”, Ultrasound Med Biol, 26, 93‐104 (2000).
[154] S. G. Chen, R. Kinnick, J. F. Greenleaf, and M. Fatemi. “Difference frequency and its harmonic emitted
by microbubbles under dual frequency excitation”, Ultrasonics, 44, E123‐E126 (2006).
[155] P. N. Burns, J. E. Powers, D. H. Simpson, A. Brezina, A. Kolin, C. T. Chin, V. Uhlendorf, and T. Fritzsch.
“Harmonic Power Mode Doppler Using Microbubble Contrast Agents ‐ an Improved Method for
Small Vessel Flow Imaging”, IEEE Ultrasonics Symposium Proceedings, Vols 1‐3, 1547‐1550 (1994).
[156] C. Pi Hsien, K. K. Shun, W. Shih‐Jeh, and H. B. Levene. “Second harmonic imaging and harmonic
Doppler measurements with Albunex”, IEEE Trans Ultrason Ferroelectr Freq Control, 42, 1020‐1027
(1995).
[157] D. H. Simpson and P. N. Burns. “Pulse inversion Doppler: a new method for detecting nonlinear
echoes from microbubble contrast agents”, IEEE Ultrasonics Symposium Proceedings, vol 1592, 1597‐
1600 (1997).
[158] N. de Jong, P. J. Frinking, A. Bouakaz, and F. J. Ten Cate. “Detection procedures of ultrasound
contrast agents”, Ultrasonics, 38, 87‐92 (2000).
[159] C. X. Deng and F. L. Lizzi. “A review of physical phenomena associated with ultrasonic contrast
agents and illustrative clinical applications”, Ultrasound Med Biol, 28, 277‐286 (2002).
281
Bibliography
[160] F. S. Foster, J. Hossack, and S. L. Adamson. “Micro‐ultrasound for preclinical imaging”, Interface
Focus, 1, 576‐601 (2011).
[161] A. Needles, M. Arditi, N. G. Rognin, J. Mehi, T. Coulthard, C. Bilan‐Tracey, E. Gaud, P. Frinking, D.
Hirson, and F. S. Foster. “Nonlinear contrast imaging with an array‐based micro‐ultrasound system”,
Ultrasound Med Biol, 36, 2097‐2106 (2010).
[162] A. Lyshchik, A. C. Fleischer, J. Huamani, D. E. Hallahan, M. Brissova, and J. C. Gore. “Molecular
imaging of vascular endothelial growth factor receptor 2 expression using targeted contrast‐
enhanced high‐frequency ultrasonography”, J Ultrasound Med, 26, 1575‐1586 (2007).
[163] J. J. Rychak, J. Graba, A. M. Cheung, B. S. Mystry, J. R. Lindner, R. S. Kerbel, and F. S. Foster.
“Microultrasound molecular imaging of vascular endothelial growth factor receptor 2 in a mouse
model of tumor angiogenesis”, Mol Imaging, 6, 289‐296 (2007).
[164] J. K. Willmann, R. Paulmurugan, K. Chen, O. Gheysens, M. Rodriguez‐Porcel, A. M. Lutz, I. Y. Chen, X.
Chen, and S. S. Gambhir. “US imaging of tumor angiogenesis with microbubbles targeted to vascular
endothelial growth factor receptor type 2 in mice”, Radiology, 246, 508‐518 (2008).
[165] C. M. Moran, R. J. Watson, K. A. A. Fox, and W. N. McDicken. “In vitro acoustic characterisation of
four intravenous ultrasonic contrast agents at 30 MHz”, Ultrasound Med Biol, 28, 785‐791 (2002).
[166] G. L. ten Kate, G. G. Renaud, Z. Akkus, S. C. van den Oord, F. J. ten Cate, V. Shamdasani, R. R. Entrekin,
E. J. Sijbrands, N. de Jong, J. G. Bosch, A. F. Schinkel, and A. F. van der Steen. “Far‐wall
pseudoenhancement during contrast‐enhanced ultrasound of the carotid arteries: clinical
description and in vitro reproduction”, Ultrasound Med Biol, 38, 593‐600 (2012).
[167] M. X. Tang, N. Kamiyama, and R. J. Eckersley. “Effects of Nonlinear Propagation in Ultrasound
Contrast Agent Imaging”, Ultrasound Med Biol, 36, 459‐466 (2010).
[168] G. Renaud, J. G. Bosch, N. de Jong, A. F. W. van der Steen, V. Shamdasani, and R. Entrekin. “Counter‐
propagation interaction for contrast‐enhanced ultrasound imaging”, 2012 IEEE International
Ultrasonics Symposium, (2012).
[169] H. J. Yu, H. J. Jang, T. K. Kim, K. Khalili, R. Williams, G. Lueck, J. Hudson, and P. N. Burns.
“Pseudoenhancement Within the Local Ablation Zone of Hepatic Tumors Due to a Nonlinear Artifact
on Contrast‐Enhanced Ultrasound”, Am J Roentgenol, 194, 653‐659 (2010).
[170] A. Thapar, J. Shalhoub, M. Averkiou, C. Mannaris, A. H. Davies, and E. L. S. Leen. “Dose‐Dependent
Artifact in the Far Wall of the Carotid Artery at Dynamic Contrast‐enhanced US”, Radiology, 262, 672‐
679 (2012).
[171] R. Hansen, B. A. J. Angelsen, P. N. Burns, A. Bouakaz, J. Borsboom, M. Versluis, and N. de Jong.
“Radial modulation imaging”, in Proc. 10th European Symp. Ultrasound Contrast Imaging, Rotterdam,
The Netherlands, 2005.
[172] M. E. Frijlink, D. E. Goertz, A. Bouakaz, and A. F. W. van der Steen. “A simulation study on tissue
harmonic imaging with a single‐element intravascular ultrasound catheter”, J Acoust Soc Am, 120,
1723‐1731 (2006).
[173] J. Jimenez‐Fernandez. “Nonlinear response to ultrasound of encapsulated microbubbles”,
Ultrasonics, 52, 784‐793 (2012).
[174] J. Park, X. Li, Q. F. Zhou, and K. K. Shung. “Combined chirp coded tissue harmonic and fundamental
ultrasound imaging for intravascular ultrasound: 20‐60 MHz phantom and ex vivo results”,
Ultrasonics, 53, 369‐376 (2013).
[175] C. C. Shen and C. H. Lin. “Chirp‐Encoded Excitation for Dual‐Frequency Ultrasound Tissue Harmonic
Imaging”, IEEE Trans Ultrason Ferroelectr Freq Control, 59, 2420‐2430 (2012).
[176] J. Park, Y. Huang, R. M. Chen, J. Lee, T. M. Cummins, Q. F. Zhou, C. L. Lien, and K. K. Shung. “Pulse
Inversion Chirp Coded Tissue Harmonic Imaging (PI‐CTHI) of Zebrafish Heart Using High Frame Rate
Ultrasound Biomicroscopy”, Annals of Biomedical Engineering, 41, 41‐52 (2013).
282

Bibliography
[177] A. Novell, C. A. Sennoga, J. M. Escoffre, J. Chaline, and A. Bouakaz. “Evaluation of chirp reversal
power modulation sequence for contrast agent imaging”, Phys Med Biol, 59, 5101‐5117 (2014).
[178] M. R. Sprague, E. Cherin, D. E. Goertz, and F. S. Foster. “Nonlinear Emission from Individual Bound
Microbubbles at High Frequencies”, Ultrasound Med Biol, 36, 313‐324 (2010).
[179] J. N. Tjotta and S. Tjotta. “An Analytical Model for the Nearfield of a Baffled Piston Transducer”, J
Acoust Soc Am, 68, 334‐339 (1980).
[180] T. Faez, M. Emmer, M. Docter, J. Sijl, M. Versluis, and N. de Jong. “Characterizing the subharmonic
response of phospholipid‐coated microbubbles for carotid imaging”, Ultrasound Med Biol, 37, 958‐
970 (2011).
[181] P. M. Shankar, P. Dala Krishna, and V. L. Newhouse. “Advantages of subharmonic over second
harmonic backscatter for contrast‐to‐tissue echo enhancement”, Ultrasound Med Biol, 24, 395‐399
(1998).
[182] F. Forsberg, J. B. Liu, W. T. Shi, J. Furuse, M. Shimizu, and B. B. Goldberg. “In vivo pressure estimation
using subharmonic contrast microbubble signals: Proof of concept”, IEEE Trans Ultrason Ferroelectr
Freq Control, 52, 581‐583 (2005).
[183] D. Zhang, Y. Gong, X. Gong, Z. Liu, K. Tan, and H. Zheng. “Enhancement of subharmonic emission
from encapsulated microbubbles by using a chirp excitation technique”, Phys Med Biol, 52, 5531‐5544
(2007).
[184] V. Daeichin, T. Faez, G. Renaud, J. G. Bosch, A. F. W. v. d. Steen, and N. d. Jong. “Effect of self‐
demodulation on the subharmonic response of contrast agent microbubbles”, Phys Med Biol, 57,
3675 (2012).
[185] H. R. Zheng, O. Mukdadi, H. Kim, J. R. Hertzberg, and R. Shandas. “Advantages in using
multifrequency excitation of contrast microbubbles for enhancing echo particle image velocimetry
techniques: Initial numerical studies using rectangular and triangular waves”, Ultrasound Med Biol,
31, 99‐108 (2005).
[186] E. Biagi, L. Breschi, E. Varmacci, and L. Masotti. “Subharmonic emissions from microbubbles: Effect
of the driving pulse shape”, IEEE Trans Ultrason Ferroelectr Freq Control, 53, 2174‐2182 (2006).
[187] L. Masotti, E. Biagi, L. Breschi, and E. Vannacci. “Study and characterization of subharmonic
emissions by using shaped ultrasonic driving pulse”, Acoustical Imaging, Vol 28, 28, 307‐315 (2007).
[188] D. Zhang, X. Y. Xi, Z. Zhang, X. F. Gong, G. Chen, and J. R. Wu. “A dual‐frequency excitation technique
for enhancing the sub‐harmonic emission from encapsulated microbubbles”, Phys Med Biol, 54,
4257‐4272 (2009).
[189] J. E. Streeter, R. Gessner, I. Miles, and P. A. Dayton. “Improving Sensitivity in Ultrasound Molecular
Imaging by Tailoring Contrast Agent Size Distribution: In Vivo Studies”, Mol Imaging, 9, 87‐95 (2010).
[190] S. Zhao, D. E. Kruse, K. W. Ferrara, and P. A. Dayton. “Selective imaging of adherent targeted
ultrasound contrast agents”, Phys Med Biol, 52, 2055‐2072 (2007).
[191] X. W. Hu, H. R. Zheng, D. E. Kruse, P. Sutcliffe, D. N. Stephens, and K. W. Ferrara. “A Sensitive TLRH
Targeted Imaging Technique for Ultrasonic Molecular Imaging”, IEEE Trans Ultrason Ferroelectr Freq
Control, 57, 305‐316 (2010).
[192] A. Needles, O. Couture, and F. S. Foster. “A Method for Differentiating Targeted Microbubbles in
Real Time Using Subharmonic Micro‐Ultrasound and Interframe Filtering”, Ultrasound Med Biol, 35,
1564‐1573 (2009).
[193] F. W. Mauldin, A. H. Dhanaliwala, A. V. Patil, and J. A. Hossack. “Real‐time targeted molecular
imaging using singular value spectra properties to isolate the adherent microbubble signal”, Phys
Med Biol, 57,(2012).
[194] M. A. Pysz, S. S. Gambhir, and J. K. Willmann. “Molecular imaging: current status and emerging
strategies”, Clin Radiol, 65, 500‐516 (2010).
283

Bibliography
[195] A. G. Sorace, R. Saini, M. Mahoney, and K. Hoyt. “Molecular Ultrasound Imaging Using a Targeted
Contrast Agent for Assessing Early Tumor Response to Antiangiogenic Therapy”, J Ultrasound Med,
31, 1543‐1550 (2012).
[196] J. E. Streeter, R. C. Gessner, J. Tsuruta, S. Feingold, and P. A. Dayton. “Assessment of Molecular
Imaging of Angiogenesis with Three‐Dimensional Ultrasonography”, Mol Imaging, 10, 460‐468
(2011).
[197] S. M. Stieger, P. A. Dayton, M. A. Borden, C. F. Caskey, S. M. Griffey, E. R. Wisner, and K. W. Ferrara.
“Imaging of angiogenesis using Cadence contrast pulse sequencing and targeted contrast agents”,
Contrast Media Mol Imaging, 3, 9‐18 (2008).
[198] M. Piedra, A. Allroggen, and J. R. Lindner. “Molecular imaging with targeted contrast ultrasound”,
Cerebrovasc Dis, 27 Suppl 2, 66‐74 (2009).
[199] P. A. Dayton and J. J. Rychak. “Molecular ultrasound imaging using microbubble contrast agents”,
Frontiers in Bioscience, 12, 5124‐5142 (2007).
[200] C. R. Anderson, X. W. Hu, H. Zhang, J. Tlaxca, A. E. Decleves, R. Houghtaling, K. Sharma, M. Lawrence,
K. W. Ferrara, and J. J. Rychak. “Ultrasound Molecular Imaging of Tumor Angiogenesis With an
Integrin Targeted Microbubble Contrast Agent”, Invest Radiol, 46, 215‐224 (2011).
[201] M. Itani and R. F. Mattrey. “The Effect of Inhaled Gases on Ultrasound Contrast Agent Longevity In
Vivo”, Molecular Imaging and Biology, 14, 40‐46 (2012).
[202] J. H. Wible, Jr., J. K. Wojdyla, G. L. Bales, W. N. McMullen, E. A. Geiser, and D. D. Buss. “Inhaled gases
affect the ultrasound contrast produced by Albunex in anesthetized dogs”, J Am Soc Echocardiogr,
9, 442‐451 (1996).
[203] N. McDannold, Y. Z. Zhang, and N. Vykhodtseva. “Blood‐Brain Barrier Disruption and Vascular
Damage Induced by Ultrasound Bursts Combined with Microbubbles Can Be Influenced by Choice
of Anesthesia Protocol”, Ultrasound Med Biol, 37, 1259‐1270 (2011).
[204] L. Mullin, R. Gessner, J. Kwan, M. Kaya, M. A. Borden, and P. A. Dayton. “Effect of anesthesia carrier
gas on in vivo circulation times of ultrasound microbubble contrast agents in rats”, Contrast Media
Mol Imaging, 6, 126‐131 (2011).
[205] M. A. Pysz, I. Guracar, L. Tian, and J. K. Willmann. “Fast microbubble dwell‐time based ultrasonic
molecular imaging approach for quantification and monitoring of angiogenesis in cancer”, Quant
Imaging Med Surg, 2, 68‐80 (2012).
[206] V. Daeichin, Z. Akkus, A. Hoogi, J. G. Bosch, A. Needles, K. Kooiman, I. Skachkov, J. Sluimer, B.
Janssen, M. J. A. P. Daemen, A. F. W. van der Steen, and N. de Jong. “Quantification of targeted
microbubbles in contrast enhanced ultrasound”, in IEEE Ultrasonics Symposium Proceedings, 1825‐
1828 (2013).
[207] H. Liu, X. Wang, K. B. Tan, P. Liu, Z. X. Zhuo, Z. Liu, X. Hua, Q. Q. Zhuo, H. M. Xia, and Y. H. Gao.
“Molecular Imaging of Vulnerable Plaques in Rabbits Using Contrast‐Enhanced Ultrasound
Targeting to Vascular Endothelial Growth Factor Receptor‐2”, J Clin Ultrasound, 39, 83‐90 (2011).
[208] A. Hamilton, S. L. Huang, D. Warnick, A. Stein, M. Rabbat, T. Madhav, B. Kane, A. Nagaraj, M.
Klegerman, R. MacDonald, and D. McPherson. “Left ventricular thrombus enhancement after
intravenous injection of echogenic immunoliposomes ‐ Studies in a new experimental model”,
Circulation, 105, 2772‐2778 (2002).
[209] N. Deshpande, A. Needles, and J. K. Willmann. “Molecular ultrasound imaging: current status and
future directions”, Clin Radiol, 65, 567‐581 (2010).
[210] G. Korpanty, J. G. Carbon, P. A. Grayburn, J. B. Fleming, and R. A. Brekken. “Monitoring response to
anticancer therapy by targeting microbubbles to tumor vasculature”, Clinical Cancer Research, 13,
323‐330 (2007).
284
Bibliography
[211] N. Deshpande, Y. Ren, K. Foygel, J. Rosenberg, and J. K. Willmann. “Tumor Angiogenic Marker
Expression Levels during Tumor Growth: Longitudinal Assessment with Molecularly Targeted
Microbubbles and US Imaging”, Radiology, 258, 804‐811 (2011).
[212] D. B. Ellegala, H. L. Poi, J. E. Carpenter, A. L. Klibanov, S. Kaul, M. E. Shaffrey, J. Sklenar, and J. R.
Lindner. “Imaging tumor angiogenesis with contrast ultrasound and microbubbles targeted to
alpha(v)beta(3)”, Circulation, 108, 336‐341 (2003).
[213] A. Barua, A. Yellapa, J. M. Bahr, S. A. Machado, P. Bitterman, S. Basu, S. Sharma, and J. S.
Abramowicz. “Enhancement of ovarian tumor detection with alphavbeta3 integrin‐targeted
ultrasound molecular imaging agent in laying hens: a preclinical model of spontaneous ovarian
cancer”, Int J Gynecol Cancer, 24, 19‐28 (2014).
[214] M. A. Kuliszewski, H. Fujii, C. Liao, A. H. Smith, A. Xie, J. R. Lindner, and H. Leong‐Poi. “Molecular
imaging of endothelial progenitor cell engraftment using contrast‐enhanced ultrasound and
targeted microbubbles”, Cardiovascular Research, 83, 653‐662 (2009).
[215] S. V. Bachawal, K. C. Jensen, A. M. Lutz, S. S. Gambhir, F. Tranquart, L. Tian, and J. K. Willmann.
“Earlier Detection of Breast Cancer with Ultrasound Molecular Imaging in a Transgenic Mouse
Model”, Cancer Research, 73, 1689‐1698 (2013).
[216] C. Grouls, M. Hatting, A. Rix, S. Pochon, W. Lederle, I. Tardy, C. K. Kuhl, C. Trautwein, F. Kiessling, and
M. Palmowski. “Liver Dysplasia: US Molecular Imaging with Targeted Contrast Agent Enables Early
Assessment”, Radiology, 267, 487‐495 (2013).
[217] E. Khanicheh, M. Mitterhuber, L. F. Xu, S. P. Haeuselmann, G. M. Kuster, and B. A. Kaufmann.
“Noninvasive Ultrasound Molecular Imaging of the Effect of Statins on Endothelial Inflammatory
Phenotype in Early Atherosclerosis”, Plos One, 8,(2013).
[218] E. Khanicheh, Y. Qi, A. Xie, M. Mitterhuber, L. F. Xu, M. Mochizuki, Y. Daali, V. Jaquet, K. H. Krause,
Z. M. Ruggeri, G. M. Kuster, J. R. Lindner, and B. A. Kaufmann. “Molecular Imaging Reveals Rapid
Reduction of Endothelial Activation in Early Atherosclerosis With Apocynin Independent of
Antioxidative Properties”, Arteriosclerosis Thrombosis and Vascular Biology, 33, 2187‐2192 (2013).
[219] M. A. Pysz, K. Foygel, J. Rosenberg, S. S. Gambhir, M. Schneider, and J. K. Willmann. “Antiangiogenic
Cancer Therapy: Monitoring with Molecular US and a Clinically Translatable Contrast Agent (BR55)”,
Radiology, 256, 519‐527 (2010).
[220] M. B. Toaldo, V. Salvatore, S. Marinelli, C. Palama, M. Milazzo, L. Croci, L. Venerandi, M. Cipone, L.
Bolondi, and F. Piscaglia. “Use of VEGFR‐2 Targeted Ultrasound Contrast Agent for the Early
Evaluation of Response to Sorafenib in a Mouse Model of Hepatocellular Carcinoma”, Molecular
Imaging and Biology, 17, 29‐37 (2015).
[221] M. Palmowski, J. Huppert, G. Ladewig, P. Hauff, M. Reinhardt, M. M. Mueller, E. C. Woenne, J. W.
Jenne, M. Maurer, G. W. Kauffmann, W. Semmier, and F. Kiesslin. “Molecular profiling of
angiogenesis with targeted ultrasound imaging: early assessment of antiangiogenic therapy
effects”, Molecular Cancer Therapeutics, 7, 101‐109 (2008).
[222] S. R. Sirsi, M. L. Flexman, F. Vlachos, J. Z. Huang, S. L. Hernandez, H. K. Kim, T. B. Johung, J. W.
Gander, A. R. Reichstein, B. S. Lampl, A. T. Wang, A. H. Hielscher, J. J. Kandel, D. J. Yamashiro, and
M. A. Borden. “Contrast Ultrasound Imaging for Identification of Early Responder Tumor Models to
Anti‐Angiogenic Therapy”, Ultrasound Med Biol, 38, 1019‐1029 (2012).
[223] J. E. Streeter, S. G. Herrera‐Loeza, N. F. Neel, J. J. Yeh, and P. A. Dayton. “A Comparative Evaluation
of Ultrasound Molecular Imaging, Perfusion Imaging, and Volume Measurements in Evaluating
Response to Therapy in Patient‐Derived Xenografts”, Technology in Cancer Research & Treatment, 12,
311‐321 (2013).
[224] T. Flisikowska, A. Kind, and A. Schnieke. “The new pig on the block: modelling cancer in pigs”,
Transgenic Research, 22, 673‐680 (2013).
285
Bibliography
[225] H. Kim, G. L. Britton, T. Peng, C. K. Holland, D. D. McPherson, and S. L. Huang. “Nitric oxide‐loaded
echogenic liposomes for treatment of vasospasm following subarachnoid hemorrhage”, Int J
Nanomedicine, 9, 155‐165 (2014).
[226] S. M. Chadderdon, J. T. Belcik, L. Bader, M. A. Kirigiti, D. M. Peters, P. Kievit, K. L. Grove, and J. R.
Lindner. “Proinflammatory Endothelial Activation Detected by Molecular Imaging in Obese
Nonhuman Primates Coincides With Onset of Insulin Resistance and Progressively Increases With
Duration of Insulin Resistance”, Circulation, 129, 471‐478 (2014).
[227] B. P. Davidson, S. M. Chadderdon, J. T. Belcik, S. Gupta, and J. R. Lindner. “Ischemic Memory Imaging
in Nonhuman Primates with Echocardiographic Molecular Imaging of Selectin Expression”, J Am Soc
Echocardiogr, 27, 786‐U151 (2014).
[228] J. E. Streeter and P. A. Dayton. “An In Vivo Evaluation of the Effect of Repeated Administration and
Clearance of Targeted Contrast Agents on Molecular Imaging Signal Enhancement”, Theranostics, 3,
93‐98 (2013).
[229] J. Bzyl, M. Palmowski, A. Rix, S. Arns, J. M. Hyvelin, S. Pochon, J. Ehling, S. Schrading, F. Kiessling,
and W. Lederle. “The high angiogenic activity in very early breast cancer enables reliable imaging
with VEGFR2‐targeted microbubbles (BR55)”, Eur Radiol, 23, 468‐475 (2013).
[230] X. Hu, C. F. Caskey, L. M. Mahakian, D. E. Kruse, J. R. Beegle, A. E. Decleves, J. J. Rychak, P. L. Sutcliffe,
K. Sharma, and K. W. Ferrara. “In vivo validation and 3D visualization of broadband ultrasound
molecular imaging”, Am J Nucl Med Mol Imaging, 3, 336‐349 (2013).
[231] S. P. Bao, B. D. Thrall, and D. L. Miller. “Transfection of a reporter plasmid into cultured cells by
sonoporation in vitro”, Ultrasound Med Biol, 23, 953‐959 (1997).
[232] J. McLaughlan, N. Ingram, P. Smith, S. Harput, P. Coletta, S. Evans, and S. Freear. “Increasing the
sonoporation efficiency of targeted polydisperse microbubble populations using chirp excitation”,
IEEE Trans Ultrason Ferroelectr Freq Control, 60, 2511‐2520 (2013).
[233] I. Skachkov, Y. Luan, A. F. van der Steen, N. de Jong, and K. Kooiman. “Targeted microbubble
mediated sonoporation of endothelial cells in vivo”, IEEE Trans Ultrason Ferroelectr Freq Control, 61,
1661‐1667 (2014).
[234] L. C. Phillips, A. L. Klibanov, B. R. Wamhoff, and J. A. Hossack. “Intravascular ultrasound detection
and delivery of molecularly targeted microbubbles for gene delivery”, IEEE Trans Ultrason Ferroelectr
Freq Control, 59, 1596‐1601 (2012).
[235] S. Chang, J. Guo, J. Sun, S. Zhu, Y. Yan, Y. Zhu, M. Li, Z. Wang, and R. X. Xu. “Targeted microbubbles
for ultrasound mediated gene transfection and apoptosis induction in ovarian cancer cells”, Ultrason
Sonochem, 20, 171‐179 (2013).
[236] A. Xie, T. Belcik, Y. Qi, T. K. Morgan, S. A. Champaneri, S. Taylor, B. P. Davidson, Y. Zhao, A. L. Klibanov,
M. A. Kuliszewski, H. Leong‐Poi, A. Ammi, and J. R. Lindner. “Ultrasound‐Mediated Vascular Gene
Transfection by Cavitation of Endothelial‐Targeted Cationic Microbubbles”, Jacc‐Cardiovasc Imag, 5,
1253‐1262 (2012).
[237] J. L. Tlaxca, J. J. Rychak, P. B. Ernst, P. R. Konkalmatt, T. I. Shevchenko, T. T. Pizzaro, J. Rivera‐Nieves,
A. L. Klibanov, and M. B. Lawrence. “Ultrasound‐based molecular imaging and specific gene delivery
to mesenteric vasculature by endothelial adhesion molecule targeted microbubbles in a mouse
model of Crohn's disease”, J Control Release, 165, 216‐225 (2013).
[238] H. Liu, S. Chang, J. Sun, S. Zhu, C. Pu, Y. Zhu, Z. Wang, and R. X. Xu. “Ultrasound‐mediated destruction
of LHRHa‐targeted and paclitaxel‐loaded lipid microbubbles induces proliferation inhibition and
apoptosis in ovarian cancer cells”, Mol Pharm, 11, 40‐48 (2014).
[239] F. Yan, X. Li, Q. Jin, C. Jiang, Z. Zhang, T. Ling, B. Qiu, and H. Zheng. “Therapeutic ultrasonic
microbubbles carrying paclitaxel and LyP‐1 peptide: preparation, characterization and application to
ultrasound‐assisted chemotherapy in breast cancer cells”, Ultrasound Med Biol, 37, 768‐779 (2011).
286
Bibliography
[240] C. Pu, S. Chang, J. Sun, S. Zhu, H. Liu, Y. Zhu, Z. Wang, and R. X. Xu. “Ultrasound‐mediated destruction
of LHRHa‐targeted and paclitaxel‐loaded lipid microbubbles for the treatment of intraperitoneal
ovarian cancer xenografts”, Mol Pharm, 11, 49‐58 (2014).
[241] C. H. Fan, C. Y. Ting, H. L. Liu, C. Y. Huang, H. Y. Hsieh, T. C. Yen, K. C. Wei, and C. K. Yeh.
“Antiangiogenic‐targeting drug‐loaded microbubbles combined with focused ultrasound for glioma
treatment”, Biomaterials, 34, 2142‐2155 (2013).
[242] Z. Fan, R. E. Kumon, J. Park, and C. X. Deng. “Intracellular delivery and calcium transients generated
in sonoporation facilitated by microbubbles”, J Control Release, 142, 31‐39 (2010).
[243] S. Kotopoulis and M. Postema. “Microfoam formation in a capillary”, Ultrasonics, 50, 260‐268 (2010).
[244] X. W. Hu, A. Kheirolomoom, L. M. Mahakian, J. R. Beegle, D. E. Kruse, K. S. Lam, and K. W. Ferrara.
“Insonation of Targeted Microbubbles Produces Regions of Reduced Blood Flow Within Tumor
Vasculature”, Invest Radiol, 47, 398‐405 (2012).
[245] A. K. W. Wood, S. M. Schultz, W. M. F. Lee, R. M. Bunte, and C. M. Sehgal. “Antivascular Ultrasound
Therapy Extends Survival of Mice with Implanted Melanomas”, Ultrasound Med Biol, 36, 853‐857
(2010).
[246] M. Rask‐Andersen, J. Zhang, D. Fabbro, and H. B. Schioth. “Advances in kinase targeting: current
clinical use and clinical trials”, Trends in Pharmacological Sciences, 35, 60‐76 (2014).
[247] J. H. Hwang and L. A. Crum. “Current Status of Clinical High‐Intensity Focused Ultrasound”, 2009
Annual International Conference of the IEEE Engineering in Medicine and Biology Society, Vols 1‐20, 130‐
133 (2009).
[248] X. P. Li and L. Z. Zheng. “Advances of high intensity focused ultrasound (HIFU) for pancreatic
cancer”, Int J Hyperthermia, 29, 678‐682 (2013).
[249] Y. Zhou, Z. G. Wang, Y. Chen, H. X. Shen, Z. C. Luo, A. Li, Q. Wang, H. T. Ran, P. Li, W. X. Song, Z. Yang,
H. R. Chen, Z. B. Wang, G. M. Lu, and Y. Y. Zheng. “Microbubbles from Gas‐Generating
Perfluorohexane Nanoemulsions for Targeted Temperature‐Sensitive Ultrasonography and
Synergistic HIFU Ablation of Tumors”, Adv Mater, 25, 4123‐4130 (2013).
[250] F. M. Reid, N. A. Niemuth, S. M. Shumaker, J. D. Waugh, and J. S. Graham. “Biomechanical monitoring
of cutaneous sulfur mustard‐induced lesions in the weanling pig model for depth of injury”, Skin Res
Technol, 13, 217‐225 (2007).
[251] X. Yan, M. Li, Z. Chen, Y. Zhu, Y. Song, and H. Zhang. “Schlemm's Canal and Trabecular Meshwork in
Eyes with Primary Open Angle Glaucoma: A Comparative Study Using High‐Frequency Ultrasound
Biomicroscopy”, Plos One, 11, e0145824 (2016).
[252] D. L. Jovanovic and Z. U. Pesic. “Preoperative skin tumours thickness determination by high‐
frequency ultrasound on head and neck region”, J Eur Acad Dermatol Venereol, 27, 251‐253 (2013).
[253] S. Ghai, G. Eure, V. Fradet, M. E. Hyndman, T. McGrath, B. Wodlinger, and C. P. Pavlovich. “Assessing
Cancer Risk on Novel 29 MHz Micro‐Ultrasound Images of the Prostate: Creation of the Micro‐
Ultrasound Protocol for Prostate Risk Identification”, J Urol, 196, 562‐569 (2016).
[254] C. L. de Korte, H. H. Hansen, and A. F. van der Steen. “Vascular ultrasound for atherosclerosis
imaging”, Interface Focus, 1, 565‐575 (2011).
[255] V. Cantisani, M. Bertolotto, H. P. Weskott, L. Romanini, H. Grazhdani, M. Passamonti, F. M. Drudi, F.
Malpassini, A. Isidori, F. M. Meloni, F. Calliada, and F. D'Ambrosio. “Growing indications for CEUS:
The kidney, testis, lymph nodes, thyroid, prostate, and small bowel”, Eur J Radiol, 84, 1675‐1684
(2015).
[256] D. E. Goertz, E. Cherin, A. Needles, R. Karshafian, A. S. Brown, P. N. Burns, and F. S. Foster. “High
frequency nonlinear B‐scan imaging of microbubble contrast agents”, IEEE Trans Ultrason Ferroelectr
Freq Control, 52, 65‐79 (2005).
287

Bibliography
[257] V. Daeichin, J. G. Bosch, A. Needles, F. S. Foster, A. van der Steen, and N. de Jong. “Subharmonic,
Non‐linear Fundamental and Ultraharmonic Imaging of Microbubble Contrast at High Frequencies”,
Ultrasound Med Biol, 41, 486‐497 (2015).
[258] A. Katiyar and K. Sarkar. “Excitation threshold for subharmonic generation from contrast
microbubbles”, J Acoust Soc Am, 130, 3137‐3147 (2011).
[259] B. L. Helfield, E. Cherin, F. S. Foster, and D. E. Goertz. “Investigating the subharmonic response of
individual phospholipid encapsulated microbubbles at high frequencies: a comparative study of five
agents”, Ultrasound Med Biol, 38, 846‐863 (2012).
[260] T. van Rooij, Y. Luan, G. Renaud, A. F. van der Steen, M. Versluis, N. de Jong, and K. Kooiman. “Non‐
linear response and viscoelastic properties of lipid‐coated microbubbles: DSPC versus DPPC”,
Ultrasound Med Biol, 41, 1432‐1445 (2015).
[261] V. Inc.. “Vevo MicroMarker™ Non‐Targeted Contrast Agent Kit”, VisualSonics Inc., Toronto, ON,
Canada2016.
[262] T. van Rooij, V. Daeichin, I. Skachkov, N. de Jong, and K. Kooiman. “Targeted ultrasound contrast
agents for ultrasound molecular imaging and therapy”, Int J Hyperthermia, 31, 90‐106 (2015).
[263] V. Daeichin, K. Kooiman, I. Skachkov, J. G. Bosch, A. F. van der Steen, and N. de Jong. “Optimization
of ultrasound contrast agent for high frequency ultrasound molecular imaging using subharmonic
oscillation”, in IEEE Ultrasonics Symposium Proceedings, Chicago, Illinois, USA (2014).
[264] E. Stride and M. Edirisinghe. “Novel microbubble preparation technologies”, Soft Matter, 4, 2350‐
2359 (2008).
[265] B. Geers, I. Lentacker, N. N. Sanders, J. Demeester, S. Meairs, and S. C. De Smedt. “Self‐assembled
liposome‐loaded microbubbles: The missing link for safe and efficient ultrasound triggered drug‐
delivery”, J Control Release, 152, 249‐256 (2011).
[266] S. Sirsi, J. Feshitan, J. Kwan, S. Homma, and M. Borden. “Effect of microbubble size on fundamental
mode high frequency ultrasound imaging in mice”, Ultrasound Med Biol, 36, 935‐948 (2010).
[267] C. M. Moran, J. A. Ross, C. Cunningham, M. Butler, T. Anderson, D. Newby, K. A. A. Fox, and W. N.
McDicken. “Manufacture and acoustical characterisation of a high‐frequency contrast agent for
targeting applications”, Ultrasound Med Biol, 32, 421‐428 (2006).
[268] S. Wang, G. Samiotaki, O. Olumolade, J. A. Feshitan, and E. E. Konofagou. “Microbubble type and
distribution dependence of focused ultrasound‐induced blood‐brain barrier opening”, Ultrasound
Med Biol, 40, 130‐137 (2014).
[269] M. Kaya, T. S. Gregory, and P. A. Dayton. “Changes in Lipid‐Encapsulated Microbubble Population
during Continuous Infusion and Methods to Maintain Consistency”, Ultrasound Med Biol, 35, 1748‐
1755 (2009).
[270] C. C. Shen and P. C. Li. “Pulse‐inversion‐based fundamental imaging for contrast detection”, IEEE
Trans Ultrason Ferroelectr Freq Control, 50, 1124‐1133 (2003).
[271] V. Daeichin, Z. Akkus, I. Skachkov, K. Kooiman, A. Needles, J. Sluimer, B. Janssen, M. J. Daemen, A.
F. van der Steen, N. de Jong, and J. G. Bosch. “Quantification of bound microbubbles in ultrasound
molecular imaging”, IEEE Trans Ultrason Ferroelectr Freq Control, 62, 1190‐1200 (2015).
[272] A. Hoogi, Z. Akkus, S. C. van den Oord, G. L. ten Kate, A. F. Schinkel, J. G. Bosch, N. de Jong, D. Adam,
and A. F. van der Steen. “Quantitative analysis of ultrasound contrast flow behavior in carotid plaque
neovasculature”, Ultrasound Med Biol, 38, 2072‐2083 (2012).
[273] J. A. Feshitan, C. C. Chen, J. J. Kwan, and M. A. Borden. “Microbubble size isolation by differential
centrifugation”, J Colloid Interface Sci, 329, 316‐324 (2009).
[274] M. Minnaert. “XVI. On musical air‐bubbles and the sounds of running water”, Philos Mag, 16, 235‐248
(1933).
288
Bibliography
[275] B. L. Helfield, B. Y. Leung, X. Huo, and D. E. Goertz. “Scaling of the viscoelastic shell properties of
phospholipid encapsulated microbubbles with ultrasound frequency”, Ultrasonics, 54, 1419‐1424
(2014).
[276] D. E. Goertz, N. de Jong, and A. F. van der Steen. “Attenuation and size distribution measurements
of Definity and manipulated Definity populations”, Ultrasound Med Biol, 33, 1376‐1388 (2007).
[277] S. A. Peyman, J. R. McLaughlan, R. H. Abou‐Saleh, G. Marston, B. R. Johnson, S. Freear, P. L. Coletta,
A. F. Markham, and S. D. Evans. “On‐chip preparation of nanoscale contrast agents towards high‐
resolution ultrasound imaging”, Lab Chip, 16, 679‐687 (2016).
[278] P. Dynarowicz‐Łątka and K. Hac‐Wydro. “Interactions between phosphatidylcholines and
cholesterol in monolayers at the air/water interface”, Colloids and surfaces B, Biointerfaces, 37, 21‐25
(2004).
[279] Y. Kurniawan, C. Scholz, and G. D. Bothun. “n‐Butanol partitioning into phase‐separated
heterogeneous lipid monolayers”, Langmuir, 29, 10817‐10823 (2013).
[280] M. M. Lozano and L. Longo. “Complex formation and other phase transformations mapped in
saturated phosphatidylcholine/DSPE‐PEG2000 monolayers”, Soft Matter, 5, 1822–1834 (2009).
[281] V. M. Kaganer, H. Mohwald, and P. Dutta. “Structure and phase transitions in Langmuir
monolayers”, Reviews of Modern Physics, 71, 779‐819 (1999).
[282] A. F. Schinkel, C. G. Krueger, A. Tellez, J. F. Granada, J. D. Reed, A. Hall, W. Zang, C. Owens, G. L.
Kaluza, D. Staub, B. Coll, F. J. Ten Cate, and S. B. Feinstein. “Contrast‐enhanced ultrasound for
imaging vasa vasorum: comparison with histopathology in a swine model of atherosclerosis”, Eur J
Echocardiogr, 11, 659‐664 (2010).
[283] M. S. Dolan, S. S. Gala, S. Dodla, S. S. Abdelmoneim, F. Xie, D. Cloutier, M. Bierig, S. L. Mulvagh, T. R.
Porter, and A. J. Labovitz. “Safety and Efficacy of Commercially Available Ultrasound Contrast
Agents for Rest and Stress Echocardiography A Multicenter Experience”, J Am Coll Cardiol, 53, 32‐38
(2009).
[284] D. W. Kitzman, M. E. Goldman, L. D. Gillam, J. L. Cohen, G. P. Aurigemma, and J. S. Gottdiener.
“Efficacy and safety of the novel ultrasound contrast agent perflutren (definity) in patients with
suboptimal baseline left ventricular echocardiographic images∗”, Am J Cardiol, 86, 669‐674 (2000).
[285] M. A. Borden and M. L. Longo. “Dissolution behavior of lipid monolayer‐coated, air‐filled
microbubbles: Effect of lipid hydrophobic chain length”, Langmuir, 18, 9225‐9233 (2002).
[286] M. A. Parrales, J. M. Fernandez, M. Perez‐Saborid, J. A. Kopechek, and T. M. Porter. “Acoustic
characterization of monodisperse lipid‐coated microbubbles: relationship between size and shell
viscoelastic properties”, J Acoust Soc Am, 136, 1077 (2014).
[287] S. A. Stapleton, A. Needles, E. Henderson, and F. S. Foster. “Concentration Requirements for
Subharmonic Quantitative Contrast Enhanced High Frequency Ultrasound Flow Studies”, in IEEE
Ultrasonics Symposium Proceedings (2007).
[288] E. Stock, K. Vanderperren, H. Haers, L. Duchateau, M. Hesta, and J. H. Saunders. “Quantitative
Differences Between the First and Second Injection of Contrast Agent in Contrast‐Enhanced
Ultrasonography of Feline Kidneys and Spleen”, Ultrasound Med Biol.
[289] A. Rix, M. Palmowski, F. Gremse, K. Palmowski, W. Lederle, F. Kiessling, and J. Bzyl. “Influence of
repetitive contrast agent injections on functional and molecular ultrasound measurements”,
Ultrasound Med Biol, 40, 2468‐2475 (2014).
[290] A. Dizeux, T. Payen, G. Barrois, D. Le Guillou Buffello, and S. L. Bridal. “Reproducibility of Contrast‐
Enhanced Ultrasound in Mice with Controlled Injection”, Mol Imaging Biol, (2016).
[291] W. H. Organization. “WHO Good manufacturing practices for pharmaceutical products: main
principles”, World Health Organization2011.
289

Bibliography
[292] M.‐R. Toh and G. N. C. Chiu. “Liposomes as sterile preparations and limitations of sterilisation
techniques in liposomal manufacturing”, Asian J Pharm Sci, 8, 88‐95 (2013).
[293] P. K. Hui and W. R. Diluzio. “Stabilization and terminal sterilization of phospholipid formulations”,
US Patent, 2002.
[294] S. B. Feinstein, J. Cheirif, F. J. Tencate, P. R. Silverman, P. A. Heidenreich, C. Dick, R. M. Desir, W. F.
Armstrong, M. A. Quinones, and P. M. Shah. “Safety and Efficacy of a New Transpulmonary
Ultrasound Contrast Agent ‐ Initial Multicenter Clinical‐Results”, J Am Coll Cardiol, 16, 316‐324 (1990).
[295] A. L. Klibanov. “Ultrasound contrast agents: Development of the field and current status”, Contrast
Agents Ii, 222, 73‐106 (2002).
[296] J. T. Sutton, K. J. Haworth, G. Pyne‐Geithman, and C. K. Holland. “Ultrasound‐mediated drug delivery
for cardiovascular disease”, Expert Opin Drug Deliv, 10, 573‐592 (2013).
[297] J. R. Lindner. “Molecular imaging of myocardial and vascular disorders with ultrasound”, JACC
Cardiovasc Imaging, 3, 204‐211 (2010).
[298] F. Kiessling, J. Bzyl, S. Fokong, M. Siepmann, G. Schmitz, and M. Palmowski. “Targeted Ultrasound
Imaging of Cancer: An Emerging Technology on its Way to Clinics”, Curr Pharm Des, 18, 2184‐2199
(2012).
[299] ICUS. What is CEUS? (http://www.icus‐society.org/about‐ceus/ ed.) [http://www.icus‐
society.org/about‐ceus/]. Available: http://www.icus‐society.org/about‐ceus/
[300] J. J. Rychak, A. L. Klibanov, K. F. Ley, and J. A. Hossack. “Enhanced targeting of ultrasound contrast
agents using acoustic radiation force”, Ultrasound Med Biol, 33, 1132‐1139 (2007).
[301] L. M. Kornmann, K. D. Reesink, R. S. Reneman, and A. P. Hoeks. “Critical appraisal of targeted
ultrasound contrast agents for molecular imaging in large arteries”, Ultrasound Med Biol, 36, 181‐191
(2010).
[302] P. A. Dayton, D. Pearson, J. Clark, S. Simon, P. A. Schumann, R. Zutshi, T. O. Matsunaga, and K. W.
Ferrara. “Ultrasonic analysis of peptide‐ and antibody‐targeted microbubble contrast agents for
molecular imaging of alphavbeta3‐expressing cells”, Mol Imaging, 3, 125‐134 (2004).
[303] S. Hell and E. H. K. Stelzer. “Fundamental Improvement of Resolution with a 4pi‐Confocal
Fluorescence Microscope Using 2‐Photon Excitation”, Optics Communications, 93, 277‐282 (1992).
[304] S. W. Hell, M. Schrader, and H. T. M. VanderVoort. “Far‐field fluorescence microscopy with three‐
dimensional resolution in the 100‐nm range”, J Microsc, 187, 1‐7 (1997).
[305] W. A. van Cappellen, A. Nigg, and A. B. Houtsmuller. “Enhancement of optical resolution by 4Pi single
and multiphoton confocal fluorescence microscopy”, in Cellular Imaging Techniques for Neuroscience
and beyond, F. G. Wouterlood, Ed., ed Oxford: Academic Press, 2012, pp. 55‐80.
[306] G. Taubin. “Estimation of planar curves, surfaces, and nonpolar space curves defined by implicit
equations with applications to edge and range image segmentation”, IEEE Trans. Pattern Anal. Mach.
Intell., 12, 1115‐1138 (1991).
[307] J. Schindelin, I. Arganda‐Carreras, E. Frise, V. Kaynig, M. Longair, T. Pietzsch, S. Preibisch, C. Rueden,
S. Saalfeld, B. Schmid, J. Y. Tinevez, D. J. White, V. Hartenstein, K. Eliceiri, P. Tomancak, and A.
Cardona. “Fiji: an open‐source platform for biological‐image analysis”, Nat Methods, 9, 676‐682
(2012).
[308] N. Emans, J. Biwersi, and A. S. Verkman. “Imaging of endosome fusion in BHK fibroblasts based on
a novel fluorimetric avidin‐biotin binding assay”, Biophys J, 69, 716‐728 (1995).
[309] N. Marme, J. P. Knemeyer, M. Sauer, and J. Wolfrum. “Inter‐ and intramolecular fluorescence
quenching of organic dyes by tryptophan”, Bioconjug Chem, 14, 1133‐1139 (2003).
[310] J. J. Kwan and M. A. Borden. “Lipid monolayer collapse and microbubble stability”, Adv Colloid
Interface Sci, 183‐184, 82‐99 (2012).
290
Bibliography
[311] I. Lentacker, B. Geers, J. Demeester, S. C. De Smedt, and N. N. Sanders. “Design and evaluation of
doxorubicin‐containing microbubbles for ultrasound‐triggered doxorubicin delivery: cytotoxicity
and mechanisms involved”, Mol Ther, 18, 101‐108 (2010).
[312] M. Emmer, H. J. Vos, M. Versluis, and N. de Jong. “Radial modulation of single microbubbles”, IEEE
Trans Ultrason Ferroelectr Freq Control, 56, 2370‐2379 (2009).
[313] S. B. Feinstein, B. Coll, D. Staub, D. Adam, A. F. Schinkel, F. J. ten Cate, and K. Thomenius. “Contrast
enhanced ultrasound imaging”, J Nucl Cardiol, 17, 106‐115 (2010).
[314] ICUS. “CEUS Around the World”, International Contrast Ultrasound Society, Chicago, USA23/07/2016
2016.
[315] N. A. Hosny, G. Mohamedi, P. Rademeyer, J. Owen, Y. Wu, M. X. Tang, R. J. Eckersley, E. Stride, and
M. K. Kuimova. “Mapping microbubble viscosity using fluorescence lifetime imaging of molecular
rotors”, Proc Natl Acad Sci U S A, 110, 9225‐9230 (2013).
[316] C. H. Wang and C. K. Yeh. “Controlling the size distribution of lipid‐coated bubbles via fluidity
regulation”, Ultrasound Med Biol, 39, 882‐892 (2013).
[317] Y. J. Gong, M. Cabodi, and T. M. Porter. “Acoustic investigation of pressure‐dependent resonance
and shell elasticity of lipid‐coated monodisperse microbubbles”, Applied Physics Letters, 104,(2014).
[318] M. Schneider, A. Broillet, P. Bussat, N. Giessinger, J. Puginier, R. Ventrone, and F. Yan. “Gray‐scale
liver enhancement in VX2 tumor‐bearing rabbits using BR14, a new ultrasonographic contrast
agent”, Invest Radiol, 32, 410‐417 (1997).
[319] W. Krause. “Contrast Agents II: Optical, Ultrasound, X‐Ray and Radiopharmaceutical Imaging”,
Topics in Current Chemistry, 222,(2002).
[320] E. C. Gelderblom, H. J. Vos, F. Mastik, T. Faez, Y. Luan, T. J. Kokhuis, A. F. van der Steen, D. Lohse, N.
de Jong, and M. Versluis. “Brandaris 128 ultra‐high‐speed imaging facility: 10 years of operation,
updates, and enhanced features”, Rev Sci Instrum, 83, 103706 (2012).
[321] N. de Jong, M. Emmer, C. T. Chin, A. Bouakaz, F. Mastik, D. Lohse, and M. Versluis. “"Compression‐
only" behavior of phospholipid‐coated contrast bubbles”, Ultrasound Med Biol, 33, 653‐656 (2007).
[322] H. Medwin. “Counting bubbles acoustically: A review”, Ultrasonics, 15, 7‐13 (1977).
[323] J. Sijl, B. Dollet, M. Overvelde, V. Garbin, T. Rozendal, N. de Jong, D. Lohse, and M. Versluis.
“Subharmonic behavior of phospholipid‐coated ultrasound contrast agent microbubbles”, J Acoust
Soc Am, 128, 3239‐3252 (2010).
[324] T. D. Mast. “Empirical relationships between acoustic parameters in human soft tissues”, Acoustics
Research Letters Online, 1, 37‐42 (2000).
[325] P. L. van Neer, G. Matte, M. G. Danilouchkine, C. Prins, F. van den Adel, and N. de Jong. “Super‐
harmonic imaging: development of an interleaved phased‐array transducer”, IEEE Trans Ultrason
Ferroelectr Freq Control, 57, 455‐468 (2010).
[326] J. L. Raymond, K. J. Haworth, K. B. Bader, K. Radhakrishnan, J. K. Griffin, S. L. Huang, D. D.
McPherson, and C. K. Holland. “Broadband attenuation measurements of phospholipid‐shelled
ultrasound contrast agents”, Ultrasound Med Biol, 40, 410‐421 (2014).
[327] S. Krishnan, J. D. Hamilton, and M. O'Donnell. “Suppression of propagating second harmonic in
ultrasound contrast imaging”, IEEE Trans Ultrason Ferroelectr Freq Control, 45, 704‐711 (1998).
[328] H. C. Starritt, F. A. Duck, A. J. Hawkins, and V. F. Humphrey. “The development of harmonic
distortion in pulsed finite‐amplitude ultrasound passing through liver”, Phys Med Biol, 31, 1401‐1409
(1986).
[329] J. Sijl, M. Overvelde, B. Dollet, V. Garbin, N. de Jong, D. Lohse, and M. Versluis. “"Compression‐only"
behavior: a second‐order nonlinear response of ultrasound contrast agent microbubbles”, J Acoust
Soc Am, 129, 1729‐1739 (2011).
291
Bibliography
[330] M. Overvelde, V. Garbin, J. Sijl, B. Dollet, N. de Jong, D. Lohse, and M. Versluis. “Nonlinear shell
behavior of phospholipid‐coated microbubbles”, Ultrasound Med Biol, 36, 2080‐2092 (2010).
[331] J. Tu, J. Guan, Y. Qiu, and T. J. Matula. “Estimating the shell parameters of SonoVue microbubbles
using light scattering”, J Acoust Soc Am, 126, 2954‐2962 (2009).
[332] H. J. Vos, B. Dollet, M. Versluis, and N. de Jong. “Nonspherical shape oscillations of coated
microbubbles in contact with a wall”, Ultrasound Med Biol, 37, 935‐948 (2011).
[333] B. Dollet, S. M. van der Meer, V. Garbin, N. de Jong, D. Lohse, and M. Versluis. “Nonspherical
oscillations of ultrasound contrast agent microbubbles”, Ultrasound Med Biol, 34, 1465‐1473 (2008).
[334] B. L. Helfield, B. Y. Leung, and D. E. Goertz. “The effect of boundary proximity on the response of
individual ultrasound contrast agent microbubbles”, Phys Med Biol, 59, 1721‐1745 (2014).
[335] J. K. Willmann, Z. Cheng, C. Davis, A. M. Lutz, M. L. Schipper, C. H. Nielsen, and S. S. Gambhir.
“Targeted microbubbles for imaging tumor angiogenesis: assessment of whole‐body
biodistribution with dynamic micro‐PET in mice”, Radiology, 249, 212‐219 (2008).
[336] K. E. Landmark, P. W. Johansen, J. A. Johnson, B. Johansen, S. Uran, and T. Skotland.
“Pharmacokinetics of perfluorobutane following intravenous bolus injection and continuous
infusion of sonazoid in healthy volunteers and in patients with reduced pulmonary diffusing
capacity”, Ultrasound Med Biol, 34, 494‐501 (2008).
[337] A. A. Doinikov and A. Bouakaz. “Review of shell models for contrast agent microbubbles”, IEEE Trans
Ultrason Ferroelectr Freq Control, 58, 981‐993 (2011).
[338] E. Stride. “Physical principles of microbubbles for ultrasound imaging and therapy”, Cerebrovasc Dis,
27 Suppl 2, 1‐13 (2009).
[339] J. Castle, M. Butts, A. Healey, K. Kent, M. Marino, and S. B. Feinstein. “Ultrasound‐mediated targeted
drug delivery: recent success and remaining challenges”, Am J Physiol Heart Circ Physiol, 304, H350‐
357 (2013).
[340] M. Borden. “Nanostructural features on stable microbubbles”, Soft Matter, 5, 716‐720 (2009).
[341] J. Sijl, H. J. Vos, T. Rozendal, N. de Jong, D. Lohse, and M. Versluis. “Combined optical and acoustical
detection of single microbubble dynamics”, J Acoust Soc Am, 130, 3271‐3281 (2011).
[342] T. Faez, I. Skachkov, M. Versluis, K. Kooiman, and N. de Jong. “In Vivo characterization of ultrasound
contrast agents: microbubble spectroscopy in a chicken embryo”, Ultrasound Med Biol, 38, 1608‐1617
(2012).
[343] D. H. Thomas, M. Butler, T. Anderson, M. Emmer, H. Vos, M. Borden, E. Stride, N. de Jong, and V.
Sboros. “The "quasi‐stable" lipid shelled microbubble in response to consecutive ultrasound
pulses”, Applied Physics Letters, 101,(2012).
[344] S. L. Huang. “Ultrasound‐responsive liposomes”, Methods Mol Biol, 605, 113‐128 (2010).
[345] S. Paul, R. Nahire, S. Mallik, and K. Sarkar. “Encapsulated microbubbles and echogenic liposomes for
contrast ultrasound imaging and targeted drug delivery”, Comput Mech, 53, 413‐435 (2014).
[346] K. D. Buchanan, S. Huang, H. Kim, R. C. Macdonald, and D. D. McPherson. “Echogenic liposome
compositions for increased retention of ultrasound reflectivity at physiologic temperature”, J Pharm
Sci, 97, 2242‐2249 (2008).
[347] S. Paul, D. Russakow, R. Nahire, T. Nandy, A. H. Ambre, K. Katti, S. Mallik, and K. Sarkar. “In vitro
measurement of attenuation and nonlinear scattering from echogenic liposomes”, Ultrasonics, 52,
962‐969 (2012).
[348] J. A. Kopechek, K. J. Haworth, J. L. Raymond, T. Douglas Mast, S. R. Perrin, M. E. Klegerman, S.
Huang, T. M. Porter, D. D. McPherson, and C. K. Holland. “Acoustic characterization of echogenic
liposomes: frequency‐dependent attenuation and backscatter”, J Acoust Soc Am, 130, 3472‐3481
(2011).
292

Bibliography
[349] R. Nahire, S. Paul, M. D. Scott, R. K. Singh, W. W. Muhonen, J. Shabb, K. N. Gange, D. K. Srivastava,
K. Sarkar, and S. Mallik. “Ultrasound enhanced matrix metalloproteinase‐9 triggered release of
contents from echogenic liposomes”, Mol Pharm, 9, 2554‐2564 (2012).
[350] M. A. Ainslie and T. G. Leighton. “Review of scattering and extinction cross‐sections, damping
factors, and resonance frequencies of a spherical gas bubble”, J. Acoust. Soc. Am., 130, 3184‐3208
(2011).
[351] J. L. Leander. “On the eigenfrequency of a gas bubble in a liquid”, J Acoust Soc Am, 102, 1900‐1903
(1997).
[352] A. Agneni and L. Baliscrema. “Damping Measurements from Truncated Signals Via Hilbert
Transform”, Mechanical Systems and Signal Processing, 3, 1‐13 (1989).
[353] D. Chatterjee and K. Sarkar. “A Newtonian rheological model for the interface of microbubble
contrast agents”, Ultrasound Med Biol, 29, 1749‐1757 (2003).
[354] L. Hoff, P. C. Sontum, and J. M. Hovem. “Oscillations of polymeric microbubbles: Effect of the
encapsulating shell”, J Acoust Soc Am, 107, 2272‐2280 (2000).
[355] L. A. Crum. “The Polytropic Exponent of Gas Contained within Air Bubbles Pulsating in a Liquid”, J
Acoust Soc Am, 73, 116‐120 (1983).
[356] K. E. Morgan, J. S. Allen, P. A. Dayton, J. E. Chomas, A. L. Klibaov, and K. W. Ferrara. “Experimental
and theoretical evaluation of microbubble behavior: effect of transmitted phase and bubble size”,
IEEE Trans Ultrason Ferroelectr Freq Control, 47, 1494‐1509 (2000).
[357] J. Tu, J. E. Swalwell, D. Giraud, W. C. Cui, W. Z. Chen, and T. J. Matula. “Microbubble Sizing and Shell
Characterization Using Flow Cytometry”, IEEE Trans Ultrason Ferroelectr Freq Control, 58, 955‐963
(2011).
[358] K. Sarkar, W. T. Shi, D. Chatterjee, and F. Forsberg. “Characterization of ultrasound contrast
microbubbles using in vitro experiments and viscous and viscoelastic interface models for
encapsulation”, J Acoust Soc Am, 118, 539‐550 (2005).
[359] A. I. Malkin, Rheology fundamentals. Toronto‐Scarborough, ON, Canada: ChemTec Pub., 1994.
[360] C. C. Church. “The Effects of an Elastic Solid‐Surface Layer on the Radial Pulsations of Gas‐Bubbles”,
J Acoust Soc Am, 97, 1510‐1521 (1995).
[361] Q. Li, T. J. Matula, J. Tu, X. Guo, and D. Zhang. “Modeling complicated rheological behaviors in
encapsulating shells of lipid‐coated microbubbles accounting for nonlinear changes of both shell
viscosity and elasticity”, Phys Med Biol, 58, 985‐998 (2013).
[362] A. A. Doinikov, J. F. Haac, and P. A. Dayton. “Modeling of nonlinear viscous stress in encapsulating
shells of lipid‐coated contrast agent microbubbles”, Ultrasonics, 49, 269‐275 (2009).
[363] K. Ferrara, R. Pollard, and M. Borden. “Ultrasound microbubble contrast agents: Fundamentals and
application to gene and drug delivery”, Annual Review of Biomedical Engineering, 9, 415‐447 (2007).
[364] A. J. Mortimer, Physical Characteristics of Ultrasound. Clifton, NJ, USA: The Humana Press Inc., 1982.
[365] M. Azmin, Z. Harfield C Fau ‐ Ahmad, M. Ahmad Z Fau ‐ Edirisinghe, E. Edirisinghe M Fau ‐ Stride, and
E. Stride. “How do microbubbles and ultrasound interact? Basic physical, dynamic and engineering
principles."
[366] J. R. Eisenbrey, A. Sridharan, J. B. Liu, and F. Forsberg. “Recent Experiences and Advances in
Contrast‐Enhanced Subharmonic Ultrasound”, Biomed Research International, (2015).
[367] S. L. W. Denham, L. F. Alexander, and M. L. Robbin. “Contrast‐Enhanced Ultrasound: Practical
Review for the Assessment of Hepatic and Renal Lesions”, Ultrasound Quarterly, 32, 116‐125 (2016).
[368] G. Renaud, J. G. Bosch, A. F. Van Der Steen, and N. De Jong. “Low‐amplitude non‐linear volume
vibrations of single microbubbles measured with an "acoustical camera"“, Ultrasound Med Biol, 40,
1282‐1295 (2014).
293
Bibliography
[369] J. Sijl, E. Gaud, P. J. Frinking, M. Arditi, N. de Jong, D. Lohse, and M. Versluis. “Acoustic
characterization of single ultrasound contrast agent microbubbles”, J Acoust Soc Am, 124, 4091‐4097
(2008).
[370] X. Chen, J. Wang, J. J. Pacella, and F. S. Villanueva. “Dynamic Behavior of Microbubbles during Long
Ultrasound Tone‐Burst Excitation: Mechanistic Insights into Ultrasound‐Microbubble Mediated
Therapeutics Using High‐Speed Imaging and Cavitation Detection”, Ultrasound Med Biol, (2015).
[371] J. E. Chomas, P. Dayton, D. May, and K. Ferrara. “Threshold of fragmentation for ultrasonic contrast
agents”, J Biomed Opt, 6, 141‐150 (2001).
[372] T. van Rooij, I. Skachkov, I. Beekers, K. R. Lattwein, J. D. Voorneveld, T. J. Kokhuis, D. Bera, Y. Luan,
A. F. van der Steen, N. de Jong, and K. Kooiman. “Viability of endothelial cells after ultrasound‐
mediated sonoporation: Influence of targeting, oscillation, and displacement of microbubbles”, J
Control Release, 238, 197‐211 (2016).
[373] B. Helfield, X. C. Chen, S. C. Watkins, and F. S. Villanueva. “Biophysical insight into mechanisms of
sonoporation”, Proc Natl Acad Sci U S A, 113, 9983‐9988 (2016).
[374] M. M. Lipp, K. Y. C. Lee, D. Y. Takamoto, J. A. Zasadzinski, and A. J. Waring. “Coexistence of buckled
and flat monolayers”, Physical Review Letters, 81, 1650‐1653 (1998).
[375] S. Baoukina, L. Monticelli, H. J. Risselada, S. J. Marrink, and D. P. Tieleman. “The molecular
mechanism of lipid monolayer collapse”, Proc Natl Acad Sci U S A, 105, 10803‐10808 (2008).
[376] K. Y. Lee. “Collapse mechanisms of Langmuir monolayers”, Annu Rev Phys Chem, 59, 771‐791 (2008).
[377] G. Pu, M. A. Borden, and M. L. Longo. “Collapse and shedding transitions in binary lipid monolayers
coating microbubbles”, Langmuir, 22, 2993‐2999 (2006).
[378] Y. Luan, G. Lajoinie, E. Gelderblom, I. Skachkov, A. F. van der Steen, H. J. Vos, M. Versluis, and N. De
Jong. “Lipid shedding from single oscillating microbubbles”, Ultrasound Med Biol, 40, 1834‐1846
(2014).
[379] S. Paul, A. Katiyar, K. Sarkar, D. Chatterjee, W. T. Shi, and F. Forsberg. “Material characterization of
the encapsulation of an ultrasound contrast microbubble and its subharmonic response: Strain‐
softening interfacial elasticity model”, J Acoust Soc Am, 127, 3846‐3857 (2010).
[380] H. J. Vos, B. Dollet, J. G. Bosch, M. Versluis, and N. de Jong. “Nonspherical vibrations of microbubbles
in contact with a wall ‐ A pilot study at low mechanical index”, Ultrasound Med Biol, 34, 685‐688
(2008).
[381] A. Gopal and K. Y. C. Lee. “Morphology and collapse transitions in binary phospholipid monolayers”,
J Phys Chem B, 105, 10348‐10354 (2001).
[382] D. Y. Takamoto, M. M. Lipp, A. von Nahmen, K. Y. C. Lee, A. J. Waring, and J. A. Zasadzinski.
“Interaction of lung surfactant proteins with anionic phospholipids”, Biophys J, 81, 153‐169 (2001).
[383] J. Owen and E. Stride. “Technique for the Characterization of Phospholipid Microbubbles Coatings
by Transmission Electron Microscopy”, Ultrasound Med Biol, 41, 3253‐3258 (2015).
[384] R. Shih and A. P. Lee. “Post‐Formation Shrinkage and Stabilization of Microfluidic Bubbles in Lipid
Solution”, Langmuir, (2016).
[385] E. Talu, K. Hettiarachchi, R. L. Powell, A. P. Lee, P. A. Dayton, and M. L. Longo. “Maintaining
monodispersity in a microbubble population formed by flow‐focusing”, Langmuir, 24, 1745‐1749
(2008).
[386] A. L. Klibanov. “Microbubble contrast agents ‐ Targeted ultrasound imaging and ultrasound‐assisted
drug‐delivery applications”, Invest Radiol, 41, 354‐362 (2006).
[387] E. Gelderblom. “Ultra‐high‐speed fluorescence imaging”, PhD thesis, Physics of Fluids, University of
Twente, Enschede, 2012.
[388] J. P. O'Brien, N. Ovenden, and E. Stride. “Accounting for the stability of microbubbles to multi‐pulse
excitation using a lipid‐shedding model”, J Acoust Soc Am, 130, El180‐El185 (2011).
294

Bibliography
[389] P. J. A. Frinking, E. Gaud, J. Brochot, and M. Arditi. “Subharmonic Scattering of Phospholipid‐Shell
Microbubbles at Low Acoustic Pressure Amplitudes”, IEEE Trans Ultrason Ferroelectr Freq Control,
57, 1762‐1771 (2010).
[390] J. S. Yeh, C. A. Sennoga, E. McConnell, R. Eckersley, M. X. Tang, S. Nourshargh, J. M. Seddon, D. O.
Haskard, and P. Nihoyannopoulos. “Quantitative Ultrasound Molecular Imaging”, Ultrasound Med
Biol, (2015).
[391] K. Kooiman, T. J. Kokhuis, I. Skachkov, J. G. Bosch, A. F. W. van der Steen, W. A. van Cappellen, and
N. De Jong. “Surface contact of bound targeted microbubbles”, in IEEE Ultrasonics Symposium
Proceedings, Dresden, Germany (2012).
[392] S. Zhao, M. Borden, S. H. Bloch, D. Kruse, K. W. Ferrara, and P. A. Dayton. “Radiation‐force assisted
targeting facilitates ultrasonic molecular imaging”, Mol Imaging, 3, 135‐148 (2004).
[393] P. A. Dayton, K. E. Morgan, A. L. Klibanov, G. H. Brandenburger, and K. W. Ferrara. “Optical and
acoustical observations of the effects of ultrasound on contrast agents”, IEEE Trans Ultrason
Ferroelectr Freq Control, 46, 220‐232 (1999).
[394] T. van Rooij, A. F. W. van der Steen, N. de Jong, and K. Kooiman. “Influence of binding on the
vibrational responses of targeted lipid‐coated microbubbles”, in IEEE Ultrasonics Symposium
Proceedings, Chicago, USA (2014).
[395] P. M. Shankar, P. D. Krishna, and V. L. Newhouse. “Subharmonic backscattering from ultrasound
contrast agents”, J Acoust Soc Am, 106, 2104‐2110 (1999).
[396] K. Hettiarachchi, E. Talu, M. L. Longo, P. A. Dayton, and A. P. Lee. “On‐chip generation of
microbubbles as a practical technology for manufacturing contrast agents for ultrasonic imaging”,
Lab Chip, 7, 463‐468 (2007).
[397] M. Kaya, S. Feingold, K. Hettiarachchi, A. P. Lee, and P. A. Dayton. “Acoustic responses of
monodisperse lipid‐encapsulated microbubble contrast agents produced by flow focusing”, Bubble
Sci Eng Technol, 2, 33‐40 (2010).
[398] E. Talu, K. Hettiarachchi, S. Zhao, R. L. Powell, A. P. Lee, M. L. Longo, and P. A. Dayton. “Tailoring the
size distribution of ultrasound contrast agents: possible method for improving sensitivity in
molecular imaging”, Mol Imaging, 6, 384‐392 (2007).
[399] T. Segers and M. Versluis. “Acoustic bubble sorting for ultrasound contrast agent enrichment”, Lab
Chip, 14, 1705‐1714 (2014).
[400] E. C. Pua and P. Zhong. “Ultrasound‐mediated drug delivery”, IEEE Eng Med Biol Mag, 28, 64‐75
(2009).
[401] F. E. Shamout, A. N. Pouliopoulos, P. Lee, S. Bonaccorsi, L. Towhidi, R. Krams, and J. J. Choi.
“Enhancement of non‐invasive trans‐membrane drug delivery using ultrasound and microbubbles
during physiologically relevant flow”, Ultrasound Med Biol, 41, 2435‐2448 (2015).
[402] M. Edidin. “A rapid, quantitative fluorescence assay for cell damage by cytotoxic antibodies”, J
Immunol, 104, 1303‐1306 (1970).
[403] Z. Fan, D. Chen, and C. X. Deng. “Improving ultrasound gene transfection efficiency by controlling
ultrasound excitation of microbubbles”, J Control Release, 170, 401‐413 (2013).
[404] C. E. Shannon. “Communication in the presence of noise (Reprinted from the Proceedings of the
IRE, vol 37, pg 10‐21, 1949)”, Proceedings of the IEEE, 86, 447‐457 (1998).
[405] Z. Fan, D. Chen, and C. X. Deng. “Characterization of the dynamic activities of a population of
microbubbles driven by pulsed ultrasound exposure in sonoporation”, Ultrasound Med Biol, 40, 1260‐
1272 (2014).
[406] J. R. Doherty, G. E. Trahey, K. R. Nightingale, and M. L. Palmeri. “Acoustic radiation force elasticity
imaging in diagnostic ultrasound”, IEEE Trans Ultrason Ferroelectr Freq Control, 60, 685‐701 (2013).
295
Bibliography
[407] D. L. Miller and J. Song. “Tumor growth reduction and DNA transfer by cavitation‐enhanced high‐
intensity focused ultrasound in vivo”, Ultrasound Med Biol, 29, 887‐893 (2003).
[408] A. Ghanem, C. Steingen, F. Brenig, F. Funcke, Z. Y. Bai, C. Hall, C. T. Chin, G. Nickenig, W. Bloch, and
K. Tiemann. “Focused ultrasound‐induced stimulation of microbubbles augments site‐targeted
engraftment of mesenchymal stem cells after acute myocardial infarction”, J Mol Cell Cardiol, 47, 411‐
418 (2009).
[409] B. D. Meijering, L. J. Juffermans, A. van Wamel, R. H. Henning, I. S. Zuhorn, M. Emmer, A. M.
Versteilen, W. Paulus, W. H. van Gilst, K. Kooiman, N. de Jong, R. J. Musters, L. E. Deelman, and O.
Kamp. “Ultrasound and microbubble‐targeted delivery of macromolecules is regulated by induction
of endocytosis and pore formation”, Circ Res, 104, 679‐687 (2009).
[410] D. Bratosin, L. Mitrofan, C. Palii, J. Estaquier, and J. Montreuil. “Novel fluorescence assay using
calcein‐AM for the determination of human erythrocyte viability and aging”, Cytometry A, 66, 78‐84
(2005).
[411] K. A. Smith, S. A. Hill, A. C. Begg, and J. Denekamp. “Validation of the fluorescent dye Hoechst 33342
as a vascular space marker in tumours”, Br J Cancer, 57, 247‐253 (1988).
[412] M. Sriram, G. A. van der Marel, H. L. Roelen, J. H. van Boom, and A. H. Wang. “Conformation of B‐
DNA containing O6‐ethyl‐G‐C base pairs stabilized by minor groove binding drugs: molecular
structure of d(CGC[e6G]AATTCGCG complexed with Hoechst 33258 or Hoechst 33342”, EMBO J, 11,
225‐232 (1992).
[413] W. D. Wilson, C. R. Krishnamoorthy, Y. H. Wang, and J. C. Smith. “Mechanism of intercalation: ion
effects on the equilibrium and kinetic constants for the interaction of propidium and ethidium with
DNA”, Biopolymers, 24, 1941‐1961 (1985).
[414] W. S. Rasband. “ImageJ”, ed. Bethesda, Maryland, USA: U. S. National Institutes of Health, 1997‐
2016.
[415] N. Otsu. “Threshold Selection Method from Gray‐Level Histograms”, IEEE Trans on Systems Man and
Cybernetics, 9, 62‐66 (1979).
[416] T. R. Jones, A. Carpenter, and P. Golland. “Voronoi‐based segmentation of cells on image
manifolds”, Computer Vision for Biomedical Image Applications, Proceedings, 3765, 535‐543 (2005).
[417] S. Wold, K. Esbensen, and P. Geladi. “Principal Component Analysis”, Chemometrics and Intelligent
Laboratory Systems, 2, 37‐52 (1987).
[418] R. L. Tatusov, D. A. Natale, I. V. Garkavtsev, T. A. Tatusova, U. T. Shankavaram, B. S. Rao, B. Kiryutin,
M. Y. Galperin, N. D. Fedorova, and E. V. Koonin. “The COG database: new developments in
phylogenetic classification of proteins from complete genomes”, Nucleic Acids Res, 29, 22‐28 (2001).
[419] Z. Zivkovic and F. van der Heijden. “Efficient adaptive density estimation per image pixel for the task
of background subtraction”, Pattern Recognition Letters, 27, 773‐780 (2006).
[420] D. Allan, N. Keim, T. Caswell, and C. van der Wel. (2015, March 9). trackpy: Trackpy v0.3.0. Available:
http://zenodo.org/record/34028
[421] S. van der Walt, J. Schönberger, J. Nunez Iglesias, F. Boulogne, J. Warner, N. Yager, E. Gouillart, and
T. Yu. (2014, March 30). Blob detection, scikit‐image: Image Processing in Python. Available:
http://scikit‐image.org/docs/dev/auto_examples/plot_blob.html
[422] Y. Zhou, K. Yang, J. Cui, J. Y. Ye, and C. X. Deng. “Controlled permeation of cell membrane by single
bubble acoustic cavitation”, J Control Release, 157, 103‐111 (2012).
[423] B. Lammertink, R. Deckers, G. Storm, C. Moonen, and C. Bos. “Duration of ultrasound‐mediated
enhanced plasma membrane permeability”, Int J Pharm, 482, 92‐98 (2015).
[424] A. Yudina, M. Lepetit‐Coiffe, and C. T. Moonen. “Evaluation of the temporal window for drug
delivery following ultrasound‐mediated membrane permeability enhancement”, Mol Imaging Biol,
13, 239‐249 (2011).
296
Bibliography
[425] P. Wu and L. Brand. “Resonance energy transfer: methods and applications”, Anal Biochem, 218, 1‐
13 (1994).
[426] T. Frey. “Detection of bromodeoxyuridine incorporation by alteration of the fluorescence emission
from nucleic acid binding dyes using only an argon ion laser”, Cytometry, 17, 310‐318 (1994).
[427] C. Mannaris and M. A. Averkiou. “Investigation of microbubble response to long pulses used in
ultrasound‐enhanced drug delivery”, Ultrasound Med Biol, 38, 681‐691 (2012).
[428] H. M. DeLisser, P. J. Newman, and S. M. Albelda. “Molecular and functional aspects of PECAM‐
1/CD31”, Immunol Today, 15, 490‐495 (1994).
[429] M. de Saint Victor, C. Crake, C. C. Coussios, and E. Stride. “Properties, characteristics and applications
of microbubbles for sonothrombolysis”, Expert Opin Drug Deliv, 11, 187‐209 (2014).
[430] R. Shih, D. Bardin, T. D. Martz, P. S. Sheeran, P. A. Dayton, and A. P. Lee. “Flow‐focusing regimes for
accelerated production of monodisperse drug‐loadable microbubbles toward clinical‐scale
applications”, Lab Chip, 13, 4816‐4826 (2013).
[431] J. J. Rychak and A. L. Klibanov. “Nucleic acid delivery with microbubbles and ultrasound”, Adv Drug
Deliv Rev, 72, 82‐93 (2014).
[432] Y. Morch, R. Hansen, S. Berg, A. K. O. Aslund, W. R. Glomm, S. Eggen, R. Schmid, H. Johnsen, S.
Kubowicz, S. Snipstad, E. Sulheim, S. Hak, G. Singh, B. H. McDonagh, H. Blom, C. D. Davies, and P. M.
Stenstad. “Nanoparticle‐stabilized microbubbles for multimodal imaging and drug delivery”,
Contrast Media Mol Imaging, 10, 356‐366 (2015).
[433] T. Lammers, P. Koczera, S. Fokong, F. Gremse, J. Ehling, M. Vogt, A. Pich, G. Storm, M. van Zandvoort,
and F. Kiessling. “Theranostic USPIO‐Loaded Microbubbles for Mediating and Monitoring Blood‐
Brain Barrier Permeation”, Advanced Functional Materials, 25, 36‐43 (2015).
[434] J. P. Kilroy, A. L. Klibanov, B. R. Wamhoff, D. K. Bowles, and J. A. Hossack. “Localized in Vivo Model
Drug Delivery with Intravascular Ultrasound and Microbubbles”, Ultrasound Med Biol, 40, 2458‐2467
(2014).
[435] H. Dewitte, S. Van Lint, C. Heirman, K. Thielemans, S. C. De Smedt, K. Breckpot, and I. Lentacker.
“The potential of antigen and TriMix sonoporation using mRNA‐loaded microbubbles for
ultrasound‐triggered cancer immunotherapy”, J Control Release, 194, 28‐36 (2014).
[436] S. T. Laing, H. Kim, J. A. Kopechek, D. Parikh, S. L. Huang, M. E. Klegerman, C. K. Holland, and D. D.
McPherson. “Ultrasound‐mediated delivery of echogenic immunoliposomes to porcine vascular
smooth muscle cells in vivo”, J Liposome Res, 20, 160‐167 (2010).
[437] P. Prentice, A. Cuschierp, K. Dholakia, M. Prausnitz, and P. Campbell. “Membrane disruption by
optically controlled microbubble cavitation”, Nature Physics, 1, 107‐110 (2005).
[438] N. Kudo, K. Okada, and K. Yamamoto. “Sonoporation by Single‐Shot Pulsed Ultrasound with
Microbubbles Adjacent to Cells”, Biophys J, 96, 4866‐4876 (2009).
[439] C. C. Coussios and R. A. Roy. “Applications of acoustics and cavitation to noninvasive therapy and
drug delivery”, Annual Review of Fluid Mechanics, 40, 395‐420 (2008).
[440] R. Seda, D. S. Li, J. B. Fowlkes, and J. L. Bull. “Characterization of Bioeffects on Endothelial Cells
under Acoustic Droplet Vaporization”, Ultrasound Med Biol, 41, 3241‐3252 (2015).
[441] J. J. Kwan, R. Myers, C. M. Coviello, S. M. Graham, A. R. Shah, E. Stride, R. C. Carlisle, and C. C.
Coussios. “Ultrasound‐Propelled Nanocups for Drug Delivery”, Small, 11, 5305‐5314 (2015).
[442] D. Lensen, E. C. Gelderblom, D. M. Vriezema, P. Marmottant, N. Verdonschot, M. Versluis, N. de Jong,
and J. C. M. van Hest. “Biodegradable polymeric microcapsules for selective ultrasound‐triggered
drug release”, Soft Matter, 7, 5417‐5422 (2011).
[443] J. R. Eisenbrey, J. Hsu, and M. A. Wheatley. “Plasma sterilization of poly lactic acid ultrasound
contrast agents: surface modification and implications for drug delivery”, Ultrasound Med Biol, 35,
1854‐1862 (2009).
297
Bibliography
[444] E. Blanco, H. Shen, and M. Ferrari. “Principles of nanoparticle design for overcoming biological
barriers to drug delivery”, Nature Biotechnology, 33, 941‐951 (2015).
[445] T. M. Allen and P. R. Cullis. “Drug delivery systems: Entering the mainstream”, Science, 303, 1818‐1822
(2004).
[446] B. Arnal, C. Perez, C. W. Wei, J. J. Xia, M. Lombardo, I. Pelivanov, T. J. Matula, L. D. Pozzo, and M.
O'Donnell. “Sono‐photoacoustic imaging of gold nanoemulsions: Part I. Exposure thresholds”,
Photoacoustics, 3, 3‐10 (2015).
[447] E. Kang, H. S. Min, J. Lee, M. H. Han, H. J. Ahn, I. C. Yoon, K. Choi, K. Kim, K. Park, and I. C. Kwon.
“Nanobubbles from Gas‐Generating Polymeric Nanoparticles: Ultrasound Imaging of Living
Subjects”, Angewandte Chemie‐International Edition, 49, 524‐528 (2010).
[448] J. A. Straub, D. E. Chickering, C. C. Church, B. Shah, T. Hanlon, and H. Bernstein. “Porous PLGA
microparticles: AI‐700, an intravenously administered ultrasound contrast agent for use in
echocardiography”, J Control Release, 108, 21‐32 (2005).
[449] S. K. Hobbs, W. L. Monsky, F. Yuan, W. G. Roberts, L. Griffith, V. P. Torchilin, and R. K. Jain.
“Regulation of transport pathways in tumor vessels: role of tumor type and microenvironment”,
Proc Natl Acad Sci U S A, 95, 4607‐4612 (1998).
[450] I. s. IEC. “Safety of laser products‐‐‐Part 1: Equipment classification, requirements and user's guide”,
FDA/Center for Drug Evaluation and Research, Geneva, Switzerland2001.
[451] A. Loxley and B. Vincent. “Preparation of Poly(methylmethacrylate) Microcapsules with Liquid
Cores”, J Colloid Interface Sci, 208, 49‐62 (1998).
[452] R. K. Schlicher, H. Radhakrishna, T. P. Tolentino, R. P. Apkarian, V. Zarnitsyn, and M. R. Prausnitz.
“Mechanism of intracellular delivery by acoustic cavitation”, Ultrasound Med Biol, 32, 915‐924 (2006).
[453] C. Brana, C. Benham, and L. Sundstrom. “A method for characterising cell death in vitro by
combining propidium iodide staining with immunohistochemistry”, Brain Res Brain Res Protoc, 10,
109‐114 (2002).
[454] J. A. Steinkamp, B. E. Lehnert, and N. M. Lehnert. “Discrimination of damaged/dead cells by
propidium iodide uptake in immunofluorescently labeled populations analyzed by phase‐sensitive
flow cytometry”, J Immunol Methods, 226, 59‐70 (1999).
[455] V. C. Klema and A. J. Laub. “The Singular Value Decomposition ‐ Its Computation and Some
Applications”, IEEE Transactions on Automatic Control, 25, 164‐176 (1980).
[456] T. Suzuki, K. Fujikura, T. Higashiyama, and K. Takata. “DNA staining for fluorescence and laser
confocal microscopy”, J Histochem Cytochem, 45, 49‐53 (1997).
[457] K. Smolders and J. Baeyens. “Thermal degradation of PMMA in fluidised beds”, Waste Management,
24, 849‐857 (2004).
[458] X. Chen, J. M. F. Wan, and A. C. H. Yu. “Sonoporation as a Cellular Stress: Induction of Morphological
Repression and Developmental Delays”, Ultrasound Med Biol, 39, 1075‐1086 (2013).
[459] M. T. Burgess and T. M. Porter. “Acoustic Cavitation‐Mediated Delivery of Small Interfering
Ribonucleic Acids with Phase‐Shift Nano‐Emulsions."
[460] N. Reznik, O. Shpak, E. C. Gelderblom, R. Williams, N. de Jong, M. Versluis, and P. N. Burns. “The
efficiency and stability of bubble formation by acoustic vaporization of submicron perfluorocarbon
droplets”, Ultrasonics, 53, 1368‐1376 (2013).
[461] E. Pisani, N. Tsapis, J. Paris, V. Nicolas, L. Cattel, and E. Fattal. “Polymeric nano/microcapsules of
liquid perfluorocarbons for ultrasonic imaging: Physical characterization”, Langmuir, 22, 4397‐4402
(2006).
[462] G. Gutierrez, H. D. Reines, and M. E. Wulf‐Gutierrez. “Clinical review: hemorrhagic shock”, Crit Care,
8, 373‐381 (2004).
298
Bibliography
[463] A. Khwaja. “KDIGO clinical practice guidelines for acute kidney injury”, Nephron Clin Pract, 120, c179‐
184 (2012).
[464] M. van Iterson, R. Bezemer, M. Heger, M. Siegemund, and C. Ince. “Microcirculation follows
macrocirculation in heart and gut in the acute phase of hemorrhagic shock and isovolemic
autologous whole blood resuscitation in pigs”, Transfusion, 52, 1552‐1559 (2012).
[465] J. V. Bonventre and L. Yang. “Cellular pathophysiology of ischemic acute kidney injury”, J Clin Invest,
121, 4210‐4221 (2011).
[466] J. Szopinski, K. Kusza, and M. Semionow. “Microcirculatory responses to hypovolemic shock”, J
Trauma, 71, 1779‐1788 (2011).
[467] A. G. Schneider, M. D. Goodwin, A. Schelleman, M. Bailey, L. Johnson, and R. Bellomo. “Contrast‐
enhanced ultrasound to evaluate changes in renal cortical perfusion around cardiac surgery: a pilot
study”, Crit Care, 17, R138 (2013).
[468] A. G. Schneider, P. Calzavacca, A. Schelleman, T. Huynh, M. Bailey, C. May, and R. Bellomo. “Contrast‐
enhanced ultrasound evaluation of renal microcirculation in sheep”, Int Care Med Exp, 2,(2014).
[469] A. G. Schneider, M. D. Goodwin, A. Schelleman, M. Bailey, L. Johnson, and R. Bellomo. “Contrast‐
enhanced ultrasonography to evaluate changes in renal cortical microcirculation induced by
noradrenaline: a pilot study”, Crit Care, 18, 653 (2014).
[470] F. Sui, Y. Zheng, W. X. Li, and J. L. Zhou. “Renal circulation and microcirculation during intra‐
abdominal hypertension in a porcine model”, Eur Rev Med Pharmacol Sci, 20, 452‐461 (2016).
[471] C. Hoeffel, S. Mule, L. Huwart, F. Frouin, J. P. Jais, O. Helenon, and J. M. Correas. “Renal blood flow
quantification in pigs using contrast‐enhanced ultrasound: an ex vivo study”, Ultraschall Med, 31, 363‐
369 (2010).
[472] K. Wei, E. Le, J. P. Bin, M. Coggins, J. Thorpe, and S. Kaul. “Quantification of renal blood flow with
contrast‐enhanced ultrasound”, J Am Coll Cardiol, 37, 1135‐1140 (2001).
[473] K. Kalantarinia, J. T. Belcik, J. T. Patrie, and K. Wei. “Real‐time measurement of renal blood flow in
healthy subjects using contrast‐enhanced ultrasound”, Am J Physiol Renal Physiol, 297, F1129‐1134
(2009).
[474] V. Daeichin, T. van Rooij, I. Skachkov, B. Ergin, P. A. C. Specht, A. Lima, C. Ince, J. G. Bosch, A. F. W.
van der Steen, N. de Jong, and K. Kooiman. “Microbubble composition and preparation for high‐
frequency contrast‐enhanced ultrasound imaging: in vitro and in vivo evaluation”, IEEE Trans
Ultrason Ferroelectr Freq Control, (2016 submitted).
[475] C. F. Dietrich, M. A. Averkiou, J. M. Correas, N. Lassau, E. Leen, and F. Piscaglia. “An EFSUMB
introduction into Dynamic Contrast‐Enhanced Ultrasound (DCE‐US) for quantification of tumour
perfusion”, Ultraschall Med, 33, 344‐351 (2012).
[476] J. R. Lindner, J. Song, A. R. Jayaweera, J. Sklenar, and S. Kaul. “Microvascular rheology of Definity
microbubbles after intra‐arterial and intravenous administration”, J Am Soc Echocardiogr, 15, 396‐
403 (2002).
[477] R. L. Mehta, J. A. Kellum, S. V. Shah, B. A. Molitoris, C. Ronco, D. G. Warnock, A. Levin, and N. Acute
Kidney Injury. “Acute Kidney Injury Network: report of an initiative to improve outcomes in acute
kidney injury”, Crit Care, 11, R31 (2007).
[478] T. P. Gauthier, H. S. Wasan, A. Muhammad, D. R. Owen, and E. L. Leen. “Assessment of global liver
blood flow with quantitative dynamic contrast‐enhanced ultrasound”, J Ultrasound Med, 30, 379‐385
(2011).
[479] C. Strouthos, M. Lampaskis, V. Sboros, A. McNeilly, and M. Averkiou. “Indicator dilution models for
the quantification of microvascular blood flow with bolus administration of ultrasound contrast
agents”, IEEE Trans Ultrason Ferroelectr Freq Control, 57, 1296‐1310 (2010).
299
Bibliography
[480] M. Averkiou, C. P. Keravnou, M. L. Izamis, and E. Leen. “Evaluation of Perfusion Quantification
Methods with Ultrasound Contrast Agents in a Machine‐Perfused Pig Liver”, Ultraschall in Med,
(2016).
[481] J. D. Briers. “Laser Doppler, speckle and related techniques for blood perfusion mapping and
imaging”, Physiol Meas, 22, R35‐66 (2001).
[482] R. Bezemer, M. Legrand, E. Klijn, M. Heger, I. C. Post, T. M. van Gulik, D. Payen, and C. Ince. “Real‐
time assessment of renal cortical microvascular perfusion heterogeneities using near‐infrared laser
speckle imaging”, Opt Express, 18, 15054‐15061 (2010).
[483] M. Gauthier, S. Pitre‐Champagnat, F. Tabarout, I. Leguerney, M. Polrot, and N. Lassau. “Impact of
the arterial input function on microvascularization parameter measurements using dynamic
contrast‐enhanced ultrasonography”, World J Radiol, 4, 291‐301 (2012).
[484] N. de Jong. “Mechanical index”, Eur J Echocardiogr, 3, 73‐74 (2002).
[485] J. M. Hudson, R. Williams, C. Tremblay‐Darveau, P. S. Sheeran, L. Milot, G. A. Bjarnason, and P. N.
Burns. “Dynamic contrast enhanced ultrasound for therapy monitoring”, Eur J Radiol, (2015).
[486] T. L. Szabo and P. A. Lewin. “Ultrasound Transducer Selection in Clinical Imaging Practice”, J
Ultrasound Med, 32, 573‐582 (2013).
[487] L. Zafrani and C. Ince. “Microcirculation in Acute and Chronic Kidney Diseases”, Am J Kidney Dis, 66,
1083‐1094 (2015).
[488] C. Langenberg, G. Gobe, S. Hood, C. N. May, and R. Bellomo. “Renal histopathology during
experimental septic acute kidney injury and recovery”, Crit Care Med, 42, e58‐67 (2014).
[489] B. Ergin, A. Kapucu, C. Demirci‐Tansel, and C. Ince. “The renal microcirculation in sepsis”, Nephrol
Dial Transplant, 30, 169‐177 (2015).
[490] D. Schwartz, M. Mendonca, I. Schwartz, Y. Xia, J. Satriano, C. B. Wilson, and R. C. Blantz. “Inhibition
of constitutive nitric oxide synthase (NOS) by nitric oxide generated by inducible NOS after
lipopolysaccharide administration provokes renal dysfunction in rats”, J Clin Invest, 100, 439‐448
(1997).
[491] K. Doi, A. Leelahavanichkul, P. S. T. Yuen, and R. A. Star. “Animal models of sepsis and sepsis‐induced
kidney injury”, J Clin Invest, 119, 2868‐2878 (2009).
[492] Y. Takeda. “Velocity Profile Measurement by Ultrasound Doppler‐Shift Method”, Int J Heat Fluid Fl,
7, 313‐318 (1986).
[493] D. F. Ten Cate, J. J. Luime, M. van der Ven, J. M. Hazes, K. Kooiman, N. de Jong, and J. G. Bosch. “Very
different performance of the power Doppler modalities of several ultrasound machines ascertained
by a microvessel flow phantom”, Arthritis Res Ther, 15, R162 (2013).
[494] L. Wan, N. Yang, C. Y. Hiew, A. Schelleman, L. Johnson, C. May, and R. Bellomo. “An assessment of
the accuracy of renal blood flow estimation by Doppler ultrasound”, Intensive Care Med, 34, 1503‐
1510 (2008).
[495] A. Schneider, L. Johnson, M. Goodwin, A. Schelleman, and R. Bellomo. “Bench‐to‐bedside review:
Contrast enhanced ultrasonography ‐ a promising technique to assess renal perfusion in the ICU”,
Crit Care, 15,(2011).
[496] T. Schlosser, C. Pohl, C. Veltmann, S. Lohmaier, J. Goenechea, A. Ehlgen, J. Koster, D. Bimmel, S.
Kuntz‐Hehner, H. Becher, and K. Tiemann. “Feasibility of the flash‐replenishment concept in renal
tissue: which parameters affect the assessment of the contrast replenishment?”, Ultrasound Med
Biol, 27, 937‐944 (2001).
[497] P. T. Goedhart, M. Khalilzada, R. Bezemer, J. Merza, and C. Ince. “Sidestream Dark Field (SDF)
imaging: a novel stroboscopic LED ring‐based imaging modality for clinical assessment of the
microcirculation”, Opt Express, 15, 15101‐15114 (2007).
300
Bibliography
[498] J. Ostensen, R. Hede, Y. Myreng, T. Ege, and E. Holtz. “Intravenous injection of Albunex
microspheres causes thromboxane mediated pulmonary hypertension in pigs, but not in monkeys
or rabbits”, Acta Physiol Scand, 144, 307‐315 (1992).
[499] S. E. Grauer, G. A. Pantely, J. Xu, S. Ge, G. D. Giraud, T. Shiota, and D. J. Sahn. “Myocardial imaging
with a new transpulmonary lipid‐fluorocarbon echo contrast agent: experimental studies in pigs”,
Am Heart J, 132, 938‐945 (1996).
[500] M. Draijer, E. Hondebrink, T. van Leeuwen, and W. Steenbergen. “Review of laser speckle contrast
techniques for visualizing tissue perfusion”, Lasers in Medical Science, 24, 639‐651 (2009).
[501] S. Hutchings, S. Watts, and E. Kirkman. “The Cytocam video microscope. A new method for
visualising the microcirculation using Incident Dark Field technology”, Clin Hemorheol Microcirc, 62,
261‐271 (2016).
[502] M. J. Massey, E. LaRochelle, G. Najarro, A. Karmacharla, R. Arnold, S. Trzeciak, D. C. Angus, and N. I.
Shapiro. “The microcirculation image quality score: Development and preliminary evaluation of a
proposed approach to grading quality of image acquisition for bedside videomicroscopy”, J Crit
Care, 28, 913‐917 (2013).
[503] D. De Backer, S. Hollenberg, C. Boerma, P. Goedhart, G. Buchele, G. Ospina‐Tascon, I. Dobbe, and C.
Ince. “How to evaluate the microcirculation: report of a round table conference”, Crit Care, 11,(2007).
[504] M. Sorelli, L. Bocchi, and C. Ince. “Monitoring the microcirculation at the bedside using hand‐held
imaging microscopes: automatic tracking of erythrocytes”, 2015 37th Annual International
Conference of the IEEE Engineering in Medicine and Biology Society (Embc), 7378‐7381 (2015).
[505] D. Payen, A. C. de Pont, Y. Sakr, C. Spies, K. Reinhart, and J. L. Vincent. “A positive fluid balance is
associated with a worse outcome in patients with acute renal failure”, Crit Care, 12,(2008).
[506] M. Legrand, C. Dupuis, C. Simon, E. Gayat, J. Mateo, A. C. Lukaszewicz, and D. Payen. “Association
between systemic hemodynamics and septic acute kidney injury in critically ill patients: a
retrospective observational study”, Crit Care, 17,(2013).
[507] J. Chvojka, R. Sykora, A. Krouzecky, J. Radej, V. Varnerova, T. Karvunidis, O. Hes, I. Novak, P.
Radermacher, and M. Matejovic. “Renal haemodynamic, microcirculatory, metabolic and
histopathological responses to peritonitis‐induced septic shock in pigs”, Crit Care, 12,(2008).
[508] X. Li, M. C. Liu, D. Bedja, C. Thoburn, K. Gabrielson, L. Racusen, and H. Rabb. “Acute renal venous
obstruction is more detrimental to the kidney than arterial occlusion: implication for murine models
of acute kidney injury”, Am J Physiol Renal Physiol, 302, F519‐F525 (2012).
[509] S. Tanaka, A. Harrois, C. Nicolai, M. Flores, S. Hamada, E. Vicaut, and J. Duranteau. “Qualitative real‐
time analysis by nurses of sublingual microcirculation in intensive care unit: the MICRONURSE
study”, Crit Care, 19,(2015).
[510] M. Cecconi, D. De Backer, M. Antonelli, R. Beale, J. Bakker, C. Hofer, R. Jaeschke, A. Mebazaa, M. R.
Pinsky, J. L. Teboul, J. L. Vincent, and A. Rhodes. “Consensus on circulatory shock and hemodynamic
monitoring. Task force of the European Society of Intensive Care Medicine”, Intensive Care Med, 40,
1795‐1815 (2014).
[511] J. R. Lindner. “Microbubbles in medical imaging: current applications and future directions”, Nat Rev
Drug Discov, 3, 527‐532 (2004).
[512] B. P. Davidson, B. A. Kaufmann, J. T. Belcik, A. Xie, Y. Qi, and J. R. Lindner. “Detection of Antecedent
Myocardial Ischemia With Multiselectin Molecular Imaging”, J Am Coll Cardiol, (2012).
[513] A. Yudina, M. Lepetit‐Coiffe, M. De Smet, S. Langereis, H. Grull, and C. Moonen. “In vivo temperature
controlled ultrasound‐mediated intracellular delivery of cell‐impermeable compounds”, J Control
Release, 161, 90‐97 (2012).
[514] S. S. Abdelmoneim, M. Bernier, C. G. Scott, A. Dhoble, S. A. Ness, M. E. Hagen, S. Moir, R. B. McCully,
P. A. Pellikka, and S. L. Mulvagh. “Safety of contrast agent use during stress echocardiography: a 4‐
301
Bibliography
year experience from a single‐center cohort study of 26,774 patients”, JACC Cardiovasc Imaging, 2,
1048‐1056 (2009).
[515] M. L. Main, A. C. Ryan, T. E. Davis, M. P. Albano, L. L. Kusnetzky, and M. Hibberd. “Acute Mortality in
Hospitalized Patients Undergoing Echocardiography With and Without an Ultrasound Contrast
Agent (Multicenter Registry Results in 4,300,966 Consecutive Patients)”, Am J Cardiol, 102, 1742‐1746
(2008).
[516] K. Wei, S. L. Mulvagh, L. Carson, R. Davidoff, R. Gabriel, R. A. Grimm, S. Wilson, L. Fane, C. A. Herzog,
W. A. Zoghbi, R. Taylor, M. Farrar, F. A. Chaudhry, T. R. Porter, W. Irani, and R. M. Lang. “The safety
of Definity and Optison for ultrasound image enhancement: a retrospective analysis of 78,383
administered contrast doses”, J Am Soc Echocardiogr, 21, 1202‐1206 (2008).
[517] D. M. Hallow, A. D. Mahajan, T. E. McCutchen, and M. R. Prausnitz. “Measurement and correlation
of acoustic cavitation with cellular bioeffects”, Ultrasound Med Biol, 32, 1111‐1122 (2006).
[518] H. R. Guzman, D. X. Nguyen, S. Khan, and M. R. Prausnitz. “Ultrasound‐mediated disruption of cell
membranes. I. Quantification of molecular uptake and cell viability”, J Acoust Soc Am, 110, 588‐596
(2001).
[519] W. J. Zhong, W. H. Sit, J. M. F. Wan, and A. C. H. Yu. “Sonoporation Induces Apoptosis and Cell Cycle
Arrest in Human Promyelocytic Leukemia Cells”, Ultrasound Med Biol, 37, 2149‐2159 (2011).
[520] J. Park, Z. Fan, and C. X. Deng. “Effects of shear stress cultivation on cell membrane disruption and
intracellular calcium concentration in sonoporation of endothelial cells”, J Biomech, 44, 164‐169
(2011).
[521] D. L. Miller, C. Y. Dou, and R. C. Wiggins. “Glomerular Capillary Hemorrhage Induced in Rats by
Diagnostic Ultrasound with Gas‐Body Contrast Agent Produces Intratubular Obstruction”,
Ultrasound Med Biol, 35, 869‐877 (2009).
[522] H. R. Guzman, A. J. McNamara, D. X. Nguyen, and M. R. Prausnitz. “Bioeffects caused by changes in
acoustic cavitation bubble density and cell concentration: A unified explanation based on cell‐to‐
bubble ratio and blast radius”, Ultrasound Med Biol, 29, 1211‐1222 (2003).
[523] R. Karshafian, S. Samac, P. D. Bevan, and P. N. Burns. “Microbubble mediated sonoporation of cells
in suspension: Clonogenic viability and influence of molecular size on uptake”, Ultrasonics, 50, 691‐
697 (2010).
[524] M. A. Hassan, P. Campbell, and T. Kondo. “The role of Ca2+ in ultrasound‐elicited bioeffects:
progress, perspectives and prospects”, Drug Discovery Today, 15, 892‐906 (2010).
[525] R. S. Leow, J. M. F. Wan, and A. C. H. Yu. “Membrane blebbing as a recovery manoeuvre in site‐
specific sonoporation mediated by targeted microbubbles”, J R Soc Interface, 12,(2015).
[526] A. Delalande, S. Kotopoulis, T. Rovers, C. Pichon, and M. Postema. “Sonoporation at a low
mechanical index”, Bubble Science, Engineering & Technology, 3, 3‐12 (2011).
[527] J. D. Hutcheson, R. K. Schlicher, H. K. Hicks, and M. R. Prausnitz. “Saving Cells from Ultrasound‐
Induced Apoptosis: Quantification of Cell Death and Uptake Following Sonication and Effects of
Targeted Calcium Chelation”, Ultrasound Med Biol, 36, 1008‐1021 (2010).
[528] M. A. Hassan, L. B. Feril, K. Suzuki, N. Kudo, K. Tachibana, and T. Kondo. “Evaluation and comparison
of three novel microbubbles: Enhancement of ultrasound‐induced cell death and free radicals
production”, Ultrason Sonochem, 16, 372‐378 (2009).
[529] H. Honda, Q. L. Zhao, and T. Kondo. “Effects of dissolved gases and an echo contrast agent on
apoptosis induced by ultrasound and its mechanism via the mitochondria‐caspase pathway”,
Ultrasound Med Biol, 28, 673‐682 (2002).
[530] K. Yanagisawa, F. Moriyasu, T. Miyahara, M. Yuki, and H. Iijima. “Phagocytosis of ultrasound contrast
agent microbubbles by Kupffer cells”, Ultrasound Med Biol, 33, 318‐325 (2007).
302
Bibliography
[531] D. L. Miller and J. Quddus. “Lysis and sonoporation of epidermoid and phagocytic monolayer cells
by diagnostic ultrasound activation of contrast agent gas bodies”, Ultrasound Med Biol, 27, 1107‐1113
(2001).
[532] D. L. Miller and R. A. Gies. “Enhancement of ultrasonically‐induced hemolysis by perfluorocarbon‐
based compared to air‐based echo‐contrast agents”, Ultrasound Med Biol, 24, 285‐292 (1998).
[533] C. D. Ohl, M. Arora, R. Dijkink, V. Janve, and D. Lohse. “Surface cleaning from laser‐induced cavitation
bubbles”, Applied Physics Letters, 89,(2006).
[534] J. M. Escoffre, C. Mannaris, B. Geers, A. Novell, I. Lentacker, M. Averkiou, and A. Bouakaz.
“Doxorubicin Liposome‐Loaded Microbubbles for Contrast Imaging and Ultrasound‐Triggered Drug
Delivery”, IEEE Trans Ultrason Ferroelectr Freq Control, 60, 78‐87 (2013).
[535] R. Suzuki, T. Takizawa, Y. Negishi, K. Hagisawa, K. Tanaka, K. Sawamura, N. Utoguchi, T. Nishioka,
and K. Maruyama. “Gene delivery by combination of novel liposomal bubbles with
perfluoropropane and ultrasound”, J Control Release, 117, 130‐136 (2007).
[536] T. Kondo, V. Misik, and P. Riesz. “Effect of gas‐containing microspheres and echo contrast agents
on free radical formation by ultrasound”, Free Radical Biology and Medicine, 25, 605‐612 (1998).
[537] W. J. Zhong, X. Chen, P. P. Jiang, J. M. F. Wan, P. Qin, and A. C. H. Yu. “Induction of Endoplasmic
Reticulum Stress by Sonoporation: Linkage to Mitochondria‐Mediated Apoptosis Initiation”,
Ultrasound Med Biol, 39, 2382‐2392 (2013).
[538] M. A. Hassan, Y. Furusawa, M. Minemura, N. Rapoport, T. Sugiyama, and T. Kondo. “Ultrasound‐
Induced New Cellular Mechanism Involved in Drug Resistance”, Plos One, 7,(2012).
[539] P. D. Edmonds and K. M. Sancier. “Evidence for Free‐Radical Production by Ultrasonic Cavitation in
Biological Media”, Ultrasound Med Biol, 9, 635‐639 (1983).
[540] H. R. Rott. “Safety of Ultrasonic Contrast Agents”, J Acoust Soc Am, 9, 195‐197 (1999).
[541] V. Mornstein. “Cavitation‐induced risks associated with contrast agents used in ultrasonography”, J
Acoust Soc Am, 5, 101‐111 (1997).
[542] L. J. Machlin and A. Bendich. “Free‐Radical Tissue‐Damage ‐ Protective Role of Antioxidant
Nutrients”, Faseb Journal, 1, 441‐445 (1987).
[543] K. K. Jain. “Nanobiotechnology‐based strategies for crossing the blood‐brain barrier”,
Nanomedicine, 7, 1225‐1233 (2012).
[544] H. L. Liu, M. Y. Hua, P. Y. Chen, P. C. Chu, C. H. Pan, H. W. Yang, C. Y. Huang, J. J. Wang, T. C. Yen, and
K. C. Wei. “Blood‐Brain Barrier Disruption with Focused Ultrasound Enhances Delivery of
Chemotherapeutic Drugs for Glioblastoma Treatment”, Radiology, 255, 415‐425 (2010).
[545] F. Y. Yang, Y. S. Lin, K. H. Kang, and T. K. Chao. “Reversible blood‐brain barrier disruption by repeated
transcranial focused ultrasound allows enhanced extravasation”, J Control Release, 150, 111‐116
(2011).
[546] A. Carpentier, M. Canney, A. Vignot, V. Reina, K. Beccaria, C. Horodyckid, C. Karachi, D. Leclercq, C.
Lafon, J. Y. Chapelon, L. Capelle, P. Cornu, M. Sanson, K. Hoang‐Xuan, J. Y. Delattre, and A. Idbaih.
“Clinical trial of blood‐brain barrier disruption by pulsed ultrasound”, Sci Transl Med, 8, 343re342
(2016).
[547] J. H. Hwang, A. A. Brayman, M. A. Reidy, T. J. Matula, M. B. Kimmey, and L. A. Crum. “Vascular effects
induced by combined 1‐MHz ultrasound and microbubble contrast agent treatments in vivo”,
Ultrasound Med Biol, 31, 553‐564 (2005).
[548] H. Chen, A. A. Brayman, A. P. Evan, and T. J. Matula. “Preliminary Observations on the Spatial
Correlation between Short‐Burst Microbubble Oscillations and Vascular Bioeffects”, Ultrasound Med
Biol, 38, 2151‐2162 (2012).
303
Bibliography
[549] S. M. Stieger, C. F. Caskey, R. H. Adamson, S. P. Qin, F. R. E. Curry, E. R. Wisner, and K. W. Ferrara.
“Enhancement of vascular permeability with low‐frequency contrast‐enhanced ultrasound in the
chorioallantoic membrane model”, Radiology, 243, 112‐121 (2007).
[550] J. F. Zachary, J. P. Blue, R. J. Miller, and W. D. O'Brien. “Vascular lesions and S‐thrombomodulin
concentrations from auricular arteries of rabbits infused with microbubble contrast agent and
exposed to pulsed ultrasound”, Ultrasound Med Biol, 32, 1781‐1791 (2006).
[551] J. M. Parker, M. W. Weller, L. M. Feinstein, R. J. Adams, M. L. Main, P. A. Grayburn, D. O. Cosgrove,
B. A. Goldberg, K. Darge, P. Nihoyannopoulos, S. Wilson, M. Monaghan, F. Piscaglia, B. Fowlkes, W.
Mathias, F. Moriyasu, M. C. Chammas, L. Greenbaum, and S. B. Feinstein. “Safety of Ultrasound
Contrast Agents in Patients With Known or Suspected Cardiac Shunts”, Am J Cardiol, 112, 1039‐1045
(2013).
[552] R. J. Weiss, M. Ahmad, F. Villanueva, S. Schmitz, G. Bhat, M. G. Hibberd, M. L. Main, and C.
Investigators. “CaRES (Contrast Echocardiography Registry for Safety Surveillance): A Prospective
Multicenter Study to Evaluate the Safety of the Ultrasound Contrast Agent Definity in Clinical
Practice”, J Am Soc Echocardiogr, 25, 790‐795 (2012).
[553] P. A. van der Wouw, A. C. Brauns, S. E. Bailey, J. E. Powers, and A. A. A. Wilde. “Premature ventricular
contractions during triggered imaging with ultrasound contrast”, J Am Soc Echocardiogr, 13, 288‐294
(2000).
[554] D. Dalecki, B. B. Keller, E. L. Carstensen, D. S. Neel, J. L. Palladino, and A. Noordergraaf. “Thresholds
for Premature Ventricular Contractions in Frog Hearts Exposed to Lithotripter Fields”, Ultrasound
Med Biol, 17, 341‐346 (1991).
[555] A. G. MacRobbie, C. H. Raeman, S. Z. Child, and D. Dalecki. “Thresholds for premature contractions
in murine hearts exposed to pulsed ultrasound”, Ultrasound Med Biol, 23, 761‐765 (1997).
[556] M. Kurt, K. A. Shaikh, L. Peterson, K. M. Kurrelmeyer, G. Shah, S. F. Nagueh, R. Fromm, M. A.
Quinones, and W. A. Zoghbi. “Impact of Contrast Echocardiography on Evaluation of Ventricular
Function and Clinical Management in a Large Prospective Cohort”, J Am Coll Cardiol, 53, 802‐810
(2009).
[557] M. Claudon, C. F. Dietrich, B. I. Choi, D. O. Cosgrove, M. Kudo, C. P. Nolsoe, F. Piscaglia, S. R. Wilson,
R. G. Barr, M. C. Chammas, N. G. Chaubal, M. H. Chen, D. A. Clevert, J. M. Correas, H. Ding, F. Forsberg,
J. B. Fowlkes, R. N. Gibson, B. B. Goldberg, N. Lassau, E. L. S. Leen, R. F. Mattrey, F. Moriyasu, L.
Solbiati, H. P. Weskott, and H. X. Xu. “Guidelines and Good Clinical Practice Recommendations for
Contrast Enhanced Ultrasound (CEUS) in the Liver ‐ Update 2012 A WFUMB‐EFSUMB Initiative in
Cooperation With Representatives of AFSUMB, AIUM, ASUM, FLAUS and ICUS”, Ultraschall Med, 34,
11‐29 (2013).
[558] S. B. Barnett, G. R. Ter Haar, M. C. Ziskin, H. D. Rott, F. A. Duck, and K. Maeda. “International
recommendations and guidelines for the safe use of diagnostic ultrasound in medicine”, Ultrasound
Med Biol, 26, 355‐366 (2000).
[559] Definity. “Clinical Pharmacology Biopharmaceutics Review(s)”, FDA/Center for Drug Evaluation and
Research, Silver Spring, USA2000 2000.
[560] A. W. Appis, M. J. Tracy, and S. B. Feinstein. “Update on the safety and efficacy of commercial
ultrasound contrast agents in cardiac applications”, Echo Res Pract, 2, R55‐62 (2015).
[561] L. L. Kusnetzky, A. Khalid, T. M. Khumri, T. G. Moe, P. G. Jones, and M. L. Main. “Acute mortality in
hospitalized patients undergoing echocardiography with and without an ultrasound contrast agent
‐ Results in 18,671 consecutive studies”, J Am Coll Cardiol, 51, 1704‐1706 (2008).
[562] E. Rosado and M. Riccabona. “Off‐Label Use of Ultrasound Contrast Agents for Intravenous
Applications in Children Analysis of the Existing Literature”, J Ultrasound Med, 35, 487‐496 (2016).
304
Bibliography
[563] M. Hauben, E. Y. Hung, K. C. Hanretta, S. Bangalore, and V. Snow. “Safety of Perflutren Ultrasound
Contrast Agents: A Disproportionality Analysis of the US FAERS Database”, Drug Saf, 38, 1127‐1139
(2015).
[564] P. Soman, A. Lahiri, and R. Senior. “Safety of an intravenous second generation contrast agent in
patients with severe left ventricular dysfunction”, Heart, 84, 634‐635 (2000).
[565] R. S. Gabriel, Y. M. Smyth, V. Menon, A. L. Klein, R. A. Grimm, J. D. Thomas, and E. M. Sabik. “Safety
of Ultrasound Contrast Agents in Stress Echocardiography”, Am J Cardiol, 102, 1269‐1272 (2008).
[566] S. Kotopoulis, G. Dimcevski, O. H. Gilja, D. Hoem, and M. Postema. “Treatment of human pancreatic
cancer using combined ultrasound, microbubbles, and gemcitabine: A clinical case study”, Med Phys,
40,(2013).
305

306
Summary
SUMMARY
Ultrasound contrast agents have been used clinically for several decades to visualize blood
flow in the heart and malignancies in the liver and kidneys. The contrast agents that are now
approved for clinical use consist of microbubbles, tiny gas bubbles coated with a stabilizing
layer to prevent quick dissolution into the blood and to shield them from the immune system.
Because these gas bubbles are highly responsive to ultrasound and different from that of
tissue, microbubbles can be clearly distinguished from surrounding tissue. Microbubbles can
therefore be used for contrast enhancement of the blood. Next to that, microbubbles can
also be used to target to specific biomarkers that are expressed on the inside of blood vessels
by diseased tissue. Chapter 2 gives an overview of targeting methods and the diseases that
can currently be targeted. In addition, it describes how microbubbles are used for in vitro and
in vivo ultrasound molecular imaging and how they can be used to enhance drug delivery by
means of pore formation in the cell membrane (sonoporation) for therapeutic applications.
In order to design an ultrasound contrast agent for high‐frequency contrast‐enhanced
ultrasound imaging, Chapter 3 discusses different microbubble compositions and
preparation techniques that can be used to manufacture ultrasound contrast agents. The
performance of these contrast agents was tested in vitro and in an in vivo porcine model, and
compared to Target‐Ready MicroMarker, a commercially available contrast agent. Although
contrast enhancement of blood can be relatively easily achieved due to the high amount of
microbubbles, one of the main challenges in microbubble manufacturing is a similar response
of each individual microbubble. The rationale is that for molecular imaging only a few
microbubbles adhere to the biomarker of interest and you want to ensure that those few
microbubbles are actually detected.
In Chapters 4 to 7 the properties of individual non‐targeted microbubbles are investigated
using ultra‐high‐speed optical imaging. Chapter 4 reveals that replacing the main constituent
of the microbubble coating with another lipid significantly changes the microstructure, and
thus the distribution of the coating components. A lipid with only two extra C‐atoms changed
the homogeneous distribution of lipids in the shell to a heterogeneous distribution, and also
decreased the binding area. Because this is likely to also result in differences in their acoustic
behavior, this was studied in Chapter 5. Echogenic liposomes are a slightly different type of
lipid‐coated contrast agent that consist of a multi‐layer of lipids encapsulating a gas and an
aqueous phase. Those liposomes are also promising for several therapeutic strategies, such
as oxygen delivery to a tumor to enhance the effect of radiation or chemotherapy. In
Chapter 6 the shell properties of this type of contrast agent are characterized and were found
to be quite similar to microbubbles. For the analysis of these agents a more sophisticated and
faster experimental method was developed in cooperation with the University of Cincinnati
(Cincinnati, OH, USA). The Brandaris 128 ultra‐high‐speed camera that was used for the
research described in the previous chapters has already been in operation for over 13 years.
307
Summary
A similar camera has recently been built at the University of Pittsburgh (Pittsburgh, PA, USA)
that is able to better capture fast oscillating fluorescently labeled microbubbles. In Chapter 7
this camera was used to study the behavior of microbubbles that were fluorescently labeled,
to gain more insights into the specific movement of the lipids and try to experimentally
unravel the relation between compression‐only, buckling, and the acoustic behavior of the
microbubbles.
Following the chapters that discussed non‐targeted microbubbles, we move on to the
comparison of the acoustic properties between bound and non‐bound targeted
microbubbles in Chapter 8. The differentiation of bound microbubbles from those that are
freely moving in the blood could speed up ultrasound molecular imaging acquisition and
increase the specificity of the technique.
All previous chapters concerned experiments that were carried out in vitro, without the
presence of living cells. To move more towards clinical translation, the aspect of
microbubbles in contact with cells is an important hurdle that needs to be taken and better
understood. Sonoporation—the increased permeability of cell membranes through pore
formation mediated by ultrasound—is one of the most promising routes to enhance local
uptake of therapeutic agents or to induce local cell death by means of ultrasound. In
Chapter 9 experiments were designed to fully cover the importance of microbubble
displacement, oscillation, and targeting on the viability of human endothelial cells. Next to
microbubbles that are driven by an acoustic pulse, one can also use other types of contrast
agents. Chapter 10 describes laser‐activated polymer microcapsules that absorb the light and
create a gas microbubble that interacts with nearby cells. The imaging and therapeutic
windows of these types of capsules are assessed in this chapter.
The final step before clinical translation and clinical application concerns experiments on
living animals. Chapters 11 and 12 describe the in vivo experiments on pigs that were
performed using quantitative contrast‐enhanced ultrasound imaging and laser‐speckle
imaging of the kidney and video‐microscopy on the microvasculature under the tongue. This
project was initiated by the direct clinical need for new diagnostic tools to assess acute kidney
injury in patients that are admitted to the intensive care unit. Two different causes of acute
kidney injury were studied: hypovolemic shock induced by severe blood loss (i.e. hemorrhage,
Chapter 11) and a systemic bloodstream infection (i.e. sepsis, Chapter 12). The difference
between the arrival time of the contrast bolus in the cortical arteries and the cortical
microcirculation was the best suitable parameter for quantifying renal cortical alterations
after inducing hemorrhagic shock. For sepsis, the maximum contrast intensity and the ratio
between the peak value and the final value were found to best reflect microcirculatory
alterations.
Chapter 13 discusses the use of microbubbles and the associated risks on the cellular and
tissue level, clinical usage, and on long‐term patient outcome. With respect to contrast‐
enhanced MR and CT imaging, the number of ultrasound examinations is still much lower.
308
Summary
From the presented overview of risks, it is clear that ultrasound contrast imaging is safer and
cheaper than the other contrast‐enhanced imaging modalities and also offers several
therapeutic applications.
In Chapter 14 the conclusions of all chapters are discussed and possible future directions
to speed up the translation of ultrasound contrast agents for imaging and therapy to the clinic
are provided.
309

310
Samenvatting
SAMENVATTING
Contrastmiddelen voor echografie worden al tientallen jaren gebruikt bij
routineonderzoeken in het ziekenhuis om de stroming van bloed te laten zien en om
onvolkomenheden in het samentrekken van de hartspier in beeld te brengen. De
contrastmiddelen die nu goedgekeurd zijn voor gebruik bij patiënten bestaan allemaal uit
microbellen. Dit zijn kleine gasbelletjes, die door een dun laagje vet gestabiliseerd worden.
Dat vetlaagje zorgt ervoor dat de microbellen minder snel oplossen in het bloed en zorgt ook
voor afscherming van het immuunsysteem. Omdat deze microbellen erg goed reageren op
het ultrageluid dat gebruikt wordt voor het uitvoeren van echografie‐onderzoeken en omdat
ze anders reageren op dit geluid dan het omliggende weefsel, kunnen de microbellen heel
specifiek in beeld worden gebracht.
Naast het gebruik van deze contrastmiddelen om de bloedstroming in beeld te brengen,
kun je deze microbellen ook specifiek laten binden aan biomarkers die in de bloedbaan tot
expressie komen bij bepaalde ziekteprocessen. Deze biomarkers zijn moleculen die bij een
bepaalde ziekte op het oppervlak van een cel aanwezig zijn en waaraan de microbellen zich
kunnen hechten. Hoofdstuk 2 geeft een overzicht van de huidige manieren om microbellen
te functionaliseren met moleculen die specifiek aan een bepaalde biomarker binden, zoals
bijvoorbeeld aan een kankercel. In dit hoofdstuk wordt ook aandacht besteed aan de
biomarkers die hiervoor gebruikt kunnen worden en hoe dit gebruikt kan worden voor
moleculaire beeldvorming wanneer een microbel zich bindt aan de biomarker.
Wat de microbellen uniek maakt als contrastmiddel, is het feit dat ze vibreren door de
inkomende ultrageluidsgolf; hierdoor kunnen ze als het ware een cel ‘masseren’ en hierdoor
poriën creëren in een celmembraan (sonoporatie). Het laatste deel van dit hoofdstuk
bespreekt de mogelijkheden van microbellen om medicijnen heel lokaal af te geven of cellen
zo drastisch te behandelen dat ze dood gaan. Na deze uitgebreide introductie op het
functionaliseren van microbellen en waar we deze voor kunnen gebruiken, gaan we terug
naar de basis: proberen microbellen te produceren met zo goed mogelijke eigenschappen en
die bij voorkeur ook nog aan specifieke eisen aangepast kunnen worden.
Hoofdstuk 3 gaat in op de twee meest gebruikte productiemethoden voor microbellen
(hard schudden of door middel van geluidsgolven) en de kwaliteit hiervan voor de
beeldvorming in een gecontroleerde laboratoriumopstelling en in een levend varken
(zogenaamde in vivo experimenten). In beide situaties worden de zelfgemaakte microbellen
vergeleken met een commercieel verkrijgbaar contrastmiddel. Deze productiemethoden en
kwantificaties richten zich op grote hoeveelheden microbellen bij elkaar, waardoor er al snel
voldoende contrast gegenereerd wordt. Maar in het geval van moleculaire beeldvorming met
gefunctionaliseerde microbellen, zullen er zich slechts enkele binden aan een biomarker, dus
het signaal van een enkele microbel moet specifiek en hetzelfde zijn voor alle microbellen.
311
Samenvatting
Dit is tot op heden een nog niet opgelost probleem; de grootte van een bel voorspelt het
grootste deel van het gedrag, maar de eigenschappen van het stabiliserende vetlaagje spelen
hierin ook een belangrijke rol. Om dit beter te begrijpen zijn individuele microbellen bekeken
met een microscoop met een zeer hoge resolutie (hoofdstuk 4) en met de unieke Brandaris
128 hogesnelheidscamera die 25 miljoen foto’s per seconde kan maken (hoofdstuk 5); ruim
voldoende om de snelle beweging van de microbellen in de orde van 1 tot 4 miljoen vibraties
per seconde in beeld te kunnen brengen. Hoofdstuk 4 laat zien dat de verandering van één
van de componenten in het stabiliserende vetlaagje de gehele ordening van de vetten
verandert. Het vetmolecuul met twee koolstofatomen extra zorgt ervoor dat de homogene
samenstelling verandert in een heterogene samenstelling en dat het bindingsoppervlak
kleiner wordt. Omdat het logisch lijkt dat dit ook zorgt voor een verandering in de reactie op
ultrageluid, is dat onderzocht met de experimenten die beschreven staan in hoofdstuk 5.
Met diezelfde hogesnelheidscamera bestuderen we in hoofdstuk 6 niet de klassieke
microbellen, maar echogene liposomen. Deze contrastmiddelen hebben een dikkere vetlaag
en kunnen bijvoorbeeld gevuld worden met zuurstof, wat afgeleverd kan worden in een
tumor om het effect van bestraling of chemotherapie te versterken. Voor de analyse van het
gedrag van deze liposomen hebben we een geavanceerdere en snellere methode
ontwikkeld. Deze methode laat zien dat de eigenschappen van het vetlaagje vrij sterk lijken
op die van de microbellen.
De Brandaris 128 hogesnelheidscamera die gebruikt is in de vorige hoofdstukken, is
ondertussen al 13 jaar in gebruik en recent is aan de Universiteit van Pittsburgh (Pittsburgh,
Pennsylvania, Verenigde Staten) een vergelijkbare camera ontwikkeld. Deze camera heeft
een hogere lichtgevoeligheid, waardoor op hogere snelheden ook beelden gemaakt kunnen
worden van fluorescent gelabelde microbellen. Deze camera is gebruikt in hoofdstuk 7 om
beter te begrijpen hoe de vetmoleculen bewegen gedurende de snelle vibraties van de
microbel. Tevens proberen we hiermee voor het eerst experimenteel de relatie inzichtelijk te
maken tussen zogenaamd compressiegedrag, waarbij de bel meer compressie dan expansie
vertoont, de frequentie waarmee de bel beweegt en het indeuken van het vetlaagje
(‘buckling’).
In de hoofdstukken 5 – 7 worden de echogene eigenschappen bestudeerd van
microbellen die niet vastzitten aan een biomarker, maar vrij kunnen bewegen. Omdat het
waarschijnlijk is dat deze eigenschappen veranderen zodra de microbel bindt aan een
biomarker vergelijken we in hoofdstuk 8 hetzelfde type bellen in deze twee situaties:
gebonden en niet gebonden. Het onderscheid van het akoestisch signaal van microbellen die
vrij in de bloedbaan kunnen bewegen en de microbellen die vastzitten aan een biomarker kan
de specificiteit van moleculaire beeldvorming verhogen. Tevens kan dit de opnametijd die
nodig is om hiervan een beeld te maken significant verkorten.
De experimenten in de vorige hoofdstukken zijn allemaal in vitro (in een
laboratoriumomgeving) uitgevoerd zonder de aanwezigheid van levende cellen. Op de weg
312
Samenvatting
naar de toepassing in het ziekenhuis is het belangrijk om hier ook aandacht aan te besteden,
omdat een celmembraan zich anders gedraagt dan een kunstmatig membraan van plastic.
Zoals eerder gezegd is sonoporatie een van de meest veelbelovende therapieën die we met
ultrageluid naar het ziekenhuis kunnen brengen om lokale medicijnafgifte en celdood beter
te kunnen controleren. In hoofdstuk 9 wordt besproken wat de invloed van het
functionaliseren van microbellen en de verplaatsing en oscillatie ervan voor invloed hebben
op humane endotheelcellen.
Tot nu toe ging het over microbellen die onder invloed van ultrageluid beginnen met
oscilleren, maar er zijn ook andere mogelijkheden waar je aan kunt denken bij
contrastmiddelen voor echografie. Hoofdstuk 10 beschrijft laser‐geactiveerde microcapsules
met een licht‐absorberende kleurstof in het polymere omhulsel. Door gebruik te maken van
een polymeer, in plaats van een vetlaagje, creëer je een contrastmiddel met een langere
levensduur in de bloedbaan van de patiënt. De laser verdampt de olie in de kern van de
microcapsule, wat een gasbel veroorzaakt. Door deze verdamping van de olie in een gas
wordt een ultrageluidssignaal gegenereerd. Uit het onderzoek naar het effect van de
verdamping van deze microcapsules in de nabijheid van humane endotheelcellen, blijkt dat
ze erg effectief zijn in het doden van cellen, wat bijvoorbeeld gebruikt zou kunnen worden
bij de behandeling van tumoren.
De stap van cellen naar een patiënt blijft nog steeds erg groot. Daarom is er als tussenstap
gekozen voor het uitvoeren van experimenten op levende dieren. Hoofdstuk 11 en 12
beschrijven de in vivo experimenten op varkens, waarbij acuut nierfalen is opgewekt via het
simuleren van een grote bloeding of een bacteriële infectie. Behalve contrastechografie van
de nier hebben we in deze experimenten ook gebruik gemaakt van laser speckle
beeldvorming van de nier en videomicroscopie van de microcirculatie onder de tong. We
laten hier zien dat we veranderingen in de fysiologie van de falende nier kunnen
kwantificeren met behulp van echografie van de nier en met behulp van videomicroscopie
onder de tong. Dit project is direct geïnitieerd door de intensive care afdeling van het Erasmus
MC om nieuwe manieren te vinden voor de identificatie van acuut nierfalen en deze
methoden hebben daarom een grote kans om snel in de praktijk toegepast te kunnen
worden.
Aan elke injectie in de bloedbaan zijn risico’s verbonden, zo ook bij het gebruik van
microbellen. In hoofdstuk 13 geven we een overzicht van de risico’s waar rekening mee
gehouden moet worden op verschillende niveaus: op celniveau, weefselniveau en
langetermijneffecten voor de patiënt. Ondanks dat contrastechografie veiliger en goedkoper
is dan bijvoorbeeld contrastmiddelen voor MRI of CT, is het belangrijk om stil te staan bij de
mogelijke risico’s. Tenslotte geeft hoofdstuk 14 een overzicht van de belangrijkste conclusies,
implicaties voor de translatie naar het ziekenhuis en richtingen voor toekomstig onderzoek.
313

314

Dankwoord
DANKWOORD Op het heerlijk avondje in december zit ik aan tafel en ben ik bezig met het schrijven van het
meest gelezen deel van mijn proefschrift: het dankwoord. Ik kan me nog goed herinneren
hoe het allemaal begon in maart 2012 tijdens mijn sollicitatiegesprek met Hans, Nico en Ton.
Toen ik binnenkwam was het eerste wat ik zag een lelijk betonnen gebouw wat ervoor zorgde
dat ik me meteen thuis voelde omdat het zoveel lijkt op W‐Hoog op de TU/e. De ‘opgeruimde’
kantoren waren ook niet helemaal wat ik verwacht had. Gelukkig was het een goed gesprek
en was het een afdeling met erg leuke mensen. Ton en Nico, bedankt voor het vertrouwen
dat jullie in mij hadden, en wat ik hoop en denk ook waar te hebben kunnen maken. Toen
jullie me belden dat ik kon beginnen, moesten jullie wel nog even geduld hebben, omdat ik
diezelfde ochtend mijn contract op de TU/e, bij Klaas Nicolay, had ondertekend. Door de
goede connecties met Klaas was het ook totaal geen probleem dat ik daar nog even bleef
werken, maar dit bood ook een goede kans om hem te gebruiken als referentie om navraag
naar me te doen. Klaas werd door Nico gebeld tijdens een college, en hij nam zonder aarzelen
de telefoon op en vertelde aan alle aanwezige studenten dat er gebeld werd naar aanleiding
van een sollicitatie van mij (ik was mede‐docent bij dit vak). Klaas, ik weet zeker dat ik dankzij
jouw positieve woorden zonder een tweede sollicitatieronde aangenomen ben voor dit
project. Ook tijdens mijn promotie, binnen het NanoNextNL consortium, was je nog
betrokken bij mijn onderzoek en was je elke keer dat we elkaar spraken oprecht
geïnteresseerd in mijn werk. Ik ben je heel erg dankbaar voor je hulp en de samenwerking en
ik hoop dat je nog kunt genieten van het lezen van mijn proefschrift.
Het onderzoek dat beschreven staat in mijn proefschrift had nooit tot stand kunnen
komen zonder de geweldige hulp en begeleiding van Nico, Ton en Klazina. Ik heb deze vier
jaar fijn met jullie samengewerkt en vind het jammer dat daar nu een einde aan gaat komen.
Ik heb veel van jullie kunnen leren op wetenschappelijk gebied en door de samenwerking met
Nico kan ik nu ook uitstekend omgaan met mensen bij wie afspraken nakomen niet echt hun
sterkste punt is.
Naar goed voorbeeld van een van mijn stellingen (nummer 8) was er regelmatig afleiding
te vinden door de hoeveelheid vrouwen binnen een straal van 3 meter van mijn bureau: Inés,
Kirby en Sara thank you for making it fun to go to work! I enjoyed your company and help and
I hope you won’t miss me too much. Kirby, my work‐sister, thanks for constantly picking on
me and making Klazina worry whether we would scare off Inés when she started her
internship. Next to picking on me, I really appreciated your help in proofreading my English
and helping me out with the first draft of chapter 9. Inés, zonder jouw hulp had ik de artikelen
waarbij je betrokken was niet zo efficiënt en goed af kunnen ronden als nu het geval is. Heel
veel succes als de nieuwe hoeder van Brandaris, ik weet dat je er goed voor zult zorgen. Oh,
and Inés and Kirby, while fighting over my chair: don’t forget that you still have to share an
office for a few years.
315

Dankwoord
I also want to thank the old inhabitants of my office: Tom, Ying and Jason. Tom, ik heb fijn
met je samengewerkt en vooral in de beginperiode van mijn promotie was het erg prettig
iemand vlakbij te hebben die me wegwijs kon maken in het lab en op de afdeling. Het was
alleen niet altijd even praktisch om naast elkaar te zitten en dezelfde voornaam en hetzelfde
telefoonnummer te hebben. Ying, you were always an easy victim to pick on together with
Tom or Robert. You helped me a lot with my first paper and we’ve had some good
discussions. Jason, you were nice to work with, which resulted in a nice paper. Although you
were only there for a year, you taught me some things regarding Brandaris I did not know
before.
All the people of the BME family who helped me during my research, Ilya, Verya, Jason,
Rik, Guillaume Renaud, Hans, Deep, Geert and Michiel, thank you for your contributions. Frits
en Robert, zonder jullie kennis van de Brandaris zouden diverse experimenten waarschijnlijk
uitgelopen zijn op een fiasco. Jullie jarenlange ervaring en creativiteit om de Brandaris
draaiende te houden zijn van onschatbare waarde geweest voor mij, maar zeker ook voor de
rest van de afdeling.
Het labuitje dat ik twee jaar achter elkaar heb georganiseerd heb ik met plezier neergezet.
In het eerste jaar leerde ik iedereens wensen en kwaliteiten kennen: Tom Kokhuis houdt van
boten, Pieter van out‐of‐the‐box activiteiten en familieactiveiten en Jelle en ik waren goede
quizmakers en ‐masters. Bedankt voor het samen organiseren van dit uitje. The year after the
new recruits Ayla and Jovana joined as junior organizers. Since Jelle and I were the seniors,
the two of you took care of most of the work that year, including taking caring of Jacopo
when he tried to chop off his thumb. I still regret that we didn’t organize the sheep herding
workshop, but hopefully someone of the new committee will read this and put it into action.
Zonder de kwaliteiten van onze secretaresses Mieke, Gracia en Sharon zou de afdeling
nooit zo goed draaien en zouden de promovendi veel meer zelf moeten regelen. Bedankt
voor het regelen van alle zaken wat betreft de hoofdpijnafdeling P&O en het afhandelen van
de papierwinkel omtrent mijn verdediging.
Next to the people mentioned above, I want to thank all the BME family members who
made our department a nice working environment: Jan, Gerard, Charles, Krista, Jacopo, Alex,
Zeynettin, Hans Verdoes, Gracia, Lambert, David, Harm, Merih, Leah, Jolanda, Gijs, Frank, Kim,
Kim, Ali, Tianshi, Ruoyu, Muthu, Eric, Eline, Sophinese, Mirjam, Min, Reza, Erik‐Jan, Leonardo,
Lana, Annette, Kristina, and all the interns.
Zoals het een bellenonderzoeker betaamt in onze groep was er een sterke samenwerking
met de Physics of Fluids groep van de Universiteit Twente. Als eerste wil ik Michel bedanken
voor de nuttige input bij het schrijven van mijn allereerste artikel en de rest van de
samenwerking de afgelopen jaren. Daarnaast was het ook altijd weer gezellig om samen met
je de lokale brouwerijen of restaurants op te zoeken. Ik weet nu dat ik jou moet bellen als ik
in een stad ben waar ik nooit eerder geweest ben en op zoek ben naar een brouwerij of een
goed lokaal biertje. Tim, ik heb prettig met je samengewerkt, maar helaas hebben we het niet
316

Dankwoord
voor elkaar kunnen krijgen om het onderzoek om te zetten in een artikel. And of course a
special thanks to Guillaume, with whom I spent two weeks fulltime in the Brandaris lab and
at least four times that amount of time on Skype. Your knowledge on physics is impressive
and we were a great team. I enjoyed working with you and wish you all the luck with your
future career in bubbles. Elk jaar in Leeds en in Rotterdam was de coalitie tussen Enschede
en Rotterdam weer snel gevormd. We vormden een vast clubje dat elke avond (vaak tot iets
te laat) de kroeg opzocht om samen speciaalbier te drinken en soms ook nog wel wat
inhoudelijks te bediscussiëren. Deze coalitie was echter niet compleet zonder vrouwelijk
tegenwicht in de vorm van de dames uit Gent. Ine, Ine, Heleen en Silke, jullie ook bedankt
voor deze gezellige congresdagen, maar vooral ook de gezelligheid in de avonduren.
Vanaf december 2014 heb ik erg intensief samengewerkt met de afdelingen
Anesthesiologie en de Intensive Care van het Erasmus MC en Translationele Fysiologie van
het AMC in ons onderzoek naar acuut nierfalen. Deze varkensexperimenten duurden de hele
dag (en vaak ook nog ver in de avond), maar gelukkig hadden we een team wat er altijd de
moed inhield. Yasin, jij zorgde altijd voor de vrolijke noot, nutteloze filmpjes of je verhalen
over Thailand. Patricia zorgde voor het vrouwelijke tegenwicht, maar veel belangrijker nog
voor de kennis en ervaring van het doen van onderzoek met grote proefdieren. Zonder jouw
hulp hadden we de experimenten niet zo succesvol uit kunnen voeren. Bulent, you quickly
got familiar with the surgical procedure and calmly handled our energetic talks about
nothing, and additional experiments we wanted to perform. Alex, you were nice to work with
and I’m proud of the paper we wrote. En Can, zonder jouw inzet was deze studie nooit tot
stand gekomen. Het was een gouden idee om jouw kennis van de fysiologie en microcirculatie
te combineren met de ultrasoundkennis van onze afdeling. Onze samenwerking ging
allesbehalve van een leien dakje en we hebben heftige discussies gehad. Soms wist ik echt
niet meer wat ik met je aan moest als ik je voor de twintigste keer probeerde te overtuigen
van mijn gelijk. Uiteindelijk wist ik je vertrouwen te winnen en zijn we tot erg mooie resultaten
gekomen met methodes die jullie nu gaan testen bij patiënten op de IC. Ik ben er trots op dat
ik aan de voorbereiding hiervoor heb mee kunnen werken. Voor onze experimenten waren
we te gast bij Anesthesiologie waar Harold, Sam en Nathalie altijd in waren voor een praatje
en om ons even af te leiden tijdens het wachten tussen de verschillende metingen. Voor een
paar van onze experimenten zijn we uitgeweken naar de operatiekamer van Experimentele
Cardiologie, waarvoor ik Dirk‐Jan en Maaike wil bedanken.
Als je samen een verdieping deelt kom je elkaar regelmatig tegen op de gang, in de lift of
bij de koffieautomaat en sommige mensen kom je daar vaker tegen dan anderen. Ihsan, ik
kon altijd bij je terecht voor een kwartier slap ouwehoeren over niks tijdens je vele
koffiepauzes. Succes met jouw laatste loodjes!
Ik ben tijdens mijn promotie naar erg veel congressen geweest en heb daar veel mensen
leren kennen. Met de groepen uit Nijmegen en Eindhoven maakten we elke stad waar IEEE
Ultrasonics gehouden werd onveilig. Anne, Stein, Chris, Kai, Rik, Renate, Gijs, Richard, Emiel
317
Dankwoord
en Niels, bedankt voor deze Nederlandse onderonsjes. The other usual suspects at the
international conferences, Brandon, Ryan, and Marianne were always good to hang out with.
Ryan, we hung out together for some time in Providence, Boston and Chicago which I really
enjoyed. Marianne, thank you for showing me around in Chicago with your friends. Marjolein,
ik vond het leuk je op de ISTU in Utrecht weer tegen te komen en bedankt voor je leuke
afscheidsfeestje. Succes nog in de VS en met de afronding van jouw promotie!
Ongeveer wekelijks probeerden we wel samen een keertje thee te gaan drinken (stelling
11 moest in ere gehouden worden) en verder waren we er goed in om via Facebook over onze
dagelijkse PhD‐sleur te klagen. Ayla, bedankt voor al die uren die we bij een kop thee hebben
doorgebracht, die afleiding hadden we allebei vaak wel even nodig. Dat ga ik wel missen,
maar ik hoop dat we dat gewoon voort kunnen zetten als je straks half of helemaal in
Eindhoven woont. Behalve een collega ben je ook een goede vriendin geworden en daarom
ben ik ook blij dat je mij als paranimf bij wil staan tijdens mijn verdediging. Ondanks dat ik
mezelf altijd zag als iemand die dingen op regelt, heb ik mijn beide paranimfen pas vrij laat
gevraagd. Rick, ik ben blij dat je op korte termijn tijd kon maken zodat ik jullie nieuwe huis
kon bekijken en mezelf een handige gelegenheid gaf jou te vragen om mijn paranimf te zijn.
We hebben sinds ons eerste jaar op de TU/e veel samen gedaan en gedeeld en ik ben dan ook
blij dat jij toezegde om mijn paranimf te zijn.
Stiekem heb ik de laatste 3 maanden van de afronding nog erg veel moeten doen. Behalve
mijn proefschrift zat ik ook nog in mijn maag met het zoeken naar een baan en opeens alles
thuis alleen moeten regelen. Gelukkig stond ik daar niet helemaal alleen in en kon ik altijd bij
jou terecht, Lianne. Voor gezelschap, een sarcastische opmerking of gewoon om even te
klagen. In de laatste maanden fungeerde je als eerste klankbord wat betreft mijn stellingen,
lay‐out, cover en als proofreader van stukken tekst. Ondanks dat we het qua stijl bijna
standaard met elkaar oneens waren, hebben je hulp en commentaar me erg geholpen. Ik
hoop dat ik je tijdens de afronding van jouw proefschrift op dezelfde manier kan helpen.
Flip, jou wil ik heel erg bedanken voor het helpen met het ontwerp van de kaft en de
uitnodiging van dit proefschrift, hij is erg mooi geworden! Het einde van dit dankwoord en
daarmee toch ook wel een beetje mijn promotietijd, komt nu in zicht. Maar niet zonder dat ik
vrienden, familie, papa, mama, Evie en Flip bedankt heb. Jullie begrepen vaak niet waar ik nou
vier jaar mee bezig was, waarom ik ’s avonds of in het weekend aan het werk was en wat ik
er nou zo leuk aan vond. Als ik weer eens druk was en weinig tijd had om te koken, afleiding
nodig had of wat dan ook, kon ik altijd bij jullie terecht. Hopelijk snappen jullie bij het zien van
dit proefschrift waar ik het allemaal voor gedaan heb.
318

Publications
PEER‐REVIEWED PAPERS Tom van Rooij*, Guillaume Lajoinie*, Ilya Skachkov, Emilie Blazejewski, Gert Veldhuis, Nico de Jong, Klazina Kooiman, Michel Versluis. “Laser‐activated polymer microcapsules for acoustic imaging and therapy: an in vitro feasibility study”, Biophysical Journal (2016) – submitted Tom van Rooij, Inés Beekers, Kirby R. Lattwein, Antonius F.W. van der Steen, Nico de Jong, Klazina Kooiman. “Vibrational responses of targeted lipid‐coated single microbubbles”, IEEE Transactions on Ultrasound, Ferroelectrics and Frequency Control (2016) – submitted Verya Daeichin, Tom van Rooij, Ilya Skachkov, Bulent Ergin, Patricia A.C. Specht, Alexandre Lima, Can Ince, Johan G. Bosch, Antonius F.W. van der Steen, Nico de Jong, Klazina Kooiman. “Microbubble composition and preparation for high‐frequency contrast‐enhanced ultrasound imaging: in vitro and in vivo evaluation”, IEEE Transactions on Ultrasound, Ferroelectrics and Frequency Control (2016) – submitted
Tom van Rooij, Ilya Skachkov, Inés Beekers, Kirby R. Lattwein, Jason D. Voorneveld, Tom J.A. Kokhuis, Deep Bera, Ying Luan, Antonius F.W. van der Steen, Nico de Jong, Klazina Kooiman. “Viability of endothelial cells after ultrasound‐mediated sonoporation: influence of targeting, oscillation, and displacement of microbubbles”, Journal of Controlled Release, 238, 197–211 (2016)
Jason L. Raymond, Ying Luan, Tom van Rooij, Klazina Kooiman, Shao‐Ling Huang, David D. McPherson, Michel Versluis, Nico de Jong, Christy K. Holland. “Impulse response method for characterization of echogenic liposomes”, Journal of the Acoustical Society of America, 137, 1693–1703 (2015)
Tom van Rooij, Ying Luan, Guillaume Renaud, Antonius F.W. van der Steen, Michel Versluis, Nico de Jong, Klazina Kooiman. “Non‐linear response and viscoelastic properties of lipid‐coated microbubbles: DSPC versus DPPC”, Ultrasound in Medicine & Biology, 41, 1432–1445 (2015)
Tom van Rooij*, Verya Daeichin*, Ilya Skachkov, Nico de Jong, Klazina Kooiman. “Targeted ultrasound contrast agents for ultrasound molecular imaging and therapy”, International Journal of Hyperthermia, 31, 90–106 (2015)
Klazina Kooiman, Tom J.A. Kokhuis, Tom van Rooij, Ilya Skachkov, Alex Nigg, Johannes G. Bosch, Antonius F.W. van der Steen, Wiggert A. van Cappellen, and Nico de Jong. “DSPC or DPPC as main shell component influences ligand distribution and binding area of lipid‐coated targeted microbubbles”, European Journal of Lipid Science and Technology, 116, 1217–1227 (2014)
Eline P.M. Cardinaels*, Alma M.A. Mingels*, Tom van Rooij, Paul O. Collinson, Frits W. Prinzen,
and Marja P. van Dieijen‐Visser. “Time‐dependent Degradation Pattern of Cardiac Troponin T
Following Myocardial Infarction”, Clinical Chemistry, 59, 1083‐90 (2013)
319

Publications
PAPERS IN PREPARATION Tom van Rooij*, Alexandre Lima*, Bulent Ergin, Michele Sorelli, Yasin Ince, Patricia A.C. Specht, Egbert G. Mik, Leonardo Bocchi, Klazina Kooiman, Nico de Jong, Can Ince, “Renal contrast‐enhanced ultrasound and sublingual video‐microscopy identify microcirculatory dysfunction in acute kidney injury” Klazina Kooiman, Tom van Rooij, Bin Qin, Frits Mastik, Hendrik J. Vos, Michel Versluis, Alexander L. Klibanov, Nico de Jong, Flordeliza S. Villanueva, Xucai Chen “Focal areas of increased lipid concentration on the coating of microbubbles during short tone‐burst ultrasound insonification”
CONFERENCE PROCEEDINGS
Tom van Rooij, Alexandre Lima, Verya Daeichin, Patricia A.C. Specht, Bulent Ergin, Yasin Ince, Nico de Jong, Can Ince, Klazina Kooiman. “Feasibility of in vivo contrast‐enhanced ultrasound imaging of the renal cortex during hemorrhagic shock”, Proceedings IEEE International Ultrasonics Symposium 2015, Taipei, Taiwan, 21‐24 Oct 2015
Tom van Rooij, Antonius F.W. van der Steen, Nico de Jong, Klazina Kooiman. “Influence of binding on the vibrational responses of targeted lipid‐coated microbubbles”, Proceedings IEEE International Ultrasonics Symposium 2014, Chicago, Illinois, USA, 3‐6 Sept 2014 Tom van Rooij, Ying Luan, Guillaume Renaud, Antonius F.W. van der Steen, Nico de Jong, Klazina Kooiman. “Acoustical response of DSPC versus DPPC lipid‐coated microbubbles”, Proceedings IEEE International Ultrasonics Symposium 2013, Prague, Czech Republic, 21‐25 July 2013
Ying Luan, Guillaume Lajoinie, Erik Gelderblom, Ilya Skachkov, Heleen Dewitte, Ine Lentacker, Tom van Rooij, Hendrik Vos, Antonius F.W. van der Steen, Michel Versluis, Nico de Jong. “Liposome shedding from a vibrating microbubble on nanoseconds timescale”, Proceedings IEEE International Ultrasonics Symposium 2013, Prague, Czech Republic, 21‐25 July 2013
(* both first authors contributed equally)
320

Conference presentations
CONFERENCE PRESENTATIONS (presenter underlined)
Inés Beekers, Tom van Rooij, Martin D. Verweij, Michel Versluis, Nico de Jong, Sebastiaan J. Trietsch, Klazina Kooiman. “A novel microfluidics system for in vitro ultrasound‐enhanced drug delivery: acoustic characterization”, Dutch Biomedical Engineering Conference 2017, Egmond aan Zee, the Netherlands, 26‐27 Jan (oral) Tom van Rooij, Ilya Skachkov, Inés Beekers, Kirby R. Lattwein, Jason D. Voorneveld, Tom J.A. Kokhuis, Deep Bera, Ying Luan, Antonius F.W. van der Steen, Nico de Jong, Klazina Kooiman. “Bubble‐cell interactions for endothelial sonoporation at long pulses using targeted and non‐targeted microbubbles”, IEEE International Ultrasonics Symposium 2016, Tours, France, 18‐21 Sept 2016 (oral) Inés Beekers, Shreyas B. Raghunathan, Tom van Rooij, Verya Daeichin, Nico de Jong, Klazina Kooiman, Sebastiaan J. Trietsch. “Wave propagation in a novel microfluidics system for in vitro ultrasound‐enhanced drug delivery”, IEEE International Ultrasonics Symposium 2016, Tours, France, 18‐21 Sept 2016 (poster) Tom van Rooij, Ilya Skachkov, Inés Beekers, Kirby R. Lattwein, Jason D. Voorneveld, Tom J.A. Kokhuis, Deep Bera, Ying Luan, Antonius F.W. van der Steen, Nico de Jong, Klazina Kooiman. “Viability of endothelial cells after ultrasound‐mediated sonoporation”, 31st Bubble Conference 2016, Chicago, Illinois, USA, 10‐12 Sept (oral) Verya Daeichin, Tom van Rooij, Ilya Skachkov, Bulent Ergin, Patricia A.C. Specht, Alexandre Lima, Can Ince, Johan G. Bosch, Antonius F.W. van der Steen, Nico de Jong, Klazina Kooiman. “Microbubbles for high‐frequency contrast ultrasound imaging”, 6th Microbubble Symposium 2016, Leeds, UK, 18‐19 July 2016 (oral) Inés Beekers, Shreyas B. Raghunathan, Tom van Rooij, Verya Daeichin, Nico de Jong, Klazina Kooiman, Sebastiaan J. Trietsch. “Acoustic characterization of a novel microfluidics system for in vitro ultrasound‐mediated drug delivery”, NanoCity 2016, Amsterdam, the Netherlands, 21 June 2016 (oral & poster) Tom van Rooij, Guillaume Lajoinie, Ilya Skachkov, Nico de Jong, Klazina Kooiman, Michel Versluis. “Interaction of laser‐activated polymeric microcapsules with cells”, NanoCity 2016, Amsterdam, the Netherlands, 21 June 2016 (poster) Tom van Rooij, Guillaume Lajoinie, Ilya Skachkov, Nico de Jong, Klazina Kooiman, Michel Versluis. Interaction of laser‐activated polymeric microcapsules with cells”, 21st European symposium on Ultrasound Contrast Imaging, Rotterdam, the Netherlands, 21‐22 Jan 2016 (poster) Inés Beekers, Shreyas B. Raghunathan, Tom van Rooij, Verya Daeichin, Nico de Jong, Klazina Kooiman, Sebastiaan J. Trietsch. “Acoustic characterization of a novel cell culture platform for ultrasound‐mediated drug delivery”, 21st European symposium on Ultrasound Contrast Imaging, Rotterdam, the Netherlands, 21‐22 Jan 2016 (poster)
Tom van Rooij, Alexandre Lima, Verya Daeichin, Patricia A.C. Specht, Bulent Ergin, Yasin Ince, Can Ince, Nico de Jong, Klazina Kooiman. “Contrast‐enhanced ultrasound imaging of the renal cortex of pigs during hemorrhagic shock”, 21st European symposium on Ultrasound Contrast Imaging, Rotterdam, the Netherlands, 21‐22 Jan 2016 (oral) Guillaume Lajoinie, Ine De Cock, Heleen Dewitte, Ying Luan, Tom van Rooij, Erik Gelderblom, Mirjam Visscher, Klazina Kooiman, Benjamin Dollet, Ine Lentacker, Michel Versluis. “Multiscale high‐speed imaging to study complex behavior of ultrasound contrast agents”, 31st International Congress on High‐Speed Imaging and Photonics, Osaka, Japan, 7‐10 Nov 2015 (oral)
321

Conference presentations
Tom van Rooij, Alexandre Lima, Verya Daeichin, Patricia A.C. Specht, Bulent Ergin, Yasin Ince, Nico de Jong, Can Ince, Klazina Kooiman. “Feasibility of in vivo contrast‐enhanced ultrasound imaging of the renal cortex during hemorrhagic shock”, IEEE International Ultrasonics Symposium 2015, Taipei, Taiwan, 21‐24 Oct 2015 (poster) Klazina Kooiman, Tom van Rooij, Bin Qin, Frits Mastik, Hendrik J. Vos, Alexander L. Klibanov, Nico de Jong, Flordeliza S. Villanueva, Xucai Chen. “Fluorescence high‐speed microscopy reveals dynamic behavior of lipid coating on ultrasound contrast agents in an ultrasound field”, 3rd Phospholipids in Pharmaceutical Research Symposium 2015, Heidelberg, Germany, 21‐22 Sept 2015 (poster) Tom van Rooij, Alexandre Lima, Verya Daeichin, Patricia A.C. Specht, Bulent Ergin, Yasin Ince, Nico de Jong, Can Ince, Klazina Kooiman. “In vivo contrast enhanced ultrasound imaging of the renal cortex during hemorrhagic shock”, 30th Bubble Conference 2015, Chicago, Illinois, USA, 10‐12 Sept (oral) Tom van Rooij, Alexandre Lima, Verya Daeichin, Patricia A.C. Specht, Bulent Ergin, Yasin Ince, Nico de Jong, Can Ince, Klazina Kooiman. “In vivo contrast‐enhanced ultrasound imaging of the renal cortex during hemorrhagic shock”, 5th Microbubble Symposium 2015, Leeds, UK, 29‐30 June 2015 (oral) Klazina Kooiman, Tom van Rooij, Flordeliza S. Villanueva, Bin Qin, Frits Mastik, Hendrik J. Vos, Alexander L. Klibanov, Nico de Jong, Xucai Chen. “Lipid shell buckling during microbubble compression ‒ a fluorescence high‐speed camera study”, 5th Microbubble Symposium 2015, Leeds, UK, 29‐30 June 2015 (oral) Tom van Rooij, Antonius F.W. van der Steen, Nico de Jong, Klazina Kooiman. “Radial excursions of bound and non‐bound targeted lipid‐coated single microbubbles”, 169th meeting of the Acoustical Society of America, Pittsburgh, Pennsylvania, US, 18‐22 May 2015 (oral & poster) Tom van Rooij, Antonius F.W. van der Steen, Nico de Jong, Klazina Kooiman. “The influence of binding on the acoustical response of targeted microbubbles”, 15th International Symposium of Therapeutic Ultrasound, Utrecht, the Netherlands, 15‐18 April 2015 (oral) Tom van Rooij, Antonius F.W. van der Steen, Nico de Jong, Klazina Kooiman. “The influence of binding on the radial excursions of lipid‐coated microbubbles”, 20th European symposium on Ultrasound Contrast Imaging, Rotterdam, the Netherlands, 22‐23 Jan 2015 (poster) Klazina Kooiman, Tom van Rooij, Flordeliza S. Villanueva, Bin Qin, Frits Mastik, Hendrik J. Vos, Alexander L. Klibanov, Nico de Jong, Xucai Chen. “To buckle or not to buckle, that is the question ‒ a fluorescence high‐speed camera study”, 20th European symposium on Ultrasound Contrast Imaging, Rotterdam, the Netherlands, 22‐23 Jan 2015 (oral) Ilya Skachkov, Tom J.A. Kokhuis, Tom van Rooij, Ying Luan, Antonius F.W. van der Steen, Nico de Jong, Klazina Kooiman. “Correlating sonoporation dynamics to reversible and irreversible sonoporation”, 20th European symposium on Ultrasound Contrast Imaging, Rotterdam, the Netherlands, 22‐23 Jan 2015 (poster) Klazina Kooiman, Flordeliza S. Villanueva, Bin Qin, Tom van Rooij, Frits Mastik, Alexander L. Klibanov, Nico de Jong, Xucai Chen. “Unraveling lipid‐coating movements of oscillating microbubbles ‐ a fluorescence high‐speed optical study”, IEEE International Ultrasonics Symposium 2014, Chicago, Illinois, USA, 3‐6 Sept 2014 (oral) Tom van Rooij, Antonius F.W. van der Steen, Nico de Jong, Klazina Kooiman. “Influence of binding on the vibrational responses of targeted lipid‐coated microbubbles”, IEEE International Ultrasonics Symposium 2014, Chicago, Illinois, USA, 3‐6 Sept 2014 (oral)
Tom van Rooij, Antonius F.W. van der Steen, Nico de Jong, Klazina Kooiman. “Effects of binding on the acoustical dynamics of targeted lipid‐coated microbubbles”, 4th Microbubble Symposium 2014, Leeds, UK, 14‐15 July 2014 (poster)
322
Conference presentations
Klazina Kooiman, Flordeliza S. Villanueva, Bin Qin, Tom van Rooij, Frits Mastik, Alexander L. Klibanov, Nico de Jong, Xucai Chen. “Resolving lipid coating behavior using high‐speed fluorescence imaging”, 4th Microbubble Symposium 2014, Leeds, UK, 14‐15 July 2014 (oral) Tom van Rooij, Ying Luan, Guillaume Renaud, Antonius F.W. van der Steen, Nico de Jong, Klazina Kooiman. “Response to ultrasound of two types of lipid‐coated microbubbles observed with a high‐speed optical camera”, 167th meeting of the Acoustical Society of America, Providence, Rhode Island, US, 5‐9 May 2014 (oral & poster) Jason L. Raymond, Ying Luan, Tom van Rooij, Shao‐Ling Huang, David D. McPherson, Nico de Jong, Christy K. Holland. “Estimation of damping coefficient based on the impulse response of Echogenic Liposomes”, 167th meeting of the Acoustical Society of America, Providence, Rhode Island, US, 5‐9 May 2014 (oral & poster) Tom van Rooij, Ying Luan, Guillaume Renaud, Antonius F.W. van der Steen, Nico de Jong, Klazina Kooiman. “Influence of DSPC versus DPPC on acoustical responses of lipid‐coated microbubbles”, 19th European symposium on Ultrasound Contrast Imaging, Rotterdam, the Netherlands, 23‐24 Jan 2014 (poster) Klazina Kooiman, Flordeliza S. Villanueva, Bin Qin, Tom van Rooij, Frits Mastik, Alexander L. Klibanov, Nico de Jong, Xucai Chen. “Ultra‐fast lipid movement in the microbubble coating during oscillation ‒ a fluorescence high‐speed camera study”, 19th European symposium on Ultrasound Contrast Imaging, Rotterdam, the Netherlands, 23‐24 Jan 2014 (oral) Jason L. Raymond, Ying Luan, Tom van Rooij, Shao‐Ling Huang, David D. McPherson, Christy K. Holland, Nico de Jong. “Impulse response of Echogenic Liposomes”, 19th European symposium on Ultrasound Contrast Imaging, Rotterdam, the Netherlands, 23‐24 Jan 2014 (poster) Tom van Rooij, Ying Luan, Guillaume Renaud, Antonius F.W. van der Steen, Nico de Jong and Klazina Kooiman, “Influence of streptavidin functionalization on the acoustical response of DSPC and DPPC based ultrasound contrast agents”, NanoNextNL NanoMedicine day, Amsterdam, The Netherlands, 22 Nov 2013 (poster) Klazina Kooiman, Tom van Rooij, Tom J.A. Kokhuis, Ying Luan, Ilya Skachkov, Johannes G. Bosch, Antonius F.W. van der Steen, Wiggert A. van Cappellen, Nico de Jong. “DSPC versus DPPC lipid as coating for ultrasound contrast agents”, 3rd Phospholipids in Pharmaceutical Research Symposium 2013, Heidelberg, Germany, 16‐17 Sept 2013 (poster) Ying Luan, Guillaume Lajoinie, Erik Gelderblom, Ilya Skachkov, Heleen Dewitte, Ine Lentacker, Tom van Rooij, Hendrik Vos, Antonius F.W. van der Steen, Michel Versluis, Nico de Jong. “Liposome Shedding from a Vibrating Microbubble on Nanoseconds Timescale”, IEEE International Ultrasonics Symposium 2013, Prague, Czech Republic, 21‐25 July 2013 (oral) Tom van Rooij, Ying Luan, Guillaume Renaud, Antonius F.W. van der Steen, Nico de Jong, Klazina Kooiman. “Influence of streptavidin functionalization on the acoustical response of DSPC versus DPPC lipid‐coated microbubbles”, 3rd Microbubble symposium 2013, Leeds, UK, 17‐18 July 2013 (poster) Klazina Kooiman, Tom J.A. Kokhuis, Tom van Rooij, Ying Luan, Ilya Skachkov, Johannes G. Bosch, Antonius F.W. van der Steen, Wiggert A. van Cappellen, Nico de Jong. “The optimal lipid coating for therapeutic bubbles”, 18th European symposium on Ultrasound Contrast Imaging, Rotterdam, the Netherlands, 17‐18 Jan 2013 (oral) Alma M.A. Mingels, Tom van Rooij, Will K.W.H. Wodzig, Marja P. van Dieijen‐Visser. “What you see is not what you get: cardiac troponin T is completely degraded in serum of AMI patients”, Nationale Wetenschapsdag Klinische Chemie NVKC, Amersfoort, the Netherlands, 19 April 2012 (poster)
323
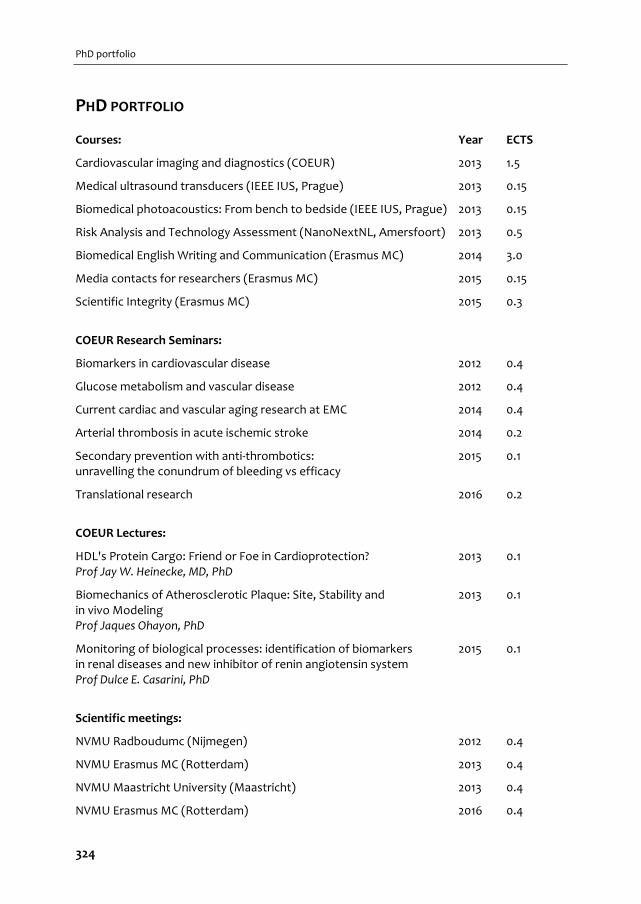
PhD portfolio
PHD PORTFOLIO Courses: Year ECTS
Cardiovascular imaging and diagnostics (COEUR) 2013 1.5
Medical ultrasound transducers (IEEE IUS, Prague) 2013 0.15
Biomedical photoacoustics: From bench to bedside (IEEE IUS, Prague) 2013 0.15
Risk Analysis and Technology Assessment (NanoNextNL, Amersfoort) 2013 0.5
Biomedical English Writing and Communication (Erasmus MC) 2014 3.0
Media contacts for researchers (Erasmus MC) 2015 0.15
Scientific Integrity (Erasmus MC) 2015 0.3
COEUR Research Seminars:
Biomarkers in cardiovascular disease 2012 0.4
Glucose metabolism and vascular disease 2012 0.4
Current cardiac and vascular aging research at EMC 2014 0.4
Arterial thrombosis in acute ischemic stroke 2014 0.2
Secondary prevention with anti‐thrombotics: 2015 0.1 unravelling the conundrum of bleeding vs efficacy
Translational research 2016 0.2
COEUR Lectures:
HDL's Protein Cargo: Friend or Foe in Cardioprotection? 2013 0.1 Prof Jay W. Heinecke, MD, PhD
Biomechanics of Atherosclerotic Plaque: Site, Stability and 2013 0.1 in vivo Modeling Prof Jaques Ohayon, PhD
Monitoring of biological processes: identification of biomarkers 2015 0.1 in renal diseases and new inhibitor of renin angiotensin system Prof Dulce E. Casarini, PhD
Scientific meetings:
NVMU Radboudumc (Nijmegen) 2012 0.4
NVMU Erasmus MC (Rotterdam) 2013 0.4
NVMU Maastricht University (Maastricht) 2013 0.4
NVMU Erasmus MC (Rotterdam) 2016 0.4
324
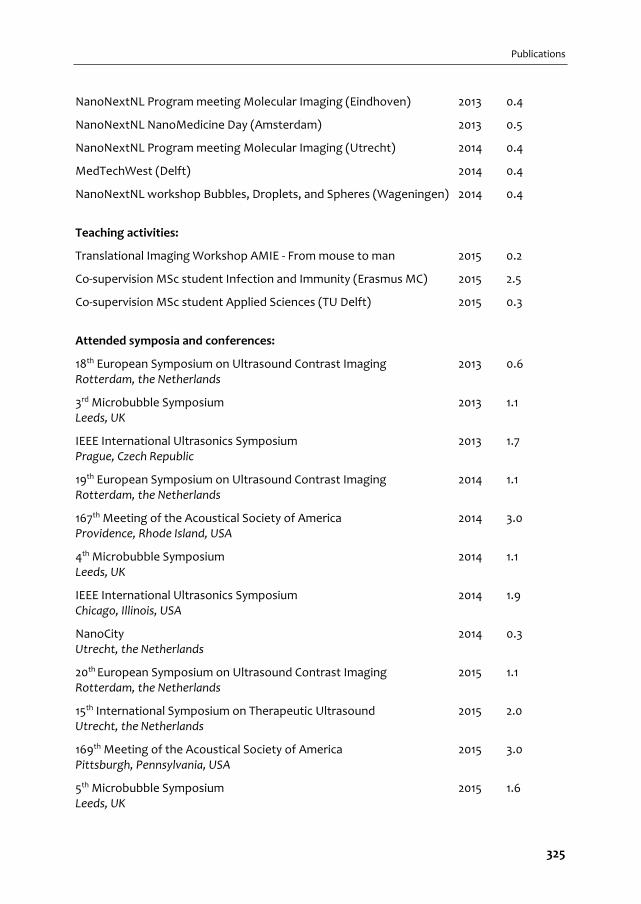
Publications
NanoNextNL Program meeting Molecular Imaging (Eindhoven) 2013 0.4
NanoNextNL NanoMedicine Day (Amsterdam) 2013 0.5
NanoNextNL Program meeting Molecular Imaging (Utrecht) 2014 0.4
MedTechWest (Delft) 2014 0.4
NanoNextNL workshop Bubbles, Droplets, and Spheres (Wageningen) 2014 0.4
Teaching activities:
Translational Imaging Workshop AMIE ‐ From mouse to man 2015 0.2
Co‐supervision MSc student Infection and Immunity (Erasmus MC) 2015 2.5
Co‐supervision MSc student Applied Sciences (TU Delft) 2015 0.3
Attended symposia and conferences:
18th European Symposium on Ultrasound Contrast Imaging 2013 0.6 Rotterdam, the Netherlands
3rd Microbubble Symposium 2013 1.1 Leeds, UK
IEEE International Ultrasonics Symposium 2013 1.7 Prague, Czech Republic
19th European Symposium on Ultrasound Contrast Imaging 2014 1.1 Rotterdam, the Netherlands
167th Meeting of the Acoustical Society of America 2014 3.0 Providence, Rhode Island, USA
4th Microbubble Symposium 2014 1.1 Leeds, UK
IEEE International Ultrasonics Symposium 2014 1.9 Chicago, Illinois, USA
NanoCity 2014 0.3 Utrecht, the Netherlands
20th European Symposium on Ultrasound Contrast Imaging 2015 1.1 Rotterdam, the Netherlands
15th International Symposium on Therapeutic Ultrasound 2015 2.0 Utrecht, the Netherlands
169th Meeting of the Acoustical Society of America 2015 3.0 Pittsburgh, Pennsylvania, USA
5th Microbubble Symposium 2015 1.6 Leeds, UK
325

PhD portfolio
NanoCity 2015 0.5 Amersfoort, the Netherlands
IEEE International Ultrasonics Symposium 2015 2.3 Taipei, Taiwan
21st European Symposium on Ultrasound Contrast Imaging 2016 2.1 Rotterdam, the Netherlands
326
Curriculum Vitae
CURRICULUM VITAE
Tom van Rooij was born in Eindhoven, the Netherlands, in 1987.
In 2005 he started his academic training at the Eindhoven
University of Technology (TU/e) and earned his BSc degree in
Biomedical Engineering in 2008. During his master Medical
Engineering (2009‐2012) at the same university he was an intern
at the Division of Imaging Sciences & Biomedical Engineering at
St Thomas’ Hospital in London, United Kingdom and performed
his thesis at the department of Clinical Chemistry of the
Maastricht University Medical Center (Maastricht, the
Netherlands). Before starting his PhD he held a teaching position
at the Biomedical NMR group, department of Biomedical
Engineering at the TU/e. In July 2012 he started a PhD project at
the department of Biomedical Engineering of the Thorax Center,
Erasmus MC, Rotterdam, the Netherlands. This project focused
on ultrasound imaging and therapy and characterization of
ultrasound contrast agents using ultra‐high‐speed optical
imaging techniques.
Tom van Rooij is in 1987 geboren te Eindhoven. Na het afronden
van de middelbare school is hij in 2005 begonnen met de
bacheloropleiding Biomedische Technologie aan de Technische
Universiteit Eindhoven (TU/e) en heeft daarvoor in 2008 zijn
diploma behaald. Na een fulltime bestuursjaar van
Studievereniging der BioMedische Technologie “Protagoras” is
hij in 2009 gestart met de opleiding Medical Engineering aan
dezelfde universiteit. Na een stage op de afdeling Imaging
Sciences & Biomedical Engineering van het St Thomas’ Hospital
in Londen (Verenigd Koninkrijk) is hij begonnen met zijn
afstudeeronderzoek in het Klinisch Chemisch Laboratorium van
het Maastricht Universitair Medisch Centrum. In 2012 heeft hij de
opleiding Medical Engineering succesvol afgerond. Na zijn
afstuderen heeft hij drie maanden als assistent‐docent gewerkt
voor de vakgroep Biomedical NMR van de TU/e om in juli 2012 te
starten met zijn promotieonderzoek in het Erasmus MC in
Rotterdam, op de afdeling Biomedische Technologie. Dit
onderzoek richtte zich op ultrasound contrastmiddelen voor
beeldvorming en therapie van in vitro tot in vivo toepassingen,
waarvan u hier het resultaat voor u ziet.
327

328