Correlation analysis in laser welding plasma
10
Correlation analysis in laser welding plasma T. Sibillano, A. Ancona, V. Berardi * , P.M. Lugara ` INFM-LIT 3 -Laboratorio Regionale di Ricerca, Formazione, Sviluppo e Trasferimento alle Imprese di Tecnologie Laser Innovative, Italy Dipartimento Interuniversitario di Fisica-Universita ` e Politecnico di Bari via Orabona 4, I-70126 Bari, Italy Received 11 October 2004; received in revised form 23 January 2005; accepted 21 February 2005 Abstract During the process of high power laser welding the interaction between laser beam and workpiece produces a plasma bunch, named plume which is ejected from the surface of the welded material. The efficiency of the welding process and the quality of the welded seams are influenced by the plasma plume which plays a fundamental role in coupling the incident radiation to the material. The aim of this work is to present an optical non-invasive spectroscopic approach for the investigation of plasma plume dynamics. In particular, we present data on optical spectroscopy of the plume produced during laser welding of aluminum–magnesium alloys of industrial interest. The dynamics of the plume during laser welding is investigated by performing a correlation analysis of the optical spectra (covariance mapping technique). Ó 2005 Elsevier B.V. All rights reserved. PACS: 81.20Vj; 52.50Jm; 52.38.Mf Keywords: Laser welding; Optical spectroscopy; Correlation analysis; Aluminum alloys 1. Introduction Because of its advantages over other joining techniques, laser welding is one of the most impor- tant manufacturing processes particularly in the automotive industry. Nevertheless laser-material interaction is very complex and the correlation between the various parameters characterizing the process is still not fully understood. Setting up a reliable procedure to obtain welds of acceptable quality is often a challenging prob- lem. Therefore there is a growing interest in devel- oping procedures for real-time monitoring of the weld quality by investigating the plasma plume produced in the laser-material interaction. It is well known that chemical composition, spatial and thermal characteristics of the plasma plume are related to the welding conditions and keyhole 0030-4018/$ - see front matter Ó 2005 Elsevier B.V. All rights reserved. doi:10.1016/j.optcom.2005.02.076 * Corresponding author. Tel.: +39 080 5442363; fax: +39 080 5442434. E-mail address: [email protected] (V. Berardi). Optics Communications 251 (2005) 139–148 www.elsevier.com/locate/optcom
Transcript of Correlation analysis in laser welding plasma

Optics Communications 251 (2005) 139–148
www.elsevier.com/locate/optcom
Correlation analysis in laser welding plasma
T. Sibillano, A. Ancona, V. Berardi *, P.M. Lugara
INFM-LIT3-Laboratorio Regionale di Ricerca, Formazione, Sviluppo e Trasferimento alle Imprese di Tecnologie Laser Innovative, Italy
Dipartimento Interuniversitario di Fisica-Universita e Politecnico di Bari via Orabona 4, I-70126 Bari, Italy
Received 11 October 2004; received in revised form 23 January 2005; accepted 21 February 2005
Abstract
During the process of high power laser welding the interaction between laser beam and workpiece produces a plasma
bunch, named plume which is ejected from the surface of the welded material. The efficiency of the welding process and
the quality of the welded seams are influenced by the plasma plume which plays a fundamental role in coupling the
incident radiation to the material. The aim of this work is to present an optical non-invasive spectroscopic approach
for the investigation of plasma plume dynamics. In particular, we present data on optical spectroscopy of the plume
produced during laser welding of aluminum–magnesium alloys of industrial interest. The dynamics of the plume during
laser welding is investigated by performing a correlation analysis of the optical spectra (covariance mapping technique).
� 2005 Elsevier B.V. All rights reserved.
PACS: 81.20Vj; 52.50Jm; 52.38.Mf
Keywords: Laser welding; Optical spectroscopy; Correlation analysis; Aluminum alloys
1. Introduction
Because of its advantages over other joining
techniques, laser welding is one of the most impor-
tant manufacturing processes particularly in theautomotive industry. Nevertheless laser-material
interaction is very complex and the correlation
0030-4018/$ - see front matter � 2005 Elsevier B.V. All rights reserv
doi:10.1016/j.optcom.2005.02.076
* Corresponding author. Tel.: +39 080 5442363; fax: +39 080
5442434.
E-mail address: [email protected] (V. Berardi).
between the various parameters characterizing
the process is still not fully understood.
Setting up a reliable procedure to obtain welds
of acceptable quality is often a challenging prob-
lem. Therefore there is a growing interest in devel-oping procedures for real-time monitoring of the
weld quality by investigating the plasma plume
produced in the laser-material interaction. It is
well known that chemical composition, spatial
and thermal characteristics of the plasma plume
are related to the welding conditions and keyhole
ed.
140 T. Sibillano et al. / Optics Communications 251 (2005) 139–148
shape. And in turn almost every change of a
welding process parameter has a certain, though
in some cases ambiguous, influence on the plasma
plume dynamics. Thus, studying the plume
dynamics turns out to be very useful to improveand monitor the weld quality. In fact plasma
dynamics can affect the energy transport from
the laser beam to the work-piece and modify the
amount and distribution of energy on the target
surface [1–3]. Several efforts have been devoted
to develop reliable, non-intrusive sensors [4,5].
Most of commercially available process monitor-
ing devices are simple threshold-type sensing sys-tems, detecting audible sound or infrared and
ultraviolet emission [6]. Using fuzzy logic or neural
networks recognition algorithms, early works on
photodiode based sensors identified several weld
states with peculiar optical and/or acoustic ampli-
tude patterns [7,8]. A different promising approach
consists of analysing the visible radiation emitted
by the plasma plume, and several works, basedon in-process plasma spectroscopy at high acquisi-
tion rate, found a correlation between some of the
spectral features, e.g., intensities of selected lines
acquired either integrating or spatially resolving
the plasma plume emission, and the formation
dynamics of weld defects like blow-holes [9–11].
In our previous works, we performed several
studies on the spectroscopy of plasma plume eitherby evaluating in real time the welding plasma elec-
tron temperature [12] or by analysing the oscilla-
tion frequencies of the integrated optical
radiation as a function of operating conditions
[13].
In this paper, we present preliminary results on
a new kind of spectroscopic approach for the
investigation of plasma plume characteristics bymeans of the covariance mapping technique
(CMT), previously successfully applied to the
study of time-of-flight (TOF) mass spectra ob-
tained from laser surface interaction in YBCO
samples [14,15]. We applied this technique to
optical spectra in order to understand the rela-
tionship between spectroscopic plasma parame-
ters and welds quality. In particular, CMTallows to identify correlation and anti-correlation
between lines belonging to different chemical spe-
cies, thus giving information on the dynamics of
the welding plasma under different operating
conditions.
2. Experimental
The welding tests were carried out by using a
CO2 laser (Rofin Sinar mod. DC025) with maxi-
mum output power of 2.5 kW in continuous wave
regime. The beam diameter is 25 mm and the
divergence is 0.5 mrad. The laser beam is then fo-
cused on the work-piece by a 200 mm focal length
water-cooled parabolic mirror. The laser source iscoupled to full-automated robotic cell (Ravasi LC
1000).
We investigated the AA6082 aluminum alloy
belonging to Al–Si–Mg group (composition in
mass percent: Al: 96; Si: 0.70–1.30; Mg: 0.6–1.2;
Mn: 0.40–1.00; Cu: 0.10; Zn: 0.20; Fe: 0.50; Ti:
0.10; Cr: 0.25; other: 0.15). To prevent possible
back reflection of the incident power on laser op-tics, the samples were positioned on a tilting table,
with an inclination angle of 10� with respect to the
beam axis.
The plasma optical emission was collected by a
quartz collimator of 6 mm focal length. The col-
lected light was transmitted to a PC interfaced
miniature spectrometer by an 8 lm core-diameter
optical fibre. The spectral range investigated was550–800 nm, with an optical resolution of
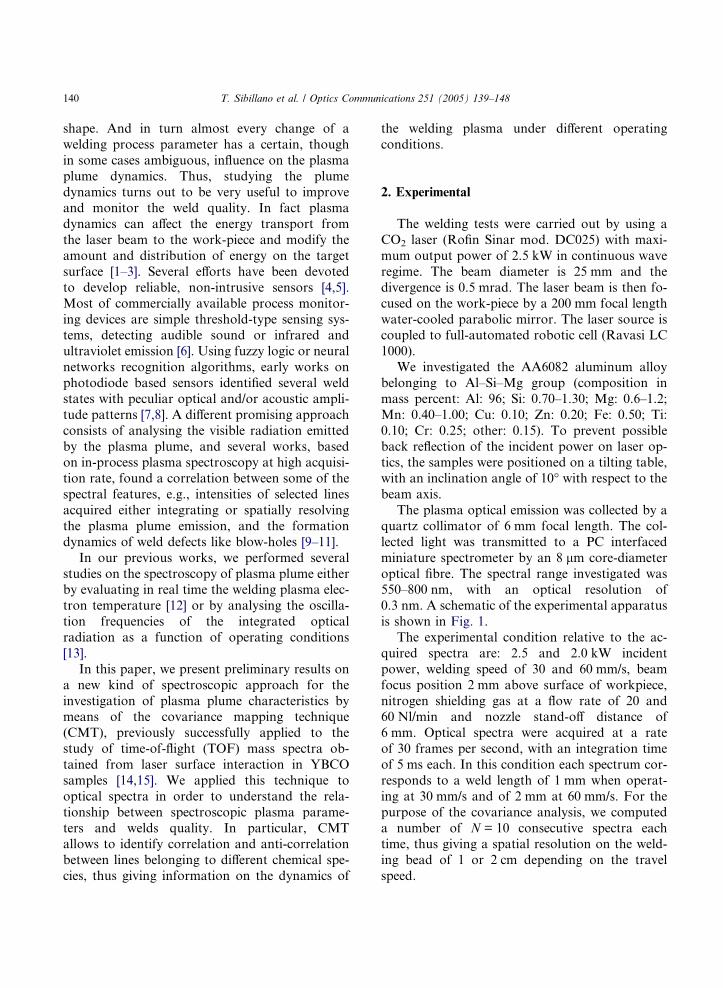
0.3 nm. A schematic of the experimental apparatus
is shown in Fig. 1.
The experimental condition relative to the ac-
quired spectra are: 2.5 and 2.0 kW incident
power, welding speed of 30 and 60 mm/s, beam
focus position 2 mm above surface of workpiece,
nitrogen shielding gas at a flow rate of 20 and60 Nl/min and nozzle stand-off distance of
6 mm. Optical spectra were acquired at a rate
of 30 frames per second, with an integration time
of 5 ms each. In this condition each spectrum cor-
responds to a weld length of 1 mm when operat-
ing at 30 mm/s and of 2 mm at 60 mm/s. For the
purpose of the covariance analysis, we computed
a number of N = 10 consecutive spectra eachtime, thus giving a spatial resolution on the weld-
ing bead of 1 or 2 cm depending on the travel
speed.
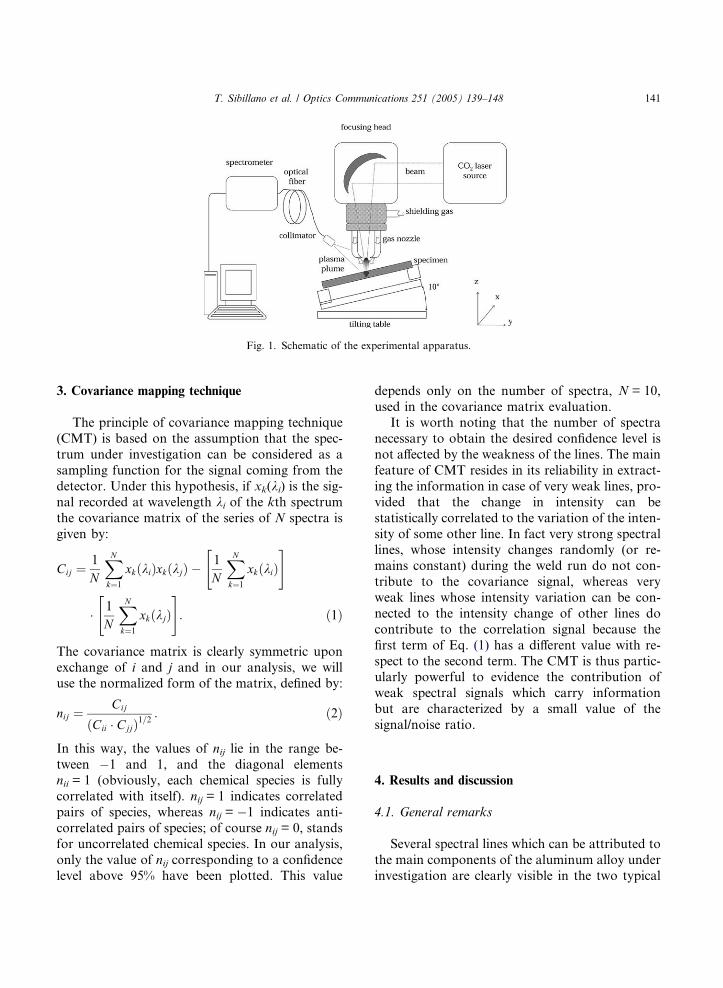
Fig. 1. Schematic of the experimental apparatus.
T. Sibillano et al. / Optics Communications 251 (2005) 139–148 141
3. Covariance mapping technique
The principle of covariance mapping technique
(CMT) is based on the assumption that the spec-
trum under investigation can be considered as a
sampling function for the signal coming from the
detector. Under this hypothesis, if xk(ki) is the sig-nal recorded at wavelength ki of the kth spectrum
the covariance matrix of the series of N spectra is
given by:
Cij ¼1
N
XNk¼1
xkðkiÞxkðkjÞ �1
N
XNk¼1
xkðkiÞ" #
� 1
N
XNk¼1
xkðkjÞ" #
: ð1Þ
The covariance matrix is clearly symmetric upon
exchange of i and j and in our analysis, we willuse the normalized form of the matrix, defined by:
nij ¼Cij
ðCii � CjjÞ1=2: ð2Þ
In this way, the values of nij lie in the range be-
tween �1 and 1, and the diagonal elementsnii = 1 (obviously, each chemical species is fully
correlated with itself). nij = 1 indicates correlated
pairs of species, whereas nij = �1 indicates anti-
correlated pairs of species; of course nij = 0, stands
for uncorrelated chemical species. In our analysis,
only the value of nij corresponding to a confidence
level above 95% have been plotted. This value
depends only on the number of spectra, N = 10,
used in the covariance matrix evaluation.It is worth noting that the number of spectra
necessary to obtain the desired confidence level is
not affected by the weakness of the lines. The main
feature of CMT resides in its reliability in extract-
ing the information in case of very weak lines, pro-
vided that the change in intensity can be
statistically correlated to the variation of the inten-
sity of some other line. In fact very strong spectrallines, whose intensity changes randomly (or re-
mains constant) during the weld run do not con-
tribute to the covariance signal, whereas very
weak lines whose intensity variation can be con-
nected to the intensity change of other lines do
contribute to the correlation signal because the
first term of Eq. (1) has a different value with re-
spect to the second term. The CMT is thus partic-ularly powerful to evidence the contribution of
weak spectral signals which carry information
but are characterized by a small value of the
signal/noise ratio.
4. Results and discussion
4.1. General remarks
Several spectral lines which can be attributed to
the main components of the aluminum alloy under
investigation are clearly visible in the two typical
600 650 700 750 8000
500
1000
1500
2000
Fe(I
) 74
7.64
Al(
II)
624.
34
Fe(I
) 60
2.40
Al(
III)
572
.28
Al(
III)
569
.66
Gas flow rate =60 Nl/minGas flow rate =20 Nl/min
Inte
nsity
(a.
u.)
Wavelength (nm)
Al(
I) 6
69.8
7
Al(
II)
683.
71A
l(II
) 69
2.03
Al(
II)
704.
21
Al(
II)
706.
21
Mg(
I) 7
65.6
6
O(I
) 78
9.25
O(I
) 79
2.35
Al(
II)
559.
33
Fig. 2. Optical spectra for two different values of gas flow rate. The roman number in brackets indicates the ionisation state of the
chemical species: (I) neutral species; (II) single ion; (III) double ion.
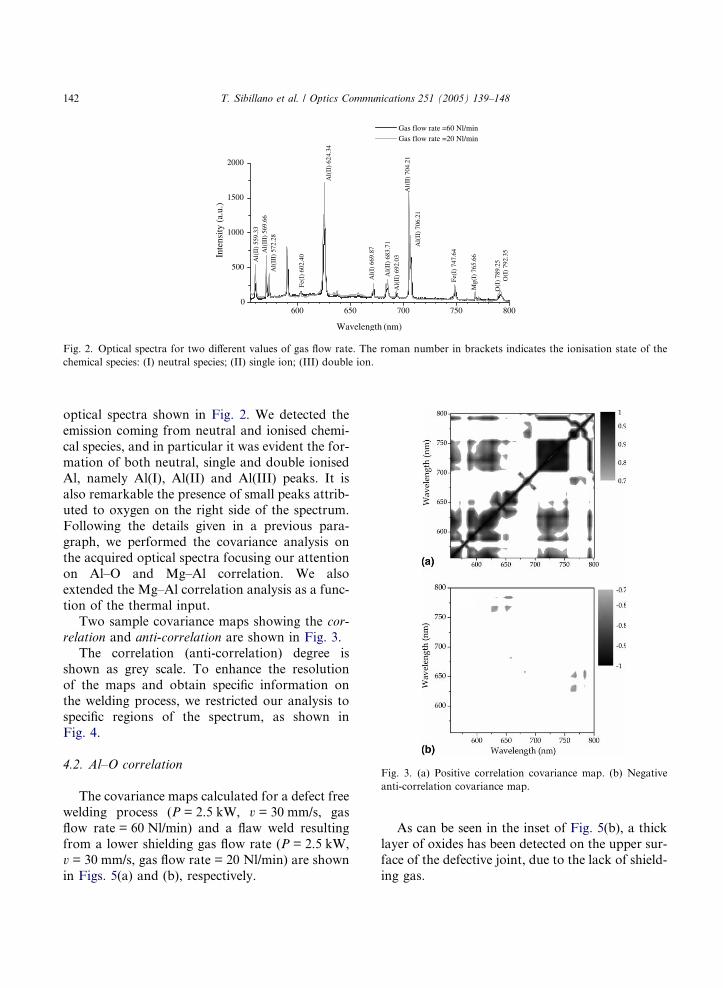
Fig. 3. (a) Positive correlation covariance map. (b) Negative
anti-correlation covariance map.
142 T. Sibillano et al. / Optics Communications 251 (2005) 139–148
optical spectra shown in Fig. 2. We detected the
emission coming from neutral and ionised chemi-
cal species, and in particular it was evident the for-
mation of both neutral, single and double ionised
Al, namely Al(I), Al(II) and Al(III) peaks. It is
also remarkable the presence of small peaks attrib-uted to oxygen on the right side of the spectrum.
Following the details given in a previous para-
graph, we performed the covariance analysis on
the acquired optical spectra focusing our attention
on Al–O and Mg–Al correlation. We also
extended the Mg–Al correlation analysis as a func-
tion of the thermal input.
Two sample covariance maps showing the cor-
relation and anti-correlation are shown in Fig. 3.
The correlation (anti-correlation) degree is
shown as grey scale. To enhance the resolution
of the maps and obtain specific information on
the welding process, we restricted our analysis to
specific regions of the spectrum, as shown in
Fig. 4.
4.2. Al–O correlation
The covariance maps calculated for a defect free
welding process (P = 2.5 kW, v = 30 mm/s, gas
flow rate = 60 Nl/min) and a flaw weld resulting
from a lower shielding gas flow rate (P = 2.5 kW,
v = 30 mm/s, gas flow rate = 20 Nl/min) are shown
in Figs. 5(a) and (b), respectively.
As can be seen in the inset of Fig. 5(b), a thick
layer of oxides has been detected on the upper sur-
face of the defective joint, due to the lack of shield-
ing gas.
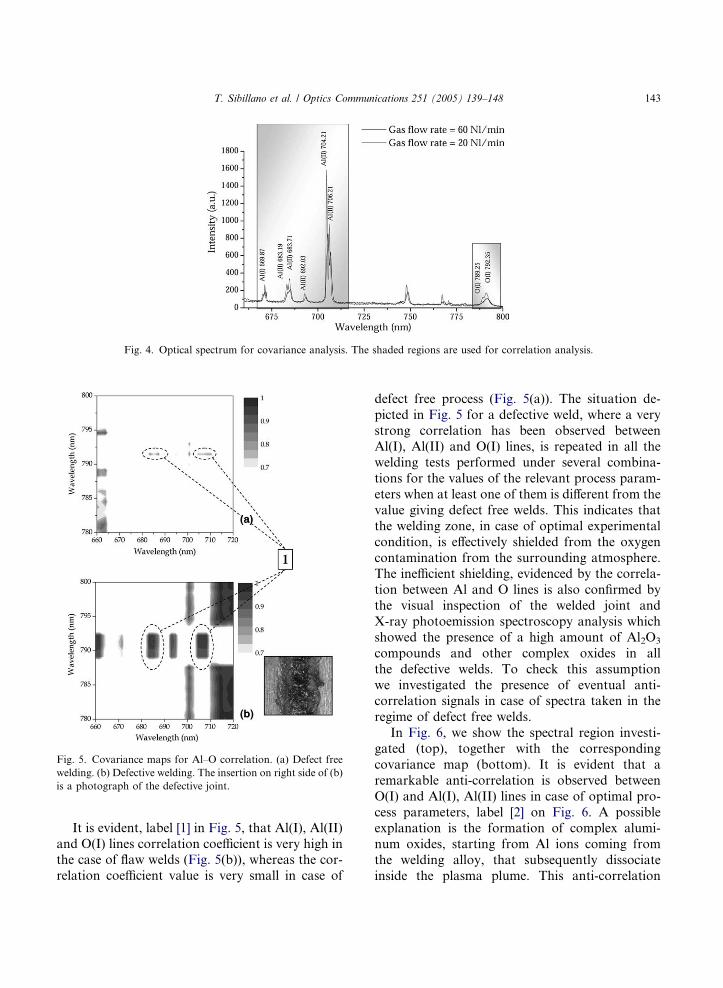
Fig. 4. Optical spectrum for covariance analysis. The shaded regions are used for correlation analysis.
Fig. 5. Covariance maps for Al–O correlation. (a) Defect free
welding. (b) Defective welding. The insertion on right side of (b)
is a photograph of the defective joint.
T. Sibillano et al. / Optics Communications 251 (2005) 139–148 143
It is evident, label [1] in Fig. 5, that Al(I), Al(II)
and O(I) lines correlation coefficient is very high inthe case of flaw welds (Fig. 5(b)), whereas the cor-
relation coefficient value is very small in case of
defect free process (Fig. 5(a)). The situation de-
picted in Fig. 5 for a defective weld, where a very
strong correlation has been observed betweenAl(I), Al(II) and O(I) lines, is repeated in all the
welding tests performed under several combina-
tions for the values of the relevant process param-
eters when at least one of them is different from the
value giving defect free welds. This indicates that
the welding zone, in case of optimal experimental
condition, is effectively shielded from the oxygen
contamination from the surrounding atmosphere.The inefficient shielding, evidenced by the correla-
tion between Al and O lines is also confirmed by
the visual inspection of the welded joint and
X-ray photoemission spectroscopy analysis which
showed the presence of a high amount of Al2O3
compounds and other complex oxides in all
the defective welds. To check this assumption
we investigated the presence of eventual anti-correlation signals in case of spectra taken in the
regime of defect free welds.
In Fig. 6, we show the spectral region investi-
gated (top), together with the corresponding
covariance map (bottom). It is evident that a
remarkable anti-correlation is observed between
O(I) and Al(I), Al(II) lines in case of optimal pro-
cess parameters, label [2] on Fig. 6. A possibleexplanation is the formation of complex alumi-
num oxides, starting from Al ions coming from
the welding alloy, that subsequently dissociate
inside the plasma plume. This anti-correlation
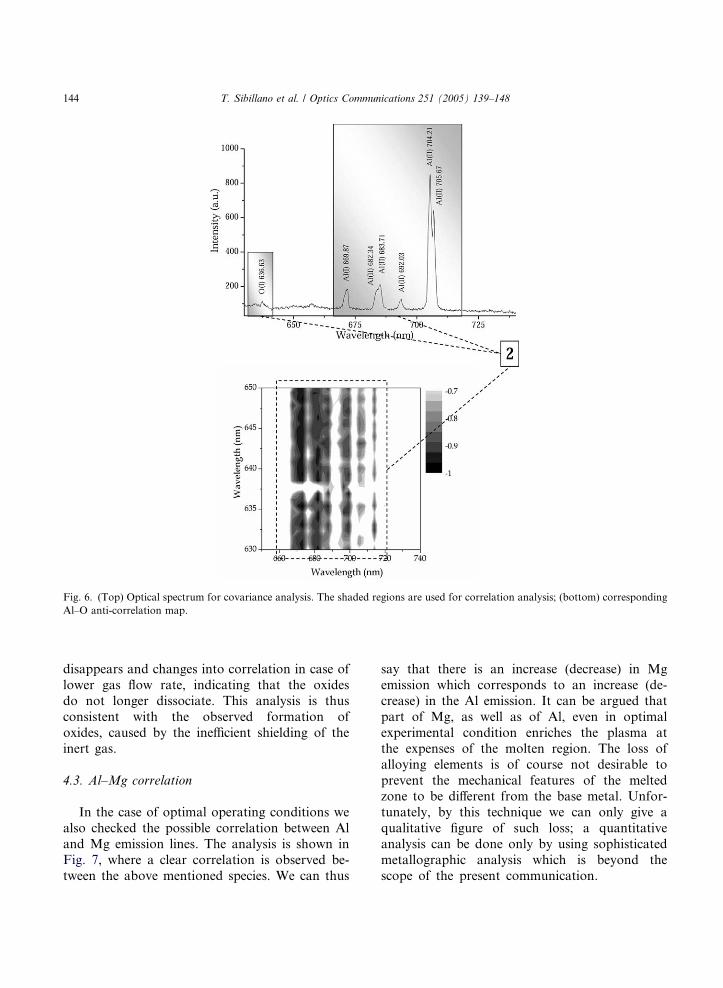
Fig. 6. (Top) Optical spectrum for covariance analysis. The shaded regions are used for correlation analysis; (bottom) corresponding
Al–O anti-correlation map.
144 T. Sibillano et al. / Optics Communications 251 (2005) 139–148
disappears and changes into correlation in case of
lower gas flow rate, indicating that the oxides
do not longer dissociate. This analysis is thus
consistent with the observed formation of
oxides, caused by the inefficient shielding of the
inert gas.
4.3. Al–Mg correlation
In the case of optimal operating conditions we
also checked the possible correlation between Al
and Mg emission lines. The analysis is shown in
Fig. 7, where a clear correlation is observed be-
tween the above mentioned species. We can thus
say that there is an increase (decrease) in Mg
emission which corresponds to an increase (de-
crease) in the Al emission. It can be argued that
part of Mg, as well as of Al, even in optimal
experimental condition enriches the plasma at
the expenses of the molten region. The loss of
alloying elements is of course not desirable to
prevent the mechanical features of the meltedzone to be different from the base metal. Unfor-
tunately, by this technique we can only give a
qualitative figure of such loss; a quantitative
analysis can be done only by using sophisticated
metallographic analysis which is beyond the
scope of the present communication.
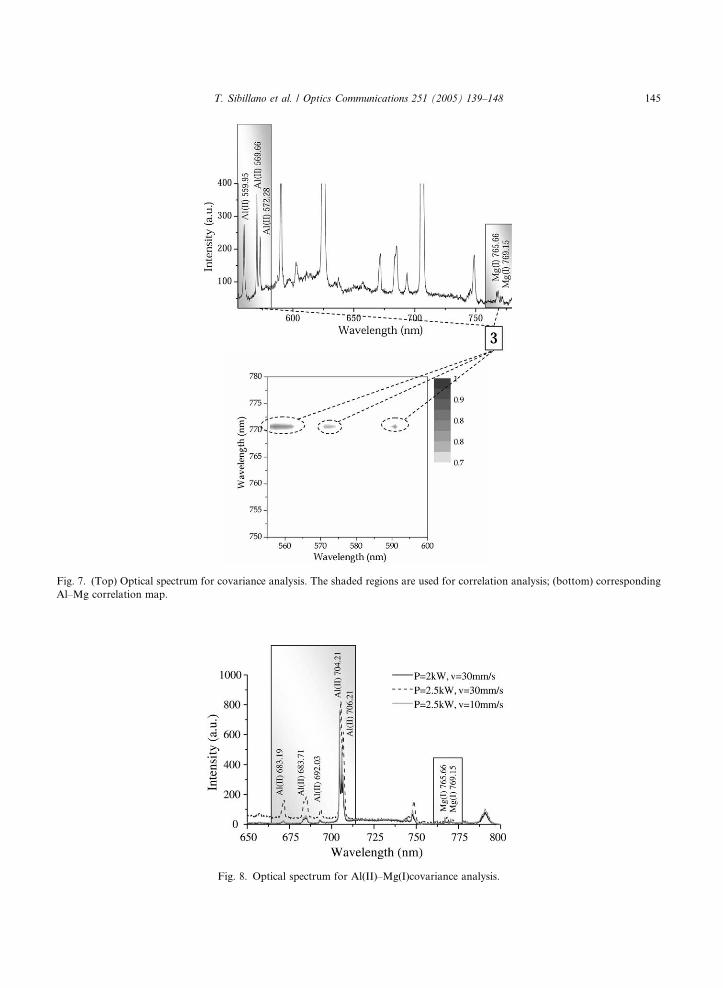
Fig. 7. (Top) Optical spectrum for covariance analysis. The shaded regions are used for correlation analysis; (bottom) corresponding
Al–Mg correlation map.
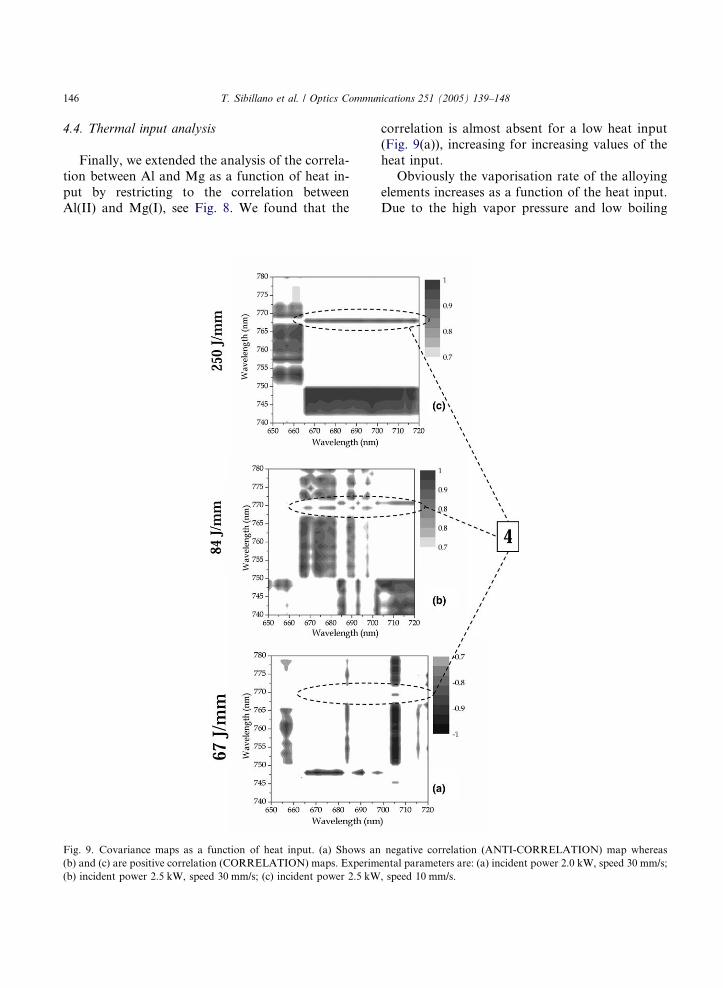
Fig. 8. Optical spectrum for Al(II)–Mg(I)covariance analysis.
T. Sibillano et al. / Optics Communications 251 (2005) 139–148 145
146 T. Sibillano et al. / Optics Communications 251 (2005) 139–148
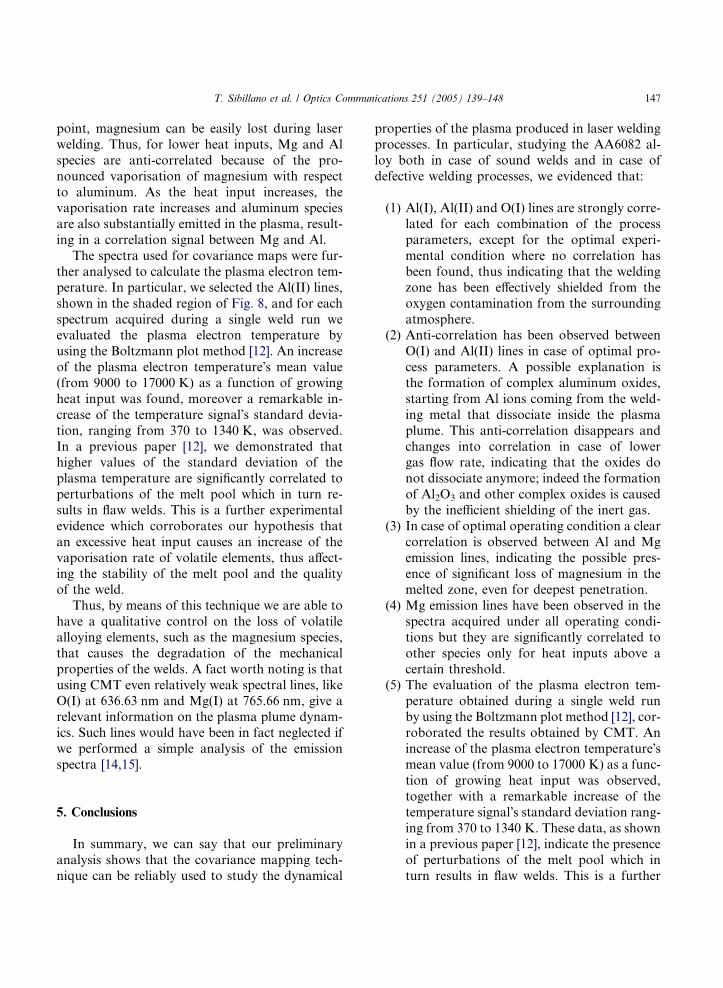
4.4. Thermal input analysis
Finally, we extended the analysis of the correla-
tion between Al and Mg as a function of heat in-
put by restricting to the correlation betweenAl(II) and Mg(I), see Fig. 8. We found that the
Fig. 9. Covariance maps as a function of heat input. (a) Shows an
(b) and (c) are positive correlation (CORRELATION) maps. Experim
(b) incident power 2.5 kW, speed 30 mm/s; (c) incident power 2.5 kW
correlation is almost absent for a low heat input
(Fig. 9(a)), increasing for increasing values of the
heat input.
Obviously the vaporisation rate of the alloying
elements increases as a function of the heat input.Due to the high vapor pressure and low boiling
negative correlation (ANTI-CORRELATION) map whereas
ental parameters are: (a) incident power 2.0 kW, speed 30 mm/s;
, speed 10 mm/s.
T. Sibillano et al. / Optics Communications 251 (2005) 139–148 147
point, magnesium can be easily lost during laser
welding. Thus, for lower heat inputs, Mg and Al
species are anti-correlated because of the pro-
nounced vaporisation of magnesium with respect
to aluminum. As the heat input increases, thevaporisation rate increases and aluminum species
are also substantially emitted in the plasma, result-
ing in a correlation signal between Mg and Al.
The spectra used for covariance maps were fur-
ther analysed to calculate the plasma electron tem-
perature. In particular, we selected the Al(II) lines,
shown in the shaded region of Fig. 8, and for each
spectrum acquired during a single weld run weevaluated the plasma electron temperature by
using the Boltzmann plot method [12]. An increase
of the plasma electron temperature�s mean value
(from 9000 to 17000 K) as a function of growing
heat input was found, moreover a remarkable in-
crease of the temperature signal�s standard devia-
tion, ranging from 370 to 1340 K, was observed.
In a previous paper [12], we demonstrated thathigher values of the standard deviation of the
plasma temperature are significantly correlated to
perturbations of the melt pool which in turn re-
sults in flaw welds. This is a further experimental
evidence which corroborates our hypothesis that
an excessive heat input causes an increase of the
vaporisation rate of volatile elements, thus affect-
ing the stability of the melt pool and the qualityof the weld.
Thus, by means of this technique we are able to
have a qualitative control on the loss of volatile
alloying elements, such as the magnesium species,
that causes the degradation of the mechanical
properties of the welds. A fact worth noting is that
using CMT even relatively weak spectral lines, like
O(I) at 636.63 nm and Mg(I) at 765.66 nm, give arelevant information on the plasma plume dynam-
ics. Such lines would have been in fact neglected if
we performed a simple analysis of the emission
spectra [14,15].
5. Conclusions
In summary, we can say that our preliminary
analysis shows that the covariance mapping tech-
nique can be reliably used to study the dynamical
properties of the plasma produced in laser welding
processes. In particular, studying the AA6082 al-
loy both in case of sound welds and in case of
defective welding processes, we evidenced that:
(1) Al(I), Al(II) and O(I) lines are strongly corre-
lated for each combination of the process
parameters, except for the optimal experi-
mental condition where no correlation has
been found, thus indicating that the welding
zone has been effectively shielded from the
oxygen contamination from the surrounding
atmosphere.(2) Anti-correlation has been observed between
O(I) and Al(II) lines in case of optimal pro-
cess parameters. A possible explanation is
the formation of complex aluminum oxides,
starting from Al ions coming from the weld-
ing metal that dissociate inside the plasma
plume. This anti-correlation disappears and
changes into correlation in case of lowergas flow rate, indicating that the oxides do
not dissociate anymore; indeed the formation
of Al2O3 and other complex oxides is caused
by the inefficient shielding of the inert gas.
(3) In case of optimal operating condition a clear
correlation is observed between Al and Mg
emission lines, indicating the possible pres-
ence of significant loss of magnesium in themelted zone, even for deepest penetration.
(4) Mg emission lines have been observed in the
spectra acquired under all operating condi-
tions but they are significantly correlated to
other species only for heat inputs above a
certain threshold.
(5) The evaluation of the plasma electron tem-
perature obtained during a single weld runby using the Boltzmann plot method [12], cor-
roborated the results obtained by CMT. An
increase of the plasma electron temperature�smean value (from 9000 to 17000 K) as a func-
tion of growing heat input was observed,
together with a remarkable increase of the
temperature signal�s standard deviation rang-
ing from 370 to 1340 K. These data, as shownin a previous paper [12], indicate the presence
of perturbations of the melt pool which in
turn results in flaw welds. This is a further
148 T. Sibillano et al. / Optics Communications 251 (2005) 139–148
experimental evidence that an excessive heat
input causes an increase of the vaporisation
rate of volatile elements, thus affecting the
stability of the melt pool and the quality of
the weld.
Acknowledgments
We gratefully acknowledge Dr. Nicola Cioffi of
CIS-Centro Interdipartimentale Spettroscopie,
Universita di Bari, for the XPS analysis of the
welded joints. We also acknowledge M. Roblesfor useful suggestions.
References
[1] V.V. Semak, R.J. Steele, P.W. Fuerschbach, B.K. Damkr-
oger, J. Phys. D: Appl. Phys. 33 (2000) 1179.
[2] M. Beck, P. Berger, H. Hugel, J. Phys. D: Appl. Phys. 28
(1995) 2430.
[3] J. Dowden, P. Kapadia, N. Postacioglu, J. Phys. D: Appl.
Phys. 22 (1989) 741.
[4] L. Li, D.J. Brookfield, W.M. Steen, Meas. Sci. Technol. 7
(1996) 615.
[5] J. Berrsiek, R. Proprawe, W. Schulz, H. Gu, R.E. Muller,
W.W. Duley, On-line monitoring of penetration depth in
laser beam welding, in: P. Christiansen, P. Denney, I.
Miyamoto, K. Watkins (Eds.), Laser Materials Processing,
Proceedings of the 18th International Congress on Appli-
cations of Lasers and Electro-optics, Sec. D, Laser Institute
of America, San Diego, CA, 1999, p. 49.
[6] Jurca Optoelektronik GmbH, model LWM900.
[7] H. Park, S. Rhee, D. Kim, Meas. Sci. Technol. 12 (2001)
1318.
[8] A. Sun, E. Kannatey-Asibu, M. Gartner, J. Las. Appl. 14
(2002) 114.
[9] S. Palanco, M. Klassen, J. Skupin, K. Hansen, E. Schubert,
G. Sepold, J.J. Laserna, Spectrochim. Acta Part B 56
(2001) 651.
[10] Z. Szymanski, J. Kurzyna, W. Kalita, J. Phys. D: Appl.
Phys. 30 (1997) 3153.
[11] M. Schellhorn, A. Eichhorn, Opt. Laser Technol. 28 (1996)
405.
[12] A. Ancona, V. Spagnolo, P.M. Lugara, M. Ferrara, Appl.
Opt. 40 (2001) 6019.
[13] A. Ancona, T. Sibillano, T. Maggipinto, F. Ottonelli,
P.M. Lugara, in: M. De Palma, P.M. Lugara, S. Nuzzo,
L. Torsi (Eds.), The Proceedings of the International
Workshop on Detecting Environmental, Industrial and
Biomedical Signals, World Scientific Printers, 2003, pp. 41–
59.
[14] V. Berardi, N. Spinelli, R. Velotta, M. Armenante, F.
Fuso, M. Allegrini, E. Arimondo, Phys. Lett. A 179 (1993)
116.
[15] S. Amoruso, V. Berardi, N. Spinelli, M. Armenante, R.
Velotta, F. Fuso, M. Allegrini, E. Arimondo, Appl. Surf.
Sci. 86 (1995) 35.