INTERPRETATION OF ECHO SOUNDING PROFILES
59
INTERPRETATION OF ECHO SOUNDING PROFILES by Dale C. K rause IHB Note. — Dale C. K rause was born in Wichita, Kansas on 27 December 1929. After obtaining a B. S. degree in geology at the California Institute of Technology in 1952, he went to Peru as a mining geologist with the Cerro de Pasco Corporation. He served as a surveyor with the Corps of Engineers, U. S. Army from 1954 to 1956. He obtained his M. S. degree in 1957 and his Ph. D. in 1961 at the Scripps Institution of Oceanography, University of California. He is presently engaged in geologic and bathymetric research at the New Zealand Oceanographic Institute. ABSTRACT Modern echo sounders and detailed bathymetric surveying have dem- onstrated the need for the theoretical treatment of echo traces that would be expected from geometrical features on the sea flor, thereby giving an insight into the interpretation of the true feature. The two basic features that govern the interpretation are (1) the relationship of the true and recorded sea floor slopes, respectively tan 0 and tan ç, shown by P. de V anssay de B lavous (1933) : sin 9 = tan ç and (2) that any sharp projection above the sea floor gives a hyperbolic echo trace (H offman , 1957). Using these principles, the following figures are examined mathematically, both two-dimensionally and three-dimen- sionally as being representative of possible features on the sea floor : in- clined plane, cone, hemisphere, hyperbola, and parabola. A semi-ellipse was analyzed two-dimensionally. Some depressions were analyzed also. In all except the parabola, hyperbolic echo traces were prominent, differing by differing constants. The parabola and the semi-ellipse also gave parabolic echo traces. Other features were examined but found to have echo traces with complex characters. Three complicating factors were examined. (1) The motion effect — the effect of the forward motion of the ship whereby the echo is not received where the sound pulse was emitted; (2) the correction due to sound velocity variation in the sea; and (3) the effect of the refraction of the sound ray due to the sound velocity variation. The first and last factors are shown to be negligible in general. Tables exist to correct for the second factor.
-
Upload
khangminh22 -
Category
Documents
-
view
0 -
download
0
Transcript of INTERPRETATION OF ECHO SOUNDING PROFILES

INTERPRETATION OF ECHO SOUNDING PROFILES
byDale C. K r a u s e
IHB Note. — Dale C. K r a u s e was born in Wichita, Kansas on 27 December 1929. After obtaining a B. S. degree in geology at the California Institute of Technology in 1952, he went to Peru as a mining geologist with the Cerro de Pasco Corporation. He served as a surveyor with the Corps of Engineers, U. S. Army from 1954 to 1956. He obtained his M. S. degree in 1957 and his Ph. D. in 1961 at the Scripps Institution of Oceanography, University of California. He is presently engaged in geologic and bathymetric research at the New Zealand Oceanographic Institute.
ABSTRACT
Modern echo sounders and detailed bathymetric surveying have demonstrated the need for the theoretical treatment of echo traces that would be expected from geometrical features on the sea flor, thereby giving an insight into the interpretation of the true feature. The two basic features that govern the interpretation are (1) the relationship of the true and recorded sea floor slopes, respectively tan 0 and tan ç, shown by P. de V a n s s a y de B l a v o u s (1933) :
sin 9 = tan çand (2) that any sharp projection above the sea floor gives a hyperbolic echo trace ( H o f f m a n , 1957). Using these principles, the following figures are examined mathematically, both two-dimensionally and three-dimen- sionally as being representative of possible features on the sea floor : inclined plane, cone, hemisphere, hyperbola, and parabola. A semi-ellipse was analyzed two-dimensionally. Some depressions were analyzed also. In all except the parabola, hyperbolic echo traces were prominent, differing by differing constants. The parabola and the semi-ellipse also gave parabolic echo traces. Other features were examined but found to have echo traces with complex characters.
Three complicating factors were examined. (1) The motion effect — the effect of the forward motion of the ship whereby the echo is not received where the sound pulse was emitted; (2) the correction due to sound velocity variation in the sea; and (3) the effect of the refraction of the sound ray due to the sound velocity variation. The first and last factors are shown to be negligible in general. Tables exist to correct for the second factor.

I. — FORWARD
W ith the increasing activity in bathymetric surveying and deep-sea research, echo sounding profiles are being scrutinized ever more closely to find the true configuration of the sea floor. Before 1940, the main interest in bathymetry was the charting of the sea floor. The true shapes of seamounts and ridges were of little importance because the slope corrections were less than the allowable charting errors. Most of the principles of echo sounding were well laid down in the early 1930’s by S h a l o w i t z
(1930), P. de V a n s s a y de B l a v o u s (1930, 1933) and H a y e s (1933).During the 1940’s new types of recording fathometers were developed
and specific features of the sea floor were being well surveyed, focusing interest on large features on the sea floor. Finally in 1956, the Precision Depth Recorder ( L u s k i n and I s r a e l , 1956) was developed which allowed for the first time in the United States accurate examination of small relief on the large features of the sea floor. For correct interpretation of the features, precise knowledge as to the true form of the feature must be known. This paper will discuss some of the echo traces to be expected from simple geometric forms on the sea floor. Nature, of course, will seldom take such pure forms. However, these pure forms may be used to approximate natural features and to understand what information may be obtained from the echogram.
II. — PRINCIPLES
Only two basic concepts govern the analysis of the echogram — the recorded sea floor slope and the hyperbolic echo trace. The sound pulse spreads as a sphere from the transducer. Assuming the sea bottom to be a mirror, the ship will receive an echo from any part of the sea floor that is tangent to the spherical wave front (including sharp points) as long as the reflection takes place within the half-angle of the transducer. Beyond that half-angle, the energy level of the sound ray is too low to activate the transducer on its return. This half-angle is measured from downward vertical and is assumed to be 30° for the E d o depth recorder. Transducers with a much narrower half-angle are now coming into use and the results have been described by C o h e n (1959). Such transducers almost measure the sea depth directly, and slope corrections are generally small. However, these transducers work only to intermediate depths. In general, the material in this paper will be valid for both types of transducers.
The assumptions of (1) a half-angle of 30°, (2) a spherical wave front, and (3) a mirror-like sea floor are all close approximations to the truth. Specular reflection (i.e. reflection from points away from the perpendicular between the ship and the sea floor) does occur but arrives later than the plane reflection and is weaker. A few other complications are discussed near the end of this paper. These complications however may in general be neglected.
W here the sea floor is sloping or hilly, the echo will not in general be detected from vertically beneath the ship but will return from any slope

(if the slope is less than the transducer half-angle) which is perpendicular to the sound ray. Such a point is the nearest point to the ship. Sound would still be returned by specular reflection from the sea floor directly below the ship but it would be of less intensity and would arrive later than the plane echo.
1. — Recorded Sea Floor Slope
P. de V a n ssa y de B l a v o u s and J. D. N a r e s (1933) showed that for a sea floor with a constant slope, the slope of the echo trace was less than the sea floor slope and related by (fig. 1) :
sin 6 = tan ç (1)where tan 0 = true slope of bottom,
tan <p = slope of echo trace.
Fig. 1. — Echo sounding profile of a sea floor with a constant slope.
This relationship is illustrated by figure 2. Note that up to a 15° slope, tan 0 and tan <p are very close. Even up to 30°, the departure is not very great compared to standard charting errors. In this discussion, it is assumed that the ship is moving directly up or down the slope.
For the true depth (z„) beneath the ship for a constant slope is :r r
= ----------= - - ■■■ - - (2)cos 0 y /1 — tan2 <p
where r = recorded depth.In general, the sea floor does not have a constant slope. To obtain the
true position and slope of a point from the echogram, we must work with the sea floor at the point of reflection rather than directly beneath the ship (fig. 3). Therefore the information for point A is recorded while the ship is at point B, not at point C. The true depth at j)oint A is :
z x — r y j l — tan2 © (3)where tan <p = slope of echo trace at point D, z x = true depth at point of reflection.

IN DE
GREE
S
Fig. 2. — Plot of the relations of equation (1). Q is the slope of the sea floor; is the slope of the echo trace of the sea
floor.
B C
Fig. 3. — Echo sounding profile of a sea floor with varying slope.

The horizontal distance D from point B to point C is :D = r tan <p (4)
This is plotted in figure 4. Note for example that for a 15° slope, the displacement is 1 kilom etre at a depth of 3 700 metres. W e can use the graph for finding the maximum width of features which would be hidden beneath the hyperbolic echoes (see discussion below) from their peaks (i. e. the recorded echo from the sides of the features would be masked by the echo from the flat sea floor). By checking on the graph a given depth and a given slope and then doubling the horizontal distance thereby obtained, we obtain the maximum width of a feature at that depth and of that slope which would be hidden beneath the hyperbolic echo trace.
Fig. 4. — Plot of equation (4). Horizontal displacement is distance BC in figure 3. Graph gives the displacement in terms of the true depth and slope or in terms of the recorded depth and the recorded slope. The displacement is found by projecting the intersection of the depth and
the slope to the ordinant.
The true sea floor of course may also be found from the recorded trace (or vice versa) by graphically swinging arcs as did P. de V a n ssa y de B l a - vous (1933) using the positions of the ship as the centre of the arcs.

2. — Hyperbolic Echo Trace
As nicely shown by H o ffm a n (1957), any seapeak or sharp change in slope will give a hyperbolic echo trace (fig. 5) of the form :
(.z' + n )2 m2------------- — ------- = 1 (5)
n2 n2where n = depth to apex hyperbola ;
z f = depth of a point on the hyperbola beneath the apex ; m = horizontal distance of the point on the curve from the apex.
Fig. 5. — Echo trace from a sharp sea peak.
W ith these two characteristics in mind, all of the following forms were derived.
III. — THEORY OF ECHO TRACES OF GEOMETRICAL FEATURES
(1) The relationship between the slope of the sea floor and the slope of the echo trace (eq. 1) was derived by P. de V a n ssa y de B l a v o u s for a sea floor with constant slope. It w ill be shown that the relationship holds for any sea floor slope as long as corresponding points are compared on the curves — that is, the point of reflection on the bottom is compared to the reflected ray from that point.

In fig. 6, let the depth (z) of the sea floor be some two-dimensional function of the horizontal distance (x) from an origin and let the ship move directly up or down the slope :
z — fix) (6)Now, since :
r = — —— (7)cos 0m — x x -(- tan 6 (8)
thenr2 = (m — x 1)2 + zx2 (9)
where :r = recorded depth ;
x x — horizontal coordinate of point of reflection ; m = horizontal coordinate of ship.
Differentiating eq. (9) :2 r dr = 2 (m 1 — x x) (dm — d x t ) + 2 z ± dz x (10)
Combining the above equations :r dr = (r cos 6 tan 6) dm — (r sin 0) d x x -f- (r cos 0 tan 0) d x ± (10a)
which sim plifies to :dr
------ = sin 0 (11)dm

drS in ce ------ is the slope (tan <p) of the echogram, the universality of the
dmequation of P. de V a n ssa y de B l a v o u s is proven.
(2) In order to obtain an equation of the echogram, we want the echo depth (r) as a function of the horizontal distance (m) measured on the echogram from some origin.
The slope of the sea floor (tan 0) is the derivative of z w ith respect to x :
« a dztan 0 = ------ (12)dx
or by definition :dz
- T — = f'(x) (13)dx
Now, eq. (10) may be rewritten by trigonometric transformation :
t — z 1 \ / l -f- tan2 0 (14)Finally, combining eq. (11) w ith eq. (6), (12) and (13) :
m = x + f ( x ) f ' ( x ) (15)and combining eq. (14) with eq. (6), (12) and (13) :
r = f Or) V 1 + Lr(*)J2 (16)These are the required equations. To check eq. (15) and (16), we
reverse the process and differentiate eq. (15) :dm = dx -f- [ f ' ( x ) ]2 dx -f- f ( x ) f" (x ) dx (17)
and eq. (16) :V Or)
dr = -------- ---------------{1 + [/'(*) p + f (x) f" (x ) } dx (18)V I + L/'Cz)J2
Combining eq. (17) and (18), we obtain the slope of the echo trace :dr f' (x )
------ = ------------------------ (19)dm V I + [/'(*) ]2
Because :f (x) — tan 0 (20)
and :tan 0
sin 0 — ------------------- (21)V l + tan2 0
then eq. (19) is the same as eq. (11), and therefore (15) and (16) are valid.
Now, in order to describe the echo trace we are looking for an equation with (r) as a function of (m) or, less desirably, (m) as a function of (r). Therefore we must be able to solve either eq. (15) or (16) for Or), the horizontal coordinate of the reflection point, and then substitute this into the other equation.
In order both (1) to solve the equations and (2) to obtain a simple resultant equation, it turns out that the equation for the sea bottom must be simple. Solutions have been worked out for the following two-dimensional features :

1. Incline2. Wedge-shaped ridge3. Semicircle4. Inverse parabola5. Semi-ellipse6. Hyperbola
and for the following three-dimensional seamounts :1. Inclined plane2. Cone3. Hemisphere4. Paraboloid5. Hyperboloid
Solutions have also been worked out for some depressions.Attempts were made on several seemingly simple figures but their
equations were too complex to give simple echo traces.
IV. — ANALYSIS OF SUBMARINE FEATURES
1. — Monocline
a. Three d imens ional
For an inclined plane (fig. 7) :tan p = sin to tan 6
where tan p = slope of sea floor along track,to = course relative to parallel along slope,
tan G = maximum slope of bottom.
SEA SURFACE
SHIP'S TRACK
(22)
PROJECTION OF SHIP'S TRACK ON SEA FLOOR
TRACK OF REFLECTIO N POINT
SEA FLOOR
Fig. 7. — Oblique crossing of a monocline.
Now, the track of the point of reflection across the floor of a monocline does not correspond with the downward projection of the ship’s track on the sea floor, but lies upslope of the projection of the ship’s track.
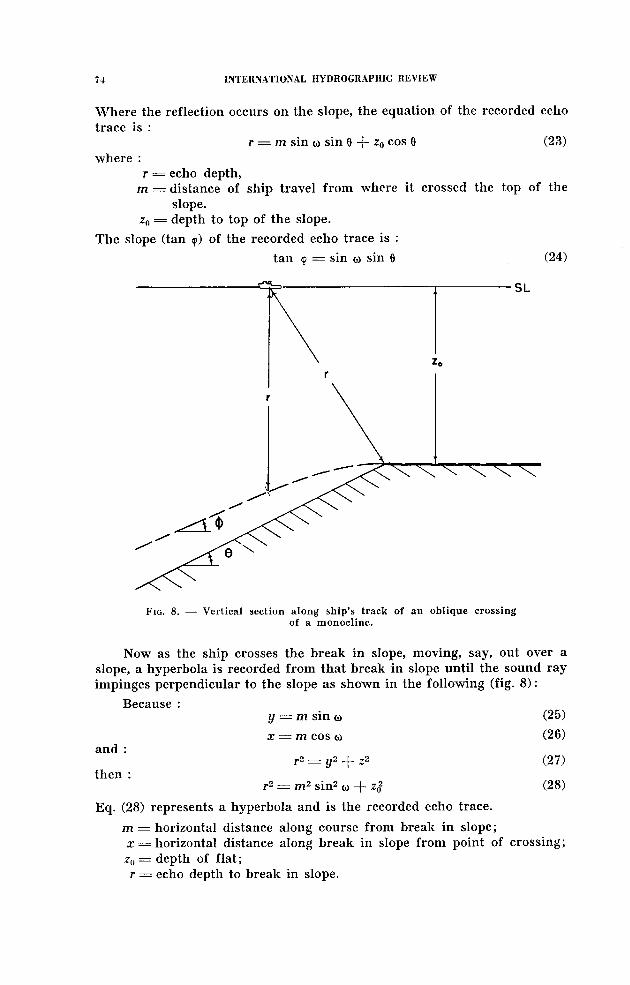
W here the reflection occurs on the slope, the equation of the recorded echo trace is :
r = m sin o sin 6 + zo cos 6 (23)where :
r = echo depth,m = distance of ship travel from where it crossed the top of the
slope.z0 = depth to top of the slope.
The slope (tan <p) of the recorded echo trace is :tan <p = sin « sin 6 (24)
F ig . 8. — Vertical section along ship’s track of an oblique crossing of a monocline.
Now as the ship crosses the break in slope, moving, say, out over a slope, a hyperbola is recorded from that break in slope until the sound ray impinges perpendicular to the slope as shown in the following (fig. 8) :
Because :y = m sin w (25)x = m cos o) (26)
and :r2 = y2 (2 7 )
then :r2 = m2 sin2 w + -z02 (28)
Eq. (28) represents a hyperbola and is the recorded echo trace.m = horizontal distance along course from break in slope ; x = horizontal distance along break in slope from point of crossing; z0 = depth of flat; r = echo depth to break in slope.
b. Incline- tw o d im ensional
W hen the ship’s track is perpendicular to the break in slope and the echo track goes directly up or down slope, then co = 90° and the problem sim plifies to two dimensions.
S i m p l e i n c l i n e
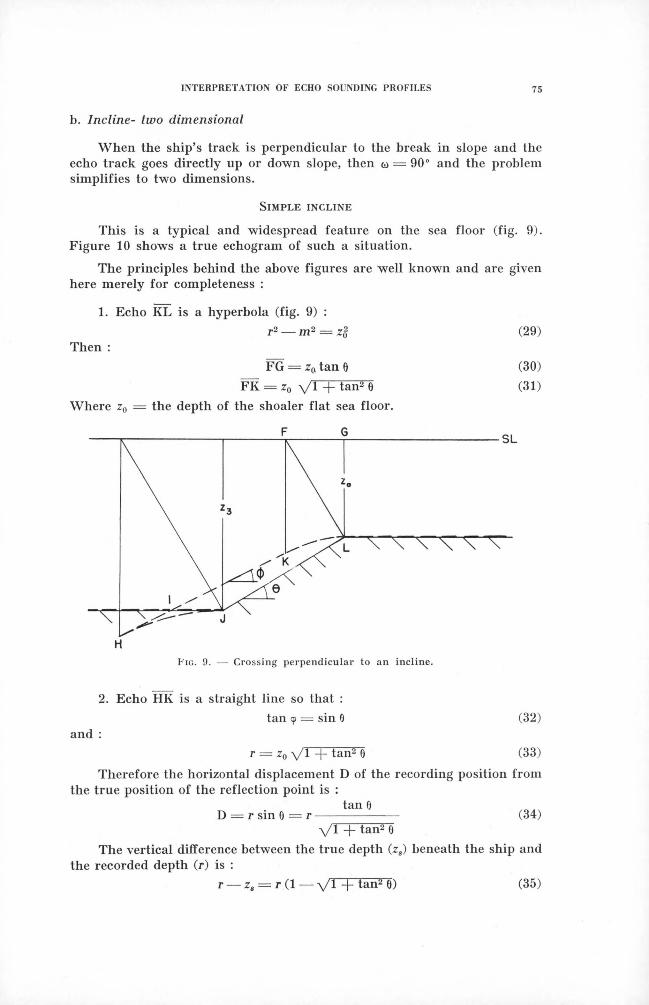
This is a typical and widespread feature on the sea floor (fig. 9). Figure 10 shows a true echogram of such a situation.
The principles behind the above figures are well known and are given here merely for completeness :
1. Echo KL is a hyperbola (fig. 9) :r2 — m 2 = z$
Then :FG = z0 tan 6
FK = z0 \ / l -(- tan2 6 Where z0 = the depth of the shoaler flat sea floor.
(29)
(30)(31)
F ig. 9. — Crossing perpendicular to an incline.
2. Echo HK is a straight line so that :tan <p = sin 6
and :(32)
r — Zq \ / l -|- tan2 6 (33)Therefore the horizontal displacement D of the recording position from
the true position of the reflection point is :tan 0
D = r sin 0 = r (34)V I + tan2 0
The vertical difference between the true depth (z8) beneath the ship and the recorded depth (r) is :
r — z* = r ( l — V 1 + tan2 6) (35)

F ig. 10. — Actual fathogram showing a situa tion sim ilar to figure 9. Depth range of the fathogram is 1 200-1 600 fathom s w ith reference lines 20 fa thom s apart. Breaks in reference lines are 0.5 m ile apart.
V ertical exaggeration is 20 x.
3. Echo HJ is a hyperbola and can be calculated as in case § 1.
4. The horizontal displacement (IJ) of the nickpoint for the above flat bottom is :
I J - z3 tan — (36)2
and :1 — >/1 — tan2 9
I J = z 3 -------------------------- (37)tan cp
where z3 = depth of deeper flat bottom.For 6 < 30°,
— tan ®IJ _ Z3 X — Y (37a)
£
I n t e r s e c t io n o f t w o s l o p e s
We wish here to find the horizontal displacement (AB) of the recorded nickpoint (fig. 11).
Now :

where tan X = true slope of lower slope and BD = true depth of the nick- point.
The depth (AC) on the recorded nickpoint is :
AC = BD X
cos — (6 — X)(39)
cos —- (0 + X)A
The horizontal displacement (AB) of the recorded nickpoint in terms
of the recorded depth (AC) of the same is :(1 — v^l — ta n ^ ç)tan n + (1 — V 1 — tan2 !*) tan <P
AB = ACtan <p tan ,̂ + (1 — V * — tan2 <p) (1 — - \/l '— tan2 fx)
where tan jx = recorded slope of true lower slope.For angles < 3 0 ° , eq. (40) simplifies to (with less than 5 % error) :
(40)
AB = S c 2(tan* + tan|l)
This is plotted in fig. 12.4 -j- tan <p tan ^
(41)
2. — Conical Seamount
a. Crossing of a conical seam oun t so that the echo comes f rom its side
As w ill be shown, any crossing of a cone w ill produce a hyperbola, albeit a hyperbola rather different from the hyperbolic highlight of its peak.

j y L _ 2 (TAN d) + TAN a ) AC 4 ♦ TAN <|) TAN fl M *
Fig. 12. — Plot of equation (41). AB is the horizontal displacementof the recorded nickpoint with a recorded depth AC (see figure 11). jt and Q are the slopes of the recorded echo trace of the sea floor.
Using fig. 13, the equation for the recorded echo trace is derived as follows :
The recorded depth (r) :r = J + H (42)
Now :J = (E — G) sin 0 (43)
where tan 0 = maximum slope of the seamount.n
(44)H
E
cos 0
psin 6)
(45)
where (w) = horizontal angle to the projection of peak of the seamount on the sea surface from the ship relative to the ship’s track.
Also :G = n tan 0 (46)
and :Psin 6)
\ / p 2 m 2Combining, we obtain the desired relation :
t = n cos 0 + x /p 2 + m2 sin 6
(47)
(48)

F ig . 13. — C onfiguration over a conical seam ount w ith the sh ip’s track passing a distance p from the projection of the peak at
the sea surface.
or(r — n cos 0)2 m2
1 (49)p 2 sin2 0 p 2
(p) = nearest horizontal approach of the ship to the peak of the seamount; (m) = distance to the ship along the ship’s track from the place where (p ) is measured.
This is the formula of a hyperbola and shows that the echo trace will be a hyperbola whose shape depends on (p) and (0) and whose position depends on (n) and (0). The depth (c) of the apex of the hyperbola is :
c = p sin 0 - f n cos 0 (50)True depth (zg) beneath the ship :
J + H rcos 0 COS 0
Alternately := n - f V P 2 + m2 tan
(zg — n )2 n v= 1
(51)
(52)
(53)p 2 tan2 0 p 2
Again this is a hyperbola as projected on the fathogram. The actual path of the reflection point on the bottom is not a hyperbola as w ill be seen.
The horizontal displacement of the reflection point parallel to the ship’s track is :
n m------------- (- m sin2 0 (54)K = — sin 2 0 X ---------------
2 V P 2 + m ~

The displacement perpendicular to the track is :n p
F = — sin 20 X -2 \ / p 2 + m 2
The total horizontal displacement is :
D = — sin 2 0 -(- sin2 0 p 2 m 22
(56)
The difference in depth between the true depth beneath the ship and the recorded depth is :
zs — r = (1 — cos 0) (n — \ / p 2 -(- m 2 tan 0) (57)As can be seen, the following quantities are generally unknown : p, 0
and n.
All is not lost, however, for we can solve for these quantities when given a conical seamount. The general formula for a hyperbola is (fig. 14) :
(y — k ) 2 (x — /)2—---------------- ------ — = 1 (58)
L2 M2where (k) and (/) = position of the centre of the hyperbola, L/M = slope of asymptote.
Now by substituting :r = yk = d cos 0 L = p sin 0 M — p
We obtain eq. (63) which is equivalent to eq. (49) : (r — k ) 2 — m2 sin2 0 = p 2 sin2 0
Now let :A = L - f k
where (A) is the depth to the vertex of the echo.
(59)(60) (61) (62)
(63)
(64)

Now measure two points on the recorded hyperbola (m1? rl5 and m 2, r2). Substituting these values into eq. (63) :
(rx — k ) 2 — m? sin2 0 = (A — k ) 2 (65)(r2 — k ) 2 — m l sin2 0 = (A — k ) 2 (66)
Solving :m \ (r2 — A)2 — m l (r? — A2)
k — -----------------------------------------------(67)2 [m \ (r2 — A) — m \ (rx — A) ]
and :. (ri — A) [A(rj -f- r2) r2(r1 r2)]
sin2 0 = ------------------------------------- —--------------- (68)m% (rx — A) — m{ (r2 — A)
Since the quantities on the right of the last two equations are known, we obtain k and sin 0. The asymptotes cross at depth (k ) with a slope of (sin 0).
The semi-axis (L) is :L = A — k (69)
The depth (n) of the peak is :
n = ------------------- (70)y /1 — sin2 0
The horizontal offset (p ) from the track to the peak is :
;> = — (71)sin 0
(A — *)P = ---- : rsin 0
The slope (tan 0) of this conical sea peak is :
(72)
sin 0tan 0 = ----- — (73)
— sin2 0
T h e TRACE OF THE REFLECTION ON THE CONE
W e have seen so far what we will record as we pass over a conical sea peak to one side of its peak. Let us see now what path the reflecting beam takes over the sides of the sea peak in order to find out what part of the bottom we are sampling.
The equation of a conical sea peak with origin centered over the cone on the sea surface w ill be (fig. 15) :
— (Z~ n)2 + i f + x* = 0 (74)tan2 9
Now, where n = depth of peak and 0 = maximum slope of the sea peak, the equation of a line is :
x — X! y — Ui z — z 1
x 2 — Xx y o y i z2 Zy The equation of line AB is therefore :
x — m y — p z
x 2 — m y 2 — p z2
(75)

where x 2 y 2 z 2 = coordinates of the reflection point, and we are shown by eq. (48) :
r = n cos 0 + sin 0 -\J p 2 +
Fig. 15. — Crossing of a conical seam ount w ith in a distance p o f the projection o f the peak at the sea surface.
(77)
Now from the geometry :y 2 = p — r sin 6 sin w
and :
and :
and :
4 1 — sinn cos 0
-(- sinV />2 + m ‘2
x 2 = m — r sin 0 cos w
■)]n cos 0
= m I 1 — sin 0 I ---------------- -)- sinV p 2 + m ‘2
, . . ) 1
Z2 = T COS 0
= n cos2 0 -(- sin 0 cos 0 y / p 2 -(- m 2 Combining these equations w e obtain a better equation for line AB :
x — m y — p z
— m sin 0 — p sin 0 \ f p 2 -)- m 2 cos Now since the ship is moving :
xm = p —
y
(78)
(79)
(80)
(81)
(82)(83)
(84)
(85)

Substituting eq. (84) into eq. (85) we get :Or2 - f y 2) (p — y )2
22 (86)y 2 tan2 0
This is the formula for the surface traced by the path of the reflecting ray.In order to obtain the track of the point of reflection across the conical
sea peak, we equate the equation of the ray surface, eq. (86), with the equation of the seamount, eq. (74).
In order to obtain an insight into what equations (74) and (86) represent, let us project the track of the point of reflection onto the three horizontal and vertical planes : yz, xy, and xz.
-Ô — S L
SH IP'S TRA CK /
Fig. 16. — Track of the reflection point of the acoustic heam over a conical seamount in the y z plane (perpendicular to the ship’s track).
First let us project the track on the yz plane (x = 0, i. e. looking down the ship’s track, fig. 16). Combining eq. (74) and (86) and eliminating (x) :
yz sec2 0 — m y — pz - f np = 0 (87)By moving the origin (x0, y 0, z 0) to (0, p cos2 0, n cos2 0), eq. (87) transforms
• y' z' — — np sin2 0 cos2 0 (88)This represents a section of a rectangular hyperbola whose closest
distance to the new origin is : sin 0 cos 0 y/2~np.Second, let us project the track of the reflection point on the sea sur
face (xy plane, z = 0, fig. 17).Combining eq. (74) and (86) and eliminating (z) :
x 2 [y sec2 0 — p ] 2 = y 2 [n2 tan2 0 — (y sec2 6 — p)2] (89)Shifting terms, eq. (89) becomes :
(x2 -f- y 2) (y sec2 0 — p ) 2 — y 2 (n2 tan2 0) = 0 (90)This is the equation of a conchoid, specifically the Conchoid of Nicomedes (a conchoid of a line).
Lastly, let us project the track of the reflection point on the xz plane (y = 0, fig. 18).

Combining equations (74) and (86) and eliminating (y) :(z — n ) 2 [{z sec2 0 — n ) 2 — p 2 tan2 6]
(z sec2 0 — n )2 tan2 6
F ig . 17. —- Track of the reflection point over a conical seamount in the x y plane (a view from above).
s h ip 's t r a c k .-------------------------------------- A --------------- -------------^ --------SL
F ig . 18. — Track of the reflection point over a conical seamount in the x z plane (parallel to the ship’s track).
This does not represent a simple curve although when n = 0, the figure a hyperbola. W hen (0) is small, the figure approximates a hyperbola.

b. Crossing a very steep conical sea peak to one side of its peak (fig. 19).
In this specific case, the echo comes only from the summit of the sea peak. For this to occur, the summit must be within the half-angle of the sound cone. As long as the following relation holds :
y jm 2 -(- p2tan 6 > - ------ (92)
n(where 0 is the maximum slope of the seamount and m, n, p are defined in fig. 19), the echo is a highlight from the summit. W hen the two sides of
F ig . 19. — Crossing of a very steep conical sea peak to one sideof its peak.
eq. (92) become equal, the relations already described for the conical seamount become the governing rules. If the summit is not in the sound cone and eq. (92) holds, then the echo returns from the side of the seamount where the edge of the sound cone first hits the seamount and a complex situation develops which will not be described here. In the case of a highlight from the peak, the recorded distance (r) to the peak from the ship is :
r2 = m 2 -f- p2 -f- n2 (93)This is alternatively : r2 m2
-----------------------------------= 1 (94)p2 _J_ n 2 p2 _j_ n 2
which is the formula for the echo trace and which is a hyperbola.It may be seen that the form of the hyperbola does not specify the
depth to the peak because the hyperbola of the echo trace has the same form as long as : p2 -\- n2 = constant (95). (n ) may vary up to ( \ A p ) for a sound cone with a half angle of 30°. (n ) may therefore be 15 % shoaler (as a maximum) than shown on the record.

c. Section of wedge-shaped ridge.
This is a two dimensional figure (fig. 20) and may be regarded as a crossing of a cone directly over its axis or a crossing of a wedge-shaped ridge at right angles to its axis.
F ig. 20. — Echo trace of a wedge-shaped ridge.
The formula for the hyperbolic section of the echo trace (between points B and E) follows from eq. (5) and eq. (94) where p = 0 and is :
r2 m 2-------------------- = i (96)
n2 n2
At points B and E, the hyperbolic echo from the peak merges with the plane echo from the sides. This intersection occurs as soon as the sound ray becomes perpendicular to the side of the ridge. At point B then :
x — n tan 0 (97)
and the echo below point B has the form :
n
cos 0(98)
Now if the summit depth and/or height of the ridge is such that the depth to the flat sea floor is less than the echo distance given by eq. (98), the usable recorded echo of the ridge consists entirely of the hyperbolic echo and none of the plane echo from the sides (fig. 21).
The echo is then plane between points A and B and hyperbolic between points B and E. However, the hyperbola does not emerge from the flat sea floor except between points C and D. W e can therefore find from the observable echo a minimum average slope of the ridge, but not the true slope, because the intersections at points B and E are likely hidden in the sea floor echo. This is in itself useful however. The slope of the ridge is then :
COtan 0 > tan 0,„ = ------- (99)
where CO = half width of the usable hyperbola and tan 0„ slope of the ridge as discernible from the echo trace.
minimum

TAB
LE
OF
CO
MP
AR
ISO
NS
bO
W0-ocn
c l-o+1
o<tJs«o
HC I -o s £
+1 +1II
+1II
II II II
iXwHosw>
hoaHeuw
QS~w
X H H Z Cu W W UQ h
o
«
+M
>
a ,
+
o*o
03-mo ,
+e
►j&sccofc
« Uo
a>l e
CN ■» ’ jH I «
+
«5
+<Nft.
4si u* >V nf t °
S m<o
o «5 u 1/3a os* o
■rJ
°* 25tfliS a
1 2 5¢3 43
f t > * ^ o rtS i 2 S
«M
43 G
fC 2 SC ft
«<-(O
<DftO
4)cOocm OC ^.2 gt5££ 43_. -4-*T3 cs.§ s S-2 >
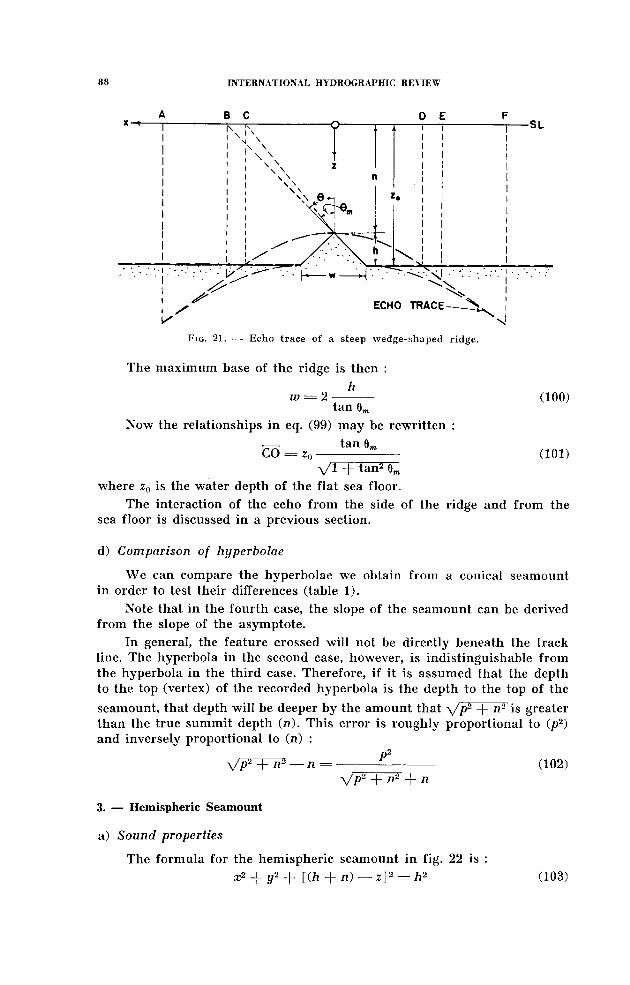
The maximum base of the ridge is then :h
w = 2 ---------tan 6m
Now the relationships in eq. (99) may be rewritten :
™ tan OmCO = z0------------------
(100)
( 101)V I + tan2 6m
where z0 is the water depth o f the flat sea floor.The interaction of the echo from the side of the ridge and from the
sea floor is discussed in a previous section.
d) Comparison of hyperbolae
W e can compare the hyperbolae we obtain from a conical seamount in order to test their differences (table 1 ).
Note that in the fourth case, the slope of the seamount can be derived from the slope o f the asymptote.
In general, the feature crossed w ill not be directly beneath the track line. The hyperbola in the second case, however, is indistinguishable from the hyperbola in the third case. Therefore, i f it is assumed that the depth to the top (vertex) of the recorded hyperbola is the depth to the top o f the
seamount, that depth w ill be deeper by the amount that y/p2 -)- n2 is greater than the true summit depth (n ). This error is roughly proportional to (p2) and inversely proportional to (n) :
P2V />2 + n 2 — n = ( 1 0 2 )
V />2 + n 2 + n
3. — Hemispheric Seamount
a) Sound properties
The formula for the hemispheric seamount in fig. 22 is :
x2 + y2 + [(/* + n) ■—■ z ] 2 = h2

where x, y, z — coordinates of a point on the seamount in respect to an origin at the sea surface centered over the seamount; h = radius o f hemisphere; n = depth of top of hemisphere.
PROJECTION OF SHIP'S TRACK
F ig . 22. — Crossing of a hemispherical seamount to one side of its peak.
The true depth (zs) beneath the ship is :
zs = (h -\ -n )— y7 ^ — (m2 + p2) (104)
The recorded depth beneath the ship is :
r — — h -f- a/(/z -f- n)2 + (m2 + P2) (105)
The depth at the point of reflection is :
z — r cos 0 (106)
where tan 0 is the slope of the seamount at the point of reflection. W e now transform eq. (183) into measurable quantities.
Since :cos 0
h -f- n
then :VCh + n)'1 + m2 + p2
h -f- V (A + ft) 2 + m2 + P2] (h + n)
(107)
(108)V f r + m2 + p2
The total horizontal displacement (D) of the point of reflection from the point of recording is :
D = r sin 0 (109)
[— h + \/(h + /i) 2 -f- m2 - f p2] V m 2 + P2
V ( * + n )2 + m2 + p2

The horizontal displacement (F ) perpendicular to the track is :
F = D sin (ùp [ — h - f y / (h + n ) 2 + m2 + pa]
(112)V ( * + n )2 + m2 + p*
Finally the horizontal displacement (K ) parallel to the track is :
K = D cos (ù (113)
m [— h -f- V ( * + n>)2 + + P2] (114)y / (h + n ) 2 - f m2 + pz
__________________ c -^ 7. SL
HEMISPHERE PROJECTED TO PLANE BENEATH SHIP
ECHO TRACE
TRUE DEPTH BENEATH ‘SHIP
HEMISPHERE AS SEEN BY ECHO SOUNDER
F ig . 23. — Pertinent features o f a hem ispheric seam ount as projected to a vertical p lane that is p a ra lle l to the sh ip ’s track.
The trace of the recorded depth on the fathogram is (fig. 23) :
________________ÜÜ_______ = 1 (115)(h + n ) 2 + p2 (h + it)* + p2
This represents a rectangular hyperbola with a centre at (m = 0, dr = — a) and with asymptotes of the formula : ± m = r h. The shallowest depth (A ) of the hyperbola is :
A = ( l i s a )I f we allow h — 0, eq. (115) becomes indentical to eq. (9), the equation
of the echo trace from a very sharp peak.
The trace of the true depth (zs) beneath the ship is :
[z8 — (h + n ) ] 2 - f m 2 = /i2 — p2 (116)
This is a circle with its origin at z8 = h + n, m = 0, its diameter
= \/h2 — p? and the shallowest depth = (h -f- n ) — \/h2 — p1.

Figure 23 illustrates the various tracks and figures as projected horizontally onto the vertical plane beneath the ship’s track in a specific example.
Sl o p e
The slope <p of the recorded trace of the seamount is :
tan. 9 = ---------------- Ul----------------- ( 117)\/7i2 -f- n2 -(- m 2 -f- p2
The slope (tan 0t) of the circular section that is perpendicularly below the ship’s track is :
tan Oÿ = ----------------------------- (118)y/ i2— (m 2 + p2)
The maximum slope at the point of reflection is :
\ /m 2 -4- p2tan 0 = — ------(119)
h + n
and the maximum slope tan 0S of the seamount below the ship’s position is :
tane, = - p: c m )V * 2 — (m 2 + p * )
b) Solving for the sphere from the hyperbolic echo trace
W e may use the recorded echo trace to find the sphere (assuming we are dealing with a sphere) by two methods : ( 1) determining the position of the asymptotes to the hyperbola and (2) computation from measured depths. The asymptotic method consists of locating the intersection of the
asymptotes which is then \ / (h -f- n )2 + p2 above the vertex of the hyperbolic echo trace. However, the asymptotes may be difficult -to position accurately. Therefore, the computation method is illustrated below.
Eq. (115) may be solved to obtain the radius of the hemispheric seamount. To begin, rearrange eq. (115) so that :
(r -)- h )2 — m 2 = (/i-(- n )2 -f- p2 ( 121)Picking off two points on the echogram ( jn x, r { ) and (m2, r2) and inserting these in eq. ( 121) :
Or,. + h )2 — ml = ( h -b n )2 + p2 ( 122)(x-2 + h )2 — ml = (h + n)2 _|_ p 2 (123)
Dividing eq. (122) by eq. (123) and solving :
2*2 ---T\ m l ----m2 , « ̂h = —------- — — ----------- (124)
2 (r2 — r j )
Now with this information (h, A and m ), we can solve eq. (113) for the displacement of the reflection point parallel to the track :
K = ------------------------------------------------ (125)V (A + h)* + m*
where A = depth of vertex of the hyperbola.

However the position o f the seamount is still undecipherable from the echogram because of the interdependence of (n ) and (p). I f we differentiate eq. ( 1 2 1 ) we find that we can change either (n) or (p) such that :
h -(- nA p = -------An (126)
Pwhere Ap — change in horizontal offset (p ) of track,
An = change in depth (n) of seamount
and the fathogram w ill be unchanged.
Similarly, the fathogram w ill be unchanged for small changes involving the radius of the seamount if :
h -f- nAh = — —— An (127)
r — nand :
A h = — - — A p (128)r — n
c) Track of the reflection point (fig. 22)
As we have proceeded for the cone, we obtain the equation of the reflected ray from the hemisphere through points (m, p, o) which is the position of ship and (x, y, z) which is the position of the reflection point :
x — m y — p(129)
x 2 — rn y 2 — p z2 This line is perpendicular to the sphere so that
x -2 — m — r sin 9 cos to (130)mh
(131)
Similarly
and
V ( * + * ) 2 +
hpij2 = ------ ----- (132)
^/(h -(- n )2 -(- m2 -(- p2
_ (h + n) [— h + VC* + n )2 - f m2 + p2]Z2 — -------------------------------------------------------- (lo o }
V (A + n )2 + m2 -j- p2 Combining eq. (129), (130), (132) and (133) :
m — x p — y z
m p h -(- nThe combination of this line and the ship’s track (x = m ) gives :
p — u z—---- ----------------= 0 (135)
P h + nThis plane passes through the centre of the hemispherical seamount so therefore the track of the reflection point is a circle. The projection of this circle on the sea surface is an ellipse :
[p2 + (/1 + /Z)2]
(134)

The projection on the xz plane is also an ellipse :
p2 + (h + n.)2x2 —I— —— --------—------- (h + n — z )2 = h2 (137)
(h + n)2and the projection on the yz plane is a straight line with the same equation as eq. (135).
d) Semicircular ridge
This two dimensional figure (fig. 24) may be considered to be either a crossing of a hemisphere directly over its crest or a crossing at right angles to a ridge with a semicircular section. The derived equations are analogues of the equations derived for the hemisphere except that some of the constants equal zero.
The formula for a semicircular ridge is the same as eq. (104) except that y = 0 :
æ2 - f (h + n — z)2 = h2 (138)where (x , z) are points on the seamount, (h) is the radius and height, and (n ) the depth of ridge.
The true slope (tan 9 ) o f the ridge is the same as found by eq. (120) except that p (the offset) = 0 .
The slope of the echo trace is found by eq. (117) where p = 0.
The true slope beneath the ship may be found by eq. (118) except again that p = 0 .
The trace of the recorded depth (r) is shown by eq. (115) using p = 0 :
(r -f- h )2 m 2------------------------ = 1 (139)
(.h + n )2 ( h + n ) 2
This is a rectangular hyperbola with a mathematical centre at (m = 0, r — — li) and with asymptotes of the formula :

Standard properties are :True depth (z s) beneath the ship is shown by eq. (104) using p = 0. Depth at point o f reflection (z ) may be derived by eq. (108) where
P = °-The horizontal displacement (D) of the point of reflection from
the position o f the ship is given by eq. ( 1 1 2 ) where p = 0 .
Seamount in the Shape of a Paraboloid
To deal with this, the centre of the parabola must be at the surface (fig. 25). W ith this restriction the equation of the seamount is :
z4x2 + y2 = --------- (141)
J 16 s2where s = focal length o f the parabola. W e w ill now derive the equation of the echo trace to be expected from this figure. First, let :
R2 = x2 + IJ2 (142)
where R = radius of revolution o f the paraboloid at depth y. Now, because the maximum slope of the seamount w ill be along radius (R ) outward from the axis of the seamount, we define the differential :
dz------= tan 6 (143)dR
Then at the point of reflection (x2, y2, z2) the slope is :
2 stan 0 =
and therefore
Now from figure 25 :
cos 9\Jz ̂ -R 4 s2
D = z2 tan 6 = 2s
(144)
(145)
(146)

andm — x2 = D cos to (147)
and
cos 6) = --------------- (148)V « i 2 + p2
where D = horizontal displacement of reflection point. Combining equations(146), (147) and (148) :
x2 = m ( 1 ------------------- ) (149)
(150)
y m 2 + p2 Now :
cos 6
Then combining equation (150) and (145) :
r2 = z2 -j- 4 s2 (151)
and combining equations (141) and (151)
(r2 — 4 s2) 2
16 52Since :
x|4 -y% ( 152)
mthen equation (152) becomes :
(r2 — 4 s2) 2 x ‘i
ÿ2 = — * 2 (153)
(m2 -f- p2) (154)16 s2 m2
Finally combining equations (149) and (154) we obtain the desired equation
of the echo trace (for \fm2 -J- p2 > 2 s) :
(r2 + 4s2) 2 = 16s2 (m2 + p2) (155)
This relatively simple curve approximates a parabola where m » p or
becomes a true parabola where it is plotted r vs. y/m2 p‘2.
Ideally, for p < 2 s, the reflection comes from the peak and has the form :
r = \/m2 -f- p2 (156)
In practice however, true reflections would not occur from slopes > tan 30° and the recorded echo trace for the upper part of the seamount would not be represented by either equation (155) or (156) but by a more complex form. This is discussed somewhat more under the two-dimensional figure.
Preparatory to finding the track of the reflection point across the seamount, we must find the surface traced by the reflected sound ray as the ship moves along. Now the equation of a line passing through the position o f the ship (m , p, 0 ) and the point of reflection is :
x — m y — p z
X'2 m y 2 — pAs in equation (153) :

Now, y2 is derived in a similar manner to x2 in equation (149) so that :
y2 = p ( 1 ----------— ------) (159)\ + P2 '
Combining equation (157) with equation (159) :
y ~ P- = L U jL (160)y 2 — p 2 ps
Combining equations (141), (149) and (157) :
z z ----------- (161)z2 2 (s \/m2 -f- pl — 2 s2) 1/2
Finally, by equating equations (161) and (160) and substituting equation (158) and then juggling terms we obtain :
r*2 \ 3= 1 (162)
P (P — » )2 ( ^ + 1 12
This is the equation of the ray surface. This combined with equation (141), the equation o f the seamount, is sufficient to describe the path of the reflection point of the echo over the seamount. This path may be projected onto the three coordinate planes (xy, yz, xz) for clearer presentation. However, since none o f the three projections are simple curves, their mathematical descriptions are not given.
Ridge in shape of inverse parabola
This two dimensional figure (fig. 26) may be regarded as the crossing of a parabolic seamount directly over its peak or the crossing of a ridge at right angles to its axis. This parabola is lying so that its axis is horizontal.
F ig. 26. — Echo trace of a parabolic ridge.

W e only use the part below that axis. The other half o f the ridge is a mirror image of the first half. The general formula for the figure is :
4 s Or + p0) = ± (z — n0) 2 (163)
where s = focal length of the parabola, p0 and n0 = horizontal and vertical coordinates, respectively, o f the vertex of the parabola.
However, for n 0 > 0, the above equation cannot be analysed in a simple manner. Therefore, let us begin the analysis of this problem by letting p0, n0 = 0 so that the crest is at the sea surface and at the origin of the coordinate system. Its formula is :
4 sx — ± z2 (164)
Let us analyse the rest of the problem only for -f- z2 in order to clarify the -)- and — quantities.
The echo trace would be the same as that of the paraboloid where p = 0. Equation (155) then gives the desired echo trace :
r2 = 4s (m — s) (165)
This is a parabola of the same shape as the ridge but shifted s units left. There are several limitations to equation (165).
First o f all, equation (149) informs us, if p — 0, that :
m — xx = 2s (166)
Therefore, for the purposes of equation (149), m can never be less than 2s. Ideally, for m < 2s, the following equation holds :
r — m (167)
because the reflection is coming from the crest of the ridge.
In actuality, with a transducer with a true 30° half-angle, the sound ray w ill not be reflected perpendicularly for m < 5 s. For m < 5 s, the sound would be reflected diffusely from the point where the edge of the sound cone intersects the ridge. The special formula for this latter echo trace is :
/ 3s \12s + j = (r + 3s) 2 (168)
This is also a parabola, though different in shape and position from the previously studied ones. The standard properties of the curve for m ^ 5 s are :
— slope of echo trace (tan 9 ) :
tan 9 = — = * /--------- (169)r y m — s
— true slope beneath the ship (tan 0S) :
tan 0a = * / — (170)y m
— true depth (z8) beneath the ship :
zg = 2 y/sm (171)
— depth at the point of reflection :

For another example of an idealized parabolic ridge, let us move the above parabola 3 s units to the right giving an equation :
4s Gr + 3s) = z2 (173)Further let us eliminate the figure for x < 0 and replace it by a mirror image o f the figure for x > 0. This then gives us a parabolic ridge (fig. 10) with a peak at a depth z == 2s ^/5 and a maximum slope at the peak of tan 30°. For — 2s =; m = ; 2s, the equation of the echo trace would be :
± r 2 = 4s(m + 2s) (174)For 2s > m > — 2s, the equation o f the echo trace would be the hyperbolic equation of the highlight from the peak :
12 s2 12 s2Note :
The focus of this ridge is at x = s, z = 0 for the above case. For sound travelling through the sea horizontally at any horizon, it is all focused at point (s, 0) ; ergo, put a listening device there. Conversely for any submarine sound emitter (like a volcano or a submarine) at the focus, the sound w ill be reflected horizontally at all horizons. In the real sea however, the vertical variation o f velocity w ill greatly disturb this horizontal propagation o f sound.
5. — Seamount in Shape of a Hyperboloid
In order that this seamount (fig. 27) yield to a straight-forward analysis, its centre must be at the origin and the origin be at the surface. Such a seamount would look like an atoll (for our purposes). Its equation
where q = diameter of atoll, u = shape determining constant.
F ig. 27. — Crossing of a hyperboloid to one side of its peak.

To begin the analysis of the echo trace, we define :
x2 + y2 = R2 (177)
where R = radius of revolution of the seamount at a depth z. Therefore :
R2 = 92 + 1 ^ ) (178)u2
Now the maximum slope (tan 6) is defined as the differential :
dztan 0 = ------- (179)
dRDifferentiating equation (178) :
dz q2 R- ^ r = V ~ (180)dR u2 z
Now :D = z2 tan 6 (181)
where (x2, y2, z2) = coordinates of the reflection point, D = horizontal displacement of the reflection point. Now by inspection of figure 30 :
m — x2 = D cos to (182)
p — y2 = D sin <ù (183)and :
mcos w = ------------------ (184)
and :
\ /m À - f p2
P
V ™ * + p2sin (à = ------- ---------- (185)
m
Combining the above equations :
( /2 + u2 Similarly :
q2 mx2 = ------- (187)
q2 + u2
Note that (y2) is a constant. Continuing :
z
q2 pU 2 = n (188)
cos 0
and by trigonometry and equation (180) :
(189)
q2 zcos 0 = ------------------------- (190)
y / q i ' z i - f i f i WTherefore :
(191)r
Combining equation (191) with the preceeding analysis and juggling terms we obtain the desired equation :

m2 (q2 + u2) r2...2 7~2' " 2------ --------------n T I --------2 = 1 (192)u? (q 2 -f- « — p2) q2 + « — p2
This is the equation for the recorded echo and is itself a hyperbola. I f P2 > q2 + y2> the axes of the hyperbolic echo trace are rotated 90°. There are certain limitations however. The echo begins to come from the rim of the atoll when : V(<72 4 - i i2) 2 — q* p2 m = - ^ — -------— 1 (193)
<7so long as pq < q2 + w2- W ith in these limits, the echo w ill ideally continue to come from the rim as the ship approaches the atoll and w ill have theform : , ,
(r 4- q )2 m 2H -------------= 1 (194)
P2 P2This is also a hyperbola. In practice, however, the echo probably will not be recorded as a perpendicular reflection from a slope > tan 30°. The echo therefore would come from the point where the edge of the sound cone cuts the seamount and for the upper portions of the seamount neither equation (192) nor equation (194) would hold. This w ill be noted in the two-dimensional case.
Track of the reflection point
Because (y2) is a constant, the track of the reflection point is in aq2 p
vertical (xz ) plane passing through y — -------------- .q2 - f u2
W e can therefore directly substitute equation (189) into equation (176), the equation of the hyperboloid. This gives the track of the reflection point over the seamount :
q 2 [ ( q2 + zz2)2 — q2 p2] u2 [Gq2 + u2)2 — q2 p2](195)
( q 2 + u2)2 (q2 + u2) 2This is a hyperbola with the same slope as the basic hyperbola of the
seamount but with a different vertex distance. Depending on the size of the constants, the axes of equation (195) may be rotated 90°. The application of equation (195) is subject to the limitations noted above.
6. — Hyperbolic Ridge
These two-dimensional figures may be regarded as the crossings of hyperbolic seamounts directly over the peaks or the crossings of hyperbolic ridges at right angles to their long axes.
The hyperbolic ridge may be split into several cases, depending on the orientation of the hyperbola. In the following, four cases are present. In the first three cases, the hyperbolae are in different orientations. The fourth case differs from the second case in using an arbitrary origin. In general, the choice of an arbitrary origin yields echoes that are not simple figures. Therefore, a hyperbolic ridge may be analyzed only under special conditions if a simple echo trace is to be obtained.

Case 1 (fig. 28) 2 2--------------------= 1 (196)
n2 q2
where n /q = a ratio determining the shape of the hyperbola, and n = depth to the top of the ridge.
The asymptotes to the seamount slope :
ntan 6a = — (197)
Now in order to obtain the figure of the echo trace we proceed as in the theoretical treatment of section III and obtain (r) as a function of (x ).
By definition from equation (12),
n
and from equation (13) :
f ( x ) = y/q* + a*
f i x )n x
q V<72 + z*
From equations (15), (198) and (199) :
n1m = x , 1 + ^
andx
q2 m
q2 + n2From equations (16), (198) and (199) :
ny/ (q » + n * ) 2* + q*r =
(198)
(199)
(200)
(201)
(202)Substituting equation (201) into equation (202), we obtain the desired relations : 721"
n2 q2 4- n2

The echo trace is therefore a hyperbola with asymptotes sloping :
ntan <pa = (204)
V<72 + " 2This relation holds only where the depth (n) to the summit o f the
seamount corresponds to the constant (n) o f the hyperbola.
Case 2 (fig. 29)
The equation o f this ridge is :
(205)q2 Ur
where q and u are constants determining the shape o f the hyperbola.
The asymptotes to the seamount slope :
tan 9a = — <1
(206)
The equation of the recorded echo trace may be obtained from that of the hyperboloid by letting p = 0. Equation (193) then gives :
j772 r2--------------------= 1 (207)<72 + u2 u2
This echo trace is again a hyperbola with asymptotes sloping :
utan <pa =
V ? 2 + « 2Equation (188) is valid here and may be rewritten :
q2 + u2m
(208)
(209)
Because x can never be less than q in this case, equation (207) holds forq2 _L u2
m ^ ------------ . For m less than this position which is the focal point, theq
reflection ideally comes only from the edge of the ridge at sea level and has the equation :

In practice, of course, the echo sounder probably w ill not record direct reflections from slopes greater than tan 30°. Therefore, the reflections w ill
q2 -f- u2cease being perpendicular at m -. For m less than this, the
■\/q2 — 3 u2reflection point w ill be that point where the edge of the sound cone intersects the ridge. The special equation for this part of the echo trace would be :
m t ) ‘ a2 -J-
Case 3 (fig. 30)
The equation of this escarpment is :
q2xz = ----
(211)
(212)
W e begin the analysis from equation (12) by a definition;
q2
and from equation (13)
/ Or)
f i x ) =
2x
2x2From equations (15), (213) and (214) :
4 x4 — q4m
4æ3
and from equations (16), (213) and (214) :n2
(213)
(214)
(215)
This has no simple solution.

Case 4 (fig. 31)
The equation of this ridge (a sunken atoll) is :
(x — p0) 2 (.z + n) 2
The asymptotes slope :
tan Qa = — <7
W e begin the analysis from equation (12) by the definition
, , , , / (x — Po)2f ( x ) ~ — n-\-u
and from equation (13) :
f i x )
q2
u (x — Pq)
1
q \/(x — p0Y2 — q2 From equations (15), (219) and (220) :
u (x — Pq) / u nm = x +
(217)
(218)
(219)
(220)
(222)? \q y (æ — po)2 — qa /This has a solution only where d « x and is therefore significant only where d = 0 (i.e. atoll at sea level).
7. — Semi-Elliptical Ridge
The equation of a semi-elliptical ridge (fig. 32) is :
x2 , ( f t - f n — z)2 _ i(223)
92 h2The nature of this figure precludes it from a simple analysis. However,
it has been analyzed from a numerical point of view and certain features emerge worth considering. For the numerical solutions, assume that we know the depth to the ridge (zx) :

The horizontal position o f the reflection point (xx) is :
xx = — y/h? — (ft + n — zx) 2 h
(224)
The horizontal position of the ship (m ) is :
h2 zxm = x x
r --------h2̂ ---------- iL gHh + n — zx) ^ J (225)
and the echo depth (r) is :
r = \Jzx -\ -(m — xx) 2 (226)Tw o examples are shown in figure (33) and figure (34). They are
somewhat realistic and easy to calculate. Figure (33) shows the echo for constants : h = e, g = 2e, and n — 0 (i.e. at sea level), e is a unit measurement.
Notice that in figure (33) the trace of the echo is very close to that o f a parabola out to the lim it of detection (m = 5), where the parabola is :
m2r = -------- b 3 e (227)
where ax — ± --------.0728
The trace is also similar to a hyperbola out to m — 2, where :
(r + a2) 2 m 2(228)
b2 c2where a2 = 2e, b2 — 25 e2, c2 == 33 1/3 e2.
Figure (34), the sea level case, gives a trace that resembles both a parabola and a hyperbola (out to m = 2 ), slightly favoring the parabola. The equations are :
0.127 m 2Parabola : dr = ------------ (229)
Hyperbola :
where a3 = 3.5 e.
0dr + a3) 2 nr

DISTANCE IN e UNITS
F ig . 33. — Echo trace o f a certain sem i-e iliptica l ridge at a depth o f 3 e units.
DISTANCE IN e UNITS
F ig . 34. — Echo trace o f a certain sem i-e llip tical ridge at the sea surface.
These relationships are logical, as may be seen by the following.
Equation (226) may be rewritten :r 2 = (Z' + n)2 + (m — xxy (231)
where z' = depth from the top of the ridge.

This equation represents a hyperbola where :(a) z' + n are constant. This is for n » 2' or m « or m »(b) m/x are nearly constant.
From a different point of view, the equation of the line that is the echo distance is :
m ~ * 1 _ r232)h2 xx g2 (h -j- /i — zx)
From thisg ^ j h + n - z j l (233)
h2 zx -f- g2(h + n — zx)
Combining equations (226) and (223) :
[ h 2 -12—r 2— 1 2 ,, " 7 ------- “ T (234)h2 zx + g2 (h + n — zx) J
Now when (n) is large, (z') is small for small values of x and for r s zx. Equation (234) then simplifies for small values of (z ) to :
m2r — zx = ------ (235)
a4Since also z ss n, then :
m2r — n — ------ (236)
a4
This is the equation for a parabola fulfilling the requirements for figure 33. As long as n » z' and r zx, the function is a parabola.
For figure 34 : zx ss r ^ n and zx « h, g. Equation (234) then becomes :
r _ Z l^ _ ^ L . (237)«5
As long as m is small, zx changes slowly and equation (237) represents a parabola.
V. — DEPRESSIONS
P. de V anssay de B l a v o u s (1930) and F. Sc h ü le r (1952) illustrated some exam ples of the behavior of the recorded echoes of depressions in the sea floor. W e shall go into m ore detail concerning two specific depressions— a V-notch and a circular depression. However, some of the other figures which have already been presented have application here. Both the hyperbolic and parabolic seamounts m ay under certain circumstances be used to represent depressions. W e shall deal w ith two-dim ensional features and cross them at right angles to their long axis.
1. — V-shaped Symmetrical Notch (i.e. simplified trench) (fig. 35)
Let the half-width of the notch be (w2) and (m ) be the horizontal position of the ship. Then, for m > w2, z = z0. For the region, w2 > m > x x where :
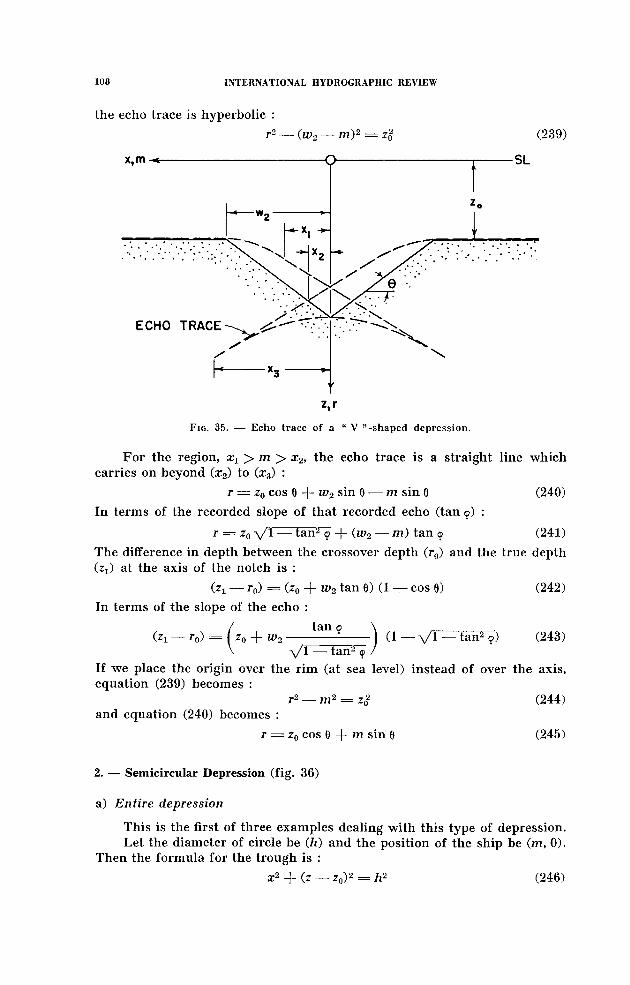
the echo trace is hyperbolic :
r2 — (w2 — m ) 2 = zl
F ig . 35. — Echo trace o f a “ V ” -shaped depression.
For the region, xx > m > x2, the echo trace is a straight line which carries on beyond (x2) to (æ3) :
r = z0 cos 0 -f- w2 sin 0 — m sin 0 (240)
In terms of the recorded slope of that recorded echo (tan <p) :
t — zQ \/l — tan2-̂ -)- (w2 — m ) tan <p (241)
The difference in depth between the crossover depth (r0) and the true depth (Zi) at the axis of the notch is :
Ozi — r0) = (z0 + w2 tan 0 ) (1 — cos 0) (242)
In terms of the slope of the echo :
tan <p(zx — r0) = ( z0 + w2 (1 — \/l — tan2 <p) (243)
\/l — tan2”If we place the origin over the rim (at sea level) instead of over the axis, equation (239) becomes :
r2 — m2 = z§ (244)and equation (240) becomes :
t = z0 cos 0 -)- m sin 0 (245)
2. — Semicircular Depression (fig. 36)
a) Entire depression
This is the first of three examples dealing with this type of depression. Let the diameter of circle be (h ) and the position of the ship be (m, 0).
Then the formula for the trough is :
x2 + (z — z0) 2 - -- h2 (246)

To find the character of the echo trace from the semi-circular depression (the lowest trace) we use the relations from equations (15) and (16) and find that it is a hyperbola :
(r — h )2 — m2 = Zq- (247)
OO
F ig . 36. — Echo trace o f a sem icircu lar depression.
The reflections from the rim of the depression give a hyperbolic echo trace (note that this echo trace continues to infinity) :
r2 — (h + m )2 = z02 (248)
At the crossover of the highlight echoes over the axis of the depression, the depth is :
r2 = z§ + h2 (249)
The difference in depth between that of equation (249) and the bottom of the hole (zx) is :
— r = z0 + h - Vzo + h2 (250)
b) A portion of a semicircular depression (fig. 37)
The equation for this depression is :
* 2 + [z — (z0 -f- B — h ) ] 2 — h2 (251)
where B = depth of trough and h = radius of trough. The width (w) of the trough is :
w2 = B (2h — B) (252)
The slope (tan 6 ) at the rim is :
B)tan 0 = —---------------- (253)
h — B

The distance (x3) to the end of the hyperbolic echo traces is :
Oo + B — h) VBT27T=-BTx3
x,m-
h — B
-O------
V
SL
F ig . 37. — Echo trace of a portion of a semicircular depression.
The depth (df3) of the end of the trace at (x3) is :
h z0(255)
h — B
The equation of the echo trace from the depression is :
(r _ h ) 2 — m2 = (z0 + B — h ) 2 (256)
The equation for the hyperbolic highlight echo trace from the rim is :
(h + m ) 2 = z% (257)
The crossover depth (r0) of the highlight at the centre o f the basin is :
t$ = z%-f- h2 (258)
The difference of depth between the crossover depth and the depth of the basin (zx) is :
*0 — *1 = zo + B — (259)The conclusion is that we can never directly see the bottom of a semicircular depression unless d < a — b.
c) A shallow trough depression (fig. 38)
The formula for this trough is :X2 + [ Z _j_ h _ ( Zo + B ) ] 2 = h2 (260)
Note that this is the same as equation (251). In the case of figure 38, the echo trace is coherent throughout. For the highlight echo trace from the

Wrim, the trace is hyperbolic for — > m > xlt where (m , 0 ) is the ship’s
2position and the width of the trough is :
w = V B — B)and
(h — z0 — B) VB(2/i — B)
h — BThe equation for this echo trace is :
r2 — (h — m ) 2 = z%
(261)
(262)
(263)
F ig. 38. — Echo trace of a shallow portion of a semicircular depression.
For x1 > x > 0, the echo trace is from the true bottom and the hyperbola that is recorded is obtained through equations (15) and (16) :
(r -—- h )2 — 77i2 = (z0 -j- B — h )2 (264)
Note that the form of the equation is the same as equation (256).
In the three-dimensional case, a crossing off-center o f a hemispheric basin compares w ith the hemispheric seamount and w ill merely change the constants of the foregoing equations but w ill not change the basic character of the echogram. For example, the three-dimensional analogue of equation (247) is :
(r — h ) 2 — m2 = z§ -f- p2 (265)
where p = shortest horizontal distance between the ship’s track and the axis o f the basin.
VI. — COMPLICATING FACTORS
1. — Motion Effect
The general equation for the motion effect w ill be given. This effect is the change in recorded depth of the sea floor due to the vessel’s forward motion. The difference is caused by the ship moving from the place where

the sound was emitted to a different position where it receives the returning echo, and thereby changing the distance to the bottom from the ship. The analysis is as follows.
In figure 39, the signal is emitted at position (1) and received at position (2) or vice versa. Now the controlling condition is that the travel times must be equal :
ts = t-± -(- t2 (266)
where ts = time for ship to move distance M, t1 = travel time o f signal to bottom, t2 = travel time of signal from bottom.
Therefore :M
(267)P l + P2Vn v„
where M is distance ship travels in time ts vs is ship’s speed,P x = ray path distance to bottom,P 2 = ray path distance from bottom, va = velocity of sound,
and :M — M i -j- M 2 (268)
where Mx and M2 — segments of distance M cut by perpendicular r from point of reflection on the bottom.

Now in figure 35 by construction N x and N 2 are perpendicular to r : therefore
N x = P i sin y (269)and
Mx = — — — (270)cos 6
where y = angle o f reflection at bottom0 = slope o f sea floor
Combining equations (269) and (270) :
M . - P . - Ü ü l - (271)cos 0
Similarly :
M2 = P2J ^ L (272)cos 0
Combining equations (267), (268), (271) and (272), we get for the angle of reflection :
sin y = cos 0 — (273)
Now by geometry :r -j- Mx sin 0X = P x cos y (274)
andr — M2 sin 0 = P 2 cos y (275)
Combining equations (273) and (274) :
r -)- — P x sin 0 = P i cos y (276)va
Similarly :
r ------- f_ p 2 sin 6 = P 2 cos y (277)V a
By simple trigonometry from equation (273) :
cos y = t / l ----- ~ cos2 0 (278)V v‘i
By geometry :
(279)cos 0
where zx — true depth at point of reflection.
Combining equations (276), (278), and (279) we obtain for the travel paths :
P x = Zl - X ------------------- --------------------- (280)cos 0
1 ------ - cos2 0------ - sin
P 2 = — — X -----------------------------------------(281)cos 0 r V} ~ v8 .
1 -------cos2 0-)------sin

The combined travel paths are :
2¾P1 + P2
cos eX
Now the recorded depth r ' is :P1 + P2
(283)
h V vaCOS2 0
COS 0(284)
V 81--------„2For the record :
Subtracting eq. (280) and (281) and obtaining the difference between the ray paths :
Pi — P;
2zx — tan 0v„
(285)
1v-
The difference between the recorded depth and the true perpendicular depth is :
Ï2--------
r' — r =cos 0
vicos2 0
1 — ■vl
(286)
Since for vessels, — is small (i. e. < 1) :v„
v's 1 vg1 — — cos2 0 = 1 — --------COS2
v2 2 v2
Eq. (288) then simplifies to :
V 8 /r ' — r = — — X — ( 1
cos 0 z;2
cos2 0
(287)
(288)
In numerical terms eq. (288) is insignificant. For example for z1 = 2 500 fathoms, vs = 12 knots, va = 4 800 feet/second and 0 = 30°, the evaluation of eq. (288) gives r' — r = .19 feet. However, there are still more aspects to the problem.
Now from eq. (267) and (282) :

Combining eq. (287) and (289) :
M s2 vs
Xcos 0
X
cos 0
1 —
(290)
2 d.X (291)
va cos 0
Using the data above for an example of eq. (290) :M = 144 feet.
Now the signal is received 72 feet horizontally from the perpendicular (r). The difference (Ar) between recorded depth and the true perpendicular to the sea floor at the receiving position is termed the motion effect :
1 v8Ar = — M sin 0 s — Zi tan
2(292)
Given the above data :Ar = 36 feet = 6 fathoms.
This information says that the recorded depth is insignificantly different from the depth at the midpoint of the travel time but that the difference of depth at the point recorded can be significant.
MOTION EFFECT IN FATHOMS (OR METERS)
F ig. 40. — Plot of motion effect versus the depth and slope of the sea floor.

This means that when approaching the given hill, the depths are 6 fathoms too great, and when leaving the hill, the depths are 6 fathoms too small. Therefore at equivalent positions on the two sides of the seamount, the echoes w ill be 12 fathoms different in depth. However, since at 12 knots the ship w ill travel over such a depth change in 6 seconds for this seamount, the correction is insignificant. Note that doubling the ship’s speed w ill double the motion effect.
Hyperbolae resulting from highlights are affected in a like manner and w ill be slightly offset. The motion effect increases with increasing width of the hyperbola, being a minimum over the peak.
The motion effect has been computed for specific examples to illustrate the problem and has been plotted in fig. 40 assuming a ship’s speed of 12 knots. A ll distances are in fathoms (or metres if one wishes to compare lengths in that unit). Note that the correction is insignificant in general.
2. — Correction for Sound Velocity
Each fathometer prints its depth based on the actual travel time of the sound signal times the assumed velocity. In the U. S., the assumed sound velocity is usually 4800 feet per second. For this section, it is assumed that the sea floor is horizontal and the sound is reflected vertically.
Now, in order to find the depth correction due to sound velocity, we first find :
zx = true depth, v0 — true sound velocity, t0 — true total travel time to sea floor, r = recorded depth,
va = assumed sound velocity.
4o
to
(293)
(294)
(295)
and :
(296)
Now :V0 = + Al>
where Av — total velocity correction.

Difference in depth (AZ) due to difference in sound velocity :
ApA Z = z1 — r = ------r (300)
Now :
A i> = - — r (301)i
where = difference between the true and assumed velocity per depth interval,
i = number of depth intervals,
the depth correction is :Si
AZ = —— r . (302)i v a
Various tables exist giving the sound velocity corrections. For example, there are the tables by M a t t h e w s (1939).
3. — Effect of Refraction of Sound Ray by Sound Velocity Changes in the Ocean
Because of the vertical variation of sound velocity in the ocean, a sound ray path in the sea is not straight. Depending on the depth, the ray bounces off a sloping bottom at a point other than the geometrical perpen-
F ig . 41. — Sound ray showing refraction at an interface between two water masses with sound velocities V* and V 2 respectively.
dicular from the ship. Knowing the sound ray profile, certain quantities can be calculated. The principles involved in the following are well known, but are included to make the discussion of this paper complete.

The calculations depend on S n e l l ’s law (fig. 41) :
v-i sin a(303)
v2 sin p
where vx and v2 = sound velocities in a substance having regions of different velocity separated by an interface.
The equation is valid regardless o f the number of velocity zones and interfaces. In this case, the parameters would be of the top layer and of the lowest layer observed. W e are assuming that the sound ray bounces vertically at its reflection point on the bottom. Therefore, at the bottom, the slope of the sea floor (tan 0) equals the slope o f the sound ray (tan (S).
^ nC6 ' v2 = vx -f- Ai» (304)
where (Aw) = change in sound velocity, then :
£ = s in -11 ( 1= sin_1[ ( 1 + J r ) s in “ ] (305)
Now from the geometry from fig. 42 :
= Sztan pwhere :
= a uniform depth increment, Sa: == its horizontal projection.
(306)
F ig. 42. — Echo sounding elements used in computing the effect of refraction of the echo sounding ray.

The total horizontal projection Gc0) of the sound ray is :
æ0 = 2 (fix) (307)
Similarly, the incremental length of the sound ray (8r) is :
§r = — (308)cos $
and the total length of the sound ray (r0) is :r0 = £(Sr) (309)
SOUND VELOCITY IN M ETERS/SECO ND
F ig. 43. — Plot of sound velocity versus depth at the Carnegie stationsNo. 128 and 129.
Now, perpendiculars (Si) and (S2) are constructed from the ship and from the reflection point respectively. The horizontal separation (X j) at the sea surface between these perpendiculars gives the horizontal separation of the true point of reflection from the assumed point of reflection used in the main part o f this paper.
X 1 = æ0— Zx tan 0 (310)where zx is the water depth at the point of reflection.
The difference in length (AS) between the two perpendiculars shows the difference between the assumed and real perpendiculars :
AS = X i sin 0 (311)The difference in length (AU) between the sound ray (r0) and the assumed perpendicular (S i) is :

The difference in length (AV ) between the sound ray (r0) and the true perpendicular (S2) is :
AV = r0 ------— (313)cos 9
Finally, the difference in depth (A W ) between the point of reflection and the assumed perpendicular is :
A W = X1 sin 9 cos 6 (314)
F ig . 44. — P lo t o f the effects o f the re fraction o f the echo sounding ray fo r a sea flo o r slope o f 5°.
By using a standard length of = 100 fathoms and combining profiles § 128 and § 129 from the Carnegie Cruise (fig. 43), we have arithmetically computed the above quantities for two examples : a0 = 5° and 20° where (a0) is the angle of incidence of the sound ray at the ship’s transducer. The parameters are plotted on figures 44 and 45. Under these circumstances, any sea depth may be used as long as that sea floor has a slope equal to tan {J of the sound ray at that depth.
Note that as long as the bottom slope is changing slowly, the effects of refraction are insignificant for angles less than 20° and somewhat larger.

DIRECTIO N OF SOUND RAY DIFFERENCE DIFFERENCE DIFFERENCE DIFFERENCE
F ig . 45. — P lot of the effects o f the re fraction of the echo sounding ray fo r a sea flo o r slope o f 20°.
VII. CONCLUSION
In general, the complications that we have mentioned are insignificant except for very detailed and specialized studies. Although, as ship speeds increase, the motion effect w ill increase in direct proportion to the speed, the increased distance covered per unit time will tend to make the correction impractical.
The section on the simple geometric figures is intended to give an insight in the interpretation of the fathometer records and to form a theoretical basis for such interpretations. Although the figures are highly idealized, the treatment shows the limitations of fathometer records as well as what may be seen. Despite some of the unrealistic figures, such as the hemisphere, some of the others bear a real resemblance to some submarine features. In general, of course, submarine features are not such simple figures. Yet using the basic principles, especially the slope relationships, we can show that the true feature is materially different from its echo trace. Terraces, for example, show up much more clearly on the corrected plots.

The hyperbola is obviously the dominant feature on the echograms, both theoretically and in nature. These hyperbolae are not the same. To illustrate, echo traces of three different figures are plotted in fig. 46.
DISTANCE U N ITS
i i i i *--- 1-------- 1--------1--------1-------- 1--------
F ig . 46. — Comparative plots of the hyperbolic echo traces from a highlight, a cone to one side of the ship’s track and a hemisphere.
Of some interest is the fact this study applies equally well to vertical radar navigation by airplane.
VIII. ACKNOWLEDGMENTS
This work has been partly supported by funds from the Institute of Marine Resources and the Scripps Institution of Oceanography, University of California and the Office of Naval Research, U. S. Navy. F. N. Spiess criticized the work and aided greatly in its clarification. H. W . M enard also reviewed the manuscript.
IX. REFERENCES
B u r in g t o n , R. S. (1957) : Handbook of Mathematical Tables and Formulas; Handbook Publishers, Inc., Sandusky, Ohio.
Co h e n , P. M. (1959) : Directional echo sounding on hydrographic surveys;Hydrog. Rev., Vol. 36, N° 1, pp. 29-42.
de V anssay de B l a v o u s , P. (1930) : Slope Corrections for Echo Sounding;Hydrog. Rev., Vol. 7, N° 2, pp. 50-63.
— (1933) : Slope Corrections for Echo Sounding; Hydrog. Rev., Vol. 10, No. 1, pp. 41-45.
Hayes, J. H. (1933) : Report on the sea trials of deep water echo sounding gear in H. M. S. Challenger and Oromonde; Hydrog. Rev., Vol. 10, No. 2, pp. 138-159.

H o f f m a n , J. (1957) : Hyperbolic Curves applied to echo sounding; Intern. Hydrog. Rev., Vol. 34, No 2, pp. 45-55.
L u s k i n , B. and I s r a e l , H. G. (Jan. 1956): PDR Mk V ; Tech. Rept. No 15 ONRO 27124 Geol.; Tech. Rept. No 12 CU-35-56 No. BSR 64547, Lamont Geol. Obs., Palisades, N. Y.
M a t t h e w s , D. J. (1939) : Tables of the velocity of sound in pure water and séa water; Hydrographic Department, British Adm iralty; London, England; 52 pp.
N are s , J. D. (1933) : Echo Sounding; Hydrog. Rev., Vol. 10, No 1, pp. 38-40.S c h ü l e r , F. (1952) : On the accuracy of configuration of sea bottom pro
files with high frequency echo sounders; Intern. Hydrog. Rev., Vol. 29, No 1, pp. 126-135.
S h a l o w i t z , A. L. (1930) : Slope corrections for echo sounding; Hydrog. Rev., Vol. 7, No 1, pp. 82-98.
S m i t h , E. S., S a l k o v e r , M. and J u s t i c e , H. K. (1943) : Analytic Geometry; John W iley and Sons, N. Y .; 298 pp.
S v e r d r u p , H. U. et al. (1944) : Observations and results in physical oceanography, Cruise V II of the Carnegie (1928-29); Oceanography IA ; Carnegie Inst. Wash. Pub. 545.
Y ates , R. C. (1947) : A handbook of curves and their properties; J. W . Edwards; Ann Arbor, Mich., 245 pp.