The initial phases of the 2008–2009 Mount Etna eruption: A multidisciplinary approach for hazard...
19
The initial phases of the 2008–2009 Mount Etna eruption: A multidisciplinary approach for hazard assessment A. Bonaccorso, 1 A. Bonforte, 1 S. Calvari, 1 C. Del Negro, 1 G. Di Grazia, 1 G. Ganci, 1 M. Neri, 1 A. Vicari, 1 and E. Boschi 1 Received 3 August 2010; revised 22 December 2010; accepted 5 January 2011; published 10 March 2011. [1] Between 2007 and early 2008, the Istituto Nazionale di Geofisica e Vulcanologia (INGV) monitoring networks on Etna volcano recorded a recharging phase that climaxed with a new effusive eruption on 13 May 2008 and lasted about 14 months. A dike‐forming intrusion was accompanied by a violent seismic swarm, with more than 230 events recorded in the first 6 h, the largest being M L = 3.9. In the meanwhile, marked ground deformation was recorded by the permanent tilt and GPS networks, and sudden changes in the summit area were detected by five continuously recording magnetic stations. Poor weather conditions did not allow direct observation of the eruptive events, but important information was provided by infrared satellite images that detected the start of lava fountains from the eruptive fissure, feeding a lava flow. This flow spread within the Valle del Bove depression, covering 6.4 km on the southeastern flank of the volcano in a few hours. The seismicity and deformation pattern indicated that the dike‐forming intrusion was propagating northward. It produced a dry fracture field, which generated concern for the possibility that the eruptive fissures could expand downslope toward populated areas. Monitoring and modeling of the multidisciplinary data, together with the simulations of ash dispersal and lava flows, allowed us both to infer the eruptive mechanisms and to provide correct interpretation of the ongoing phenomena, furnishing useful information for civil defense purposes. We describe how this approach of feedback between monitoring and research provides critical support to risk evaluation. Citation: Bonaccorso, A., A. Bonforte, S. Calvari, C. Del Negro, G. Di Grazia, G. Ganci, M. Neri, A. Vicari, and E. Boschi (2011), The initial phases of the 2008–2009 Mount Etna eruption: A multidisciplinary approach for hazard assessment, J. Geophys. Res., 116, B03203, doi:10.1029/2010JB007906. 1. Introduction [2] In the last few decades, several eruptions have taken place on Mount Etna in relatively short succession (approximately one event every 2 years) [e.g., Branca and Del Carlo, 2004; Allard et al., 2006], with lava flows causing serious damage to agriculture and crops, destroying roads and railway lines and dangerously threatening, fortu- nately without invading them, a number of towns. There have been numerous interventions urged by the Italian government to boost the monitoring systems and mitigate volcanic hazards, such as attempts to divert lava flows that threatened urban settlements [Barberi et al., 1993; Barberi et al., 2003]. After the start of the new millennium, the most recent eruptions have also been characterized by pro- longed explosive activity and ash emission that have created varying degrees of adversity to the Etnean cities and towns, and have often posed major problems, even paralyzing, to air traffic to and from the international airport of Catania. For this volcano particularly, the problem of understanding eruptive phenomena is of notable importance and also of considerable impact, owing to the high population density (about 1,200,000 people) on its slopes. [3] In recent years, the observations and monitoring sys- tems on Etna have been significantly upgraded by the Isti- tuto Nazionale di Geofisica e Vulcanologia (INGV), the scientific institution assigned to monitor and survey active Italian volcanoes. The quantity and quality of instrumental data, associated with the frequent recent eruptions, have enabled a better understanding of the phenomena in prog- ress and also to model different eruptive mechanisms. In particular, the INGV monitors and studies Etna volcano through its Department in Catania (INGV‐CT) by a multi- disciplinary surveillance (for a review of the activities and studies, see Bonaccorso et al. [2004a]). The INGV‐CT maintains different monitoring networks formed by hundreds of permanent stations (seismic, GPS, tilt, visual and thermal web cameras, gravity, magnetic, geochemical, etc.), man- ages the H24 surveillance service for the Civil Defense Department of the Italian government and gives prompt alert and updates on volcanic activity occurring in southern Italy. 1 Istituto Nazionale di Geofisica e Vulcanologia, Catania, Italy. Copyright 2011 by the American Geophysical Union. 0148‐0227/11/2010JB007906 JOURNAL OF GEOPHYSICAL RESEARCH, VOL. 116, B03203, doi:10.1029/2010JB007906, 2011 B03203 1 of 19
-
Upload
independent -
Category
Documents
-
view
3 -
download
0
Transcript of The initial phases of the 2008–2009 Mount Etna eruption: A multidisciplinary approach for hazard...

The initial phases of the 2008–2009 Mount Etna eruption:A multidisciplinary approach for hazard assessment
A. Bonaccorso,1 A. Bonforte,1 S. Calvari,1 C. Del Negro,1 G. Di Grazia,1 G. Ganci,1
M. Neri,1 A. Vicari,1 and E. Boschi1
Received 3 August 2010; revised 22 December 2010; accepted 5 January 2011; published 10 March 2011.
[1] Between 2007 and early 2008, the Istituto Nazionale di Geofisica e Vulcanologia(INGV) monitoring networks on Etna volcano recorded a recharging phase that climaxedwith a new effusive eruption on 13 May 2008 and lasted about 14 months. A dike‐formingintrusion was accompanied by a violent seismic swarm, with more than 230 eventsrecorded in the first 6 h, the largest being ML = 3.9. In the meanwhile, marked grounddeformation was recorded by the permanent tilt and GPS networks, and sudden changes inthe summit area were detected by five continuously recording magnetic stations. Poorweather conditions did not allow direct observation of the eruptive events, but importantinformation was provided by infrared satellite images that detected the start of lavafountains from the eruptive fissure, feeding a lava flow. This flow spread within the Valledel Bove depression, covering 6.4 km on the southeastern flank of the volcano in a fewhours. The seismicity and deformation pattern indicated that the dike‐forming intrusionwas propagating northward. It produced a dry fracture field, which generated concern forthe possibility that the eruptive fissures could expand downslope toward populated areas.Monitoring and modeling of the multidisciplinary data, together with the simulations ofash dispersal and lava flows, allowed us both to infer the eruptive mechanisms and toprovide correct interpretation of the ongoing phenomena, furnishing useful information forcivil defense purposes. We describe how this approach of feedback between monitoringand research provides critical support to risk evaluation.
Citation: Bonaccorso, A., A. Bonforte, S. Calvari, C. Del Negro, G. Di Grazia, G. Ganci, M. Neri, A. Vicari, and E. Boschi(2011), The initial phases of the 2008–2009 Mount Etna eruption: A multidisciplinary approach for hazard assessment, J. Geophys.Res., 116, B03203, doi:10.1029/2010JB007906.
1. Introduction
[2] In the last few decades, several eruptions have takenplace on Mount Etna in relatively short succession(approximately one event every 2 years) [e.g., Branca andDel Carlo, 2004; Allard et al., 2006], with lava flowscausing serious damage to agriculture and crops, destroyingroads and railway lines and dangerously threatening, fortu-nately without invading them, a number of towns. Therehave been numerous interventions urged by the Italiangovernment to boost the monitoring systems and mitigatevolcanic hazards, such as attempts to divert lava flows thatthreatened urban settlements [Barberi et al., 1993; Barberiet al., 2003]. After the start of the new millennium, themost recent eruptions have also been characterized by pro-longed explosive activity and ash emission that have createdvarying degrees of adversity to the Etnean cities and towns,and have often posed major problems, even paralyzing, toair traffic to and from the international airport of Catania.
For this volcano particularly, the problem of understandingeruptive phenomena is of notable importance and also ofconsiderable impact, owing to the high population density(about 1,200,000 people) on its slopes.[3] In recent years, the observations and monitoring sys-
tems on Etna have been significantly upgraded by the Isti-tuto Nazionale di Geofisica e Vulcanologia (INGV), thescientific institution assigned to monitor and survey activeItalian volcanoes. The quantity and quality of instrumentaldata, associated with the frequent recent eruptions, haveenabled a better understanding of the phenomena in prog-ress and also to model different eruptive mechanisms. Inparticular, the INGV monitors and studies Etna volcanothrough its Department in Catania (INGV‐CT) by a multi-disciplinary surveillance (for a review of the activities andstudies, see Bonaccorso et al. [2004a]). The INGV‐CTmaintains different monitoring networks formed by hundredsof permanent stations (seismic, GPS, tilt, visual and thermalweb cameras, gravity, magnetic, geochemical, etc.), man-ages the H24 surveillance service for the Civil DefenseDepartment of the Italian government and gives promptalert and updates on volcanic activity occurring in southernItaly.
1Istituto Nazionale di Geofisica e Vulcanologia, Catania, Italy.
Copyright 2011 by the American Geophysical Union.0148‐0227/11/2010JB007906
JOURNAL OF GEOPHYSICAL RESEARCH, VOL. 116, B03203, doi:10.1029/2010JB007906, 2011
B03203 1 of 19

[4] Following a sequence of rather dramatic and destruc-tive eruptions between 2001 and 2006, Etna started a newrecharging phase from 2007. This culminated with a dike‐forming intrusion on 13 May 2008 and was accompanied bya strong seismic release, marked permanent ground defor-mation, sudden magnetic changes and by violent lavafountaining characterizing the first phase of the eruption.[5] The exceptional instrumental quantity and quality of
data, coupled with the frequent recent Etna eruptions, haveenabled modeling different eruptive mechanisms, leading toa better understanding of the phenomena in progress. Thework presented here, besides focusing on the last eruptionbegun in May 2008 and lasted about 1 year, comprisesimportant innovative aspects concerning the knowledge oferuptive mechanisms from a broad and multidisciplinaryperspective, and simulations of ongoing volcanic processessuch as ash dispersal and lava flow expansion.[6] After an overview on the recent eruptive activity of
Etna (section 2), in section 3 we describe the rechargingphase which preceded the eruption. Then the crucial momentsof the beginning of the eruption with the first important stagesof the dike‐forming intrusion are outlined. We describe theintrusion and eruption characteristics in section 4, highlight-ing the peculiarity of this event on the basis of seismicity,seismic tremor analysis, ground deformation, and geophysi-cal signals, accompanied by an analysis of the extensiveground fracture field formed on the highest northern sectorof Etna. In section 5, the modeling results on the 2008 dikeintrusion are also presented. In section 6, the main hazardimplications of this eruption are discussed, describing the lavaflows and ash plume simulations applied to face this eruptionthat proved extremely useful for civil protection purposes.Finally, in section 7 we discuss the interpretation of thiseruption, the explanation of its new emplacement mechan-isms, and the general implications for volcano hazard andhow we managed them.
2. Recent Eruptive Activity at Mount Etna
[7] Mount Etna volcano is located in southern Italy (Sicily)and is the highest active volcano in Europe recently measuredat 3329 m [Neri et al., 2008]. During the past 400 years, thevolcano has produced over sixty flank eruptions [Behnckeand Neri, 2003a; Branca and Del Carlo, 2004; Behncke etal., 2005], while the summit craters have been almost con-tinuously active, with persistent degassing and frequentexplosive activity at the vents on the crater floor (Figure 1).[8] The 1991–1993 flank eruption [Calvari et al., 1994;
Stevens et al., 1997] was the most important eruption in thelast three centuries both in terms of duration (472 days) andvolume of lava erupted (about 235 × 106 m3). Immediatelyfollowing the eruption, the volcano showed a persistentdegassing (April 1993 to June 1995), then an almost con-tinuous summit activity, increasing in intensity between July1995 and June 2001 [Allard et al., 2006]. Between 1993 and2001, an overall recharging phase is well documented by the(is clearly observable in the) ground deformation, whichshowed an almost continuous expansion of the whole volcanoedifice [e.g., Bonaccorso and Davis, 2004; Bonaccorso et al.,2005; Bonforte et al., 2008]. This phase culminated with thetwo violent and dramatic explosive‐effusive flank eruptions
of July‐August 2001 and October 2002 to January 2003[Behncke and Neri, 2003b; Andronico et al., 2005]. Dike‐forming intrusions related to both eruptions followed aneccentric path (i.e., bypassed the central conduit system[Acocella and Neri, 2003]) on the south flank, resulting instrong and prolonged explosive activity, intense seismicity,and marked ground deformation. Conversely, the NEbranches of the 2001 and 2002–2003 eruptive fissures ori-ented directly from the central conduit, producing an erup-tion with a different composition of largely degassed magma[Behncke and Neri, 2003b; Andronico et al., 2005]. Theunusual and long‐lasting explosive activity from the southfissures caused major problems for road traffic and disruptedair travel at the International Airport of Catania. Lavaflows in 2001 expanded south and threatened the village ofNicolosi (Figure 1). The NE lateral intrusion in 2002–2003also promoted a marked acceleration of the eastward slidingof the SE flank of the volcano, therefore marking a signif-icant change in the volcano’s dynamic regime [e.g., Neri etal., 2004, 2005, 2009; Rust et al., 2005; Walter et al., 2005;Bonaccorso et al., 2006; Bonforte et al., 2007, 2009; Puglisiet al., 2008; Ruch et al., 2010].[9] After these flank eruptions and between 2003 and
2008, the volcano showed two interesting phenomena: (1) arenewal of moderate inflation/deflation cycles both preced-ing and accompanying the 2004–2005 and 2006 flankeruptions and (2) a constant and marked eastward sliding ofthe eastern flank of the volcano [Bonforte et al., 2008; Neriet al., 2009; Solaro et al., 2010]. The effusive activity in2004–2005 was fed by a dike‐like intrusion that intersectedthe central conduit of the volcano [Burton et al., 2005;Neri andAcocella, 2006]. This eruption was relatively “passively”triggered, in the sense that the draining fissures were causedby the exceptional sliding rate (∼7–10 cm yr−1) recorded inthe eastern flank of the volcano by the GPS network[Bonaccorso et al., 2006]. As a result, the eruption onset wasunusually “silent” because it was neither a forerunner noraccompanied by the common explosive activity at the summitcraters. There was no significant increase in the gas emissionfrom the summit craters, no seismic swarms, seismic tremoror seismicity of any kind, no ground deformation changes,all phenomena that are usually observed during an intrusionprocess on Mt Etna [Burton et al., 2005; Bonaccorso et al.,2006].[10] After the end of the 2004–2005 eruption, the GPS
network recorded a renewal of the type of inflation pre-cursor that led to the 2006 eruptions. Besides the inflation‐deflation sequence preceding and following lava output(Figure 2), the eastern flank of the volcano showed seem-ingly independent dynamics with a fairly constant seawardmotion [Puglisi and Bonforte, 2004; Bonforte and Puglisi,2006; Bonaccorso et al., 2006; Neri et al., 2009; Solaroet al., 2010]. The 2006 eruptions marked the reactivationof the Southeast Crater (SEC) (Figure 1), which had beeninactive since July 2001 [Neri et al., 2006]. Strombolianactivity and lava overflows characterized the summit vent ofthis crater and were accompanied by lava emission fromWNW‐ESE fissures that opened at the base of the cone[Behncke et al., 2008, 2009]. Similar to the 2004–2005phase, the onset of the July 2006 eruption was not accom-panied by evident changes of geophysical parameters,
BONACCORSO ET AL.: ETNA MULTIDISCIPLINARY HAZARD ASSESSMENT B03203B03203
2 of 19

including seismicity or significant explosive activity fromthe summit craters [Behncke et al., 2008].[11] After the end of the 2006 eruptive phases, the GPS
network indicated again a volcano inflation (Figure 2d)[Aloisi et al., 2009]. However, this time, unlike the previous2004–2005 and 2006 cases, the 2008–2009 eruption waspreceded by clear volcanological precursors, such as the
several lava fountaining episodes which occurred fromMarch 2007 until 10 May 2008. Moreover, since January2008, the seismic network recorded a strong increase inseismicity mainly due to many seismic swarms taking placein the southern and western flanks of the volcano (Figure 3)(http://www.ct.ingv.it). The recharge phase culminated with
Figure 1. Etna map with the lava flows of the 2001–2007 flank eruptions. VOR, Voragine; BN, BoccaNuova; NEC, Northeast Crater; SEC, Southeast Crater. Top inset shows detail of the summit craters areaupgraded in June 2007 [from Neri et al., 2008]. Bottom inset shows the extent of the unstable sectors(1) of Mount Etna; (2) the assumed offshore boundary of the spreading area; (3) the directions of movementof the sliding sectors; and (4) boundaries of the sliding sectors to the north (Pernicana Fault system, PFS) andto the S‐W (Ragalna Fault System, RFS).
BONACCORSO ET AL.: ETNA MULTIDISCIPLINARY HAZARD ASSESSMENT B03203B03203
3 of 19

the 13 May 2008 to 6 July 2009 flank eruption, which wedescribe in this paper focusing mainly in the initial phase.
3. The 2007–2008 Recharging Phase
3.1. The Activity of January 2007 to April 2008:The Preparatory Phase
[12] After the deflation of the volcano edifice associatedwith the 2006 eruptions (Figure 2c), during 2007 and until12 May 2008 a radial centrifugal pattern of the displacementvectors was recorded by the GPS network (Figure 2d). Theareal dilatation of the volcano edifice showed a nearlyconstant positive trend, recovering the contraction that
cumulated during the 2006 eruptions. During this period,more than 1200 earthquakes with magnitude ranging from0.7 to 3.3 were recorded by the local permanent seismicnetwork managed by INGV, comprising 26 seismic stationsinstalled on the flanks of the volcano (http://www.ct.ingv.it).About half of the earthquakes were relatively localized, asshown in Figures 3a and 3b. The spatial distribution ofseismicity showed a fairly usual seismic pattern for MountEtna: most of the events were localized in the eastern side ofthe volcanic area, while deeper focal depths characterize thewestern side. Higher rates of occurrence and shallower foci(<5 km) were recorded in the eastern flank, while the deeperseismicity on the western side (more than 10 km below sea
Figure 2. Example of deflation/inflation cycles: (a) deflation accompanying the 2004 eruption, (b) infla-tion preceding the 2006 eruption, (c) deflation accompanying the 2006 eruption, and (d) inflation preced-ing the 2008 eruption.
BONACCORSO ET AL.: ETNA MULTIDISCIPLINARY HAZARD ASSESSMENT B03203B03203
4 of 19
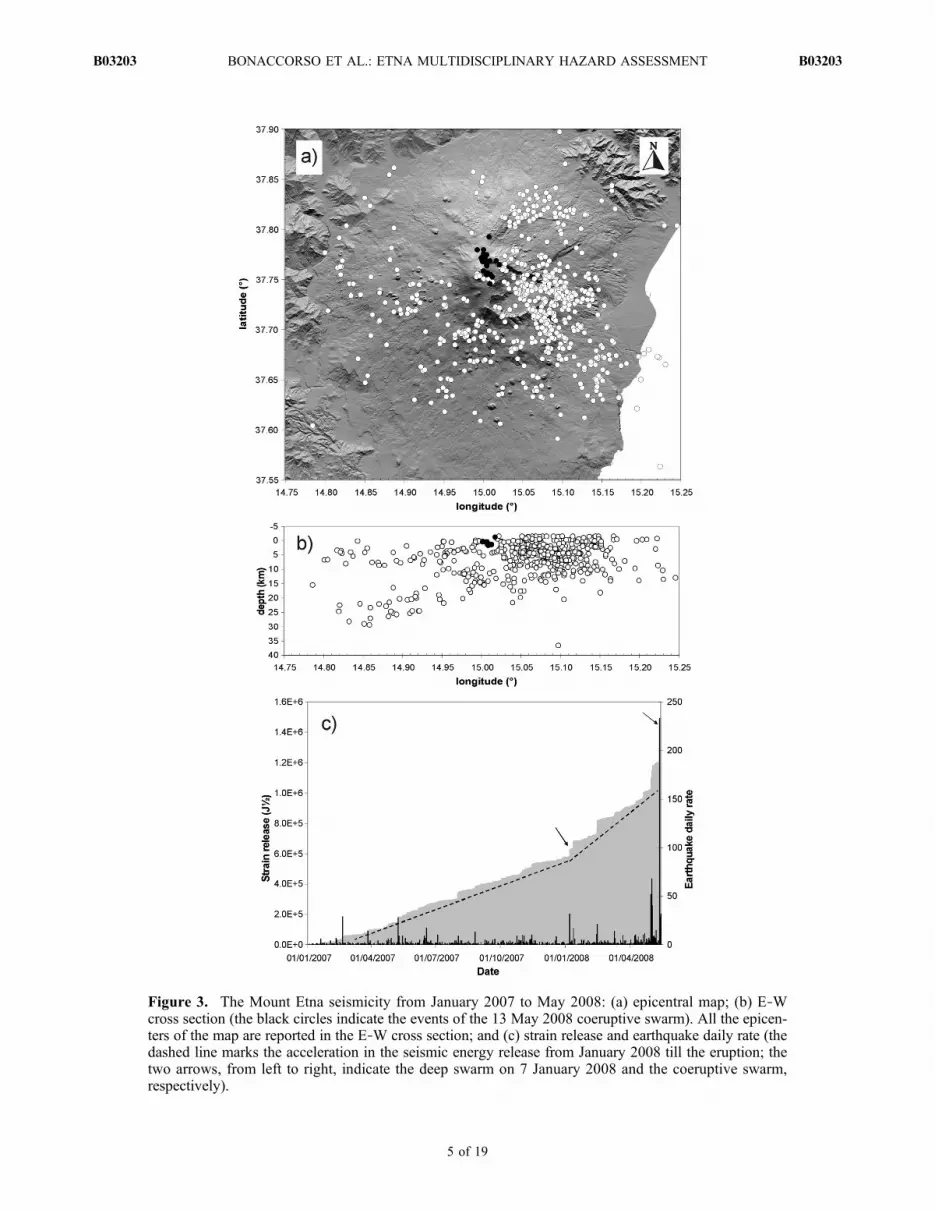
Figure 3. The Mount Etna seismicity from January 2007 to May 2008: (a) epicentral map; (b) E‐Wcross section (the black circles indicate the events of the 13 May 2008 coeruptive swarm). All the epicen-ters of the map are reported in the E‐W cross section; and (c) strain release and earthquake daily rate (thedashed line marks the acceleration in the seismic energy release from January 2008 till the eruption; thetwo arrows, from left to right, indicate the deep swarm on 7 January 2008 and the coeruptive swarm,respectively).
BONACCORSO ET AL.: ETNA MULTIDISCIPLINARY HAZARD ASSESSMENT B03203B03203
5 of 19

level) was linked to the regional structural systems trendingNE‐SW and NNW‐SSE [Gresta et al., 1990]. An acceler-ation in the strain release curve took place on 7 January2008 in concomitance with a deep seismic swarm (30events, Mmax = 2.8) in the SW sector of the volcanic area(Figure 3c). Some days later, on 12 January, another deepseismic swarm occurred in a neighboring area (14 events,Mmax = 3.2) in the west flank. Thus, the temporal distri-bution of seismicity preceding the 2008–2009 eruptionhighlights a volcano unrest period of a few months beforethe beginning of the volcanic activity.[13] During 2007–2008, the eruptive activity of Etna was
characterized by seven episodes of lava fountains from SECaccompanied by lava flow emission. The first six occurredduring 2007 on 29 March, 11 April, 29 April, 7 May, 4–5 September, and 23 November, with activity changingfrom intense Strombolian explosions to lava fountaining andsustained eruption columns, accompanied by lava outflowfrom fissures opened at the base of the SEC cone in WNW‐ESE, N‐S and E‐W directions. The last two episodes of2007 were characterized by strong lava fountaining, tephraemission and the production of extensive lava flows[Andronico et al., 2009]. In particular, the 4–5 Septemberlava fountaining lasted for an unusually long time (more
than 10 h) with the same strong intensity, and produced a∼4.6 km long lava flow field into the Valle del Bove.
3.2. The 10 May 2008 Lava Fountain: The Prelude
[14] On 10 May 2008 one of the most violent explosivephases since 2003 occurred at Mount Etna, anticipating byonly 3 days the next effusive and long‐lasting flank erup-tion. Starting at ∼1400 UT a new vent opened at the easternbase of the SEC (Figure 4). This vent erupted intense lavafountaining characterized by an unusually high rate thatfed a lava field covering ∼2 km2 of land in the barrenValle del Bove in only 4–5 h and reaching a length of 6.4 km.An approximate estimation of the erupted volume, calculatedon the basis of a mean lava flow thickness of 0.5 m, is∼0.7 106 m3.[15] Volcanic thermal anomalies were automatically
detected by SEVIRI infrared channels (spatial resolution3 km2 at Nadir, temporal resolution 15 min, downloaded byEUMESAT, http://www.eumetsat.int) on board the Meteosatsatellite during the 10 May lava fountain from 1400 to1900 UT. The whole time period was characterized by thickcloud cover, a condition that causes an underestimation of theradiance values. Despite this meteorological situation, thisfountain was determined to be the most powerful of thoserecorded by SEVIRI sensor between 2007 and 2008, reachingat 1500 UT a maximum value of measured radiative power of∼15 GW. In Figure 5, the behavior of cumulative radiativepower calculated at all hot pixels per image is reported for thewhole period of the fountain. For three significant instants,the beginning (1400 UT), the strongest phase (1500 UT)and the decreasing phase (1730 UT) of activity, the geos-patial location of the detected anomalous pixels is shown ona Google Map Service base. The colors of the pixels areassociated with the intensity of the radiative power calculatedfor each pixel. Starting from the radiative power, it is possibleto compute an estimation of the effusion rate [Harris et al.,2005; Vicari et al., 2009], finding a mean value of about25 m3s−1. However, given the filtering effect provided byclouds covering the eruptive zone, the radiative power, andthus the effusion rate may be underestimated. Nonetheless,using the formula proposed by Calvari and Pinkerton [1998],a mean effusion rate of 30 m3 s−1 is needed in order toobtain a 6.4 km long lava flow. The ash plume dispersedfirst toward the north, then rotated NE with an ash falloutaffecting a wide area on the north and NE lower flanks ofthe volcano. At 1700 UT, the ash plume dispersal alsoimpacted the airport of Reggio Calabria (distant ∼100 kmfrom Catania), increasing concerns for the possible disrup-tion of air traffic. However, by that time the explosive andeffusive activity had gradually decreased, and by 1800 UTon the same day a decrease of volcanic tremor accompaniedthe end of the explosive and effusive activities. No eruptiveactivity characterized the summit of Mount Etna for 3 days,when eventually a new explosive and effusive phase resumedfairly close to the northern base of the SEC.
4. The 2008–2009 Flank Eruption
[16] On 13 May 2008 a strong shallow seismic swarmpreceded and accompanied the onset of the eruption(Figure 3). Between 0839 and 1552 UT, in the northeasternsummit area of the volcano, 241 earthquakes were recorded,
Figure 4. Photo of the 10 May 2008 explosive activitytaken from the southern flank looking northward at 1800 masl altitude.
BONACCORSO ET AL.: ETNA MULTIDISCIPLINARY HAZARD ASSESSMENT B03203B03203
6 of 19

most of them occurring in the first 2 h. The depths of thefoci ranged between 1.5 km below sea level (bsl) and 1.5 kmabove sea level (asl), tending to be shallower toward thenorth. The most energetic events were recorded at 1007(MD = 3.2) and 1213 UT (MD = 3.3). The spatiotemporaldistribution of the earthquakes clearly showed an attempt ofthe feeder dike‐forming intrusion to migrate in the northernsector of the summit area of the volcano from the beginningof the swarm until 0930 UT (Figure 6). From 0930 UTonward, coincident with the beginning of the lava foun-taining from the eruptive fissure, the number of earthquakesdrastically decreased and the rupture locations turned backtoward the south in the area where the eruptive fissureeventually opened.[17] A description of the uprising magma intrusion was
provided by the tremor source location performed by usinga grid search approach [Gottschämmer and Surono, 2000;Battaglia et al., 2005; Di Grazia et al., 2006, 2009]. A fewhours before the beginning of the eruption, volcanic tremorshowed significant variation both in the amplitude and thesource location (Figure 7). Starting from 0640 UT, thetremor source locations tended to be shallower and moving
toward the east (Figures 7a and 7b). Such a sharp migrationof the tremor source centroid highlighted the imminence ofthe eruption as well as the magma pathway and the eruptivefissure position. The volcanic tremor amplitude rapidlyincreased at the same time as the source migration andreached its maximum at 1010 UT, exceeding the maximumlevel recorded during the lava fountain on 10 May 2008(Figure 7c). Afterward, the tremor amplitude abruptlydecreased in the successive hours and then more slowlydecreased on the following days (D. Patanè, Quadro disintesi e aggiornamento al 19 Maggio 2008 sullo stato diattività sismica dell’Etna, INGV‐CT internal reportWKRSM20080519, 2008, hereafter cited as D. Patanè,internal report, 2008).[18] Due to the cloud cover and fog around the volcano,
the permanent webcams network was not able to record theexplosive activity. However, important information wasprovided by the SEVIRI sensor. In Figure 8 the SEVIRIsequence is recorded from 0915 to 1030 UT, when it waspossible to track the evolution of the ash plume (yellowpixels) until the first hot spot related to eruptive activity (redpixels). No eruptive phenomena are observable in the image
Figure 5. (d) Radiative power during 10 May 2008 lava fountain by SEVIRI data. (top) Three instantsare reported on Google Map service: (a) the beginning (green dot in Figure 5d); (b) the strongest phase(blue dot in Figure 5d); and (c) the decreasing phase (yellow‐orange dot in Figure 5d).
BONACCORSO ET AL.: ETNA MULTIDISCIPLINARY HAZARD ASSESSMENT B03203B03203
7 of 19

acquired at 0915 UT. The next image acquired at 0930 UTdetected the beginning of an ash plume moving toward theNE, which was associated with the lava fountain from thenorthern part of the eruptive fissure. Instead, the first hotspot, due to the increased lava output and thermal anomaly,was detected at 1030 UT.[19] Coincident with the beginning of the lava fountaining
and lava flow output from the eruptive fissure, images fromModerate Resolution Imaging Spectrometer (MODIS)aboard EOS satellites (spatial resolution 1 km2, temporalresolution 6 h) were also analyzed showing the first hot spotat 0945 UT. This coarse resolution is owing to the fact thatthe ground‐projected area of SEVIRI’s IFOV (instant fieldof view) is more than 1 order of magnitude greater than thatof MODIS; thus, it cannot distinguish thermal anomalies assmall as those detectable by the MODIS [Roberts et al.,2005]. Radiative transfer modeling suggests that SEVIRIshould be able to detect and characterize volcanic eventswhose radiative power ranges from 100 to 1000 MW perpixel, implying that for the typical range of volcanic erup-tion temperatures (900–1200 K), the minimum area detect-able should be of about 100 m2 [Roberts et al., 2005].[20] The eruption initiated with a system of eruptive fis-
sures propagating SE from the summit craters toward thewestern wall of the Valle del Bove. Lava fountains eruptedfrom a N140°E fissure extending between 3050 and 2950 masl. In 2 h, the eruptive fissure propagated downslope andsoutheastward, curving N120°E, and reaching the minimumelevation of 2620 m asl (Figure 9). Meanwhile, Strombolianactivity migrated from the upper segment of the fissure to its
lowest portion. Here, a lava flow erupted at high rates fromtwo main vents (V1 and V2 in Figure 9) and rapidlyexpanded in the barren Valle del Bove, reaching 6 km inlength and the lowest elevation of 1300 m asl. After theinitial phase of the eruption, when the lavas emerged from aN140–120°E fissure (3050–2620 m asl), a ∼N‐S dry, 2450 mlong and 200–800 m wide asymmetric graben, formed in theupper portion of the NE Rift (3320–2620 m asl), in aroughly flat area (i.e., dipping ∼5–10°N). Fractures in thisarea were high‐angle extensional features across which theground surface was horizontally displaced by up to 0.1 m,with a maximum vertical movement of 0.2 m. This fracturefield grew for a few hours, presumably until the earlyafternoon on 13 May, because poor weather conditions didnot allow continuous observations. The extension and thegeometry of the graben were compatible with a northwarddike‐forming intrusion located at a depth of about 800 mwith respect to the topographic surface [Pollard et al., 1983;McGuire et al., 1991; Day et al., 1999; Billi et al., 2003]. Noeruptive activity was involved with these fractures.[21] The lava flow emplaced on 13 May expanded within
the upper Valle del Bove and reached a maximum distanceof 6.4 km on the first day. The following days the effusionrate showed a marked decline (Figure 10), accompanied bya gradual up‐slope migration of the active lava flow fronts,by deepening of the lava level within the master channel,and by a decrease in the intensity of the explosive activityfrom the uppermost portion of the eruptive fissure. Thedecline in magma supply and the drainage of the feeder dikeresulted, by the end of May, in an obstruction and inward
Figure 6. Location of the seismic swarm preceding and accompanying the onset of eruption on 13 May2008 plotted as function of latitude versus time. The size of the circles is proportional to the duration mag-nitude (MDmin = 1.0, MDmax = 3.3). The line is a fourth‐order polynomial curve fitting the data set. insetshows the map of the summit area with the position of the epicenters.
BONACCORSO ET AL.: ETNA MULTIDISCIPLINARY HAZARD ASSESSMENT B03203B03203
8 of 19

collapse of the walls of the SEC summit crater and of theeffusive vent zone at its eastern base, choking off themagma supply allowing to build up within the volcanocausing a further up‐slope migration of the active flowfronts, from 1300 m to 2200 m asl. After this date, a sudden
increase in seismic tremor raised a new alert at least fourtimes, on 28 May to 8 June, on 20 June, on 4 July, and on 9–11 July. These were accompanied by significant increase inthe SO2 gas flux from the summit craters, and increase in theeffusion rate that became twice the previous value with adelay of a few days (Figure 10) causing the lava flow frontsto extend again to low elevations, as well as increase in theexplosive activity and an increase in the effusion rate fromthe upper vents along the eruptive fissure. During thisperiod, deep explosive activity started from the NortheastCrater (NEC) (Figure 1), and an intense degassing produceda significant gas column from the pit at the eastern base ofthe SEC that was previously obstructed by inner collapses.In the following month, the effusion rate progressivelydecreased. The eruption ended on 6 July 2009, after almost14 months of continuous lava effusion.
5. Geophysical Modeling of the Intrusive Process
[22] On the morning of 13 May 2008, the continuoussignals recorded at the permanent magnetic, tilt and GPSstations recorded significant changes during the intrusion[Napoli et al.; 2008; Aloisi et al., 2009]. Until 0900 UT, nosignificant changes were observed at all magnetic stations(Figure 11, see Figure 12 for names and codes of the sta-tions). Soon after, large negative changes in the localmagnetic field occurred at the stations set on the northernflank of the volcano within a few hours coinciding with thenorthward epicentral migration of the seismic events. Thetotal intensity decreased by about 2.0 nT at PDN and 1.8 nTat PTL. Both sensors of PDG show the largest changeamong all the other sites. The total intensity of the magneticfield decreased more than 6.5 nT during the 5 h period (from0900 to 1400 UT). The amount of the decrease fell offnorthward and no significant variations are observed atDGL. During the same period, the magnetic stations on thesouthern flank of the volcano showed minor variations. Inparticular, a negative change was detected at BVD (−1.8 nT),whereas the magnetic field at CST was almost unchanged. Aslight positive variation of 1.8 nT was observed at BCN[Napoli et al., 2008]. The magnetic data clearly show a rapidchange from 0900 to 1000 UT, when most of the earth-quakes (about 150 of 230) were recorded (D. Patanè,internal report, 2008). Then, a decrease in the rate of mag-netic variations was observed from 1000 to 1400 UT duringwhich a reduction in the earthquake rate was observed. Afterthe seismic swarm ended, no further magnetic variationswere detected at all stations [Napoli et al., 2008].[23] Very sharp tilt changes started first in the summit area
where the largest variations (about 100 mrad) were detectedfrom 0840 UT at PDN station, which was the closest to thecrater area, and tilt variations were successively observed inthe middle flanks of the volcano, but with strong attenua-tion. MSC station, which is on the upper western flank(Figure 12), recorded about 10 mrad; clear but minorchanges were recorded in the other stations on the middleflanks (Figure 11). The summit stations of the continuousrecording GPS network showed horizontal displacements ofa few tens of centimeters. Smaller variations of a fewcentimeters were detected at the other stations. The defor-
Figure 7. Volcanic tremor from 1 May 2008 to 13 May2008: (a) epicentral map of the source tremor locations;(b) E‐W cross section; and (c) tremor amplitude. The reddots refer to events recorded on 13 May from 0640 UT,in concomitance with the first significant variations in tremoramplitude and location preceding the onset of the eruption.The tremor amplitude sharp increase on 10 May is relativeto the lava fountaining episode.
BONACCORSO ET AL.: ETNA MULTIDISCIPLINARY HAZARD ASSESSMENT B03203B03203
9 of 19

mation pattern was radial with respect to the summit area[Aloisi et al., 2009].[24] Analytical solutions were used to model the geo-
physical observations and to infer the intrusion sourceparameters. Magnetic data inversion indicated the responseto a tensile mechanism with an intrusion crossing the vol-cano edifice along an approximately NNW–SSE direction inthe northern flank attributable to piezomagnetic effect(Figure 12a). The estimated intrusive dike, located withinthe zone of the seismic swarm that occurred during magmapropagation, generated a deformation pattern that also fitswell the ground deformation recorded by the continuousGPS network operating on Mt Etna [Napoli et al., 2008].This analytical model provided a first acceptable represen-tation of the magma intrusion by using a single intrusionsource (Figure 12a).[25] As also suggested by the temporal evolution of the
seismic events and structural field evidence, an attempt toimprove the source geometry was performed by Aloisiet al. [2009], who divided the intrusion into two phases(Figures 12b and 12c). In particular, as suggested by theseismicity pattern and by the summit tilt gradient change,the intrusion time was divided into two intervals from 0840to 0930 UT and from 0930 to 1700 UT, which represent thephases of the ascending vertical dike‐like intrusion and afollowing attempt of the magma to penetrate laterally towardthe north, respectively. The first dike generated the intrusion
Figure 8. SEVIRI channel 4 calibrated radiance acquired during 13 May 2008. Yellow pixels are asso-ciated with the radiation from the ash plume, while red pixels are thermally anomalous.
Figure 9. Detailed map of the fracture field formed on13 May 2008. The insets show the strike of the eruptive(bottom insets) and dry (top inset) fractures.
BONACCORSO ET AL.: ETNA MULTIDISCIPLINARY HAZARD ASSESSMENT B03203B03203
10 of 19

in the high southern flank and the following eruptive fissure,while the lateral intrusion in the northern flank stoppedwithout lava emission but induced a dry fracture field.
6. Simulation and Prediction of the Ash Dispersaland Lava Flows
6.1. Ash Dispersal and Fallout Simulation
[26] During the previous long‐lasting explosive activity ofthe 2001 and 2002–2003 eruptions, the decisions of open-ing/closure of the air traffic were adopted following thedecisions of ENAC, the national organization for civil avi-ation. The final ENAC decisions lacked precise scientificevaluations and this has created problems and uncertainties.[27] As result of the 2006 eruption, characterized by a
permanent high Strombolian activity, the Italian Departmentof Civil Defense (DPC) and INGV planned to implement asurveillance system for both monitoring the ash dispersal ofthe explosive activity and for supporting the DPC’s objec-tives and decisions. The INGV set up an ash surveillancesystem composed of monitoring, forecasting and validation[Scollo et al., 2009]. The ash monitoring of the explosiveactivity was controlled by signals from seismicity, seismictremors and images from permanent visible and thermalcameras. Moreover, a further validation of the ongoingphenomena was obtained by the images from geostationarysatellite (Meteosat).[28] The ash dispersion forecasting was performed by
using the meteorological forecast data for the next 48 h,received every morning from the Italian Air Force, and by
running different air dispersal and fallout models such asHAZMAP [Macedonio et al., 2005], TEPHRA [Bonadonnaet al., 2005], FALL3D [Costa et al., 2006] and PUFF[Searcy et al., 1998]. All the models are continuously run-ning at INGV in Catania, and the simulations are sent viaInternet to the Civil Protection Department that produces the“hazard bulletin” for the airports, which clearly definesthe sectors affected by the ash fallout and the risk level forthe flights and the airport.[29] The surveillance system started up during the lava
fountain episodes of 2007; it proved very helpful during thelava fountain that began in the late afternoon of 4 September2007 and lasted about 12 h. Despite the long duration of thisepisode, the simulation showed that the ash plume wasclearly moving in the eastern direction during the following48 h with an elongated shape of the fallout and withoutaffecting the Catania airport. The hazard bulletins for avia-tion were very precise, and the airport worked regularlywithout interruptions.[30] The start of the 2008 eruption was another important
test case to validate the importance of this surveillancesystem (M. Coltelli et al., Osservazione da satellite e si-mulazione dell’emissione di cenere, INGV‐CT internalreport, 10 May 2008, available at http://www.ct.ingv.it). Thealert was made promptly at the beginning of the seismicswarm allowing the DPC to send the first hazard bulletin tothe airport authorities. The bad weather conditions did notallow the permanent cameras to detect the explosive activity,but, as shown in section 3, the satellite confirmed a plumemoving toward the NE from 0930 UT. The ash dispersal
Figure 10. Mean effusion rate values obtained from MODIS satellite images for the period 13 May to 16July 2008. Spread in the data, calculated as difference between maximum and minimum value of effusionrate, is indicated for each point as a vertical bar. Note the initial fast decline in effusion rate and theincrease in activity during June. See text for further details.
BONACCORSO ET AL.: ETNA MULTIDISCIPLINARY HAZARD ASSESSMENT B03203B03203
11 of 19

simulation forecasted for the following 24 h a well‐shapedand stable plume elongating toward the NE without affect-ing the area around the Catania airport (Figure 13). Theprecise information provided the first hazard bulletin withclear indications of the area affected by the ash dispersal,allowing the aviation and airport authorities to advise pilotsso that they could use alternative flying routes, landing andtaking off from the west rather than the east. The secondhazard bulletin on the afternoon of 14 May communicatedthe end of the violent ash emission. During this time, thehazard bulletins allowed the Catania airport to be correctlyinformed of the ongoing phenomena and the plume cloudforecasting. The airport did not suffer interruptions andoperated on a regular schedule.
6.2. Lava Flow Simulations
[31] Between 13 May and 21 June 2008 we simulated theexpansion of the lava flow field for hazard purposes everyday using the MAGFLOW model [Vicari et al., 2007; DelNegro et al., 2008]. The data required to run MAGFLOW
are (1) the digital elevation model (DEM), (2) the conditionsfor extrusion of lava, and (3) the physical and rheologicalproperties of lava. However, for a given composition, thevolumetric flux of lava from the vent (i.e., the lava effusionrate, [Harris et al., 2007; Harris and Baloga, 2009]) is theprincipal parameter controlling the final flow dimensions.Direct field measurements of lava effusion rate are oftendifficult to make during the early phases of an eruption,especially when lava flows expand at high speed, and strongexplosions, fountaining and lava spattering occur at or nearthe master vent [Pinkerton and Sparks, 1976; Frazzetta andRomano, 1984; Calvari et al., 1994, 2003; Behncke andNeri, 2003a; Lautze et al., 2004; Bailey et al., 2006]. Inall these cases, the timely synoptic view offered by satellite‐based sensors can be used to estimate instantaneous lavaflow output [Harris et al., 1997a, 2000; Vicari et al., 2009;Harris and Baloga, 2009]. To this end, we implemented anautomated system that uses infrared satellite data acquiredby MODIS to estimate the time‐averaged discharge rate
Figure 11. (left) Continuous magnetic and (right) tilt signals during 13 May 2010 eruption. (top left)Daily mean differences of total magnetic intensity with respect to CSR station in May 2008. A dailymobile averaging with an overlapping window of 2 h is performed on magnetic data recorded in Mayto remove diurnal components. (bottom left) Ten minute means of total intensity variations on 13 May2008 after removing diurnal components using notch filter centered at 8, 12, and 24 h. The permanenttilt network comprises nine biaxial instruments installed in shallow boreholes at about 3 m depth andone long‐base instrument at PDN (for details, see Bonaccorso et al. [2004b]). The radial axis of eachtiltmeter is directed toward the Voragine crater, and a positive signal variation means crater‐up tilting.
BONACCORSO ET AL.: ETNA MULTIDISCIPLINARY HAZARD ASSESSMENT B03203B03203
12 of 19

Figure
12.
Dikemodeling:
(a)magnetic
datamodeling(redrawnfrom
Napolietal.[2008]);(b)GPSandtiltmodelingof
thefirstintrusionphasefrom
0840
to0930
UT;and(c)GPSandtiltmodelingof
thesecond
intrusionphasefrom
0940
to1730
UT(redrawnfrom
Aloisiet
al.[2009]).Piezomagnetic
anom
alyhasthecontourlin
esat
1nT
.The
epicenters
ofthe
mostenergetic
seismic
eventsareshow
nwith
circles[after
Napoliet
al.,2008].The
redcirclesaretheseismic
eventsin
correspondence
ofthestep‐likemagnetic
changes.The
coordinatesarein
UTM
projectio
n,zone
33north.
BONACCORSO ET AL.: ETNA MULTIDISCIPLINARY HAZARD ASSESSMENT B03203B03203
13 of 19

following the methodology of Harris et al. [1997a, 1997b,1998].[32] The data set consists of about 90 cloud‐free satellite
images of the MODIS sensor of the TERRA and AQUAsatellites. The sequence started on 13 May at 0945 UT.Figure 10 shows the estimated values of effusion rate for theperiod from 13 May to 15 July 2008. The estimated satelliteeffusion rate values showed a fairly usual trend, at least forthe first 5 days of the eruption. The maximum values of flowrate were reached between the first and the third day oferuption, then the effusion rate sharply decreased. After that,an increasing trend was observed in the second half of June,reaching peaks of about half of the initial highest values(Figure 10). This is not common during dike drainage andsuggests that new inputs of gas‐rich magma entered thesystem [Calvari et al., 2005, 2010], causing some concernfor a possible greater expansion of the lava flows. For this
reason, satellite‐derived time‐varying eruption rates wereconstantly used during the 2008 eruption every day as abasis to obtain numerical simulations of lava flow pathsusing the MAGFLOW cellular automata model [Heraultet al., 2009; Vicari et al., 2009]. The physical and rheologi-cal parameters used for the simulations are reported in Table 1.As a topographic base, we have used the digital elevationmodel (DEM) of Etna from data collected during the 2007aerophotogrammetric flight that has a resolution of 10 m.Since this DEM did not cover the entire area for our simu-lation, it was extended by using the 2005 topographic base,thanks to the contribution of INGV, Pisa.[33] Two vents V1 and V2 (Figure 9), active on 13 May in
the eastern part of the summit craters, were considered fornumerical simulation. Indeed, the satellite‐derived time‐averaged discharge rates represent the total effusion ratesfrom the two vents V1 and V2, so a critical parameter for the
Figure 13. Volcano ash dispersal forecasting at 3000 m asl between 0900 and 1200 UT of 13 May 2010by using FALL3‐D model [Costa et al., 2006]. Image elaborated from INGV‐CT and sent to CivilDefense Department.
BONACCORSO ET AL.: ETNA MULTIDISCIPLINARY HAZARD ASSESSMENT B03203B03203
14 of 19

simulations is the relative weight of the flux rate for eachvent. After several attempts of varying the allotting of fluxrate between the two vents, the best results are shown inFigure 14, where a 40 day extrusion interval is illustratedassigning 1/3 part of the total flux rate to V1 and 2/3 to V2.The simulated scenario reproduces the observed lava fieldwell. Mismatching between the simulated and the observedpath of lava flow in the northern branch is probably due tothe influence on DEM used for the simulation by two 2007lava fountains, 4 September and 23 November (Figure 1).Starting from this base configuration of simulation para-meters, several other simulations were performed during theearly phase of the eruption in order to verify which condi-tions, especially for the values of the effusion rate, could beconsidered as a threshold of alert. For all simulated sce-narios, no lava flow path extended beyond the Valle delBove area, even if high values of the effusion rates wereused as input of MAGFLOW.
7. Discussion
[34] Mount Etna is characterized by a persistent degassingactivity from the summit craters through which the magmaresiding in the upper conduit gradually releases its explosivepower [Behncke et al., 2005, and reference therein]. Fol-lowing Rittmann [1973], effusive eruptions at this volcanocan be divided into four main classes: (1) terminal erup-tions, or eruptions involving overflow of magma from thesummit craters and accompanied or not by explosive activity(Strombolian or fire fountains), which are the consequenceof the extrusion of magma from a shallow reservoir throughthe central conduit of the volcano; (2) subterminal erup-tions, involving the summit region above 3000 m elevationand thus the area immediately surrounding the summitcraters; (3) flank lateral eruptions (or central lateral erup-tions according to Acocella and Neri [2003]), in whichmagma from the central conduit intrudes as lateral dikes anderupts on the volcano flanks, commonly characterized bymultiple vents aligned along the eruptive fissure that radiatesfrom the summit of the volcano [Bonaccorso and Davis,2004] and by explosive activity during the initial phasesof the eruption; and (4) flank eccentric eruptions (alsonamed peripheral eruptions [Acocella and Neri, 2003]), oreruptions triggered by dike‐forming intrusion rising straightfrom the magma reservoir without using the central conduit,and that for this reason keep their original gas content untilthe start of the eruption, giving rise to extremely powerfuland prolonged explosive phases, such as recently occurredin 1974, 2001, and 2002–2003 [Guest et al., 1974; Behnckeand Neri, 2003b; Lanzafame et al., 2003; Andronico et al.,2005; Neri et al., 2005; Acocella and Neri, 2009].
[35] The ground deformation modeling of the severalflank eruptions occurring on Etna in the last three decadesconfirmed that the flank eruptions can be divided into thetwo classes: lateral and eccentric (see Bonaccorso and Davis[2004] for a review). The first type involves magma risingalong the upper central conduit system before breaking outinto shallow dikes propagating horizontally. The secondtype involves dikes that are generated at depths of severalkilometers and expand vertically through the volcanic pileprovoking marked deformation until they break the surfaceand erupt explosively without intersecting the central conduit.[36] The intrusion associated with the 2008–2009 eruption
was characterized by a different mechanism, never observedor modeled before at Etna. In this case, as shown by mag-netic and deformation modeling, the near‐vertical intrusiondeparted from the central conduit system at a depth of 1.6 kmbelow the summit area and propagated toward the east,without following the path of the central conduit (Figure 15).This is neither a classic central lateral eruption propagatingradially from the upper portion of the conduit toward thevolcano flanks, nor a classic eccentric eruption cutting theentire volcano pile. The diversion from the upper conduit ofthe propagating dike‐forming intrusion could be triggeredby the rapid rise of the significant volume of rich‐gasmagma erupted through the powerful lava fountain on10 May 2008, only 3 days before beginning of the 2008–2009 flank eruption. The overpressure of magma in the SECconduit could have caused fracturing around the conduititself at ∼1.6 km of depth, facilitating 3 days later (on13 May) the intrusion of a dike out of the conduit, in a NEdirection. Therefore, we believe that the accumulation ofgas‐rich magma at shallow depth (∼1.6 km) maintained itseruptive power, and also triggered the flank eruption 3days later. The shallow depth of the departure of theintrusion below the summit area (∼1.6 km), which corre-
Table 1. Physical Parameters Used in MAGFLOW Simulator
Parameter Value Unit
Density (r) 2600 kg m−3
Specific heat capacity (Cp) 1150 J kg−1 K−1
Emissivity (") 0.9Solidification temperature (Ts) 1173 KExtrusion temperature (Te) 1360 K
Figure 14. Lava flow simulation using MAGFLOW modelfor the first 40 days of eruption. V1 and V2 are the two effu-sive vents. Color scale represents the lava flow thickness.The blue contour line is the observed lava flow field at 21June 2008 [Behncke and Calvari, 2008].
BONACCORSO ET AL.: ETNA MULTIDISCIPLINARY HAZARD ASSESSMENT B03203B03203
15 of 19

sponds to the centroid depth of the source of the volcanictremor (Figure 7b), was inferred by the deformation that wasrestricted to the summit area.[37] The initial phase of the eruption raised two main
hazards, namely the ash dispersal produced by the explosiveactivity and the magma fracture propagation toward thenorth. A third critical hazard was related to the high effusionrate during this initial phase and its increase measured bysatellite (28 May to 8 June, 20 June, 4 July, and 9–11 July),and associated with augmented seismic tremor, that couldhave resulted in a greater growth of the lava flow field.[38] As described in section 6.1, this was the first instance
during an eruption of the complete monitoring application ofthe surveillance system developed by INGV for the ashclouds detection and simulation. The interaction with theItalian DPC was very effective and the precise information
provided by the hazard bulletin permitted a timely man-agement of this hazard without the unnecessary closure ofthe Catania airport [Calvari, 2001; Andronico et al., 2005].[39] During the first days, there was great concern for the
possible eruptive fissure propagation toward the north. Infact, as inferred by seismicity during the intrusive phase(Figure 6) and by ground deformation modeling (Figures 12band 12c), the dike‐forming intrusion moved toward thenorth along its shallower part. This attempt to penetrate thenorth flank was confirmed by the field structural investiga-tion that revealed ∼N‐S dry fractures propagating along theupper sector of the NE Rift (Figure 9). The concern wasparticularly high because similar fractures opened during thefirst phase of the 1981 eruption, when in a few hours thelavas destroyed about 1 km of railway, several roads andother infrastructures, and approached the town of Randazzo.
Figure 15. A 3‐D block diagram of Mount Etna (looking west) illustrating the storage areas feeding theSoutheast Crater (SEC). After the violent lava fountaining on 10 May 2008, a diverging dike formed onthe morning of 13 May immediately above the shallow storage. This corresponds to the source of the vol-canic tremor and explains why deformation was restricted to the summit area. The magma intrusionreached the surface along the western wall of the Valle del Bove, lessening the energy available for prop-agation of the intrusion in the northern sector. Not in scale.
BONACCORSO ET AL.: ETNA MULTIDISCIPLINARY HAZARD ASSESSMENT B03203B03203
16 of 19

On that occasion, an eccentric magma fracture verticallycrossed the entire volcanic edifice and caused significantdeformation of the entire volcano edifice [Bonaccorso,1999]. Contrary to the expected, this time the limitedground deformation pattern recorded during 13 May 2008argued against this dangerous situation.[40] The lateral propagation of the dike‐forming fracture
toward the north was probably halted by the moderatevolume of the intrusion, by the shallow origin of the dike(∼1600 m with respect to the surface, Figure 15) and by thereduction of pressure due to the concomitant eruption withmagma drainage along the SE portion of the dike inside theValle del Bove [Aloisi et al., 2009]. During its northernpropagation, the 2008 intrusion moved toward the NECconduit (Figure 9) but without triggering any visible erup-tive activity from this summit crater. This reveals that theorigin of the 2008 dike was linked to the shallow storage ofthe SEC conduit, although at the surface the position of theeruptive and dry fissures was closer to the NEC (Figure 15).The structural field investigation suggested that the NNWextremity of the magmatic intrusion was confined to about800 m below the topographic surface, causing the openingof a ∼N‐S dry, 2450 m long and 200–800 m wide asym-metric graben (Figure 9). The ∼N‐S dry fractures thusformed and expanded until the first lava flow was eruptedfrom the surface fissure that opened toward the south and SEinto the Valle del Bove. The sharply declining effusion rateof this first phase of the eruption (Figure 10) is typical ofdike drainage, as already described by Wadge [1977] andHarris et al. [2000].[41] The last major hazard was posed by lava flows and
the possibility that, depending on the increased effusion rate,the lava could extend beyond the Valle del Bove depressionand threaten the infrastructures and villages on the easternflank. Indeed, a higher and steady lava supply as observedafter mid‐May 2008 (Figure 10) could have resulted in lavatube growth, thus lengthening the lava flow field much morethan in cases of channel‐fed flows [see Calvari et al., 1994;Calvari and Pinkerton, 1998, 1999]. This is why particularattention was given to the daily calculation of effusion rateand the simulation of lava flow spreading and the infor-mation promptly forwarded to DPC. The thermal state andeffusion rate of the 2008 Etna eruption have been monitoredby an automatic system that uses satellite data with differentrefresh times as input. The system was able to observe shortdynamic activities such as the lava fountain preceding theeruption and to follow the different phases of the eruptiveactivity. It also provides a tool that can assess the hazardposed by hypothetical and ongoing eruptions. During thefollowing stage, from the end of May to mid‐July, even ifthe lava was continuously erupted from the eruptive fissure,we did not observe any gradual decline in effusion rate. Onthe contrary, in the second part of July 2008, some phases ofincreased effusion rate were recorded (Figure 10). Theassociated sudden increase in volcanic tremor, gas release,and effusion rate indicated a new input of gas‐rich magmawithin the system. This process happened at least four timesduring the initial phase of the 2008–2009 eruption heredescribed, suggesting new inputs of gas‐rich magma withinthe shallow magma storage region of the volcano [Calvariet al., 2005, 2010]. With time, increasingly smaller gas‐richmagma pockets entered the system, as revealed by the shorter
duration of the explosive phase and the decline in effusionrate, thus significantly decreasing the hazard posed by theeruption.
8. Conclusion
[42] The results presented here show how a potentiallydramatic eruption occurring in a densely populated area andclose to the third largest international airport of Italy hasbeen managed without significant economic damage, pro-viding an effective evaluation of the posed hazards and thecorrect forecast scenarios. We have highlighted the greatbenefit of continuous feedback between research and mon-itoring, as well as the importance of integrated multidisci-plinary monitoring networks and techniques when dealingwith a magmatic intrusion that can suddenly change its pathat depth. In particular, volcanic tremor localization andground deformation modeling allowed interpreting the me-chanisms of the final intrusive process and the shape of thefeeder dike. The interpretation of the deformation fieldexcluded further dike propagation toward the lower flank ofthe north sector, in contrast with the devastation thatoccurred during the 1981 eruption.[43] During the explosive phase, ash spreading in the
atmosphere could have raised concern and produced dis-ruption to the international airport at Catania, as occurred in2001 and 2002. However, the continuous monitoring of theeruptive cloud, coupled with the application of severalsoftware packages for ash spreading simulations and thenintegrated with wind forecasting, and especially the routineestablished between Istituto Nazionale di Geofisica e Vul-canologia, the Italian Civil Defense Department and theItalian National Organization for Civil Aviation, resulted inan eruption that proceeded with minimal impact from aneconomic point of view, without interrupting the regional airtraffic. Once the eruption started, it was essential to obtaindaily measurements of effusion rates from satellites andforecast lava flow spreading. In fact, the effusion rate peaksobserved after May 2008, accompanied by increasing seis-mic tremor and gas output from the summit craters, revealednew inputs of gas‐rich magma entering the supply system.This resulted in a greater downslope extension of the lavaflows that reached lower elevations, raising concern for thepossibility of tube development within the lava flow field,thus accreting even more the potential of longer flows.However, daily calculations of the effusion rate from satelliteand immediate lava flow simulations using the MAGFLOWmodel have allowed us to keep our estimates of the expansionof the lava flow field up to date and accurate.[44] This multidisciplinary approach prompted an effi-
cient feedback between monitoring and research, which isvery helpful for an effective support to risk evaluation.
[45] Acknowledgments. We wish to thank all our colleagues fromINGV Sezione di Catania for data collection, for the maintenance of themonitoring networks during the whole eruption, and for the many discus-sions about the interpretation of the eruptive events; the Etna Guides, theFunivia dell’Etna, and especially Alfio Mazzaglia and Nino Mazzagliafor the prompt information pertaining any news about the summit eruptiveactivity at Mount Etna; the Italian Civil Defense (DPC) for the close andefficient collaboration built up during the last height years of activity atEtna and other Sicilian volcanoes. We obtained MODIS data from NASAand SEVIRI data from EUMETSAT. We are indebted to Paul Davis for his
BONACCORSO ET AL.: ETNA MULTIDISCIPLINARY HAZARD ASSESSMENT B03203B03203
17 of 19

positive and encouraging comments. We thank the Associate EditorMichael P. Ryan, who helped greatly in improving the form of the manu-script. This study was undertaken with partial financial support from theINGV‐DPC 2007–2009 Agreement. Scientific papers funded by DPC donot represent its official opinion and politics. We thank Stephen Conwayfor revising the English language of this manuscript.
ReferencesAcocella, V., and M. Neri (2003), What makes flank eruptions? The 2001Etna eruption and the possible triggering mechanisms, Bull. Volcanol.,65, 517–529, doi:10.1007/s00445-003-0280-3.
Acocella, V., and M. Neri (2009), Dike propagation in volcanic edifices:Overview and possible developments, Tectonophysics, 471, 67–77,doi:10.1016/j.tecto.2008.10.002.
Allard, P., B. Behncke, S. D’Amico, M. Neri, and S. Gambino (2006),Mount Etna 1993–2005: Anatomy of an evolving eruptive cycle, EarthSci. Rev., 78, 85–114, doi:10.1016/j.earscirev.2006.04.002.
Aloisi, M., A. Bonaccorso, F. Cannavò, S. Gambino, M. Mattia, G. Puglisi,and E. Boschi (2009), A new dike intrusion style for the Mount Etna May2008 eruption modelled through continuous tilt and GPS data, TerraNova, 21(4), 316–321, doi:10.1111/j.1365-3121.2009.00889.x.
Andronico, D., et al. (2005), A multi‐disciplinary study of the 2002–03Etna eruption: Insights into a complex plumbing system, Bull. Volcanol.,67, 314–330, doi:10.1007/s00445-004-0372-8.
Andronico, D., S. Scollo, A. Cristaldi, and F. Ferrari (2009), Monitoringash emission episodes at Mt. Etna: The 16 November 2006 case study,J. Volcanol. Geotherm. Res., 180, 123–134, doi:10.1016/j.jvolgeores.2008.10.019.
Bailey, J. E., A. J. L. Harris, J. Dehn, S. Calvari, and S. K. Rowland (2006),The changing morphology of an open lava channel on Mt. Etna, Bull.Volcanol., 68(6), 497–515, doi:10.1007/s00445-005-0025-6.
Barberi, F., M. L. Carapezza, M. Valenza, and L. Villari (1993), The con-trol of lava flow during the 1991–1992 eruption of Mt. Etna, J. Volcanol.Geotherm. Res., 56, 1–34, doi:10.1016/0377-0273(93)90048-V.
Barberi, F., F. Brondi, M. L. Carapezza, L. Cavarra, and C. Murgia (2003),Earthen barriers to control lava flows in the 2001 eruption of Mt. Etna,J. Volcanol. Geotherm. Res., 123, 231–243, doi:10.1016/S0377-0273(03)00038-6.
Battaglia, J., K. Aki, and V. Ferrazzini (2005), Location of tremor sourcesand estimation of lava output using tremor source amplitude on the Pitonde la Fournaise volcano: 1. Location of tremor sources, J. Volcanol.Geotherm. Res., 147, 268–290, doi:10.1016/j.jvolgeores.2005.04.005.
Behncke, B., and S. Calvari (2008), Etna: 6‐km‐long lava flow; ash emis-sions; 13 May 2008 opening of a new eruptive fissure, Bull. Global Vol-canism Network, 33(5), 11–15.
Behncke, B., and M. Neri (2003a), Cycles and trends in the recent eruptivebehaviour of Mount Etna (Italy), Can. J. Earth Sci., 40, 1405–1411,doi:10.1139/e03-052.
Behncke, B., and M. Neri (2003b), The July August 2001 eruption of Mt.Etna (Sicily), Bull. Volcanol., 65, 461–476, doi:10.1007/s00445-003-0274-1.
Behncke, B., M. Neri, and A. Nagay (2005), Lava flow hazard at MountEtna (Italy): New data from a GIS‐based study, in Kinematics andDynamics of Lava Flows, edited by M. Manga, and G. Ventura, Spec.Pap. Geol. Soc. Am., 396, 187–205, doi:10.1130/0-8137-2396-5.189.
Behncke, B., S. Calvari, S. Giammanco, M. Neri, and H. Pinkerton (2008),Pyroclastic density currents resulting from the interaction of basalticmagma with hydrothermally altered rock: An example from the 2006summit eruptions of Mount Etna, Italy, Bull. Volcanol., 70, 1249–1268, doi:10.1007/s00445-008-0200-7.
Behncke, B., S. Falsaperla, and E. Pecora (2009), Complex magma dynam-ics at Mount Etna revealed by seismic, thermal, and volcanological data,J. Geophys. Res., 114, B03211, doi:10.1029/2008JB005882.
Billi, A., V. Acocella, R. Funiciello, G. Giordano, G. Lanzafame, andM. Neri (2003), Mechanisms for ground‐surface fracturing and incipientslope failure associated to the July August 2001 eruption ofMt. Etna, Italy:Analysis of ephemeral field data, J. Volcanol. Geotherm. Res., 122,281–294, doi:10.1016/S0377-0273(02)00507-3.
Bonaccorso, A. (1999), The March 1981 Mt. Etna eruption inferred throughground deformation modelling, Phys. Earth Planet. Inter., 112, 125–136,doi:10.1016/S0031-9201(99)00003-5.
Bonaccorso, A., and P. M. Davis (2004), Modeling of ground deformationassociated with recent lateral eruptions: Mechanics of magma ascent andintermediate storage at Mt. Etna, in Etna: Volcano Laboratory, Geophys.Monogr. Ser., vol. 143, edited by A. Bonaccorso et al., pp. 293–306,AGU, Washington, D. C.
Bonaccorso, A., S. Calvari, M. Coltelli, C. Del Negro, and S. Falsaperla(Eds.) (2004a), Etna: Volcano Laboratory, Geophys. Monogr. Ser.,vol. 143, 369 pp., AGU, Washington, D. C.
Bonaccorso, A., O. Campisi, G. Falzone, and S. Gambino (2004b), Contin-uous tilt monitoring: A lesson from 20 years experience at Mt. Etna, inEtna: Volcano Laboratory, Geophys. Monogr. Ser., vol. 143, edited byA. Bonaccorso et al., pp. 307–320, AGU, Washington, D. C.
Bonaccorso, A., S. Cianetti, C. Giunchi, E. Transatti, M. Bonafede, andE. Boschi (2005), Analytical and 3D numerical modeling of Mt. Etna(Italy) volcano inflation, Geophys. J. Int., 163, 852–862, doi:10.1111/j.1365-246X.2005.02777.x.
Bonaccorso, A., A. Bonforte, F. Guglielmino, M. Palano, and G. Puglisi(2006), Composite ground deformation pattern forerunning the 2004–2005 Mount Etna eruption, J. Geophys. Res., 111, B12207, doi:10.1029/2005JB004206.
Bonadonna, C., C. B. Connor, B. F. Houghton, L. Connor, M. Byrne,A. Laing, and T. K. Hincks (2005), Probabilistic modelling oftephra‐fall dispersal: Hazard assessment of a multiphase rhyolitic erup-tion at Tarawera, New Zealand, J. Geophys. Res., 110, B03203,doi:10.1029/2003JB002896.
Bonforte, A., and G. Puglisi (2006), Dynamics of the eastern flank ofMt. Etna volcano (Italy) investigated by a dense GPS network, J. Volcanol.Geotherm. Res., 153, 357–369, doi:10.1016/j.jvolgeores.2005.12.005.
Bonforte, A., S. Gambino, F. Guglielmino, F. Obrizzo, M. Palano, andG. Puglisi (2007), Ground deformation modeling of flank dynamicsprior to the 2002 eruption of Mt. Etna, Bull Volcanol., 69, 757–768,doi:10.1007/s00445-006-0106-1.
Bonforte, A., A. Bonaccorso, F. Guglielmino, M. Palano, and G. Puglisi(2008), Feeding system and magma storage beneath Mt. Etna as revealedby recent inflation/deflation cycles, J. Geophys. Res., 113, B05406,doi:10.1029/2007JB005334.
Bonforte, A., S. Gambino, and M. Neri (2009), Intrusion of eccentric dikes:The case of the 2001 eruption and its role, in The dynamics of Mt. Etnavolcano, Special Issue, Volcanoes, Tectonophysics, 471, 78–86,doi:10.1016/j.tecto.2008.09.028.
Branca, S., and P. Del Carlo (2004), Eruptions of Mt Etna during the past3,200 years: A revised compilation integrating the historical and strati-graphic records, in Etna: Volcano Laboratory, Geophys. Monogr. Ser.,vol. 143, edited by A. Bonaccorso et al., pp. 1–27, AGU,Washington, D. C.
Burton, M., et al. (2005), Etna 2004–05: An archetype for geodynamicallycontrolled effusive eruptions, Geophys. Res. Lett., 32, L09303,doi:10.1029/2005GL022527.
Calvari, S. (2001), Multidisciplinary approach yields insight into Mt. Etna2001 eruption, Eos Trans. AGU, 82(52), 653, doi:10.1029/01EO00376.
Calvari, S., and H. Pinkerton (1998), Formation of lava tubes and extensiveflow field during the 1991–93 eruption of Mount Etna, J. Geophys. Res.,103(B11), 27,291–27,301, doi:10.1029/97JB03388.
Calvari, S., and H. Pinkerton (1999), Lava tube morphology on Etna andevidence for lava flow emplacement mechanisms, J. Volcanol.Geotherm. Res., 90, 263–280, doi:10.1016/S0377-0273(99)00024-4.
Calvari, S., M. Coltelli, M. Neri, M. Pompilio, and V. Scribano (1994), The1991–93 Etna eruption: Chronology and lava flow field evolution, ActaVulcanol., 4, 1–14.
Calvari, S., M. Neri, and H. Pinkerton (2003), Effusion rate estimationsduring the 1999 summit eruption on Mt. Etna, and growth of two distinctlava flow fields, J. Volcanol. Geotherm. Res. , 119 , 107–123,doi:10.1016/S0377-0273(02)00308-6.
Calvari, S., L. Spampinato, L. Lodato, A. J. L. Harris, M. R. Patrick, J. Dehn,M. R. Burton, and D. Andronico (2005), Chronology and complex volca-nic processes during the 2002–2003 flank eruption at Stromboli volcano(Italy) reconstructed from direct observations and surveys with a handheldthermal camera, J. Geophys. Res. , 110 , B02201, doi:10.1029/2004JB003129. (Correction to “Chronology and complex volcanic pro-cesses during the 2002–2003 flank eruption at Stromboli volcano (Italy)reconstructed from direct observations and surveys with a handheldthermal camera,” J. Geophys. Res., 110, B02201, doi:10.1029/2004JB003129, 2005.)
Calvari, S., L. Lodato, A. Steffke, A. Cristaldi, A. J. L. Harris, L. Spampinato,and E. Boschi (2010), The 2007 Stromboli eruption: Event chronologyand effusion rates using thermal infrared data, J. Geophys. Res., 115,B04201, doi:10.1029/2009JB006478.
Costa, A., G. Macedonio, and A. Folch (2006), A three‐dimensional Euler-ian model for transport and deposition of volcanic ashes, Earth Planet.Sci. Lett., 241, 634–647, doi:10.1016/j.epsl.2005.11.019.
Day, S. J., J. C. Carracedo, H. Guillou, and P. Gravestock (1999), Recentstructural evolution of the Cumbre Vieja volcano, La Palma, CanaryIslands: Volcanic rift zone reconfiguration as a precursor to volcano flankinstability?, J. Volcanol. Geotherm. Res., 94, 135–167, doi:10.1016/S0377-0273(99)00101-8.
Del Negro, C., L. Fortuna, A. Herault, and A. Vicari (2008), Simulations ofthe 2004 lava flow at Etna volcano by the MAGFLOW cellular automatamodel, Bull. Volcanol., 70(7), 805–812, doi:10.1007/s00445-007-0168-8.
BONACCORSO ET AL.: ETNA MULTIDISCIPLINARY HAZARD ASSESSMENT B03203B03203
18 of 19

Di Grazia, G., S. Falsaperla, and H. Langer (2006), Volcanic tremor loca-tion during the 2004 Mount Etna lava effusion, Geophys. Res. Lett., 33,L04304, doi:10.1029/2005GL025177.
Di Grazia, G., A. Cannata, P.Montalto, D. Patanè, E. Privitera, L. Zuccarello,and E. Boschi (2009), A multiparameter approach to volcano monitoringbased on 4D analyses of seismo‐volcanic and acoustic signals: The 2008Mt. Etna eruption, Geophys. Res. Lett., 36, L18307, doi:10.1029/2009GL039567.
Frazzetta, G., and R. Romano (1984), The 1983 Etna eruption: Event chro-nology and morphological evolution of the lava flow, Bull. Volcanol., 47,1079–1096, doi:10.1007/BF01952364.
Gottschämmer, E., and I. Surono (2000), Locating tremor and shocksources recorded at Bromo volcano, J. Volcanol. Geotherm. Res., 101,199–209, doi:10.1016/S0377-0273(00)00171-2.
Gresta, S., V. Longo, and A. Viavattene (1990), Geodynamic behaviour ofeastern and western sides of Mount Etna, Tectonophysics, 179, 81–92,doi:10.1016/0040-1951(90)90357-E.
Guest, J. E., A. T. Huntingdon, G. Wadge, J. L. Brander, B. Booth,S. Carter, and A. Duncan (1974), Recent eruption of Mount Etna, Nature,250, 385–387, doi:10.1038/250385a0.
Harris, A., et al. (2005), DUCKS: Low cost thermal monitoring units fornear‐vent deployment, J. Volcanol. Geotherm. Res., 143, 335–360,doi:10.1016/j.jvolgeores.2004.12.007.
Harris, A. J. L., and S. M. Baloga (2009), Lava discharge rates from satellite‐measured heat flux, Geophys. Res. Lett., 36, L19302, doi:10.1029/2009GL039717.
Harris, A. J. L., A. L. Butterworth, R. W. Carlton, I. Downey, P. Miller,P. Navarro, and D. A. Rothery (1997a), Low‐cost volcano surveillancefrom space: Case studies from Etna, Krafla, Cerro Negro, Fogo, Lascarand Erebus, Bull. Volcanol., 59, 49–64, doi:10.1007/s004450050174.
Harris, A. J. L., S. Blake, D. A. Rothery, and N. F. Stevens (1997b), Achronology of the 1991 to 1993 Mount Etna eruption using advanced veryhigh resolution radiometer data: Implications for real‐time thermal vol-cano monitoring, J. Geophys. Res., 102(B4), 7985–8003, doi:10.1029/96JB03388.
Harris, A. J. L., L. P. Flynn, L. Keszthelyi, P. J. Mouginis‐Mark, S. K.Rowland, and J. A. Resing (1998), Calculation of lava effusion ratesfrom Landsat TM data, Bull. Volcanol., 60, 52–71, doi:10.1007/s004450050216.
Harris, A. J. L., J. B. Murray, S. E. Aries, M. A. Davies, L. P. Flynn, M. J.Wooster, R. Wright, and D. A. Rothery (2000), Effusion rate trends atEtna and Krafla and their implications for eruptive mechanisms, J. Vol-canol. Geotherm. Res., 102, 237–269, doi:10.1016/S0377-0273(00)00190-6.
Harris, A. J. L., J. Dehn, and S. Calvari (2007), Lava effusion rate defini-tion, measurement and operational requirements: A review, Bull. Volca-nol., 70, 1–22, doi:10.1007/s00445-007-0120-y.
Herault, A., A. Vicari, A. Ciraudo, and C. Del Negro (2009), Forecastinglava flow hazard during the 2006 Etna eruption: Using the MAGFLOWcellular automata model, Comput. Geosci., 35, 1050–1060, doi:10.1016/j.cageo.2007.10.008.
Lanzafame, G., M. Neri, V. Acocella, A. Billi, R. Funiciello, and G. Giordano(2003), Structural features of the July‐August 2001 Mount Etna erup-tion: Evidence for a complex magma supply system, J. Geol. Soc.,160, 531–544, doi:10.1144/0016-764902-151.
Lautze, N. C., A. J. L. Harris, J. E. Bailey, M. Ripepe, S. Calvari, J. Dehn,S. Rowland, and K. Evans‐Jones (2004), Pulsed lava effusion at MountEtna during 2001, J. Volcanol. Geotherm. Res., 137, 231–246,doi:10.1016/j.jvolgeores.2004.05.018.
Macedonio, G., A. Costa, and A. Longo (2005), A computer model for vol-canic ash fallout and assessment of subsequent hazard, Comput. Geosci.,31, 837–845, doi:10.1016/j.cageo.2005.01.013.
McGuire, W. J., J. B. Murray, A. D. Pullen, and S. J. Saunders (1991),Ground deformation monitoring at Mt. Etna: Evidence for dyke emplace-ment and slope instability, J. Geol. Soc., 148, 577–583, doi:10.1144/gsjgs.148.3.0577.
Napoli, R., G. Currenti, C. Del Negro, F. Greco, and D. Scandura (2008),Volcanomagnetic evidence of the magmatic intrusion on 13th May 2008Etna eruption, Geophys. Res. Lett., 35 , L22301, doi:10.1029/2008GL035350.
Neri, M., and V. Acocella (2006), The 2004–05 Etna eruption: Implicationsfor flank deformation and structural behaviour of the volcano, J. Volcanol.Geotherm. Res., 158, 195–206, doi:10.1016/j.jvolgeores.2006.04.022.
Neri, M., V. Acocella, and B. Behncke (2004), The role of the PernicanaFault System in the spreading of Mount Etna (Italy) during the 2002–2003 eruption, Bull. Volcanol., 66, 417–430, doi:10.1007/s00445-003-0322-x.
Neri, M., V. Acocella, B. Behncke, V. Maiolino, A. Ursino, and R. Velardita(2005), Contrasting triggering mechanisms of the 2001 and 2002–2003
eruptions of Mount Etna (Italy), J. Volcanol. Geotherm. Res., 144,235–255, doi:10.1016/j.jvolgeores.2004.11.025.
Neri, M., B. Behncke, M. Burton, S. Giammanco, E. Pecora, E. Privitera,and D. Reitano (2006), Continuous soil radon monitoring during the July2006 Etna eruption, Geophys. Res. Lett., 33, L24316, doi:10.1029/2006GL028394.
Neri, M., F. Mazzarini, S. Tarquini, M. Bisson, I. Isola, and B. Behncke(2008), The changing face of Mount Etna’s summit area documentedwith lidar technology, Geophys. Res. Lett., 35, L09305, doi:10.1029/2008GL033740.
Neri, M., F. Casu, V. Acocella, G. Solaro, S. Pepe, P. Berardino, E. Sansosti,T. Caltabiano, P. Lundgren, and R. Lanari (2009), Deformation and erup-tions at Mt. Etna (Italy): A lesson from 15 years of observations,Geophys.Res. Lett., 36, L02309, doi:10.1029/2008GL036151.
Pinkerton, H., and R. S. J. Sparks (1976), The 1975 subterminal lavas,Mount Etna: A case history of the formation of a compound lava field,J. Volcanol. Geotherm. Res., 1, 167–182, doi:10.1016/0377-0273(76)90005-6.
Pollard, D. D., P. T. Delaney, W. A. Dueld, E. T. Endo, and E. T. Okamura(1983), Surface deformation in volcanic rift zones, Tectonophysics, 94,541–584, doi:10.1016/0040-1951(83)90034-3.
Puglisi, G., and A. Bonforte (2004), Dynamics of Mount Etna Volcanoinferred from static and kinematic GPS measurements, J. Geophys.Res., 109, B11404, doi:10.1029/2003JB002878.
Puglisi, G., A. Bonforte, A. Ferretti, F. Guglielmino, M. Palano, and C. Prati(2008), Dynamics ofMount Etna before, during, and after the July–August2001 eruption inferred from GPS and differential synthetic aperture radarinterferometry data, J. Geophys. Res., 113, B06405, doi:10.1029/2006JB004811.
Rittmann, A. (1973), Structure and evolution of Mount Etna, Philos. Trans.R. Soc. London, Ser. A, 274, 5–16.
Roberts, G., M. J. Wooster, G. L. W. Perry, N. Drake, L.‐M. Rebelo, andF. Dipotso (2005), Retrieval of biomass combustion rates and totalsfrom fire radiative power observations: Application to southern Africausing geostationary SEVIRI imagery, J. Geophys. Res., 110, D21111,doi:10.1029/2005JD006018.
Ruch, J., V. Acocella, F. Storti, M. Neri, S. Pepe, G. Solaro, and E. Sansosti(2010), Detachment depth of an unstable volcano revealed by rolloverdeformation: An integrated approach at Mount Etna, Geophys. Res. Lett.,37, L16304, doi:10.1029/2010GL044131.
Rust, D., B. Behncke, M. Neri, and A. Ciocanel (2005), Nested zones ofinstability in the Mount Etna volcanic edifice, Sicily, J. Volcanol.Geotherm. Res., 144, 137–153, doi:10.1016/j.jvolgeores.2004.11.021.
Scollo, S., M. Prestifilippo, G. Spata, M. D’Agostino, and M. Coltelli(2009), Monitoring and forecasting Etna volcanic plumes, Nat. HazardsEarth Syst. Sci., 9, 1573–1585, doi:10.5194/nhess-9-1573-2009.
Searcy, C., K. Dean, and W. Stringer (1998), PUFF: A high‐resolution vol-canic ash tracking model, J. Volcanol. Geotherm. Res., 80, 1–16,doi:10.1016/S0377-0273(97)00037-1.
Solaro, G., V. Acocella, S. Pepe, J. Ruch, M. Neri, and E. Sansosti (2010),Anatomy of an unstable volcano from InSAR: Multiple processes affect-ing flank instability at Mt. Etna, 1994–2008, J. Geophys. Res., 115,B10405, doi:10.1029/2009JB000820.
Stevens, N. F., J. B. Murray, and G. Wadge (1997), The volume and shapeof the 1991–1993 lava flow field at Mount Etna, Sicily, Bull. Volcanol.,58, 449–454, doi:10.1007/s004450050153.
Vicari, A., A. Herault, C. Del Negro, M. Coltelli, M.Marsella, and C. Proietti(2007), Modelling of the 2001 lava flow at Etna volcano by a cellularautomata approach, Environ. Model. Software, 22, 1465–1471,doi:10.1016/j.envsoft.2006.10.005.
Vicari, A., A. Ciraudo, C. Del Negro, A. Herault, and L. Fortuna (2009),Lava flow simulations using discharge rates from thermal infrared satel-lite imagery during the 2006 Etna eruption, Nat. Hazards, 50, 539–550,doi:10.1007/s11069-008-9306-7.
Wadge, G. (1977), The storage and release of magma on Mount Etna,J. Volcanol. Geotherm. Res., 2, 361–384, doi:10.1016/0377-0273(77)90021-X.
Walter, T. R., V. Acocella, M. Neri, and F. Amelung (2005), Feedback pro-cesses between magmatic events and flank movement at Mount Etna(Italy) during the 2002–2003 eruption, J. Geophys. Res., 110, B10205,doi:10.1029/2005JB003688.
A. Bonaccorso, A. Bonforte, E. Boschi, S. Calvari, C. Del Negro,G. Di Grazia, G. Ganci, M. Neri, and A. Vicari, Istituto Nazionale diGeofisica e Vulcanologia, Sezione di Catania, Piazza Roma, 2, I‐95123Catania, Italy. ([email protected])
BONACCORSO ET AL.: ETNA MULTIDISCIPLINARY HAZARD ASSESSMENT B03203B03203
19 of 19