Rapid Analysis of Electronically Monitored Homopteran Feeding Behavior
10
BEHAVIOR Rapid Analysis of Electronically Monitored Homopteran Feeding Behavior WILANT A. VAN GIESSEN 1, 2 AND D. MICHAEL JACKSON U.S. Vegetable Laboratory, USDAÐARS, 2875 Savannah Highway, Charleston, SC 29414 Ð5334 Ann. Entomol. Soc. Am. 91(1): 145Ð154 (1998) ABSTRACT Historically, a bottleneck in the analysis of electronically monitored insect feeding behavior (EMIF) of homopterans has been the conversion of raw waveform data into a format that is easy to analyze. Here we present an efÞcient method for the analysis of EMIF recordings using Microsoft Excel, a popular spreadsheet program. Recordings were made with WinDaq, data-acquisition software from Dataq Instruments. Waveform transitions were saved to Þle using WinDaqÕs annotation utility. Subsequent data analysis of the WinDaq data Þle was performed using a custom-designed Microsoft Excel EMIF workbook. After experiment-speciÞc variables are entered and the data Þle is imported by the user, a complete analysis is performed automatically. The Excel workbook summarizes the results and generates an output Þle for further statistical analysis. Any EMIF data Þle containing waveform codes and cumulative time (i.e., time from the beginning of the recording, in seconds) can be analyzed. The new method described in this article was used to analyze EMIF recordings of 2 homopteran species, Aphis gossypii Glover (Aphididae) and Empoasca kraemeri Ross & Moore (Cicadellidae). IdentiÞcation and Þle export took an average of 5 s per waveform occurrence; the total time required to identify all waveforms and export them to Þle will depend on the number of occurrences of each waveform in the EMIF recording, quality of the recording, waveform variability, level of user experience, and computer speed. The subsequent analysis of each recording with the EMIF workbook took between 1 and 2 min. Use of the EMIF workbook has the following advantages: (1) it can be used to analyze EMIF recordings of any homopteran species; (2) it is compatible with any data acquisition software capable of exporting data Þles containing waveform codes and cumulative time, as well as with data Þles with a similar format; (3) it can be used in conjunction with both AC and DC EMIF systems; and (4) it is fast, ßexible, and user-friendly. KEY WORDS electronic monitoring, electrical penetration graph, data analysis, waveform, spreadsheet ELECTRONIC MONITORING OF insect feeding (EMIF) has been used successfully since 1964 to character- ize probing behavior of .50 homopteran species (McLean and Kinsey 1964, 1965, 1967; for a recent review, see Backus 1994). This technique has been used in studies of plant resistance to homopteran pests (Febvay et al. 1988, Ullman et al. 1988, Montl- lor and Tjallingii 1989, Calderon and Backus 1992, Webster et al. 1993, Calatayud et al. 1994, Cole 1994, Reese et al. 1994, Wayadande 1994, Caillaud et al. 1995), acquisition and transmission of plant viruses by vectors (Blua and Perring 1992, Powell et al. 1992, Shuckle and Quiroz 1994), arthropod blood-feeding behavior (reviewed by Kimsey 1994), and the ef- fects of various control measures on insect feeding behavior (Saxena and Khan 1985, Hardie et al. 1992, Powell et al. 1993). The EMIF system originally designed by McLean and Kinsey used AC current. Later, Tjallingii (1978, 1988, 1998) developed an EMIF system using DC current and coined the term electrical penetration graph (EPG) for the output of an EMIF system. The output from insect feeding monitors is a variable- voltage signal over time. This variability is caused by changes in electrical resistance across the feeding insectÕs stylets (for AC systems), or by changes in resistance in addition to biologically generated volt- age sources (e.g., membrane potentials) for DC systems (Tjallingii 1998, Walker, 1998). These vari- ations in voltage signal occur in discrete sections of uniform patterns called waveforms and are corre- lated with distinct probing and feeding behaviors (McLean and Kinsey 1967, 1968; Tjallingii 1978, 1985). Postacquisition analysis of EMIF data formerly was rather labor-intensive because waveform dura- tions had to be measured manually from paper print- outs. A number of researchers have developed soft- This article reports the results of research only. Mention of a proprietary product does not constitute an endorsement or a rec- ommendation by USDA for its use. 1 Department of Plant Pathology and Physiology, Clemson Uni- versity, 120 Long Hall, Box 340377, Clemson, SC 29634 Ð 0377. 2 Department of Entomology, Wageningen Agricultural Univer- sity, P.O. Box 8031, NL-6700 EH Wageningen, The Netherlands.
Transcript of Rapid Analysis of Electronically Monitored Homopteran Feeding Behavior

BEHAVIOR
Rapid Analysis of Electronically Monitored HomopteranFeeding Behavior
WILANT A. VAN GIESSEN1, 2 AND D. MICHAEL JACKSON
U.S. Vegetable Laboratory, USDAÐARS, 2875 Savannah Highway, Charleston, SC 29414Ð5334
Ann. Entomol. Soc. Am. 91(1): 145Ð154 (1998)
ABSTRACT Historically, a bottleneck in the analysis of electronicallymonitored insect feedingbehavior (EMIF) of homopterans has been the conversion of raw waveform data into a formatthat is easy to analyze. Here we present an efÞcient method for the analysis of EMIF recordingsusing Microsoft Excel, a popular spreadsheet program. Recordings were made with WinDaq,data-acquisition software from Dataq Instruments. Waveform transitions were saved to Þle usingWinDaqÕs annotation utility. Subsequent data analysis of the WinDaq data Þle was performedusing a custom-designed Microsoft Excel EMIF workbook. After experiment-speciÞc variablesare entered and the data Þle is imported by the user, a complete analysis is performedautomatically. The Excel workbook summarizes the results and generates an output Þle forfurther statistical analysis. Any EMIF data Þle containing waveform codes and cumulative time(i.e., time from the beginning of the recording, in seconds) can be analyzed. The new methoddescribed in this article was used to analyze EMIF recordings of 2 homopteran species, AphisgossypiiGlover (Aphididae) andEmpoasca kraemeriRoss&Moore (Cicadellidae). IdentiÞcationand Þle export took an average of 5 s per waveform occurrence; the total time required to identifyall waveforms and export them to Þle will depend on the number of occurrences of eachwaveform in the EMIF recording, quality of the recording, waveform variability, level of userexperience, and computer speed. The subsequent analysis of each recording with the EMIFworkbook took between 1 and 2 min. Use of the EMIF workbook has the following advantages:(1) it can be used to analyze EMIF recordings of any homopteran species; (2) it is compatiblewith any data acquisition software capable of exporting data Þles containing waveform codes andcumulative time, as well as with data Þles with a similar format; (3) it can be used in conjunctionwith both AC and DC EMIF systems; and (4) it is fast, ßexible, and user-friendly.
KEY WORDS electronic monitoring, electrical penetration graph, data analysis, waveform,spreadsheet
ELECTRONIC MONITORING OF insect feeding (EMIF)has been used successfully since 1964 to character-ize probing behavior of .50 homopteran species(McLean and Kinsey 1964, 1965, 1967; for a recentreview, see Backus 1994). This technique has beenused in studies of plant resistance to homopteranpests (Febvay et al. 1988, Ullman et al. 1988, Montl-lor and Tjallingii 1989, Calderon and Backus 1992,Webster et al. 1993, Calatayud et al. 1994, Cole 1994,Reese et al. 1994, Wayadande 1994, Caillaud et al.1995), acquisition and transmission of plant virusesby vectors (Blua andPerring 1992, Powell et al. 1992,Shuckle and Quiroz 1994), arthropod blood-feedingbehavior (reviewed by Kimsey 1994), and the ef-fects of various control measures on insect feeding
behavior (Saxena and Khan 1985, Hardie et al. 1992,Powell et al. 1993).
The EMIF system originally designed by McLeanand Kinsey used AC current. Later, Tjallingii (1978,1988, 1998) developed an EMIF system using DCcurrent and coined the term electrical penetrationgraph (EPG) for the output of an EMIF system. Theoutput from insect feeding monitors is a variable-voltage signal over time. This variability is caused bychanges in electrical resistance across the feedinginsectÕs stylets (for AC systems), or by changes inresistance in addition to biologically generated volt-age sources (e.g., membrane potentials) for DCsystems (Tjallingii 1998, Walker, 1998). These vari-ations in voltage signal occur in discrete sections ofuniform patterns called waveforms and are corre-lated with distinct probing and feeding behaviors(McLean and Kinsey 1967, 1968; Tjallingii 1978,1985).
Postacquisition analysis of EMIF data formerlywas rather labor-intensive because waveform dura-tions had to bemeasuredmanually frompaper print-outs. A number of researchers have developed soft-
This article reports the results of research only. Mention of aproprietary product does not constitute an endorsement or a rec-ommendation by USDA for its use.
1 Department of Plant Pathology and Physiology, Clemson Uni-versity, 120 Long Hall, Box 340377, Clemson, SC 29634Ð0377.
2 Department of Entomology, Wageningen Agricultural Univer-sity, P.O. Box 8031, NL-6700 EH Wageningen, The Netherlands.

ware to record and analyze EMIF data by computer.Noyes et al. (1990) wrote data acquisition and anal-ysis software in BASIC, C, and 8086 assembly lan-guage under MS-DOS for use with AC EMIF sys-tems. For usewithDCEMIF systems, Stylet versions1.0, 2.0, and 2.3 (Tjallingii and Mayoral 1992) andMacStylet (Febvay et al. 1996) were written inASYST (ScientiÞc ÔtoolboxÕ software, Keithley-Met-rabyte, Taunton, MA), and QuickBasic, respec-tively. An upgraded version of MacStylet, written inC11 and adapted for DOS and PowerPC systems,is under development (Febvay et al. 1996). Finally,Gruenhagen andBackus (1996) designedEMIFdataacquisition and analysis software for AC EMIF sys-tems using Streamer (Keithley-Metrabyte), Reßex,and SuperKey (Borland, Scotts Valley, CA).
Researchers so far were forced to write their owndata acquisition and data analysis software becauseprofessional data acquisition software was too ex-pensive and typically lacked the analysis functionsrequired for this particular application. To over-come this obstacle, we developed an EMIF analysismethod using commercially available professionaldata acquisition software in conjunction with a pop-ular spreadsheet program. EMIF recordings weremade using Windaq (Dataq Instruments, Akron,OH). Waveform transitions were identiÞed and ex-ported to Þle using the Notepad File utility ofWinDaq/EX (Dataq Instruments). This data Þle (orany data Þle containing waveform codes and cumu-lative time) is then imported into a custom-designedMicrosoft Excel EMIF workbook (Excel for Win-dows, version 5.0 or 7.0, or Excel 97, Microsoft,Redmond, WA) where it is automatically analyzed.
TheEMIF analysis systempresented in this articlehas the following advantages over existing systems:(1) it takes advantage of the advanced capabilitiesoffered by professional data acquisition software(e.g., real-time display of waveforms during record-ing), while Microsoft Excel is the most widely usedspreadsheet software; (2) the system can be used inconjunctionwith bothAC andDCEMIF systems foruse with any homopteran species, and (3) the ExcelEMIF workbook is fast, ßexible, and user-friendly.
Materials and Methods
EMIF Data Acquisition. The EMIF recordingsthat were used to develop and test the methoddescribed in this paper were made using 1-channelor 4-channel versions of an AC electronic insectfeeding monitor (Missouri monitor, produced bythe Electronic Instrument Laboratory, University ofMissouri, Columbia) (Backus and Bennett 1992).Recordings were made with data acquisition soft-ware (WinDaq/200, Dataq Instruments 1994) andhardware (DI-200 plug-in board [Dataq Instru-ments 1993] andDI-205 external signal I/Opanel, 16channels, 16-bit resolution, 25-Hz sampling rate[82,900 Hz max], Dataq Instruments, Akron, OH).All recordings could be viewed simultaneously andin real time. Post-acquisition waveform identiÞca-
tion was performed using WinDaq/EX playback andanalysis software.
Waveform Identification. In WinDaq/EX (DataqInstruments 1992) (Fig. 1A), the data cursor (Fig.1B) can be moved along the recorded signal usingthe mouse or the left and right arrow keys. With thecursor at the start of the recording, the keyboardcommand Alt-n will bring up the Notepad File win-dow that will prompt the user for a Þlename (useextension WNF, for WinDaq Notepad File). Use ofthe Notepad File function is simple and is describedin detail in the WinDaq manual. Its use will bebrießy summarized here. After bringing up theNotepad File Function by hitting Alt-n at the be-ginning of the EMIF data Þle, the user is promptedto enter the code for the waveform recorded attime 5 0, which is typically the baseline. The choiceof codes for the different waveforms is entirely upto the user. However, waveform codes must be 1Ð5characters long and should all be of identical length.Next, the data cursor ismoved along the signal to thebeginning of the next waveform, and, after pressingAlt-n, the user enters the code assigned to this nextwaveform. This procedure is repeated for all sub-sequent transitions between adjacent waveforms.The format of a Windaq Notepad File (WNF) isillustrated in Fig. 1C. For each waveform code en-tered by the user, the WNF Þle automatically addsthe time at which the waveform was determined tobegin, and the voltage levels (Fig. 1D, in italics) inall channels recorded. The latter are not used in theanalysis and are discarded by the Excel EMIF work-book during data import.
Data File Analysis. WNF Þles are analyzed usinga custom-designed Microsoft Excel workbook (Mi-crosoft Excel 5.0, Microsoft Excel for Windows 95[version 7.0], or Microsoft Excel 97) (Microsoft1993, 1995, 1995Ð1996) (Fig. 1H). However, dataÞles from other data acquisition software or manu-ally measured or compiled waveform data can alsobe analyzed as long as they conform to a simple2-column formatÑcolumn 1 contains waveformcodes (1Ð5 characters); column 2 contains the timethat each waveform begins, measured in secondsfrom the beginning of the recording (cumulativetime, Fig. 1F), or the duration of each individualwaveform occurrence (Fig. 1G). Which of these 2data-Þle formats is imported is automatically deter-mined by the Excel EMIF workbook during import.
The EMIF workbook consists of a title page fol-lowed by 7 so-called worksheets (Fig. 1H). To ac-commodate use of the EMIF workbook with mon-itors with different resolutions, the user can selectfrom 5 different zoom factors on each worksheet(Fig. 2G). Each worksheet also has a “..” and a “,,”button (Fig. 2H) to page forward and backwardthrough the workbook. Even though these buttonsare present on all 7 worksheets, they are shown onlyfor worksheet II in Fig. 2. Each worksheet is de-scribed in detail below.
146 Vol. 91, no. 1ANNALS OF THE ENTOMOLOGICAL SOCIETY OF AMERICA
Worksheet I—Instructions. The procedure theuser needs to follow to analyze an EMIF data Þlesuccessfully is presented in worksheet I.
Worksheet II—Specifics. Experiment-speciÞc vari-ables (Fig. 2A) and 3 custom variables (Fig. 2B) canbe entered in worksheet II. The names “custom1,”
“custom2,” and “custom3” can be changed to what-ever the user desires. On the right side of worksheetII, the codes that the user wants to assign to eachwaveform (described above under “waveform iden-tiÞcation”) are entered (Fig. 2C). The 1st codeentered must be for baseline (“z” in the example in
Fig. 1. Diagram of a new method to analyze recordings of electronically monitored insect feeding behavior (EMIF).Waveforms are identiÞed by the user using WinDaq/EX postacquisition software (A). The data cursor (B) is movedacross the signal to the transition between 2 successive waveform occurrences, and the “Notepad File” utility is usedto save a code that speciÞes the type of waveform following the transition to a Windaq Notepad File (WNF) (C). Alongwith each waveform code entered by the user, a WNF Þle automatically stores the time at which the correspondingwaveforms were determined to begin (0.00E 1 00, 3.46E 1 01, 6.51E 1 01, and others). Following the times, the WNFÞle also automatically stores the voltage levels (in italics, D), but these are not used in the analysis and are discardedduring data import (E). Data import is not limited to WNF Þles. Any EMIF Þle that adheres to a simple 2-column formatcan be imported (F, G). The 1st column must contain the waveform codes, and the 2nd column must contain eitherthe start of each waveform from the beginning of the recording (F), or the duration of each individual waveform (G).Data Þles are imported (E) into worksheet III of the EMIF Workbook (H). This Microsoft Excel EMIF workbook consistsof 7 individual worksheets. The arrows (I) indicate the ßow of information among the worksheets. Worksheet I explainshow the workbook is organized, how data Þles are analyzed, and provides the user with a guided tour through the entireworkbook. Experiment-speciÞc variables are entered into worksheet II (see Fig. 2), and EMIF data Þles are importedinto worksheet III (see Fig. 3). In worksheet IV, information from worksheets II and III is used to analyze the data Þle(see Fig. 4). Results are summarized in worksheet V (see Fig. 5a), are formatted for further statistical analysis inworksheet VI (see Fig. 5b), and are presented graphically in worksheet VII (see Fig. 6).
January 1998 VAN GIESSEN AND JACKSON: ELECTRONICALLY MONITORED FEEDING BEHAVIOR 147

Fig. 2). Up to 10 waveform codes can be entered, inno particular order. The user must specify the num-ber of characters (1Ð5) used for waveform codesbelow this list (Fig. 2D). As noted previously, allwaveform codes must have the same number ofcharacters. Any remarks pertaining to the recordingcan be entered at the bottom of this worksheet (Fig.2F).
Each time the user enters information, MicrosoftExcel automatically recalculates all the formulascontained in all the worksheets in the workbook.Automatic calculation will substantially slow downanalysis on older computers. Therefore, the defaultsetting for calculation is “manual.” This means thatafter all appropriate changes have been made to theworkbook, the user should press function key F9 to
instruct Excel to recalculate all formulas. On fastercomputers, the user can change calculation to “au-tomatic” by pressing a button on worksheet II (Fig.2E).
A custom EMIF workbook can be created (e.g.,tailored to a particular insect species or experiment)by saving a version of the workbook with a customset of variables and waveform codes under a uniqueÞlename.
Worksheet III—Data. EMIF data Þles are im-ported into the EMIF workbook by pressing 1 of 2buttons positioned on worksheet III (Fig. 3A). Thebutton labeled “WNF Format” lets the user importWinDaq Notepad Files, and the button labeled“EMIF data File” permits the user to load any dataÞle conforming to the aforementioned 2-column
Fig. 2. Example of worksheet II of the Excel workbookfor the analysis of electronically monitored insect feedingbehavior. Only the shaded areas contain information en-tered by the user. The information in this Þgure is merelya speciÞc example. On the left side of this worksheet, theuser enters experiment-speciÞc variables such as experi-ment code, Þlename, date, etc. (A), and 3 custom variables(B) (in this example custom variable 1 has been assignedthe name “morph”). On the right of this worksheet, theuser deÞnes the (10 possible) codes assigned to the variouswaveforms (C), and the number of characters (1Ð5) usedfor waveform codes (D). Depending on the speed of thecomputer, the user can toggle between automatic andmanual recalculation by pressing the button positionednext to, in this case, “manual” (E). Any remarks pertainingto the recording can be entered at the bottom of thisworksheet (F). To accommodate use of the EMIF work-book with monitors with different resolutions, the user canselect from 5 different zoom factors (80, 100, 120, 140, and160%) (G). In addition, each worksheet has a “Sheet For-ward” (..) and a “Sheet Backward” (,,) button (H) tomove forward and backward through the EMIF workbook.Even though these buttons are present on all 7 worksheets,they are shown only in this Þgure.
Fig. 3. Example of worksheet III of the Excel work-book for the analysis of electronically monitored insectfeeding behavior. By pressing 1 of 2 buttons (A), the usercan import data Þles with various formats (see Fig. 1 C, F,and G). In addition, data can be typed directly into thisworksheet or data can be cut and pasted from other ExcelÞles or other applications. After importing a data Þle,waveforms that are not speciÞed in worksheet II aremarked with an “x” (coding error), and waveform codesthat occur twice in a row are indicated by a “1” (dupli-cation error) (B). Pressing the button labeled “Show Er-rors” (C) will reduce the visible part of the data Þle to justthe detected coding and duplication errors (D) to facili-tate correction of long data Þles. Pressing the button la-beled “Show All” will again show the complete data Þle.
148 Vol. 91, no. 1ANNALS OF THE ENTOMOLOGICAL SOCIETY OF AMERICA
formats. Import of both Þle types is performed usingMicrosoft ExcelÕs “Text Import Wizard” (a Wizardis an interactive feature in modern software guidingthe user through a multistep procedure). Whileusing the “Text Import Wizard” to import WNF Þles,the user should designate the comma as delimiter.For import of any other EMIF data Þles, the comma,tab, semicolon, space, or any user-deÞned delimitercan be used. The user also can enter data directly
into worksheet III, or copy and paste data fromanother Excel Þle or from another application. Inthese cases, the user must add the word ÔendÕ to thebottom of the column with the waveform codes(during automated data import as described above,“end” is added automatically).
After data import, coding and duplication errorsare automatically detected and reported. A codingerror is a discrepancy between the waveform codes
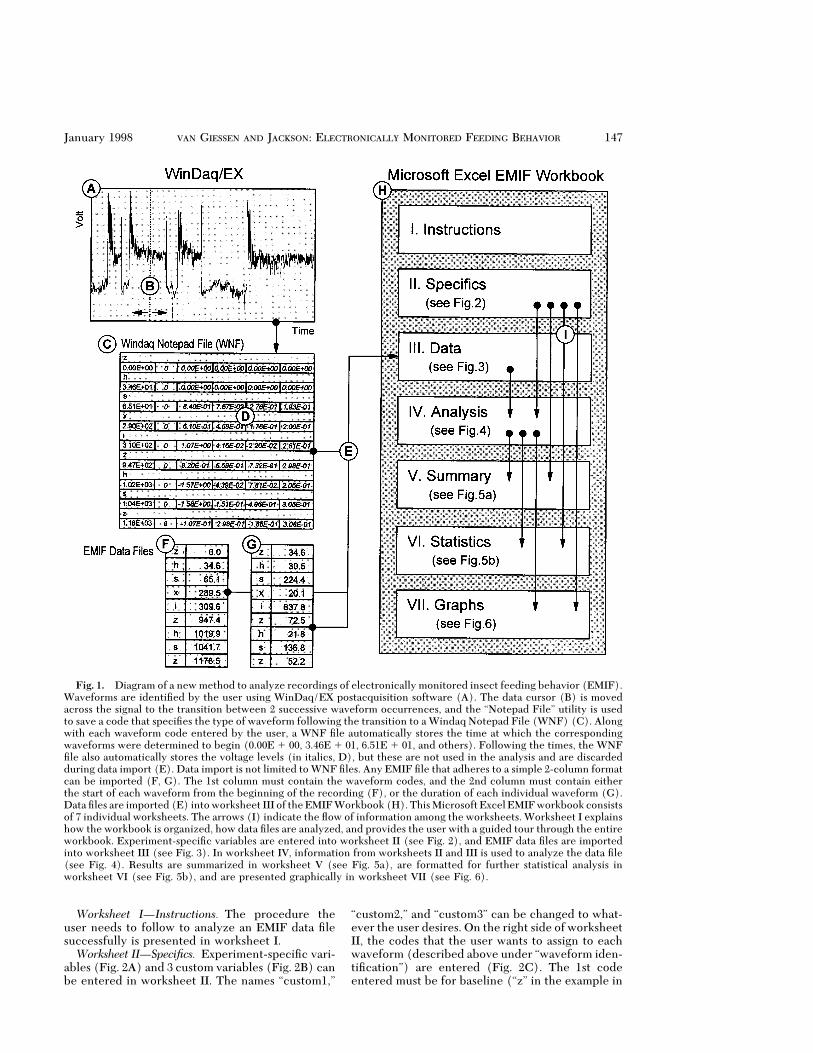
Fig. 4. Example of worksheet IV of the Excel workbook for the analysis of electronically monitored insect feedingbehavior. In this worksheet, data Þles (indicated in gray) (A) are analyzed automatically after import. Parameters suchas total number, total duration, average duration, and percentage (total duration of a waveform/total duration ofrecording) are calculated for each waveform (B) through automatic sorting of the waveform durations from the dataÞleinto the respective worksheet columns assigned to each waveform (C). Also, the start of each successive probe isautomatically determined (D), and a number of probe parameters are calculated (E). To the right of the experiment-speciÞc variables listed at the top of the worksheet (F), a number of checks (G) provide the user with an easy way tocheck for errors (CE 5 coding errors; DE 5 duplication errors; the labels “percent,” “total,” “count,” and “probe” referto 4 internal checks). In addition, “x” or “1” signs will appear in the column (headed E) next to the waveform codes(H) to indicate coding and duplication errors, respectively (similar to worksheet III, see Fig. 3). In the example in thisÞgure, no such errors were detected.
January 1998 VAN GIESSEN AND JACKSON: ELECTRONICALLY MONITORED FEEDING BEHAVIOR 149

entered by the user in worksheet II (“SpeciÞcs”),and the codes encountered in the imported data Þle.Codes not previously speciÞed in worksheet II aremarked with an “x” in this worksheet (Fig. 3B) andin worksheet IV (Fig. 4H). Such discrepancies couldbe caused either by an oversight when listing codesin worksheet II or a typographical error in the wave-form column of the imported data Þle. Similarly, awaveform code listed twice in a row (duplicationerror) will be marked by a plus sign (1) (Figs. 3Band 4H). Pressing the button labeled “Show Errors”(Fig. 3C) will reduce the visible part of the data Þleto just the detected errors (Fig. 3D), facilitatingcorrection of long data Þles. Pressing the “Show All”button will again show the complete data Þle.
Worksheet IV—Analysis. In worksheet IV, the du-ration of each individual waveform occurrence iscalculated and copied to the column assigned to thatwaveform code (Fig. 4C). This facilitates calcula-tion of the total number of occurrences, the totaland average duration, and the percentage of thetotal recording for each waveform (Fig. 4B). Also,the start of each subsequent probe is determined (asthe transition between baseline and any other wave-form, Fig. 4D), and the total number of probes, thetotal and average probe duration, and the percent-
age of the whole recording spent probing are cal-culated (Fig. 4E). As was the case in worksheet III,“x” or “1” signs will appear in the column left of thewaveform codes (Fig. 4H) to indicate coding andduplication errors, respectively. (In the examplegiven in Fig. 4, no errors were detected.) Aftereliminating any coding or duplication errors inworksheet III, the internal checks (“percent,” “to-tal,” “count,” and “probe”) at the top of worksheetIV should indicate “OK”, and CE (number of codingerrors) and DE (number of duplication errors)should be 0 (Fig. 4G). If this is not the case, theremay be an error in the cumulative time column (e.g.,not all numbers increase successively going downthe time column), which may require editing of theoriginal EMIFdata Þle before import intoworksheetIII.
Worksheet V—Summary. Apart from the experi-ment-speciÞc variables (Fig. 5A), worksheet V liststhe waveform parameters (Fig. 5B) and probingparameters (Fig. 5C) calculated in worksheet IV.The user can print out the summary by pressing abutton on the worksheet (Fig. 5D).
Worksheet VI—Statistics. The information pro-vided by the user in worksheet II and the resultsfrom the analysis in worksheet IV are automatically
Fig. 5. Examples of worksheets V and VI of the Excel workbook for the analysis of electronically monitored insectfeeding behavior. Worksheet V (a) lists, apart from the experiment-speciÞc variables (A), a number of parameters foreach waveform (B) and a number of probe parameters (C). The user can print out the summary by pressing button (D).Worksheet VI (b) presents the data in a format suitable for appending it to similar Þles for further statistical analysis.
150 Vol. 91, no. 1ANNALS OF THE ENTOMOLOGICAL SOCIETY OF AMERICA

combined into an output Þle in worksheet VI. Itsformat facilitates appending it to similar Þles forfurther statistical analysis (SAS Institute 1989).
Worksheet VII—Graphs. The percentage distri-bution of the variouswaveforms is presented in a bargraph in worksheet VII (Fig. 6). A 2nd bar graphshows the average duration of each waveform. Thegraph can be printed out by pressing a button on theworksheet.
System Requirements. WinDaq software (or itsolder DOS version CODAS; Dataq Instruments1990), Microsoft Excel 5.0, Microsoft Excel for Win-dows 95, and Microsoft Excel 97 run under Mi-crosoft Windows 3.1 or Microsoft Windows 95/NT.The EMIF workbook can also be used with Mi-crosoft Excel for Macintosh (M. Serrano, personalcommunication). The Þle size of the EMIF work-book is 2.02 MB. At least 16 MB of RAM is requiredfor the workbook to run properly.
EMIF Analysis. The method described in thisarticle was used to analyze EMIF recordings of 2homopteran species. Recording A was made of anapterous virginoparous cotton aphid, Aphis gossypiiGlover (Homoptera: Aphididae), feeding on Mex-ican lime, Citrus aurantifolia Swingle, provided byRay K. Yokomi (Horticultural Research Laboratory,USDAÐARS Orlando, FL). EMIF recording B (not
shown) was made of an adult female leafhopper,Empoasca kraemeri Ross & Moore (Homoptera: Ci-cadellidae), feeding on Phaseolus vulgaris L. (com-mon bean, cultivar BAT41), provided by Miguel S.Serrano (Department of Entomology, University ofMissouri, Columbia, MO). To determine the speedwithwhich these 2 recordings could be analyzed,wetimed the various analysis steps.
Results and Discussion
Previously developed software for acquisition andanalysis of EMIFdata has certain disadvantages. Thesoftware written by Noyes et al. (1990) was foundto be incompatible with other computers (J. C.Reese, personal communication), and Stylet(Tjallingii and Mayoral 1992), MacStylet (Febvay etal. 1996), and the system developed by Gruenhagenand Backus (1996) do not provide real-time on-screen display during data acquisition. However,during use of either program, the signal being re-corded can be viewed on a chart recorder or oscil-loscope. Because recordings can last many hoursand several insects may be monitored simulta-neously, being able to view all recordings in realtime is very convenient. Problems can be spottedduring recording and possibly corrected. Also, in
Fig. 6. Example of worksheet VII of the Excel workbook for the analysis of electronically monitored insect feedingbehavior. The distribution in time and the average duration of the different waveforms are presented in a bar graph,with the experiment-speciÞc variables listed underneath.
January 1998 VAN GIESSEN AND JACKSON: ELECTRONICALLY MONITORED FEEDING BEHAVIOR 151

the system developed by Gruenhagen and Backus(1996), the complete data Þle must be converted toASCII format, after which the user must add a timecolumn to the variable voltage column. In addition,the user must keep track of probe numbers manu-ally.
All of the data acquisition programs describedabove were written by the users. Commerciallyavailable data acquisition software is likely to bemore sophisticated than these programs, but arerelatively expensive (.$2,500). However, the highinitial costs of professional data acquisition softwareis compensated for by the considerable time savingsof researchers not having to develop their own soft-ware. Most data acquisition software provides real-time display of waveforms, while the user is pre-sented with various tools to explore the signal afterrecording. For instance, in WinDaq/EX, it is possi-ble to zoom in on sections of the recorded signal toexamine waveform transitions in more detail.
In addition to cost, the lack of speciÞc tools for theanalysis of EMIF data has been another obstacle forthe use of professional data-acquisition software.Use of the EMIF workbook removes this obstacle,and has the following advantages over currentlyavailable systems:
Waveform Code Flexibility. Unlike STYLET, theEMIF workbook can be tailored to the different setsofwaveforms generated by various homopteran spe-cies (e.g., aphids, planthoppers, leafhoppers, white-ßies, psyllids). In addition, the user can use codes ofup to 5 characters long.
Data File Compatibility. The EMIF workbook canbe used in conjunction with all data acquisitionsoftware capable of exporting waveform codes andcumulative time, and all data Þles with a 2-columnformat (column 1: waveform code; column 2: cu-mulative time; see Fig. 1). The same format can beachieved if waveform codes and transition times arecompiled by hand.
EMIF System Compatibility. Originally, the EMIFworkbook was developed for use with WinDaq andthe Missouri AC insect feeding monitor (Backus andBennett 1992). However, the workbook can be usedfor the analysis of EMIF recordings made with anyother data acquisition software with signals fromeither AC or DC systems.
Speed of Analysis. We timed the steps involved inthe analysis of recordings A (A. gossypii on C. au-rantifolii, duration: 4 h) and B (E. kraemeri on P.vulgaris, duration: 2.8 h) (Fig. 7). Using WinDaqÕsNotepad Utility, the identiÞcation and separation ofthe 73 waveform occurrences contained in record-ing A took 5 min and 40 s, whereas it took '30 minto identify and separate the 351 waveforms occur-rences in recording B. This means that it took ap-proximately 5 s to identify a single waveform oc-currence and save it to Þle. Obviously, the timeneeded to recognize and mark various waveformswill depend on the quality of the recording, wave-form variability, the number of waveforms to iden-
Fig. 7. Analysis of 2 recordings of electronically mon-itored insect feeding behavior. Recording A is of an adultapterous virginoparous A. gossypii (cotton aphid) feedingon C. arantifolii (Mexican lime). Recording B is of an adultfemale of E. kraemeri (leafhopper), feeding on P. vulgaris(common bean).
152 Vol. 91, no. 1ANNALS OF THE ENTOMOLOGICAL SOCIETY OF AMERICA

tify, the level of experience of the user, and com-puter speed.
The time spent analyzing recording A using theEMIF workbook can be subdivided as follows: (1)60 s to Þll out the speciÞc experimental variables inworksheet II (this will take less time when a seriesof similar Þles are being analyzed); (2) between 20 s(using a 200-MHz Pentium Pro PC) and 45 s (usinga 66-MHz Pentium PC) to import the data Þle intothe workbook; (3) 10Ð20 s to rename and save theworkbook to ßoppy or hard disk, depending on thecomputer used. This means that the complete anal-ysis of recording A took between 1 and 2 min. Theanalysis of recording B (351 waveforms) took onlyslightly longer.
Reliable pattern recognition software to charac-terize waveforms automatically has yet to be devel-oped. Tjallingii (1988) and Rahbe et al. (1998) in-vestigated whether signal analysis through Fourierprocessing could lead to automated recognition, butthey were not successful. The major reason for thislack of success is the enormous variability inherentto EMIF data (Tjallingii 1988). No doubt, advancesin pattern recognition will facilitate this in the fu-ture (we are exploring new approaches). However,until reliable pattern recognition software is devel-oped, the human eye is superior in distinguishingthe sometimes subtle waveform transitions.
Studying various aspects of insectÐplant relation-ships through the use of EMIFusually involvesmanyhours of recordings. Clearly, combining thestrengths of WinDaq and Excel now substantiallyincreases the speed with which these recordings canbe analyzed. The Microsoft Excel EMIF workbookis currently being used in the Department of Ento-mology, University of Missouri, Columbia (E. A.Backus, personal communication), and at the De-partment of Entomology, University of California,Riverside (G. P. Walker, personal communication).
A copy of the EMIF workbook can be obtainedfree of charge from W.A.v.G. However, we will beable to offer only limited technical support.
Acknowledgments
We are grateful to Miguel Serrano and Ray Yokomi forthe use of their EMIF recordings. We also thank ElaineBackus, Jennifer Grob, Rufus Isaacs, Layna Reed, MiguelSerrano, Freddy Tjallingii, Greg Walker, Sarah AliceWyndham, and Ray Yokomi for their helpful comments onthe manuscript. This is Technical Contribution No. 4217,South Carolina Agricultural Experiment Station, ClemsonUniversity, Clemson, SC.
References Cited
Backus, E. A. 1994. History, development and applica-tions of the electronic insect feeding monitor, pp. 1Ð51.In M. M. Ellsbury, E. A. Backus, and D. L. Ullman[eds.], History, development, and application of ACelectronic insect feeding monitors. Thomas Say Pub-lications in Entomology: Proceedings. EntomologicalSociety of America, Lanham, MD.
Backus, E. A., and W. H. Bennett. 1992. A new AC elec-tronic insect feedingmonitor for Þne-structure analysisof waveforms. Ann. Entomol. Soc. Am. 85: 437Ð444.
Blua, M. J., and T. M. Perring. 1992. Effects of zucchiniyellow mosaic virus on colonization and feeding be-havior of Aphis gossypii (Homoptera: Aphididae) ala-tae. Environ. Entomol. 21: 578Ð585.
Caillaud, C. M., J. S. Pierre, B. Chaubet, and J. P. Di Pietro.1995. Analysis of wheat resistance to the cereal aphidSitobion avenae using electrical penetration graphs andßow charts combined with correspondence analysis.Entomol. Exp. Appl. 75: 9Ð18.
Calatayud, P. A., Y. Rahbe, W. F. Tjallingii, M. Tertuliano,and B. Le Ru. 1994. Electronically recorded feedingbehaviour of cassava mealybug on host and non-hostplants. Entomol. Exp. Appl. 72: 219Ð232.
Calderon, J. D., and E. A. Backus. 1992. Comparison ofthe probing behaviors of Empoasca fabae and E. krae-meri (Homoptera, Cicadellidae) on resistant and sus-ceptible cultivars of common beans. J. Econ. Entomol.85: 88Ð99.
Cole, R. A. 1994. Locating a resistance mechanism to thecabbage aphid in two wild Brassicas. Entomol. Exp.Appl. 71: 23Ð31.
Dataq Instruments. 1990. Advanced CODAS, userÕs man-ual, software release level 3, manual revision C. DataqInstruments, Akron, OH.
1992. Windaq and Windaq/EX userÕs guide, softwarerelease level 1.31, manual revision C. Dataq Instru-ments, Akron, OH.
1993. DI-200 PGH/PGL software-conÞgurable analogand digital I/Oboard, userÕsmanual,manual revisionC.Dataq Instruments, Akron, OH.
1994. Windaq/200 userÕs manual, manual revision C.Dataq Instruments, Akron, OH.
Febvay, G., Y. Bonnin, R. Bournocille, S. Delrot, and J. L.Bonnemain. 1988. Resistance of different lucerne cul-tivars to the pea aphid Acyrthosiphon pisum: inßuenceof phloem composition on aphid fecundity. Entomol.Exp. Appl. 48: 127Ð134.
Febvay, G., Y. Rahbe, and M. van Helden. 1996. Mac-Stylet, software to analyse electrical penetration graphdata on the Macintosh. Entomol. Exp. Appl. 80: 105Ð108.
Gruenhagen, N. M., and E. A. Backus. 1996. An inexpen-sive analog-to-digital system for computer-assistedmeasurement of electronic monitoring waveforms. J.Agric. Entomol. 13: 73Ð78.
Hardie, J., M. Holyoak, N. J. Taylor, and D. C. Griffiths.1992. The combination of electronic monitoring andvideo-assisted observations of plant penetration byaphids and behavioural effects of polygodial. Entomol.Exp. Appl. 62: 233Ð239.
Kimsey, R. B. 1994. Measuring and recording arthropodblood feeding, pp. 122Ð128. In M. M. Ellsbury, E. A.Backus, and D. L. Ullman [eds.], History, development,and application of AC electronic insect feeding mon-itors. Thomas Say Publication in Entomology: Proceed-ings. Entomological Society of America, Lanham, MD.
McLean, D. L., and M. G. Kinsey. 1964. A technique forelectronically recording aphid feeding and salivation.Nature (Lond.) 203: 1358Ð1359.
1965. IdentiÞcation of electrically recorded curve pat-terns associated with aphid salivation and ingestion.Nature (Lond.) 205: 1130Ð1131.
1967. Probing behaviour of the pea aphid Acyrthosiphonpisum. I. DeÞnitive correlation of electronically re-
January 1998 VAN GIESSEN AND JACKSON: ELECTRONICALLY MONITORED FEEDING BEHAVIOR 153
corded waveforms with aphid probing. Ann. Entomol.Soc. Am. 60: 400Ð406.
1968. Probing behaviour of the pea aphid, Acyrthosiphonpisum. II. Comparison of salivation and ingestion inhost and non-host plant leaves. Ann. Entomol. Soc. Am.61: 730Ð739.
Microsoft. 1993. Microsoft Excel version 5.0, userÕs man-ual. Microsoft, Redmond, WA.
1995. Getting results with Microsoft OfÞce for Windows95, version 7.0. Microsoft, Redmond, WA.
1995–1996. Getting results with Microsoft OfÞce 97. Mi-crosoft, Redmond, WA.
Montllor, C. B., and W. F. Tjallingii. 1989. Stylet pene-tration by two aphid species on susceptible and resis-tance lettuce. Entomol. Exp. Appl. 52: 103Ð111.
Noyes, S., D. C. Margolies, J. C. Reese, A. Dixon, and P. J.Bramel-Cox. 1990. Computer acquisition and analysisof insect feeding monitor data. Ann. Entomol. Soc. Am.83: 1224Ð1231.
Powell, G., R. Harrington, and N. J. Spiller. 1992. Styletactivities and potato virus Y vector efÞciencies by theaphids Brachycaudus helichrysi and Drepanosiphumplatanoidis. Entomol. Exp. Appl. 62: 293Ð300.
Powell, G., J. Hardie, and J. A. Pickett. 1993. Effects of theantifeedant polygodial on plant penetration by aphids,assessed by video and electrical monitoring. Entomol.Exp. Appl. 68: 193Ð200.
Rahbe, Y., G. Febvay, B. Delobel, and G. Bonnot. 1998.Amino acids and proteins as cues in aphid-plant inter-actions. In G. P. Walker and E. A. Backus [eds.], Prin-ciples and applications of electronic monitoring andother techniques in the study of homopteran feedingbehavior. Thomas Say Publications in Entomology:Proceedings. Entomological Society of America, Lan-ham, MD (in press).
Reese, J. C., D. C. Margolies, E. A. Backus, S. Noyes, P. J.Bramel-Cox, and A.G.O. Dixon. 1994. Characteriza-tion of aphid host plant resistance and feeding behaviorthrough use of a computerized insect feeding monitor,pp. 52Ð72. In M. M. Ellsbury, E. A. Backus, and D. L.Ullman [eds.], History, development, and applicationof AC electronic insect feeding monitors. Thomas SayPublications in Entomology: Proceedings. Entomolog-ical Society of America, Lanham, MD.
SAS Institute. 1989. SAS/STAT userÕs guide, version 6,4th ed. SAS Institute, Cary, NC.
Saxena, R. C., and Z. R. Khan. 1985. Electronically re-corded disturbances in feeding behavior of Nephotettixvirescens (Homoptera: Cicadellidae) on neem oil-treated rice plants. J. Econ. Entomol. 78: 222Ð226.
Shuckle, R. H., and C. Quiroz. 1994. Use of the electronicmonitor for the study of aphids as vectors of barleyyellow dwarf virus, pp. 106Ð121. In M. M. Ellsbury, E. A.Backus, and D. L. Ullman [eds.], History, development,
and application of AC electronic insect feeding mon-itors, Thomas Say Publications in Entomology: Pro-ceedings. Entomological Society of America, Lanham,MD.
Tjallingii, W. F. 1978. Electronic recording of penetra-tion behaviour by aphids. Entomol. Exp. Appl. 24: 721Ð730.
1985. Electrical nature of recorded signals during styletpenetration by aphids. Entomol. Exp. Appl. 38: 177Ð186.
1988. Electrical recording of stylet penetration activi-ties, pp. 95Ð108. In A. K. Minks and P. Harrewijn [eds.],World crop pests. AphidsÑtheir biology, natural ene-mies and control, vol. 2A. Elsevier, Amsterdam.
1998. Comparison of AC and DC systems for electronicmonitoring of stylet penetration activities by ho-mopterans. In G. P. Walker and E. A. Backus [eds.],Principles and applications of electronic monitoringand other techniques in the study of homopteran feed-ing behavior. Thomas Say Publications in Entomology:Proceedings. Entomological Society of America, Lan-ham, MD (in press).
Tjallingii, W. F., and A. Mayoral. 1992. Criteria for host-plant acceptance by aphids, pp. 280Ð282. In Proceed-ings of the 8th International Symposium on Insect-Plant Relationships, Wageningen, 9Ð13 March 1992.Kluwer Academic, Dordrecht.
Ullman, D. E., C. O. Qualset, and D. L. McLean. 1988.Feeding responses of Rhopalosiphum padi (Ho-moptera: Aphididae) to barley yellow dwarf virus re-sistant and susceptible barley varieties. Environ. En-tomol. 17: 988Ð991.
Walker, G. P. 1998. A beginnerÕs guide to electronic mon-itoring of homopteran probing behavior. In G. P.Walker and E. A. Backus [eds.], Principles and appli-cations of electronic monitoring and other techniquesin the study of homopteran feeding behavior. ThomasSay Publications in Entomology: Proceedings. Ento-mological Society of America, Lanham, MD (inpress).
Wayadande, A. C. 1994. Electronic monitoring of leaf-hoppers and planthoppers: feeding behavior and ap-plication in host-plant resistance studies, pp. 86Ð105. InM. M. Ellsbury, E. A. Backus, and D. L. Ullman [eds.],History, development, and application of AC elec-tronic insect feeding monitors. Thomas Say Publica-tions in Entomology: Proceedings. Entomological So-ciety of America, Lanham, MD.
Webster, J. A., D. R. Porter, C. A. Baker, and D. W.Mornhinweg. 1993. Resistance to Russian wheataphid (Homoptera: Aphididae) in barley: effects onaphid feeding. J. Econ. Entomol. 86: 1603Ð1608.
Received for publication 10 June 1997; accepted 3 October1997.
154 Vol. 91, no. 1ANNALS OF THE ENTOMOLOGICAL SOCIETY OF AMERICA