FEEDING THE MEDICALLY FRAGILE INFANT - Carolina ...
198
FEEDING THE MEDICALLY FRAGILE INFANT: EFFECTS OF FEEDING METHOD AND MILK FLOW ON PHYSIOLOGY AND BEHAVIOR Britt Frisk Pados A dissertation submitted to the faculty of the University of North Carolina at Chapel Hill in partial fulfillment of the requirements for the degree of Doctor of Philosophy in the School of Nursing. Chapel Hill 2015 Approved by: Suzanne M. Thoyre Katherine E. Gregory George Knafl Gail C. McCain Marcia Van Riper
-
Upload
khangminh22 -
Category
Documents
-
view
0 -
download
0
Transcript of FEEDING THE MEDICALLY FRAGILE INFANT - Carolina ...

FEEDING THE MEDICALLY FRAGILE INFANT: EFFECTS OF FEEDING METHOD AND MILK FLOW ON PHYSIOLOGY AND BEHAVIOR
Britt Frisk Pados
A dissertation submitted to the faculty of the University of North Carolina at Chapel Hill in partial fulfillment of the requirements for the degree of Doctor of Philosophy in the School of Nursing.
Chapel Hill 2015
Approved by:
Suzanne M. Thoyre
Katherine E. Gregory
George Knafl
Gail C. McCain
Marcia Van Riper

ii
2015 Britt Frisk Pados
ALL RIGHTS RESERVED

iii
ABSTRACT
Britt Frisk Pados: Feeding the Medically Fragile Infant: Effects of Feeding Method and Milk Flow on Physiology and Behavior
(Under the direction of Dr. Suzanne M. Thoyre)
Background: Oral feeding is a challenge for medically fragile infants, particularly those born
preterm and with hypoplastic left heart syndrome (HLHS). Rate of milk flow from the bottle nipple affects
physiologic stability during feeding in preterm infants, but little data is available on the flow rates of
nipples used for feeding hospitalized infants. Changes in milk flow rate likely also affect physiologic
stability of infants with HLHS during feeding, however no studies have evaluated responses of infant with
HLHS to different feeding methods. Feeding interventions aim to reduce feeding stress in fragile infants to
promote growth. Outcome measures that sensitively measure stress are needed.
Purpose: This dissertation is composed of three studies. Chapter two presents milk flow rates of
nipples used for feeding hospitalized infants. Chapter three examines the physiologic and behavioral
responses of an infant with HLHS to variations in milk flow rate. Chapter four evaluates heart rate
variability (HRV) as a feeding intervention outcome measure in the preterm infant.
Methods: In chapter two, milk flow rates of ten each of 29 nipple types (n=290) were tested using
a breast pump. In chapter three, a single-subject with HLHS was evaluated during feeding with either a
slow-flow or standard-flow nipple. In chapter four, a secondary analysis of heart rate variability indices
was conducted from a test of a co-regulated approach to feeding preterm infants (n=14).
Results: In chapter two, flow rates varied widely between nipple types. Chapter three found that
oral feeding was distressing for an infant with HLHS, regardless of flow condition. In chapter four, only
SD12, a non-linear index of HRV, was found to significantly differentiate between feeding methods.
Conclusions: Data on milk flow rates from nipples used in hospitals will guide clinicians in nipple
selection. Information on flow rates of nipples used after discharge is needed. Further study of how
infants with HLHS respond to oral feeding is necessary to identify supportive strategies. Research is also
warranted to further evaluate the use of HRV, particularly non-linear indices, during feeding interventions.

iv
To my husband, Matt, and my children, Frank, Lily, and Caroline. Matt, thank you for your unending
support throughout this journey. Through the challenges of being full-time students, to moving to Boston,
and then becoming parents, you have always valued my work and supported me in every way possible.
Frank, Lily, and Caroline, thank you for helping me to find balance through this process – reminding me to
laugh, dance, and enjoy the little things in life. Being your mother has helped me to understand so much
about the experiences of the families of the children that I am trying to help with this work.

v
ACKNOWLEDGMENTS
I would like to express my sincere gratitude to the countless people who have supported me
throughout this journey. Thank you to my parents, Eric and Gwen, to Frank and Barbara Pados, and the
rest of our family members (Kristen, Carl, Kelly, Kristin, Kaitlyn, and Patrick) for helping to care for our
children when I needed to travel to UNC or to work on my dissertation. I could not have done this without
all of your support.
Thank you to my dissertation chair and mentor, Suzanne Thoyre. You have believed in me,
brought me in to your family, housed me and fed me on my many visits to UNC. You have taught me so
much and you have challenged me to do my best work, but you have also reminded me to find balance
between my work and my family and allowed me the flexibility to do all of these things in a way that have
made these seven years a true blessing.
Thank you to my dear friends, Hayley Estrem and Jinhee Park. Your friendship, support, and
mutual interest in helping children with feeding difficulty have helped me to stay motivated through
challenging days. When the “Feeding Flock” first came to be, I could never have imagined the incredible
work we would do as a team and the profound impact that it would have on all of our careers. Cara
McComish and Eric Hodges, thank you for your contributions to the “Flock.” We have big dreams!
I also want to thank my other classmates and friends from the first and second year Supper Club:
Ashley Leak, Carolyn Jones, Kobie Leiper, and Brandy Mechling. You all made the first two years of this
journey a little more fun. Also, thank you Leslie Davis for your support as a fellow mother of twins and
your prayers during the scary time of being on bedrest with Frank & Lily.
Thank you also to Brant Nix, Ginny Neelon, and the Biobehavioral Laboratory in the School of
Nursing at the University of North Carolina at Chapel Hill for supporting my work. I also want to
acknowledge the people at Boston Children’s Hospital who welcomed me in and helped me conduct my
study, including Jean Connor, Sandy Mott, Hillary Kuzdeba, Eugene Goldfield, Jennifer Perez, Kayla

vi
O’Brien, and Kim Barbas. To the family of the sweet baby girl who participated in my study – I am so
grateful that you allowed me in to your world during such a stressful time – thank you.
Finally, I would like to thank my committee members, Katherine Gregory, George Knafl, Gail
McCain, and Marcia Van Riper, for their guidance and thoughtful review of this dissertation.
Scholarship support for my doctoral studies was provided by the Elizabeth Scott Carrington
Scholarship at the University of North Carolina School of Nursing (2007 & 2008) and Glaxo Fellowship
Fund Scholarship at the University of North Carolina School of Nursing (2009).
The study “Milk Flow Rates from Bottle Nipples used for Feeding Hospitalized Infants” was
funded by a Sigma Theta Tau International Honor Society of Nursing Alpha Alpha Chapter Research
Award (2013) and was supported by the National Institute of Nursing Research of the National Institutes
of Health under Award Number 5F31NR011262 (Pados). This project was supported by the Biobehavioral
Laboratory at the University of North Carolina at Chapel Hill School of Nursing. Nipples for testing were
donated by Boston Children’s Hospital, Duke University Medical Center, Floating Hospital for Children at
Tufts University Medical Center, Groningen University (Netherlands), Handi-Craft Co., Medela Inc., North
Carolina Children’s Hospital, Royal Children’s Hospital (Australia), and University of Oklahoma Children’s
Hospital.
The study “Effects of Milk Flow on the Physiologic and Behavioral Responses to Feeding in an
Infant with Hypoplastic Left Heart Syndrome” was funded by a Sigma Theta Tau International Honor
Society of Nursing Alpha Alpha Chapter Research Award (2014), Linda Waring Matthews Research Fund
Scholarship (2012 & 2014), James and Patricia Leak Fund for Nursing Research (2013), and was
supported by the National Institute of Nursing Research of the National Institutes of Health under Award
Number 5F31NR011262 (Pados).
The study “Heart Rate Variability as a Feeding Intervention Outcome Measure in the Preterm
Infant” was supported by the National Institute of Nursing Research of the National Institutes of Health
under Award Number T32 NR007091 (PI: Mishel; Pre-doc Fellow: Pados). The original data for this
project was collected by Dr. Suzanne M. Thoyre and was funded by the National Institute of Nursing
Research of the National Institutes of Health under Award Number K01 NR007668 (Thoyre).

vii
TABLE OF CONTENTS
LIST OF TABLES .......................................................................................................................................... x
LIST OF FIGURES ....................................................................................................................................... xi
LIST OF ABBREVIATIONS.......................................................................................................................... xii
CHAPTER 1: INTRODUCTION .................................................................................................................... 1
Background and Significance .................................................................................................................... 1
Etiology of Feeding Difficulties .............................................................................................................. 2
Milk Flow ............................................................................................................................................... 3
Theoretical Framework ............................................................................................................................. 4
Conceptualization of Feeding within the Polyvagal Theory .................................................................. 6
Aims .......................................................................................................................................................... 9
Prepared Manuscripts ............................................................................................................................... 9
REFERENCES ........................................................................................................................................ 11
CHAPTER 2: MILK FLOW RATES FROM BOTTLE NIPPLES USED FOR FEEDING HOSPITALIZED INFANTS ..................................................................................... 15
Overview ................................................................................................................................................. 15
Introduction.............................................................................................................................................. 16
Methods................................................................................................................................................... 17
Statistical Analysis .............................................................................................................................. 19
Results .................................................................................................................................................... 19
Comparisons Within Brand ................................................................................................................. 20
Comparisons Within Category ............................................................................................................ 21
Discussion ............................................................................................................................................... 21
viii
Conclusions ......................................................................................................................................... 23
REFERENCES ........................................................................................................................................ 33
CHAPTER 3: EFFECTS OF MILK FLOW ON THE PHYSIOLOGIC AND BEHAVIORAL RESPONSES TO FEEDING IN AN INFANT WITH HYPOPLASTIC LEFT HEART SYNDROME ............ 35
Overview ................................................................................................................................................. 35
Introduction.............................................................................................................................................. 36
Theoretical Framework ....................................................................................................................... 37
Methods................................................................................................................................................... 38
Sample and Setting ............................................................................................................................. 38
Flow Conditions ................................................................................................................................... 39
Study Feeding Protocol ....................................................................................................................... 39
Variables & Measures ......................................................................................................................... 40
Statistical Analysis .............................................................................................................................. 43
Results .................................................................................................................................................... 44
Infant Characteristics .......................................................................................................................... 44
Feeding Description ............................................................................................................................ 46
Behavioral Outcomes .......................................................................................................................... 46
Physiologic Outcomes ......................................................................................................................... 47
Discussion ............................................................................................................................................... 49
Conclusion ........................................................................................................................................... 55
APPENDIX 3.1: STUDY FEEDING PROTOCOL ................................................................................... 66
APPENDIX 3.2: PROTOCOL FOR DATA COLLECTION ...................................................................... 67
APPENDIX 3.3: OBSERVATIONAL CODING SCHEME ....................................................................... 75
APPENDIX 3.4: RESPIRATORY DATA MANAGEMENT PROTOCOL ................................................. 84
APPENDIX 3.5: LINEAR MIXED MODELING ANALYSIS OF CHAPTER 3 DATA ............................... 94
REFERENCES ...................................................................................................................................... 110

ix
CHAPTER 4: HEART RATE VARIABILITY AS A FEEDING INTERVENTION OUTCOME MEASURE IN THE PRETERM INFANT ............................................................................... 115
Overview ............................................................................................................................................... 115
Introduction............................................................................................................................................ 116
Heart Rate Variability ............................................................................................................................ 116
Theoretical Framework ......................................................................................................................... 118
State of the Literature ............................................................................................................................ 119
Methods................................................................................................................................................. 121
Setting and Sample ........................................................................................................................... 121
Procedure .......................................................................................................................................... 122
Statistical Analysis ............................................................................................................................ 124
Results .................................................................................................................................................. 124
Sample .............................................................................................................................................. 124
Results .............................................................................................................................................. 125
Discussion ............................................................................................................................................. 126
Conclusion ......................................................................................................................................... 127
APPENDIX 4.1: LINEAR MIXED MODELING ANALYSIS OF CHAPTER 4 DATA ............................. 131
REFERENCES ...................................................................................................................................... 181
CHAPTER 5: DISCUSSION ...................................................................................................................... 184
Future Directions For Research ............................................................................................................ 184
REFERENCES ...................................................................................................................................... 187

x
LIST OF TABLES
Table 2.1. Nipples Tested ........................................................................................................................... 25
Table 3.1. Specific Measures ...................................................................................................................... 57
Table 3.2. Coding Scheme Descriptions of Behavioral State, Engagement, and Organization ................ 58
Table 3.3. Feeding Experience ................................................................................................................... 58
Table 3.4. Feeding Description ................................................................................................................... 59
Table 3.5. Feeder Actions ........................................................................................................................... 59
Table 3.6. Behavioral Outcomes During Feeding ....................................................................................... 60
Table 3.7. Heart Rate Indices ..................................................................................................................... 60
Table 3.8. Physiologic Changes During Feeding by Flow Condition .......................................................... 61
Table 3.9. Respiratory Indices .................................................................................................................... 62
Table 4.1. Demographic and Clinical Data ............................................................................................... 128
Table 4.2. Feeder Actions ......................................................................................................................... 129
Table 4.3. Standard Physiologic Measures .............................................................................................. 129
Table 4.4. Heart Rate Variability Measures .............................................................................................. 129

xi
LIST OF FIGURES
Figure 2.1. Hydrostatic pressure measured ................................................................................................ 26
Figure 2.2. Nipple testing equipment .......................................................................................................... 26
Figure 2.3. Milk flow rates of all nipples tested ........................................................................................... 27
Figure 2.4. Coefficient of variation of milk flow of all nipples ...................................................................... 28
Figure 2.5. Mean coefficient of variation of milk flow rates by nipple brand ............................................... 29
Figure 2.6. Milk flow rates of slow-flow nipples ........................................................................................... 30
Figure 2.7. Milk flow rates of standard-flow nipples .................................................................................... 31
Figure 2.8. Milk flow rates of premature nipples ......................................................................................... 32
Figure 3.1. Illustration of post-surgical cardiac anatomy of Baby G ........................................................... 63
Figure 3.2. Heart Rate plotted every 1 minute ............................................................................................ 64
Figure 3.3. Oxygen saturation plotted every 1 minute ................................................................................ 64
Figure 3.4. Respiratory rate plotted every 1 minute .................................................................................... 65
Figure 4.1. Poincaré plot with SD1 (red) and SD2 (green) ....................................................................... 130
Figure 4.2. Poincaré plot examples of low SD12 and high SD12 ............................................................. 130

xii
LIST OF ABBREVIATIONS
ANS Autonomic nervous system
Ao Aorta
Base Baseline (this abbreviation was only used in tables 3.7 and 3.9)
bpm Beats per minute
C-CHEWS Cardiac Children's Hospital Early Warning Score
CHD Congenital heart disease
ChOMPS Child Oral and Motor Proficiency Scale
CLD Chronic lung disease
cm centimeters
CoReg Coregulated approach to feeding preterm infants; name of the feeding intervention in the study presented in chapter 4
CV Coefficient of variation
DMNX Dorsal motor nucleus
DOL Day of life
ECG Electrocardiogram
FaMM Feed Family Management Measure: Feeding
Feed Feeding (this abbreviation was only used in tables 3.7 and 3.9)
FR Flow restrictor
GI Gastrointestinal
HF High frequency
HLHS Hypoplastic left heart syndrome
HR Heart rate
HRV Heart rate variability
Hz Hertz
IBI Interbeat interval
IVH Intraventricular hemmorhage
LA Left atrium
LF Low frequency
LMM Linear mixed modeling

xiii
LV Left ventricle
min minute
mins minutes
mL milliliters
mmHg millimeters of mercury
MPA Main pulmonary artery
ms2 milliseconds squared
NA Nucleus ambiguous
NBRS Neurobiological Risk Score
NG Nasogastric
No Number
02 Oxygen
Pedi-EAT Pediatric Eating Assessment Tool
PMA Post-menstrual age
PNS Parasympathetic nervous system
Qp:Qs Pulmonary to systemic blood flow ratio
RA Right atrium
RDS Respiratory distress syndrome
Recover Recovery (this abbreviation was only used in tables 3.7 and 3.9)
RIP Respiratory inductance plethysmography
RR Respiratory rate
rri R wave to R wave interval
RSA Respiratory sinus arrhythmia
RV Right ventricle
RV-PA Right ventricle to pulmonary artery
S1P Stage 1 palliation
S2P Stage 2 palliation
SA Sinoatrial
SD Standard deviation
SD1 Length of the transverse axis of the ellipse in a Poincaré plot

xiv
SD12 Ratio of the length of the transverse axis to the length of the longitudinal axis of the ellipse in a Poincaré plot
SD2 Length of the longitudinal axis of the ellipse in a Poincaré plot
secs seconds
SNS Sympathetic nervous system
Sp02 Oxygen saturation
1
CHAPTER 1: INTRODUCTION
Background and Significance
Feeding is one of the most basic tasks for sustaining life once an infant is no longer being
nourished in utero. While in utero, the infant rehearses sucking, swallowing, and breathing behaviors but
nutrition and oxygenation are supported by the placenta. As the infant transitions to the extra-uterine
environment, survival is dependent on effective coordination of fluid management (sucking and
swallowing) with respiration in order to take in enough milk for adequate growth while also sustaining
oxygenation. Feeding is essential for survival, but it is not simple. It is extremely complex and its success
is dependent on a variety of factors both internal and external to the infant. The infant must have the
anatomic structure and neurologic capacity to perform the physical act of feeding as well as the
physiologic support to maintain stability during this act. All of this must happen within an environment that
is safe and supportive of the task of feeding.
Given the complexity of feeding, even the healthy infant often encounters difficulty early on.
Feeding difficulty is the inability to safely and/or effectively intake adequate nutrition for appropriate
growth. These difficulties usually manifest as physiologic instability during feeding or early cessation of
feeding prior to the ingestion of adequate nutrition. In the healthy infant, these difficulties are usually
manageable given a supportive environment and attentive caregiver. As the infant matures in the first
days and weeks of life, these feeding difficulties are typically overcome. On the other hand, the medically
fragile infant, whose anatomic, physiologic, and/or neurologic systems are not supportive of feeding, is
likely to encounter significant difficulty with feeding, which is much more challenging to manage and
which may further compromise their already vulnerable systems. Infants with congenital heart disease
(CHD) and infants born preterm (prior to 37 weeks post-menstrual age (PMA)) are two examples of
medically fragile infants who frequently encounter difficulty feeding.
2
Etiology of Feeding Difficulties
The etiology of feeding difficulties in infants born preterm and those with CHD is slightly different,
although there are overlapping features. In this dissertation, chapter 3 focuses on a subset of infants with
CHD who have hypoplastic left heart syndrome (HLHS) and chapter 4 focuses on infants born preterm.
HLHS is a defect of the left side of the heart that results in a hypoplastic left ventricle. Survival is
dependent on either heart transplantation or a series of three palliative reconstructive surgeries of the
cardiac anatomy that results in a single right ventricle (RV) providing blood flow to both the pulmonary
and systemic circulations (Feinstein, et al., 2012); the latter is the more common course of action. The
first surgical procedure (stage 1 palliation (S1P)) typically occurs in the first week of life and the second
procedure occurs around 4-6 months of age. The inter-stage period between S1P and stage 2 palliation
(S2P) is a time associated with high mortality (Hehir, Cooper, Walters, & Ghanayem, 2011) and feeding
difficulties have been implicated in contributing to inter-stage death (Hehir, et al., 2011). Infants with
HLHS were chosen at the focus of chapter 3 because this particular group of infants is at high risk for
feeding difficulty.
Common risk factors for oral feeding difficulty among preterm infants and those with HLHS
include prolonged periods of intubation or respiratory support and prolonged nasogastric tube feedings in
conjunction with periods of time without oral feeding (Barlow, 2009; Dodrill, et al., 2004; Einarson &
Arthur, 2003). Both groups also frequently have elevated respiratory rates at rest; preterms as a result of
respiratory distress syndrome and infants with HLHS as a result of pulmonary overcirculation. Studies of
nutritive sucking in infants have shown that ventilation is markedly reduced during the sucking phase of
feeding, then stabilizes when the infant pauses to breathe (Mathew, 1991b). Physiologically normal
infants are able to increase ventilation during these pauses by increasing respiratory rate and/or tidal
volume (Mathew, 1991b). However, in physiologically compromised infants, the change in ventilation
during the initial continuous sucking phase may be too great to recover from and/or the challenge of
increasing ventilation to recover may interfere with their ability to continue nutritive sucking. Increased
ventilation needs at rest results in limited capacity for ventilatory interruption and also increases the risk of
aspiration associated with mistiming of the swallow (Barlow, 2009). Finally, both groups frequently
experience gastroesophageal reflux disease, which contributes to risk for feeding aversion (Hyman,

3
1994), and are at risk for swallowing dysfunction. Infants with HLHS are at risk for swallowing dysfunction
resulting from manipulation of the left recurrent laryngeal nerve during aortic arch reconstruction
(Sachdeva, et al., 2007). Preterm infants who have undergone surgical closure of a patent ductus
arteriosis are also at high risk for swallowing dysfunction (Benjamin, et al., 2010).
In addition to these common risk factors for oral feeding difficulty, infants who are born preterm
often encounter difficulty sucking and creating a latch to the bottle or breast as a result of immature oral
musculature. They also experience difficulty coordinating sucking, swallowing, and breathing as a result
of immature neurologic function (Barlow, 2009). Infants with HLHS have reduced oxygen levels as a
result of mixing of oxygenated and deoxygenated blood in the common atrium, which limits their capacity
for managing further decline in oxygen level resulting from ventilatory interruptions with oral feeding.
Infants with HLHS also typically have some cardiac dysfunction, which limits their ability to respond to the
activity of feeding, and both congenital and acquired neurologic abnormalities (Glauser, Rorke, Weinberg,
& Clancy, 1990a, 1990b), which influence the coordination of sucking, swallowing, and breathing.
Milk Flow
When medically fragile infants experience difficulty with bottle-feeding in the hospital, a common
strategy employed by nurses is to change the bottle nipple. This strategy is used across populations of
infants and results in changes in milk flow rate, as flow rates have been found to vary considerably
between different nipple types (Jackman, 2013; Mathew, 1988).
Milk flow is the rate at which milk transfers from the bottle to the mouth during feeding (Mathew,
1991b). Milk flow rate is one variable external to the infant that can affect the infants’ ability to safely
coordinate swallowing and breathing, and therefore the degree of stress associated with oral feeding (al-
Sayed, Schrank, & Thach, 1994; Mathew, 1991a). Given the common anatomical structures for
swallowing and breathing, swallowing requires closure of the airway and therefore a pause in respiration
(Barlow, 2009). In order to recover from this pause in respiration, it is necessary for the infant to increase
respiration in between swallows. It has been found, however, that some infants are not capable of
increasing respiration during the pause and therefore have decreased minute ventilation during feeding,
primarily as a result of decreased respiratory rates (al-Sayed, et al., 1994).

4
When milk flow is high, the infant is forced to either swallow at a frequency adequate to clear the
oropharynx from fluid to prevent aspiration (at the expense of breathing) (al-Sayed, et al., 1994) or divert
the milk away by allowing it to drool out his mouth or stop feeding altogether. Healthy, full-term infants
have some capacity for self-regulating the flow of milk by changing sucking rate (Schrank, Al-Sayed,
Beahm, & Thach, 1998) or pressure (Colley & Creamer, 1958; Mathew, Belan, & Thoppil, 1992). On the
other hand, premature infants, with immature neurologic and respiratory systems, have limited ability to
self-regulate flow (Mathew, et al., 1992). Unable to self-regulate milk flow, the premature infant exposed
to higher flow during bottle-feeding exhibits greater reduction in ventilation than full-term infants (Mathew,
1991a). Premature infants have also been found to drool more with high flow rates than full-term infants
(Kao, Lin, & Chang, 2010; Schrank, et al., 1998).
Jackman’s (2013) study is the only study of milk flow rates of currently available nipples. Her
findings were limited in the number of nipples tested and the methods used. Additional data on milk flow
rates between different types of nipples and variation in flow rate within a given type of nipple is needed
to guide clinicians in making decisions about nipple selection for supporting physiological stability during
oral feeding of medically fragile infants. The study presented in chapter 2 describes milk flow rates of
bottle nipples used for feeding hospitalized infants.
Although there is fairly good evidence that slower milk flow is more appropriate for infants who
are preterm (Kao, et al., 2010; Mathew, 1991a), it remains unknown how infants with HLHS respond to
changes in milk flow and what capacity they have to self-regulate flow as they attempt to integrate fluid
management and respiration despite both cardiac and respiratory compromise. No studies have
examined the physiologic or behavioral responses of infants with HLHS to the challenge of oral feeding.
More information is needed about this particularly fragile population of infants to identify strategies to
support them during oral feeding. Chapter 3 presents a study of the effects of differing milk flow rates on
an infant with HLHS.
Theoretical Framework
Physiologic homeostasis is coordinated by the autonomic nervous system (ANS), which is
responsible for distributing resources, such as blood, oxygen, and nutrients, to meet the demands of the
organism (Porges, 1992). In response to the challenge of feeding, physiologic changes in respiratory and

5
cardiac indices are expected. Physiologic changes can also manifest as behavioral changes during oral
feeding (Thoyre & Carlson, 2003). Polyvagal theory (Porges, 1995) provides a theoretical basis for
understanding the relationship between physiologic responses to stress and emotional, cognitive, and
behavioral regulation as an infant faces the dynamic challenge of oral feeding. An overview of the key
concepts of Polyvagal Theory will be presented as well as a conceptualization of feeding within the
theory.
Polyvagal Theory describes the physiologic response of mammals to stress as a function of the
two pathways of the vagus nerve (Porges, 1995). Stress is defined as a disruption in homeostasis, where
homeostasis is the stable state of an organism when internal needs are met (Porges, 1992). The
Polyvagal Theory states that the evolutionary development of the vagus nerve resulted in two pathways:
the myelinated nucleus ambiguous (NA) and the unmyelinated dorsal motor nucleus (DMNX) (Porges,
1995, 2009). While the NA controls the muscles of the supradiaphragmatic structures, such as the larynx,
pharynx, esophagus, soft palate, heart, head, and face, the DMNX controls the structures below the
diaphragm, particularly regulating the digestive functions of the gastrointestinal (GI) tract (Porges, 1995;
Rinaman, 2006). In addition to controlling the supradiaphragmatic structures, the NA is also responsible
for the coordination of sucking, swallowing, and breathing during feeding (Porges, 1995).
Polyvagal Theory explains the mammalian response to both low stress and high stress states.
Mammals are distinguished from reptiles by high baseline vagal tone with temporary decreases in
response to stress (Porges, 1995). During times of low stress, there is high vagal tone via the NA,
resulting in low heart rate (HR); variability of the heart rate around baseline; increased tone in the inner
ear for differentiation of human voices; preservation of metabolic resources for growth and restoration;
coordination of sucking, swallowing, and breathing for feeding; and increased tone of the muscles of the
head and face for social communication (Porges, 2007). Simultaneously, minimal input from the DMNX
during times of low stress encourages digestion and absorption of nutrients from the GI tract (Porges,
2001).
Conversely, with elevated stress levels, there is a hierarchical activation of the two stress
response systems. First, the sympathetic nervous system (SNS) responds by mobilizing resources to
meet the demands of the situation, resulting in increased HR, decreased heart rate variability (HRV),

6
activation of the stress response system of the hypothalamic pituitary axis (e.g., release of cortisol),
stimulation of the immune system (e.g., release of cytokines), and diversion of blood away from the GI
tract to the more vital organs such as the heart, brain, and lungs (Porges, 1992, 2009). HRV is the
fluctuation in the interval between consecutive normal heart beats and reflects the balance of input from
the sympathetic and parasympathetic divisions of the ANS (Schroeder, et al., 2004). High HRV, or a wide
range around baseline, indicates a well-functioning and adaptable ANS, while low HRV signifies inability
to adapt to increased physiologic demands (Verklan & Padhye, 2004).
If the SNS response is not able to reestablish homeostasis, the DMNX, the secondary system, is
activated resulting in disengagement, hypotonia, apnea, and bradycardia (Porges, 2003). The
unmyelinated DMNX is the portion of the vagus that is common to both mammals and reptiles and its
purpose is to conserve resources during stressful events (Porges, 1995). In reptiles, this response is
functional, allowing them to freeze in response to predators (Porges, 1995). Unfortunately, in mammals
who have relatively high oxygen needs, activation of the DMNX response and the resulting apnea and
bradycardia can result in life-threatening oxygen depletion (Porges, 2007). The three different functions of
the vagus allow mammals to not only thrive in safe environments, but survive in dangerous and life-
threatening ones as well (Porges, 2009).
Conceptualization of Feeding within the Polyvagal Theory
Polyvagal Theory states that the perception of an event as stressful is subjective and dependent
on the vulnerability of the individual at the time of the event (Porges, 1992; Porges, Doussard-Roosevelt,
Stifter, McClenny, & Riniolo, 1999). An event may be perceived as stressful if it is environmentally or
metabolically demanding or if it requires mental effort, attention, or social interaction (Porges, et al.,
1999). Feeding has the potential for being perceived as stressful by an infant for a number of reasons,
especially if the infant is physiologically compromised at rest. If the infant enters the feeding with unstable
physiology, this is compounded by the environmental, metabolic, and social interactional stresses of
feeding.
Feeding may be environmentally stressful because of light or noise. Feeding may also precipitate
metabolic stress if the infant experiences pain or if feeding competes with the infant’s ability to maintain
physiologic stability (Porges, 1992). The degree of ventilatory disruption associated with oral feeding,

7
combined with the respiratory needs of the infant at baseline, contribute to the degree of physiologic
stress associated with feeding. Finally, feeding may be stressful because it requires a great deal of
mental effort, attention, and social interaction, particularly if the infant is inexperienced with feeding, is
immature, or if the feeder does not adequately or appropriately respond to the infant’s needs (Porges,
2003).
When stressed during feeding, Polyvagal Theory suggests that the infant would respond by
withdrawal of vagal input from the NA, which would inhibit their ability to effectively coordinate sucking,
swallowing, and breathing and to accurately give the feeder facial cues about their hunger and/or satiety,
their level of fatigue, or their need to pause for respiration. Unknowingly, this may lead the feeder to either
end a feeding before the infant is satiated or to push the infant to continue to feed despite the infant’s
exhaustion or respiratory instability, which may further compromise an already physiologically vulnerable
infant. These theoretical changes are consistent with evidence of behavioral disorganization seen during
feeding of preterm infants (Pickler, Frankel, Walsh, & Thompson, 1996; Thoyre & Carlson, 2003) and
infants with CHD (Lobo & Michel, 1995).
Simultaneous with withdrawal of input from the NA, activation of the SNS would result in
increased HR and decreased HRV (Verklan & Padhye, 2004). Although an increase in HR is expected
with an activity such as feeding, the higher the HR, the more energy is expended to maintain physiologic
homeostasis and the less energy is available for growth. Additionally, as the HR rises above
approximately 180 beats per minute, ventricular filling time is diminished and oxygen consumption by the
myocardium is increased (Gupta, 2014). This may be tolerated in a healthy heart, but is extremely
problematic for infants with HLHS who are recovering from cardiac surgery and have reduced cardiac
function at rest.
Diversion of blood away from the GI tract inhibits the infant’s digestion and possibly places them
at risk for developing necrotizing enterocolitis, a disease of the bowel that is initiated by damage to the
intestinal mucosa from a hypoxic event and results in bacterial invasion, bowel necrosis, sepsis, and
possibly death (Giannone, Luce, Nankervis, Hoffman, & Wold, 2008; McElhinney, et al., 2000).
When feeding is supported in a manner that reduces the level of stress experienced by the infant,
vagal input from the NA is supported, which allows the infant to communicate with caregivers, coordinate

8
sucking, swallowing, and breathing for feeding, and to digest and absorb what they have eaten. At the
same time, a reduction in stress during feeding minimizes the risk of activation of the SNS and DMNX
stress pathways and therefore conserves energy and minimizes oxygen-depleting events such as apnea
and bradycardia. Since feeding is a frequent event, usually occurring approximately every three hours
during early infancy, and because the first several years of life are a critical period in the development of
the nervous system, the potential effects of the level of stress experienced during feeding go beyond
each individual feeding and may have long-term effects (Beauchaine, Gatzke-Kopp, & Mead, 2007).
If feeding is persistently stressful and accompanied by activation of the SNS and/or DMNX, the
developing nervous system may be trained to remain in a state appropriate for dangerous situations even
when the conditions are safe (Beauchaine, et al., 2007). This persistent activation may result in immune
system dysfunction, respiratory inefficiency, and psychosocial disorder (Porges, 2003). In medically
fragile children, immune system impairment and respiratory dysfunction may be further compromising and
even life-threatening.
Persistent activation of the SNS and/or DMNX and inability to appropriately alter vagal tone may
be potentially damaging to the developing nervous system and contribute to development of psychiatric
disorders associated with difficulties in social behavior, such as autism spectrum disorder (Porges, 2003).
An over-responsive nervous system has been found to be associated with high trait anxiety, which when
combined with poor vagal adjustment has been linked to anxiety and panic disorders (Beauchaine, et al.,
2007). Additionally, evaluation of a situation as being safe or dangerous is learned and if feeding is
consistently determined to be dangerous, the child may identify feeding as unsafe long after their
physiologic state has improved to make feeding safe, resulting in long-term difficulty with eating.
On the other hand, if feeding is consistently a non-stressful event and the environment is
perceived as safe, the nervous system is exercised to support social behavior, growth, and restoration
(Porges, 2003). Infants with appropriate vagal tone responses have been found to have less
temperamental difficulty (Stifter & Fox, 1990), better emotion regulation (Porter, Wouden-Miller, Silva, &
Porter, 2003), better attachment (Izard, et al., 1991), better social competence (Eisenberg, et al., 1995),
and more empathy towards others (Fabes, Eisenberg, & Eisenbud, 1993). Vagal activity from NA input
has also been found to support weight gain in infants by increasing gastric motility and release of food

9
absorption hormones and has been correlated with shorter hospital stay (DiPietro & Porges, 1991; Field &
Diego, 2008).
Polyvagal Theory offers a theoretical framework for conceptualizing the complexity of infant
feeding and the relationships between stress and emotional, cognitive, and behavioral regulation. The
degree of stress experienced during oral feeding has the potential for profound short-term and long-term
effects. As more research is done to evaluate feeding interventions to reduce feeding-related stress in
medically fragile infants, outcome measures are needed that will measure stress sensitively and, ideally,
provide early indicators of distress. Polyvagal Theory introduces HRV as a potential outcome measure of
stress. While several studies have evaluated HRV during feeding (Brown, 2007; Cohen, Brown, & Myers,
2009; Harrison, 2011; Harrison & Brown, 2012; Lappi, et al., 2007; McCain, Fuller, & Gartside, 2005;
McCain, Knupp, Fontaine, Pino, & Vasquez, 2010; Portales, et al., 1997; Suess, et al., 2000), only
McCain’s (2005) study has used HRV to evaluate the degree of stress experienced by infants during
feeding. Further research is needed to determine whether HRV is a sensitive enough measure to detect
alterations in the degree of stress related to different feeding strategies. The study presented in chapter 4
explores the use of HRV as a feeding intervention outcome measure in preterm infants.
Aims
This dissertation is composed of three studies that each contribute to the literature with regards to
feeding medically fragile infants. Specifically, the aims were to:
1. Present data on the milk flow rates and variability in flow of bottle nipples used for feeding
hospitalized infants.
2. Examine the physiologic and behavioral responses of an infant with HLHS to variations in milk
flow rate.
3. Evaluate the usefulness of HRV as a feeding intervention outcome measure in the preterm infant.
Prepared Manuscripts
The three-manuscript option was chosen in lieu of a traditional dissertation. Chapter one has
been an introduction to the problem of feeding medically fragile infants and the theoretical framework
within which the author conceptualizes this problem. Chapters two through four of this dissertation
present three manuscripts, which have been prepared for publication. Please note that references to

10
appendices will be removed prior to submission for publication. Chapter five provides a discussion of the
manuscripts, clinical implications of the findings, and presents plans for future study.
Chapter two is titled “Milk flow rates from bottle nipples used for feeding hospitalized infants.” The
purpose of this study was to evaluate milk flow rates from bottle nipples commonly used in hospitals for
feeding medically fragile infants in order to provide clinicians with evidence with which to base decisions
about nipple selection.
Chapter three is a presentation of a single-case experiment of the effects of milk flow on the
response to feeding in an infant with HLHS. This manuscript is titled “Effects of milk flow on the
physiologic and behavioral response to feeding in an infant with hypoplastic left heart syndrome.” The
purpose of this study was to examine the physiologic changes and observational indicators of distress
that occur when an infant with HLHS is bottle-fed with either a standard-flow nipple or a slow-flow nipple.
Chapter four is titled “Heart Rate Variability as a Feeding Intervention Outcome Measure in the
Preterm Infant.” The purpose of this study was to investigate the use of heart rate variability as a measure
of physiologic stress during feeding in a group of medically fragile preterm infants born at less than 35
weeks post-menstrual age.

11
REFERENCES
al-Sayed, L. E., Schrank, W. I., & Thach, B. T. (1994). Ventilatory sparing strategies and swallowing pattern during bottle feeding in human infants. Journal of Applied Physiology, 77(1), 78-83. Retrieved from http://jap.physiology.org/
Barlow, S. M. (2009). Oral and respiratory control for preterm feeding. Current Opinions in Otolaryngology
& Head and Neck Surgery, 17(3), 179-186. doi: 10.1097/MOO.0b013e32832b36fe Beauchaine, T. P., Gatzke-Kopp, L., & Mead, H. K. (2007). Polyvagal theory and developmental
psychopathology: Emotion dysregulation and conduct problems from preschool to adolescence. Biological Psychology, 74(2), 174-184. doi: 10.1016/j.biopsycho.2005.08.008
Benjamin, J. R., Smith, P. B., Cotten, C. M., Jaggers, J., Goldstein, R. F., & Malcolm, W. F. (2010). Long-
term morbidities associated with vocal cord paralysis after surgical closure of a patent ductus arteriosus in extremely low birth weight infants. Journal of Perinatology, 30(6), 408-413. doi: 10.1038/jp.2009.124
Brown, L. (2007). Heart rate variability in premature infants during feeding. Biological Research for
Nursing, 8(4), 283-293. doi: 10.1177/1099800406298542 Cohen, M., Brown, D. R., & Myers, M. M. (2009). Cardiorespiratory measures before and after feeding
challenge in term infants are related to birth weight. Acta Paediatrica, 98(7), 1183-1188. doi: 10.1111/j.1651-2227.2009.01284.x
Colley, J. R., & Creamer, B. (1958). Sucking and swallowing in infants. British Medical Journal, 2(5093),
422-423. Retrieved from www.bmj.com DiPietro, J. A., & Porges, S. W. (1991). Vagal responsiveness to gavage feeding as an index of preterm
status. Pediatric Research, 29(3), 231-236. doi: 10.1203/00006450-199103000-00003 Dodrill, P., McMahon, S., Ward, E., Weir, K., Donovan, T., & Riddle, B. (2004). Long-term oral sensitivity
and feeding skills of low-risk pre-term infants. Early Human Development, 76(1), 23-37. doi: 10.1016/j.earlhumdev.2003.10.001
Einarson, K. D., & Arthur, H. M. (2003). Predictors of oral feeding difficulty in cardiac surgical infants.
Pediatric Nursing, 29(4), 315-319. Retrieved from: http://www.pediatricnursing.net Eisenberg, N., Fabes, R. A., Murphy, B., Maszk, P., Smith, M., & Karbon, M. (1995). The role of
emotionality and regulation in children's social functioning: A longitudinal study. Child Development, 66(5), 1360-1384. doi: 10.1111/1467-8624.ep9510075268
Fabes, R. A., Eisenberg, N., & Eisenbud, L. (1993). Behavioral and physiological correlates of children's
reactions to others in distress. Developmental Psychology, 29, 655-663. doi: 10.1037/0012-1649.29.4.655
Feinstein, J. A., Benson, D. W., Dubin, A. M., Cohen, M. S., Maxey, D. M., Mahle, W. T., et al. (2012).
Hypoplastic left heart syndrome: Current considerations and expectations. Journal of the American College of Cardiology, 59(1 Suppl), S1-42. doi: 10.1016/j.jacc.2011.09.022
Field, T., & Diego, M. (2008). Vagal activity, early growth and emotional development. Infant Behavior
and Development, 31(3), 361-373. doi: 10.1016/j.infbeh.2007.12.008 Giannone, P. J., Luce, W. A., Nankervis, C. A., Hoffman, T. M., & Wold, L. E. (2008). Necrotizing
enterocolitis in neonates with congenital heart disease. Life Sciences, 82(7-8), 341-347. doi: 10.1016/j.lfs.2007.09.036

12
Glauser, T. A., Rorke, L. B., Weinberg, P. M., & Clancy, R. R. (1990a). Acquired neuropathologic lesions associated with the hypoplastic left heart syndrome. Pediatrics, 85(6), 991-1000. Retrieved from http://pediatrics.aappublications.org/
Glauser, T. A., Rorke, L. B., Weinberg, P. M., & Clancy, R. R. (1990b). Congenital brain anomalies
associated with the hypoplastic left heart syndrome. Pediatrics, 85(6), 984-990. Retrieved from http://pediatrics.aappublications.org/
Gupta, S., & Sinha, S.K. (2014). Shock and hypotension in the newborn. Retrieved October 25, 2014,
from http://emedicine.medscape.com/article/979128-overview Harrison, T. M. (2011). Trajectories of parasympathetic nervous system function before, during, and after
feeding in infants with transposition of the great arteries. Nursing Research, 60(3 Suppl), S15-27. doi: 10.1097/NNR.0b013e31821600b1
Harrison, T. M., & Brown, R. L. (2012). Autonomic nervous system function in infants with transposition of
the great arteries. Biological Research for Nursing, 14(3), 257-268. doi: 10.1177/1099800411407687
Hehir, D. A., Cooper, D. S., Walters, E. M., & Ghanayem, N. S. (2011). Feeding, growth, nutrition, and
optimal interstage surveillance for infants with hypoplastic left heart syndrome. Cardiology in the Young, 21 Suppl 2, 59-64. doi: 10.1017/S1047951111001600
Hyman, P. E. (1994). Gastroesophageal reflux: One reason why baby won't eat. Journal of Pediatrics,
125(6 Pt 2), S103-109. doi: 10.1016/S0022-3476(05)82933-6 Izard, C. E., Porges, S. W., Simons, R. F., Haynes, O. M., Hyde, C., Parisi, M., et al. (1991). Infant
cardiac activity: Developmental changes and relations with attachment. Developmental Psychology, 27(3), 432-439. doi: 10.1037/0012-1649.27.3.432.
Jackman, K. T. (2013). Go with the flow: Choosing a feeding system for infants in the neonatal intensive
care unit and beyond based on flow performance. Newborn & Infant Nursing Reviews, 13, 31-34. doi: 10.1053/j.nainr.2012.12.003
Kao, H. M., Lin, C. H., & Chang, Y. J. (2010). Feeding with cross-cut teats has better sucking effects and
oxygenation in preterm infants with chronic lung disease. Journal of Clinical Nursing, 19(21-22), 3016-3022. doi: 10.1111/j.1365-2702.2010.03290.x
Lappi, H., Valkonen-Korhonen, M., Georgiadis, S., Tarvainen, M. P., Tarkka, I. M., Karjalainen, P. A., et
al. (2007). Effects of nutritive and non-nutritive sucking on infant heart rate variability during the first 6 months of life. Infant Behavior and Development, 30(4), 546-556. doi: 10.1016/j.infbeh.2007.04.005
Lobo, M. L., & Michel, Y. (1995). Behavioral and physiological response during feeding in infants with
congenital heart disease: A naturalistic study. Progress in Cardiovascular Nursing, 10(3), 26-34. Retrieved from http://onlinelibrary.wiley.com/journal/10.1111/(ISSN)1751-7117
Mathew, O. P. (1988). Nipple units for newborn infants: A functional comparison. Pediatrics, 81(5), 688-
691. Retrieved from http://pediatrics.aappublications.org/ Mathew, O. P. (1991a). Breathing patterns of preterm infants during bottle feeding: Role of milk flow.
Journal of Pediatrics, 119(6), 960-965. doi: 10.1016/S0022-3476(05)83056-2 Mathew, O. P. (1991b). Science of bottle feeding. Journal of Pediatrics, 119(4), 511-519. doi:
10.1016/S0022-3476(05)82397-2

13
Mathew, O. P., Belan, M., & Thoppil, C. K. (1992). Sucking patterns of neonates during bottle feeding: Comparison of different nipple units. American Journal of Perinatology, 9(4), 265-269. doi: 10.1055/s-2007-994786
McCain, G. C., Fuller, E. O., & Gartside, P. S. (2005). Heart rate variability and feeding bradycardia in
healthy preterm infants during transition from gavage to oral feeding. Newborn & Infant Nursing Reviews, 5(3), 124-132. doi: 10.1053/j.nainr.2005.04.005
McCain, G. C., Knupp, A. M., Fontaine, J. L., Pino, L. D., & Vasquez, E. P. (2010). Heart rate variability
responses to nipple feeding for preterm infants with bronchopulmonary dysplasia: Three case studies. Journal of Pediatric Nursing, 25(3), 215-220. doi: 10.1016/j.pedn.2009.01.009
McElhinney, D. B., Hedrick, H. L., Bush, D. M., Pereira, G. R., Stafford, P. W., Gaynor, J. W., et al.
(2000). Necrotizing enterocolitis in neonates with congenital heart disease: Risk factors and outcomes. Pediatrics, 106(5), 1080-1087. Retrieved from http://pediatrics.aappublications.org/
Pickler, R. H., Frankel, H. B., Walsh, K. M., & Thompson, N. M. (1996). Effects of nonnutritive sucking on
behavioral organization and feeding performance in preterm infants. Nursing Research, 45(3), 132-135. Retrieved from http://journals.lww.com/nursingresearchonline/pages/default.aspx
Porges, S. W. (1992). Vagal tone: A physiologic marker of stress vulnerability. Pediatrics, 90(3), 498-504.
Retrieved from http://pediatrics.aappublications.org/ Porges, S. W. (1995). Orienting in a defensive world: Mammalian modifications of our evolutionary
heritage. A polyvagal theory. Psychophysiology, 32(4), 301-318. Retrieved from http://www.blackwellpublishing.com/journal.asp?ref=0048-5772.
Porges, S. W. (2001). The polyvagal theory: Phylogenetic substrates of a social nervous system.
International Journal of Psychophysiology, 42(2), 123-146. doi: S0167-8760(01)00162-3 Porges, S. W. (2003). The polyvagal theory: Phylogenetic contributions to social behavior. Physiology &
Behavior, 79(3), 503-513. doi: S0031938403001562 Porges, S. W. (2007). The polyvagal perspective. Biological Psychology, 74(2), 116-143. doi:
10.1016/j.biopsycho.2006.06.009 Porges, S. W. (2009). The polyvagal theory: New insights into adaptive reactions of the autonomic
nervous system. Cleveland Clinic Journal of Medicine, 76 Suppl 2, S86-90. doi: 10.3949/ccjm.76.s2.17
Porges, S. W., Doussard-Roosevelt, J. A., Stifter, C. A., McClenny, B. D., & Riniolo, T. C. (1999). Sleep
state and vagal regulation of heart period patterns in the human newborn: An extension of the polyvagal theory. Psychophysiology, 36(1), 14-21. Retrieved from http://onlinelibrary.wiley.com/journal/10.1111/(ISSN)1469-8986
Portales, A. L., Porges, S. W., Doussard-Roosevelt, J. A., Abedin, M., Lopez, R., Young, M. A., et al.
(1997). Vagal regulation during bottle feeding in low-birthweight neonates: Support for the gustatory-vagal hypothesis. Developmental Psychobiology, 30(3), 225-233. doi: 10.1002/(SICI)1098-2302(199704)30:3<225::AID-DEV5>3.0.CO;2-R
Porter, C. L., Wouden-Miller, M., Silva, S. S., & Porter, A. E. (2003). Marital harmony and conflict: Links to
infants' emotional regulation and cardiac vagal tone. Infancy, 4(2), 297-307. doi: 10.1207/S15327078IN0402_09
Rinaman, L. (2006). Ontogeny of hypothalamic-hindbrain feeding control circuits. Developmental
Psychobiology, 48(5), 389-396. doi: 10.1002/dev.20146

14
Sachdeva, R., Hussain, E., Moss, M. M., Schmitz, M. L., Ray, R. M., Imamura, M., et al. (2007). Vocal cord dysfunction and feeding difficulties after pediatric cardiovascular surgery. Journal of Pediatrics, 151(3), 312-315. doi: 10.1016/j.jpeds.2007.03.014
Schrank, W., Al-Sayed, L. E., Beahm, P. H., & Thach, B. T. (1998). Feeding responses to free-flow
formula in term and preterm infants. Journal of Pediatrics, 132(3 Pt 1), 426-430. doi: 10.1016/S0022-3476(98)70014-9
Schroeder, E. B., Whitsel, E. A., Evans, G. W., Prineas, R. J., Chambless, L. E., & Heiss, G. (2004).
Repeatability of heart rate variability measures. Journal of Electrocardiology, 37(3), 163-172. doi: S0022073604000421
Stifter, C. A., & Fox, N. A. (1990). Infant reactivity: Physiological correlates of newborn and 5-month
temperament. Developmental Psychology, 26(4), 582-588. doi: 10.1037/0012-1649.26.4.582. Suess, P. E., Alpan, G., Dulkerian, S. J., Doussard-Roosevelt, J., Porges, S. W., & Gewolb, I. H. (2000).
Respiratory sinus arrhythmia during feeding: A measure of vagal regulation of metabolism, ingestion, and digestion in preterm infants. Developmental Medicine & Child Neurology, 42(3), 169-173. doi: 10.1111/j.1469-8749.2000.tb00065.x
Thoyre, S., & Carlson, J. (2003). Preterm infants' behavioural indicators of oxygen decline during bottle
feeding. Journal of Advanced Nursing, 43(6), 631-641. doi: 10.1046/j.1365-2648.2003.02762.x. Verklan, M. T., & Padhye, N. S. (2004). Spectral analysis of heart rate variability: An emerging tool for
assessing stability during transition to extrauterine life. Journal of Obstetric, Gynecologic, and Neonatal Nursing, 33(2), 256-265. doi: 10.1177/0884217504263301

15
CHAPTER 2: MILK FLOW RATES FROM BOTTLE NIPPLES USED FOR FEEDING HOSPITALIZED INFANTS
Overview
Medically fragile infants often experience physiologic compromise during oral feeding. Milk flow is
an easily manipulated variable that may contribute to the degree of physiologic instability experienced.
Very little evidence is currently available to guide the selection of a bottle nipple for these infants. This
study tested the milk flow rates and the variability in flow of currently available nipples used for bottle-
feeding hospitalized infants. Clinicians in three countries were informally surveyed regarding nipples used
for feeding hospitalized infants. Twenty-nine nipple types were identified and 10 nipples of each type
were tested by measuring the amount of infant formula expressed in one minute using a breast pump.
Mean milk flow rate (mL/min) and coefficient of variation (CV) were used to compare nipples within brand
and within category (i.e., Slow, Standard, Premature). Flow rates varied widely between nipples, ranging
from 2.10 for the Enfamil Cross-cut to 85.34 mL/min for the Dr. Brown’s Y-cut. Variability of flow rates
among nipples of the same type ranged from a CV of 0.05 for Dr. Brown’s Level 1 Standard- and Wide-
Neck to 0.42 for the Enfamil Cross-cut. Mean CV by brand ranged from 0.08 for Dr. Brown’s to 0.36 for
Bionix. Given the wide range of flow rates and variability of nipples used for feeding hospitalized infants,
nipple selection is an important decision in supporting the medically fragile infant during feeding. This
study provides clinicians with information for choosing the best available nipple to support oral feeding in
fragile infants.
Keywords: bottle feeding, infant, premature infant, feeding methods

16
Introduction
Feeding can be physiologically challenging for premature and medically fragile infants who are
learning to orally feed. While breast-feeding may be the ultimate goal, most hospitalized infants will
receive some bottle-feedings. Many variables contribute to the infant’s ability to bottle-feed safely and
effectively, but one easily manipulated variable is the rate of milk flow from the bottle nipple. Milk flow is
defined as the rate of transfer of milk from the bottle into the mouth during sucking. The rate of milk flow
can affect infants’ ability to integrate fluid management with respiration and the degree of physiologic
instability associated with feeding (al-Sayed, Schrank, & Thach, 1994; Mathew, 1991a). When an infant
swallows, the airway is closed for about one second to prevent aspiration of milk (Mathew, 1991b). As
milk flow increases and requires increased swallowing frequency, ventilation is increasingly interrupted
and respiratory rate decreases (al-Sayed, et al., 1994). When milk flow slows, the swallow is delayed until
a critical volume is accumulated (al-Sayed, et al., 1994), allowing the infant to breathe more and better
maintain physiologic stability during feeding.
Rate of milk flow varies considerably between different brands and types of nipples (Jackman,
2013; Mathew, 1988). Healthy, full-term infants are typically resilient feeders and are able to alter sucking
rate (Schrank, Al-Sayed, Beahm, & Thach, 1998) and pressure (Colley & Creamer, 1958; Mathew, Belan,
& Thoppil, 1992) in order to regulate milk flow. On the other hand, medically fragile infants, such as those
born preterm, have a limited ability to self-regulate flow (Mathew, 1991a). When milk flow is too high, the
infant must either swallow at a frequency adequate to clear the oropharynx from fluid to prevent aspiration
(at the expense of ventilation) (al-Sayed, et al., 1994); allow the milk to pool in the oropharynx (and risk
aspiration); divert the milk away by allowing it to drool out their mouth (Schrank, et al., 1998); or stop
feeding.
Clinicians caring for hospitalized infants are faced with decisions about nipple selection to support
medically fragile infants in learning to orally feed, however there is only one recently published study of
flow rates from currently available nipples to support these decisions (Jackman, 2013). Jackman (2013)
conducted a study of flow rates from 23 types of nipples, six of which she identified as used in neonatal
intensive care units. Jackman (2013) found wide variability in the flow rates of nipples tested, ranging
from 6 to 60 mL/min. Nipples marketed as “slow-flow” were not consistent in the flow rates delivered, with

17
some having three times the flow as others (Jackman, 2013). Finally, significant variation was reported
between nipples of the same type (Jackman, 2013). Given the variability between nipples of the same
type, Jackman’s study was limited in that only one nipple per type was tested for nipples intended for
multiple use and three nipples per type were tested for single-use nipples. To account for the variability
between nipples and determine an accurate mean flow rate of each nipple type, more tests were needed.
No statistical analysis was presented in the report of this study.
More information is needed to support clinicians in decision-making regarding nipple selection for
feeding hospitalized infants. Without this information, infants are often exposed to multiple types of
nipples in an effort to find a good match. The variability in nipples during early oral feeding may contribute
to the length of time required to successfully feed and ultimately, to length of stay. This comparative,
descriptive study tested the milk flow rates and variability of nipples used for bottle-feeding hospitalized
infants.
Methods
Clinicians from the United States, Netherlands, and Australia were informally surveyed regarding
nipples available to them for feeding infants in the hospital. Twenty-nine nipples were identified and
tested (Table 2.1). A power analysis revealed that ten of each type of nipple was sufficient to compare
flow rates between the nipple types with 80% power at an alpha of 0.05.
All of the nipples except the Dr. Brown’s Level 1 Wide-Neck fit on a 60 mL Grad-U-Feed Nurser
(Mead Johnson & Co, Glenview, IL) and were tested with this bottle. Bottles were filled with Similac
Advance Stage 1 (20 calories/ounce) ready-to-feed formula (Abbott Laboratories, Abbott Park, IL). To
ensure equal levels of hydrostatic pressure, the height from the level of the liquid surface to the tip of the
nipple was maintained at 2.5 cm (Figure 2.1), requiring 50 mL of formula for nipples tested with the Grad-
U-Feed Nurser and 70 mL for the Dr. Brown’s Wide-Neck bottle. The formula was changed every ten
tests to prevent increased viscosity as a result of denaturation of proteins from prolonged exposure to air.
The bottle and nipple unit being tested were attached to a breast shield of a breast pump using a
layer of plastic paraffin film followed by a silicone-based polymer to create a seal. The bottle and nipple
unit were held at a 30 degree angle (Figure 2.2). A negative pressure system was created using a Pump
in Style Advanced breast pump (Medela, Inc., McHenry, IL). The stimulation phase suction pattern with a

18
suction pressure of 180 mmHg was used for all tests. Given the opportunities for loss of suction from the
pump to the nipple, negative pressure within the bottle was tested every 50 tests using the Samba 201
Micro Pressure Measurement System (BIOPAC Systems, Inc., Goleta, CA). Mean suction rate was 110
cycles per minute and mean negative pressure within the bottle was 14 mmHg.
Formula was expressed for one minute into a 500 mL beaker situated on a calibrated platform
scale (Thermo Fisher Scientific, Inc, Waltham, MA), accurate to 0.01 grams. At the conclusion of one
minute, the weight of formula expressed was recorded. Outliers were re-tested to ensure accuracy of the
measurement. Tests were video-recorded and measurements were confirmed by video review. Milk flow
rates (mL/min) were calculated using the density of Similac Advance formula of 0.97 mL/gram (AVCalc,
2014).
The Bionix Controlled Flow Baby Feeder consists of two parts that may contribute to variability in
milk flow: the nipple with the silicone inner channel and the flow restrictor (FR) system, consisting of the
yellow flow restrictor, purple seal, and green flow adjuster (Bionix Medical Technologies, 2014). Since the
nipple and FR system may contribute to flow in different ways, ten nipples were tested using the same FR
system and separately ten FR systems were tested using the same nipple. For both the nipple and FR
tests, the Bionix was tested on each of the five flow levels, resulting in a total of 100 tests. Also of note,
the Dr. Brown’s nipples were tested with the venting system in place, which is how the nipple is intended
to be used. The venting system comprises the cream colored vent insert and the blue vent resevoir
(Handi-Craft Company, 2014a). The Medela SpecialNeeds Feeder was tested without the white circular
valve membrane or the yellow circular disc (Medela Inc., 2014). The method used in this study for
applying negative pressure to the nipple could not work with the valve membrane in place. The
SpecialNeeds Feeder is intended to have three flow levels: zero flow, medium flow, and maximum flow,
depending on the position of the slit opening in the infant’s mouth when positive pressure (i.e.,
compression) is applied by the infant’s mouth (Medela, Inc., 2014). In this study, no positive pressure was
applied. In the presence of negative pressure only, the slit opening should, theoretically, respond similarly
regardless of positioning, but nipples were tested in the same position for consistency.
The methods used in this study were designed to test nipples under standardized conditions. The
flow rates established by this method are not necessarily the flow rates that an infant will achieve when

19
feeding. Infants feed with varying sucking rates and pressures and will achieve different flow rates within
and between feedings. Thus, this data should be interpreted only as a means to compare flow rates
between nipples.
Statistical Analysis
Mean milk flow rate (mL/min) and SD were calculated for each nipple type. Variability within
nipple types was assessed using the coefficient of variation (CV; SD/mean). To compare variability
between nipple types, CV was categorized into three levels: low (< 0.1), moderate (0.1 – 0.2), and high
(> 0.2).
The Shapiro-Wilk statistic was used to assess nipples for normality with an alpha of 0.05
considered significant. Comparisons between nipple types were made within brand and within category
(Slow, Standard, and Premature) using one-way ANOVA when normally distributed; non-parametric one-
way ANOVA was used otherwise. Multiple comparison tests for the post-hoc analysis of one-way ANOVA
utilized Duncan’s multiple range test, with an alpha of 0.05 being significant. When non-parametric one-
way ANOVA was utilized, pairwise comparisons were made using the Wilcoxon Rank Sum Test and the
alpha was adjusted using a Bonferroni adjustment.
For the purpose of comparing nipples within the categories of “Slow,” “Standard,” and
“Premature,” nipples were categorized by name, with a few exceptions. The Bionix Level 1 is intended to
“introduce taste” and the Level 2 is intended to deliver a slow flow (Bionix Medical Technologies, 2014);
these two levels were categorized as “Slow.” The Bionix Level 5 is intended to deliver flow “at or near a
flow rate of a Stage 1 nipple” (Bionix Medical Technologies, 2014) so this was categorized as “Standard.”
For comparisons within category, the Bionix nipple and flow restrictor tests were combined for each level.
Dr. Brown’s Preemie and Ultra-Preemie were included in the categories of both “Slow” and “Premature.”
Dr. Brown’s Level 1 Wide- and Standard-Neck were categorized as “Standard.” The Medela
SpecialNeeds Feeder was categorized as “Slow.”
Results
Flow rates varied widely between nipples, ranging from 2.10 for the Enfamil Cross-cut to 85.34
mL/min for the Dr. Brown’s Y-cut (Figure 2.3). Variability of flow rates among nipples of the same type

20
ranged from a CV of 0.05 for Dr. Brown’s Level 1 Standard- and Wide-Neck to 0.42 for the Enfamil Cross-
cut (Figure 2.4). Mean CV by brand ranged from 0.08 for Dr. Brown’s to 0.36 for Bionix (Figure 2.5).
Comparisons Within Brand
Bionix Controlled Flow Baby Feeder. This system was tested to evaluate the flow and
variability of the nipples (indicated by an “N” after the level in the text) and the flow restrictor (FR) systems
(indicated by a “FR” after the level in text and figures) separately. For both the nipple and FR tests, milk
flow increased overall in the direction intended (level 1 being the slowest and level 5 being the fastest).
Within the nipple tests, each level provided a significantly different flow rate (p<0.001), with the exception
of levels 2N and 3N, which were not significantly different. Within the FR tests, 2FR and 3FR were not
significantly different and 4FR and 5FR were not significantly different.
Comparing the FR tests to the nipple tests, level 1N and 1FR were comparable and levels 2N and
2FR were comparable. For all levels above 2, the nipple tests were significantly (p<0.001) slower than the
FR tests. For all levels above 1, there was overlap between levels. Levels 2N, 2FR, and 3N were all
similar to one another. Level 3FR was comparable to Levels 4N and 5N. At each level, the CV was higher
for the FR tests than the nipple tests. Bionix Levels 3N and 5N were the only levels with CV < 0.1.
Dr. Brown’s. All levels of Dr. Brown’s nipples were found to be significantly different (p<0.005),
with the exception of the Preemie and Level 1 Wide-Neck, which were found to be comparable. Dr.
Brown’s Ultra-Preemie performed as intended with the lowest flow (3.39 mL/min) of all the nipples by this
brand; this nipple was the second lowest flow of the 29 nipple types tested in this study. Dr. Brown’s Y-cut
had the highest flow of all the nipples tested (85.34 mL/min) and was moderately variable with a CV of
0.13. All of the other Dr. Brown’s nipples had a CV < 0.1.
Enfamil. All levels of Enfamil nipples were found to be significantly different (p<0.05), with the
Cross-Cut being the slowest and the Preemie nipple being the fastest. Enfamil Standard was the only
nipple with a CV < 0.1.
Similac. Slow and Standard nipples did not have significantly different flow rates. Similac Slow
ranged from 6.16 to 9.38 mL/min (CV 0.1 – 0.2) while Similac Standard ranged from 3.8 to 12.0 mL/min
(CV > 0.2). Similac Orthodontic was significantly faster (p<0.05) than Slow or Standard and was highly
variable (CV > 0.2). Similac Premature was the fastest of all Similac products (p<0.05).

21
Pigeon. All levels of Pigeon nipples were significantly different (p<0.05). The No-Drip was the
slowest, but also the most variable (CV > 0.2).
Comparisons Within Category
Slow Flow Nipples. Nine of the 29 nipples tested were categorized as “Slow” and flow ranged
from 3.39 to 14.68 mL/min (Figure 2.6). Dr. Brown’s Ultra-Preemie, Bionix Level 1, and Medela
SpecialNeeds Feeder were comparable to one another; these were all significantly slower (p<0.001) than
the other “Slow” nipples. Bionix Level 2, Dr. Brown’s Preemie, NUK Slow, and Similac Slow all delivered
comparable flow. Enfamil Slow was significantly faster (p<0.001) than all other “Slow” nipples. Pigeon
Slow was significantly slower than Enfamil Slow (p<0.001) but significantly faster (p<0.05) than all other
“Slow” nipples.
Standard Flow Nipples. Seven nipples were categorized as “Standard” and flow ranged from
6.61 to 25.07 mL/min (Figure 2.7). Similac Standard, Difrax, and Dr. Brown’s Level 1 Wide-Neck and
Standard-Neck nipples were comparable to one another; these were all significantly slower than the other
“Standard” nipples (p<0.05).
Premature Nipples. Four nipples were categorized as “Premature” and flow rates ranged from
3.39 to 22.68 mL/min (Figure 2.8). All four “Premature” nipples delivered significantly different flow rates
(p<0.05).
Discussion
Choosing a nipple for feeding a medically fragile infant is an important decision given the wide
range of flow rates found in this study. The name of a nipple (e.g., “Slow”) is not always an accurate
indicator of the flow rate. Additionally, variability in flow rate between and within nipple types is an added
challenge that may contribute to feeding difficulty.
Within the Bionix brand, for all levels above Level 1, there was overlap in flow rates between
levels, suggesting that the Bionix Controlled Flow Baby Feeder may not perform as expected when the
user increases the flow adjuster from one level to the next. The FR systems were particularly variable,
with 4 of the levels having CV > 0.2. Changing the nipple or the FR may inadvertently change the flow
rate delivered, even if the user sets the flow adjuster to the same position.

22
Bionix does provide a Flow Rate Comparison chart on their website (Bionix Medical
Technologies, 2014). According to Bionix, a similar, but not completely transparent, method was used to
test flow rates for 50 seconds using a Medela Classic Breast Pump (S. Herzig, e-mail communication,
March 2014). Our results were consistent with theirs for the increase in flow between levels 1 and 2; they
found a 75% increase while we found 77%. Both our tests and theirs found the greatest increase in flow
to be between levels 3 and 4. Bionix also tested nipples made by other companies, but it is difficult to
make comparisons because the names of the nipples have changed and because the methods may have
been different. In the current study, Bionix Level 1 was among the slowest of the nipples tested and may
be useful for feeding infants who require a very slow flow.
Dr. Brown’s markets the Ultra-Preemie nipple as being 35% slower than their Preemie nipple
(Handi-Craft Company, 2014b). In our tests, the Ultra-Preemie was 54% slower than the Preemie nipple.
Dr. Brown’s brand was the most consistent brand, with the lowest mean CV of all brands (Figure 2.5).
The Enfamil Cross-cut was the slowest of all nipples tested. The cross-cut has two slits that form
a cross at the tip of the nipple. Enfamil advertises this nipple as having a faster flow than their standard
nipple (Amazon.com, 2014), which is not consistent with our findings. Cross-cut nipples are described as
varying in flow, with increasingly faster flow as the infant applies suction and opens the cross wider (Start
& St James-Roberts, 2000). Two clinical studies have evaluated the physiologic effects of feeding with
either a cross-cut or a single-hole nipple and found that, at sucking pressures established by preterm
infants, the cross-cut yielded slower flow than the single hole (Chang, Lin, Lin, & Lin, 2007; Kao, Lin, &
Chang, 2010). These studies did not use Enfamil nipples, but may support further investigation of our
findings and how the cross-cut performs in practice.
For both the Enfamil and Similac brands, the Premature nipple was faster than the Slow or
Standard flow nipples. This is important for clinical practice as many clinicians assume that a nipple
labeled “Premature” indicates a slower flow rate. Premature infants typically generate lower sucking
pressures than full-term infants (Medoff-Cooper, McGrath, & Shults, 2002) and may become fatigued
early in the feeding before adequate volume is ingested. There was a previously held popular belief that
increasing the flow rate for these infants would make it easier for them to transfer milk given low sucking
pressures (Mathew, 1990) and that faster feedings would allow them to intake volume before becoming

23
fatigued. Certain premature nipples may have been designed based on these assumptions. More current
evidence supports slower flow for maintaining physiologic stability during feeding for these infants,
allowing them to breathe more (al-Sayed, et al., 1994; Mathew, 1991a; Park, Thoyre, Knafl, Hodges, &
Nix, 2014), maintain better oxygenation, and endure oral feeding longer.
Another clinically significant finding was that the Similac Slow and Standard nipples do not deliver
significantly different flow rates. Compared to the Enfamil products, both the Similac Slow and Standard
were slower than the Enfamil Slow. Anecdotally, we have heard from clinicians that the Enfamil Slow
delivers a slower flow than the Similac Slow nipple. There may be other qualities of nipples, such as the
mechanical stiffness of the nipple material, that affect flow from the nipple or the infant’s sucking during
feeding that could not be detected using our methods (Barlow, 2009). Our findings, however, are
consistent with Jackman’s (2013) findings for these nipples.
This study had some limitations. The method used in this study applied only negative pressure to
nipples. Nipples with a slit opening as opposed to a hole opening likely perform differently when positive
pressure is applied during feeding, changing the shape of the opening. The two nipples in this study with
slit openings were the Enfamil Cross-Cut and the Medela SpecialNeeds Feeder; caution should be used
when interpreting these results as the flow rates may be different in practice. Additionally, it should be
noted that the Dr. Brown’s Y-cut nipple was tested with standard thickness formula. In clinical practice,
this nipple is typically used with thickened milk in medically fragile infants.
Conclusions
Milk flow is an important variable in the complex task of oral feeding for the medically fragile
infant. This study confirmed results of previous studies (Jackman, 2013; Mathew, 1988), which found a
wide range in milk flow rates from different nipple types. This study has built on previous work by testing
additional nipples that are currently available for feeding hospitalized infants, further exploring variability
within nipple types, and by improving upon the testing and analysis methods.
Clinicians may use this data to guide nipple selection for medically fragile infants by comparing
the flow rates and variability of the nipples that are available within their institution. Evidence-based
decisions regarding nipple selection may support optimal oral feeding for these fragile infants and
facilitate earlier discharge home. Given the importance of milk flow in fragile infants, manufacturers of

24
nipples should consider providing information on nipple packaging that reflects flow rate and variability of
each nipple type; this would help to reduce any confusion related to the naming of nipples (i.e, premature,
slow, standard), which may not accurately reflect flow rate. Manufacturers could also use the information
from this study to improve upon nipple construction to reduce variability, particularly in nipples intended
for fragile infants.
Researchers should use this data to make decisions about nipples used in tests of feeding
interventions and select nipples with low variability in order to ensure consistency of flow. The specific
nipple(s) used, flow rate, and variability of nipples should be documented in reports of feeding
intervention studies.
Testing of flow rates of the nipples in this study will need to be repeated periodically to reflect
currently available nipples. Additionally, testing of milk flow rates of nipples used for feeding infants after
discharge is currently underway and will provide clinicians with information to guide parents in selecting
nipples for use at home that are comparable in flow to that with which the infant has been successful in
the hospital. Future research should consider testing the effect of flow rate and variability in bottle nipples
on the sucking parameters (e.g., sucking pressure and rate) of fragile infants. Evaluation of the feeding
patterns of fragile infants while being fed with various bottle nipples may provide information to tailor
nipple selection to sucking pattern to further support these fragile infants as they learn to eat.

25
Table 2.1.
Nipples Tested
Brand Name Company & Location Nipples Tested
Bionix Bionix Medical Technologies Toledo, OH
Controlled Flow Baby Feeder Levels 1-5; nipples and flow restrictor (FR) systems tested separately
Difrax Difrax BV Bilthoven, Netherlands
Teat Natural Standard-Neck Small (0+ months)
Dr. Brown’s Handi-Craft Co. St. Louis, MO
Level 1 Standard-Neck Level 1 Wide-Neck Ultra Preemie Preemie Y-cut
Enfamil Mead Johnson & Co. Glenview, IL
Standard-Flow (royal blue collar) Slow-Flow (turquoise collar) Preemie (light blue collar) Cross-Cut (yellow collar)
Medela Medela Inc. McHenry, IL
SpecialNeeds Feeder (formerly Haberman Feeder)
NUK NUK USA LLC Hackensack, NJ
Orthodontic Silicone Slow-Flow Standard-Neck
Pigeon Pigeon Tokyo, Japan
Standard-Flow Slow-Flow No-Drip
Similac Abbott Nutrition Lake Forest, IL
Standard-Flow (yellow nipple, clear collar) Slow-Flow (yellow nipple, yellow collar) Orthodontic (yellow nipple, clear collar) Premature (red nipple, clear collar)

26
Figure 2.1. Hydrostatic pressure measured as the height from the level of the nipple opening to the height of the level of fluid.
Figure 2.2. Nipple testing equipment.

Figure 2.3. Milk flow rates of all nipples tested (mL/min). FR ‒ flow restrictor.
29

Figure 2.4. Coefficient of variation (CV) of milk flow of all nipples. Nipples are color coded by category of CV. Diagonal pattern indicates CV < 0.1, gray indicates CV 0. 1 – 0.2, and black indicates CV > 0.2. CV = mean/SD. FR ‒ flow restrictor.
0.38
0.10
0.22
0.12
0.19
0.09
0.25
0.10
0.28
0.07
0.33
0.09
0.09
0.05
0.05
0.13
0.42
0.16
0.16
0.07
0.15
0.11
0.39
0.14
0.14
0.35
0.14
0.14
0.39
0.00 0.05 0.10 0.15 0.20 0.25 0.30 0.35 0.40 0.45
Bionix Level 1 FR
Bionix Level 1 Nipple
Bionix Level 2 FR
Bionix Level 2 Nipple
Bionix Level 3 FR
Bionix Level 3 Nipple
Bionix Level 4 FR
Bionix Level 4 Nipple
Bionix Level 5 FR
Bionix Level 5 Nipple
Difrax
Dr. Brown's UltraPreemie
Dr. Brown's Preemie
Dr. Brown's Level 1 Standard-Neck
Dr. Brown's Level 1 Wide-Neck
Dr. Brown's Y-cut
Enfamil Cross-cut
Enfamil Preemie
Enfamil Slow
Enfamil Standard
Medela SpecialNeeds Feeder
NUK Slow
Pigeon No-Drip
Pigeon Slow
Pigeon Standard
Similac Orthodontic
Similac Premature
Similac Slow
Similac Standard
Coefficient of Variation of Milk Flow of All Nipples
30

Figure 2.5. Mean coefficient of variation (CV) of milk flow rates by nipple brand. Calculated as the mean of the CV of each nipple type by each brand. Brands are color coded by category of CV. Diagonal pattern indicates mean CV < 0.1, gray indicates CV 0.1 – 0.2, and black indicates CV > 0.2.
31
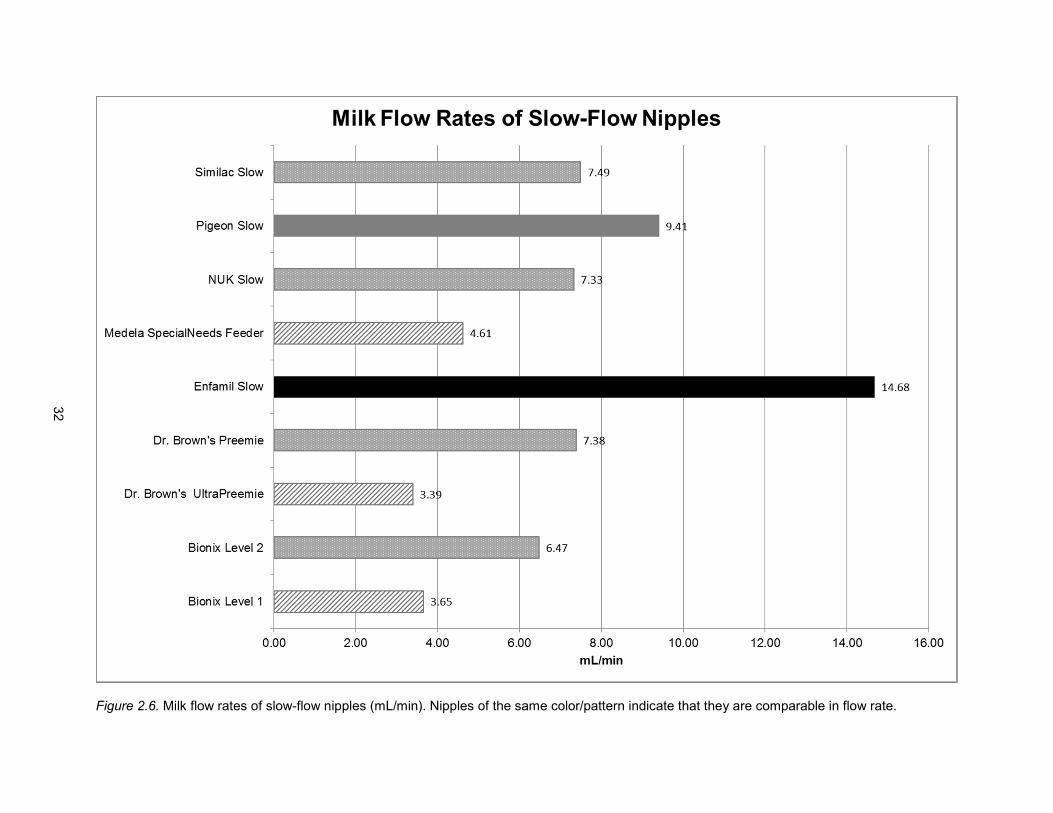
Figure 2.6. Milk flow rates of slow-flow nipples (mL/min). Nipples of the same color/pattern indicate that they are comparable in flow rate.
32

Figure 2.7. Milk flow rates of standard-flow nipples (mL/min). Nipples of the same color/pattern indicate that they are comparable in flow rate.
33

Figure 2.8. Milk flow rates of premature nipples (mL/min). Nipples of the same color/pattern indicate that they are comparable in flow rate.
34

33
REFERENCES
al-Sayed, L. E., Schrank, W. I., & Thach, B. T. (1994). Ventilatory sparing strategies and swallowing pattern during bottle feeding in human infants. Journal of Applied Physiology, 77(1), 78-83. Retrieved from http://jap.physiology.org/
Amazon.com. (2014). Enfamil Cross-cut nipple. Retrieved March 31, 2014, from
http://www.amazon.com/Enfamil-Cross-Cut-Nipple-12-Count/dp/B004TON9FQ/ref=sr_1_1?s=hpc&ie=UTF8&qid=1396278510&sr=1-1&keywords=enfamil+crosscut
AVCalc. (2014). Food weight to volume conversions. Retrieved May 18, 2014, from http://www.aqua-
calc.com/calculate/food-weight-to-volume Barlow, S. M. (2009). Central pattern generation involved in oral and respiratory control for feeding in the
term infant. Current Opinions in Otolaryngology & Head and Neck Surgery, 17(3), 187-193. doi: 10.1097/MOO.0b013e32832b312a
Bionix Medical Technologies. (2014). Controlled Flow Baby Feeder. Retrieved July 8, 2014, from
http://www.bionixmed.com/MED_Pages/ControlledFlow.html Chang, Y. J., Lin, C. P., Lin, Y. J., & Lin, C. H. (2007). Effects of single-hole and cross-cut nipple units on
feeding efficiency and physiological parameters in premature infants. Journal of Nursing Research, 15(3), 215-223. doi: 10.1097/01.JNR.0000387617.72435.c6
Colley, J. R., & Creamer, B. (1958). Sucking and swallowing in infants. British Medical Journal, 2(5093),
422-423. Retrieved from www.bmj.com Handi-Craft Company. (2014a). How They Work: Bottles. Retrieved July 8, 2014, from
http://www.drbrownsbaby.com/bottles-accessories/how-they-work Handi-Craft Company. (2014b). Ultra-Preemie Nipple. Retrieved June 9, 2014, from
http://www.drbrownsbaby.com/medical/products/ultra-preemie-nipples Jackman, K. T. (2013). Go with the flow: Choosing a feeding system for infants in the neonatal intensive
care unit and beyond based on flow performance. Newborn & Infant Nursing Reviews, 13, 31-34. doi: 10.1053/j.nainr.2012.12.003
Kao, H. M., Lin, C. H., & Chang, Y. J. (2010). Feeding with cross-cut teats has better sucking effects and
oxygenation in preterm infants with chronic lung disease. Journal of Clinical Nursing, 19(21-22), 3016-3022. doi: 10.1111/j.1365-2702.2010.03290.x
Mathew, O. P. (1988). Nipple units for newborn infants: A functional comparison. Pediatrics, 81(5), 688-
691. Retrieved from http://pediatrics.aappublications.org/ Mathew, O. P. (1990). Determinants of milk flow through nipple units. Role of hole size and nipple
thickness. American Journal of Diseases of Children, 144(2), 222-224. Retrieved from www.archpediatrics.com
Mathew, O. P. (1991a). Breathing patterns of preterm infants during bottle feeding: Role of milk flow.
Journal of Pediatrics, 119(6), 960-965. doi: 10.1016/S0022-3476(05)83056-2 Mathew, O. P. (1991b). Science of bottle feeding. Journal of Pediatrics, 119(4), 511-519. doi:
10.1016/S0022-3476(05)82397-2

34
Mathew, O. P., Belan, M., & Thoppil, C. K. (1992). Sucking patterns of neonates during bottle feeding: Comparison of different nipple units. American Journal of Perinatology, 9(4), 265-269. doi: 10.1055/s-2007-994786
Medela Inc. (2014). SpecialNeeds Feeder. Retrieved July 8, 2014, from
http://www.medelabreastfeedingus.com/products/576/specialneeds-feeder#!Overview Medoff-Cooper, B., McGrath, J. M., & Shults, J. (2002). Feeding patterns of full-term and preterm infants
at forty weeks postconceptional age. Journal of Developmental & Behavioral Pediatrics, 23(4), 231-236. Retrieved from: http://journals.lww.com/jrnldbp/pages/default.aspx
Park, J., Thoyre, S., Knafl, G. J., Hodges, E. A., & Nix, W. B. (2014). Efficacy of semielevated side-lying
positioning during bottle-feeding of very preterm infants: A pilot study. Journal of Perinatal & Neonatal Nursing, 28(1), 69-79. doi: 10.1097/JPN.0000000000000004
Schrank, W., Al-Sayed, L. E., Beahm, P. H., & Thach, B. T. (1998). Feeding responses to free-flow
formula in term and preterm infants. Journal of Pediatrics, 132(3 Pt 1), 426-430. doi: 10.1016/S0022-3476(98)70014-9
Start, K., & St James-Roberts, I. (2000). A randomised controlled trial of the effects of a cross-cut feeding
teat on infant feeding, crying, waking and sleeping behaviour. Professional Care of Mother and Child, 10(2), 45, 47.

35
CHAPTER 3: EFFECTS OF MILK FLOW ON THE PHYSIOLOGIC AND BEHAVIORAL RESPONSES TO FEEDING IN AN INFANT WITH HYPOPLASTIC LEFT HEART SYNDROME
Overview
Infants with hypoplastic left heart syndrome often experience difficulty with oral feeding, which
contributes to growth failure, morbidity, and mortality. In response to feeding difficulty, clinicians often
change the bottle nipple (i.e., milk flow rate). Slow-flow nipples have been found to reduce the stress of
feeding in other fragile infants, but no research has evaluated the responses of infants with hypoplastic
left heart syndrome to alterations in milk flow. The purpose of this study was to evaluate the physiologic
and behavioral responses of an infant with hypoplastic left heart syndrome to bottle-feeding with either a
slow-flow (Dr. Brown’s Preemie) or standard-flow (Dr. Brown’s Level 2) nipple. A single infant was studied
for three feedings: two slow-flow and one standard-flow. Oral feeding, whether with a slow-flow or
standard-flow nipple, was distressing for this infant. During slow-flow feeding, she experienced more
coughing events while during standard-flow, she experienced more gagging. Disengagement and
compelling disorganization was most common during feeding 3 (Slow-flow), which occurred two days
after surgical placement of a gastrostomy tube. Clinically significant changes in heart rate, oxygen
saturation, and respiratory rate were seen in all feedings. Heart rate was higher during standard-flow and
respiratory rate was higher during slow-flow. Further research is needed to examine the responses of
infants with hypoplastic left heart syndrome to oral feeding and to identify strategies that will support
these fragile infants as they learn to feed. Future research should evaluate an even slower flow nipple
along with additional supportive feeding strategies.
Keywords: hypoplastic left heart syndrome, bottle feeding, feeding methods

36
Introduction
Each year, approximately 1,000 infants in the United States are born with hypoplastic left heart
syndrome (HLHS) (Hoffman & Kaplan, 2002; Reller, Strickland, Riehle-Colarusso, Mahle, & Correa,
2008). HLHS is one of the most severe cardiac defects amenable to surgical palliation, and accounts for
up to 25% of neonatal deaths associated with cardiac disease (Grossfeld, 2007). Infants with HLHS often
experience profound feeding difficulties, which contribute significantly to growth failure, morbidity, and
mortality (Davis, et al., 2008; Einarson & Arthur, 2003; Jadcherla, Vijayapal, & Leuthner, 2009; Skinner, et
al., 2005). The phenomenon of feeding difficulties in this population is not well understood, however, and
no research has examined the physiologic and behavioral responses of these infants to different feeding
methods.
Feeding is a physiologically expensive event requiring coordination of sucking and swallowing
with respiration to achieve nutritional intake while maintaining adequate oxygenation. When infants
experience difficulty with bottle-feeding, one of the most commonly used strategies involves changing the
type of bottle nipple (i.e., rate of milk flow). Altering the rate of milk flow has been shown to affect
physiologic state during feeding in healthy, term infants (al-Sayed, Schrank, & Thach, 1994) and infants
born prematurely (Kao, Lin, & Chang, 2010; Mathew, 1991a), but it remains unknown how infants with
HLHS respond to different flow rates.
In healthy infants, increased milk flow results in increased rate of consumption at the expense of
decreasing ventilation (al-Sayed, et al., 1994). During swallowing, the airway must close to prevent
aspiration of fluid into the lungs. As flow rate increases and swallowing necessarily increases, the
duration of airway closure also increases (al-Sayed, et al., 1994). The healthy infant with normal
cardiorespiratory functioning is able to quickly recover from this decrease in ventilation during swallowing
by increasing respiratory rate and tidal volume to maintain adequate oxygenation (Mathew, 1991b). The
healthy, full-term infant is also capable of self-regulating the rate of milk flow during bottle-feeding by
altering sucking rate (Schrank, Al-Sayed, Beahm, & Thach, 1998) and pressure (Colley & Creamer, 1958;
Mathew, Belan, & Thoppil, 1992), allowing them to regulate the effect of milk flow on ventilation.
Premature infants, who have compromised respiratory function and immature neurologic and
respiratory systems, have been found to have limited ability to self-regulate milk flow during bottle-feeding

37
and limited capacity to recover from the reduction in ventilation (Mathew, 1991a). Slowing the rate of milk
flow during bottle-feeding has been found to reduce ventilatory compromise in preterm infants (Kao, et al.,
2010; Mathew, 1991a). It is theorized that reducing the rate of milk flow delays swallowing until a critical
volume of milk accumulates, therefore reducing the number of swallows and the time the airway is closed
to ventilation (al-Sayed, et al., 1994; Lau & Schanler, 2000).
Infants with HLHS after stage 1 palliation are extremely fragile. They have decreased
oxygenation at rest as a result of mixing of oxygenated and deoxygenated blood in a common atrium.
They also frequently experience decreased cardiac output due to a single functioning ventricle and
tachypnea as a result of increased pulmonary blood flow through the artificial systemic-pulmonary artery
shunt (Pearl, Nelson, Schwartz, & Manning, 2002; Tweddell, et al., 2000). A further decline in
oxygenation as a result of disruption of ventilation during swallowing, however minor, may cause
considerable physiologic distress and given their poor cardiac output and tachypnea, their ability to
recover is likely limited.
Slowing the rate of milk flow may enable the infant with HLHS to better maintain baseline
ventilation requirements. Additionally, infants with HLHS are at risk for aspiration as a result of vocal cord
injury (Sachdeva, et al., 2007) and swallowing dysfunction (Skinner, et al., 2005). Slowing the transit time
of the bolus to the pharynx may allow the infant more time to coordinate a safe swallow and better protect
the airway (Goldfield, Smith, Buonomo, Perez, & Larson, 2013). The effects of variations in milk flow on
infants with HLHS remain unknown, and because their cardiac physiology is unique, these effects cannot
be assumed based on other medically compromised infants. The purpose of this study was to examine
the physiologic state changes (HR, oxygen saturation (Sp02), and respiratory rate (RR)) and behavioral
indicators of distress (coughing, gagging, behavioral disorganization and disengagement) that occur
during feeding and in the recovery period after feeding when an infant with HLHS is fed with either a slow-
flow or standard-flow nipple.
Theoretical Framework
Polyvagal Theory (Porges, 1995) was used to conceptualize the physiologic and behavioral
responses of an infant to stress during feeding. Polyvagal Theory explains that during times of low stress,
the nucleus ambiguous (NA) pathway of the vagus predominates and allows for social communication by

38
providing tone to the muscles of the face, head, and ears (Porges, 1995). Input from the NA also supports
feeding by coordinating sucking, swallowing, and breathing and preserves metabolic resources for
growth by maintaining a low heart rate (HR) (Porges, 2007). Simultaneously, at times of low stress,
limited input from the dorsal motor nucleus (DMNX) pathway of the vagus aids in digestion and
absorption of nutrients from the gastrointestinal (GI) tract (Porges, 2001).
Conversely, in response to stressful situations, there is a hierarchical activation of the two stress
response systems. Initially, the sympathetic nervous system (SNS) mobilizes resources to meet
physiologic demands, resulting in increased HR, decreased heart rate variability (HRV), release of stress
hormones, release of cytokines, and diversion of blood away from the GI tract to the more vital organs
such as the heart, brain, and lungs. If the SNS response is not able to meet the demands of the situation,
the DMNX is activated to conserve resources, resulting in disengagement, behavioral distress, hypotonia,
apnea, and bradycardia (Porges, 2003). This theoretical framework was used to identify outcome
variables as behavioral and physiologic indicators of stress related to feeding.
Methods
This was a single-case experimental design study where a single infant with HLHS was studied
under two flow conditions: slow-flow and standard-flow. The infant was studied for three feedings, which
allowed for replication of one of the conditions. Replication reduces threats to internal validity of study
findings due to maturation and history (Tervo, Estrem, Bryson-Brockmann, & Symons, 2003). There were
six permutations of the order in which the two conditions could occur over three feedings, with at least
one of each flow condition (Barlow & Hayes, 1979; Lander, 1998). The order in which feedings occurred
was randomized, which also aimed to support internal validity (Kratochwill & Levin, 2010). Institutional
Review Board approval was obtained prior to the study.
Sample and Setting
This study was conducted at a pediatric tertiary care center in the Northeastern United States.
The first available infant to meet inclusion criteria and whose parents consented to participation was
included in the study. To be included in the study, the infant had to have been born full-term (≥ 37 weeks
post-menstrual age (PMA)) with HLHS and to have survived stage 1 palliation. Infants were excluded if
they were not orally feeding or if they had another major congenital anomaly that interfered with their

39
ability to feed orally (e.g., cleft palate). Additionally, infants were excluded from the study if there was not
a parent able to consent who was over 18 years of age, because of concerns about their capacity for
understanding the informed consent process.
Flow Conditions
Variability in milk flow within and among bottle nipples has been documented (Mathew, 1988;
Pados, 2014). In order to maintain consistency between bottle-feedings of the same flow condition, Dr.
Brown’s (Handi-Craft Co., St. Louis, MO) nipples were used because they were found to have the most
consistency in flow rates between nipples of the same type (Pados, 2014). The Dr. Brown’s Preemie
nipple was used for the slow-flow condition because this was the slowest Dr. Brown’s nipple available at
the time. Dr. Brown’s Level 2 was chosen for the standard-flow condition because it was comparable in
flow rate to the Enfamil Slow-Flow (Pados, 2014), which was typically used for feeding infants with HLHS
in the unit where the study was conducted. It should be noted that the flow rate of the “standard-flow”
nipple used in this study was slower than many standard-flow nipples used for feeding infants in the
hospital (Pados, 2014). The infant’s nurse was responsible for preparing the milk for each of the study
feedings according to clinical orders and unit standards. The investigator chose the appropriate nipple
according to the randomized flow assignment, assembled the bottle, and handed it to the feeder, who
was blinded to the flow condition of the feeding.
Study Feeding Protocol
Feeders for the study feedings were informed of the Study Feeding Protocol (Appendix 3.1),
which guided them to swaddle the infant and hold in a supported, flexed position, facing the feeder, and
at a 45 degree angle. Feeders were asked to speak softly, minimize movement of the infant’s body during
feeding, and avoid manipulation of the nipple to encourage sucking. The infant was to be given a break if
he or she displayed signs of physiologic distress, including tachycardia (HR > 200 bpm), bradycardia (HR
< 80 bpm), a decrease in Sp02 more than 10% below baseline and to reinitiate only when the infant was
physiologically stable and displayed readiness cues. A maximum time limit for study feedings was set at
30 minutes.

40
Variables & Measures
Four types of variables were collected: 1) infant characteristics, 2) feeding description, 3)
behavioral outcomes, including feeder actions and infant behaviors, and 4) physiologic outcomes.
Specific variables within each category are described in Table 3.1. The protocol for data collection is in
Appendix 3.2.
Infant Characteristics. Descriptive data was collected on the infant to describe the pregnancy,
birth history, and medical course, including primary and secondary diagnoses, surgical history, respiratory
support requirements, echocardiogram results, lab work, and medications received. Data on the infant’s
feeding experience since birth was also collected, including type of feeding (bottle or breast), type and
caloric density of milk, amount consumed orally, amount of milk administered via feeding tube, type of
feeding tube, prescribed type and amount of milk, and any feeding complications.
Feeding Description. Data was collected during feeding to describe the three study feedings.
The total feeding duration was defined as the duration of time from the first time the nipple was placed in
the mouth until the last time the nipple was removed. Nipple-in duration was defined as the duration of
time during the feeding period that the nipple was in the infant’s mouth. Milk consumed (in milliliters (mL))
was defined as the amount of milk removed from the bottle by the infant as measured by the change in
mL using a graduated bottle. Milk flow (mL/minute(min)) was defined as the amount of milk the infant
consumed per minute of nipple-in (milk flow=milk consumed (mL)/nipple-in duration (mins)). In order for a
study feeding to be included in the analysis, the milk flow had to exceed 0.3 mL/min. The presence of a
nasogastric tube and the type of milk offered to the infant was recorded.
Behavioral Outcomes. A Panasonic Digital Video Camera HDC-TM700 was used for video
recording. Starting approximately 30 minutes prior to the study feeding and continuing throughout the
feeding period, a single camera was used to capture a close-up angle of the infant’s face and upper trunk.
An observational coding scheme (Appendix 3.3) was used to code the videos using the observational
coding program, The Observer XT 11 (Noldus Information Technology Inc., Asheville, NC). Coders were
trained in the observational coding scheme until they achieved ≥ 80% reliability using the kappa statistic.
Feeder Actions. Actions of the feeder were evaluated during feeding to confirm that the feedings
were performed in a similar way. Study feedings were video-taped and coded continuously for the

41
frequency (number of events) of stimulating the infant to suck, decreasing milk flow, and repositioning
during the nipple-in period. The duration (in seconds (secs)) of burping and pacifier use was coded for the
entire feeding period. At the end of the observation, the predominant positioning of the infants arms and
shoulders, containment of the limbs in the swaddle, trunk positioning, angle of trunk, alignment of head,
and anterior/posterior neck alignment was noted.
Infant Behavior. Of the 30 minute observation period prior to feeding, 6 minutes was selected to
represent baseline where the infant was quietly resting with minimal movement. The observational coding
scheme was used to code for activity level (continuous coding; no movement or movement) and
behavioral state (interval coding every 10 secs; categories defined in Table 3.2). The baseline period was
described in terms of percent of time with no movement and percent of time in each behavioral state.
Videos during feeding were coded continuously for infant distress behaviors, including coughing
(number of events and duration in secs) and gagging (number of events and duration in secs); infant
engagement (proportion of the feeding in each level of engagement); and behavioral organization
(proportion of the feeding in each level of organization). Definitions of the levels of engagement and
organization are provided in Table 3.2.
Physiologic Outcomes. Physiologic variables included HR, Sp02, and RR. Physiologic data was
analyzed during the 6 minute baseline period, throughout the feeding period, and for 30 minutes after
feeding. The recovery period was defined as starting at the time the infant was settled into her bed after
feeding and caregiving activities were completed and continuing for 30 minutes.
HR data were collected by a three lead electrocardiogram (ECG) using the BioNex Bio-Potential
Amplifier (MindWare Technology, Gahanna, OH) and sampled at 1,000 samples per second. The data
were digitized by an amplifier, converted to an analog waveform, and stored using BioLab Data
Acquisition Software (MindWare Technology, Gahanna, OH). ECG wave complexes were imported into
MindWare HRV 3.0.20 (MindWare Technology, Gahanna, OH) and R peaks were marked by the
program. The investigator confirmed each R peak of the QRS complex and cleaned the data of artifact.
The cleaned data were used to calculate indices of HR, including HR mean, minimum, maximum, and
coefficient of variation (CV; calculated as SD divided by the mean), for every 1 minute during the baseline
and feeding periods and every 2 minutes during recovery. A change from baseline score was calculated

42
for feeding as the mean HR during the entire feeding period minus the mean HR during the baseline
period. A change from baseline score was also calculated for the recovery period. Additionally, number of
bradycardic events, defined as a heart rate < 100 bpm (Dawson, et al., 2013) were calculated.
Bradycardic events had to be separated by at least 5 seconds of HR data above 100 bpm to be
considered two events.
Sp02 was collected using the Radical-7 Pulse Co-Oximeter (Masimo Corporation, Irvine, CA) at a
sampling rate of 1,000 samples per second and an averaging window set at two samples per second.
This co-oximeter is reported by the manufacturer to provide Sp02 data with an accuracy of ± 2% in the
event of low perfusion, which is critical for the population of infants with HLHS who frequently experience
poor perfusion (Masimo, 2012). As with the HR data, Sp02 data was digitized by the amplifier, converted
to analog waveform, and stored using BioLab Data Acquisition Software (MindWare Technology,
Gahanna, OH). The data was cleaned of artifact by the investigator and the mean, minimum, maximum,
SD, and CV of Sp02 were calculated for every 1 minute during baseline and feeding and every 2 minutes
during recovery. A change from baseline score was calculated for feeding as the mean Sp02 for the
entire feeding period minus the mean Sp02 during baseline. Change from baseline Sp02 was calculated
for the recovery period as well.
Mean Sp02 during all three baselines was calculated to create categories of fluctuations in Sp02
data that represent an increase in Sp02 5-10% above baseline, increase in Sp02 > 10% above baseline,
a decrease in Sp02 5-10% below baseline, and a decrease in Sp02 > 10% below baseline. The Sp02
data was imported to The Observer XT 11 observational coding program and coded using the categories
described. The frequency of events of Sp02 within each of these categories was calculated as well as the
percentage of the feeding that the infant’s Sp02 was in each category.
RR was collected using the Ambu® Sleepmate RIPmate™ Inductance Belts system (Ambu Inc.,
Glen Burnie, MD) sampled at 1,000 samples per second. This monitoring system uses respiratory
inductance plethysmography (RIP) to measure movement of the thoracic cavity related to respiratory
effort via an elastic band placed around the chest. Respiratory data was digitized by the amplifier and
stored as an analog waveform using BioLab Data Acquisition Software (MindWare Technology, Gahanna,
OH). AcqKnowledge software (BIOPAC Systems, Inc., Goleta, CA) was used to mark the peak, or point of

43
maximal chest circumference, during each breath. In order to consistently apply a rule to the waveform
data regarding whether a chest movement qualified as an adequate respiratory cycle, a period of stable,
regular breathing was identified during each baseline period. The mean voltage change for a breath
during this regular breathing period was calculated and a chest movement had to be associated with a
voltage change of at least 20% of this mean in order to be marked as a peak (Bamford, Taciak, &
Gewolb, 1992) (Appendix 3.4). The waveform data was used to calculate RR in breaths per minute. The
mean, minimum, and maximum RR were calculated for every 1 minute during the baseline period, during
each nipple-in period of the feeding, and every 2 minutes during recovery. Nipple-out periods during
feeding are typically when burping and other movement of the infant occurs and therefore, more artifact;
his data was not included in the analysis. Change from baseline RR was calculated during feeding as well
as during recovery. Additionally, frequency of apneic events, defined as greater than three seconds
between consecutive respiratory waveform peaks (Nixon, Charbonneau, Kermack, Brouillette, &
McFarland, 2008), was calculated.
Statistical Analysis
The analysis of this single-case experimental study occurred in two phases. In Phase 1, the
outcome variables were described per feeding using descriptive analyses with the goal of elucidating the
ways in which physiology and behavior changed in relation to flow condition. Graphic analysis of data is
an accepted method of descriptive analysis of single-subject experimental data (Kratochwill, Hitchcock,
Horner, Levin, Odom, Rindskopf, & Shadish, 2010; Tervo, et al., 2003). Meaned values for measures
during the baseline, feeding, and recovery periods were tabled. Repeated measures physiologic data
were graphed to illustrate change over time. A quadratic regression line was fit for each set of physiologic
data to evaluate the direction of change and steepness (i.e., slope) of change over time.
In Phase 2, the repeated measures physiologic data were analyzed using linear mixed modeling
(LMM) to evaluate the effect of flow condition on each physiologic outcome. For this analysis, data were
grouped by flow condition. Correlation between measurements within the same feeding, and within the
same flow condition were taken into account. Additionally, baseline values of the outcome variable being
tested were included as covariates in the model. The procedures for the LMM analyses are available in
Appendix 3.5.

44
Results
Infant Characteristics
Baby G was a full-term (39 3/7 weeks PMA) female born via vaginal delivery following labor
induction to a 30 year-old Caucasian primagravida. The pregnancy was complicated by a prenatal
diagnosis of HLHS found during the anatomical ultrasound between 18-19 weeks PMA. At 21 weeks, a
fetal surgical intervention was performed with balloon dilation of the aortic valve. The post-surgical course
was uncomplicated. At birth, Baby G was appropriately grown with a birth weight of 3240 grams (50th
percentile), head circumference of 36 cm (96th percentile), and length of 48.5 cm (36th percentile). She did
not require resuscitation at birth. Apgar scores were 8 at 1 min and 9 at 5 mins.
An echocardiogram after delivery confirmed HLHS with aortic stenosis. The infant was intubated
and taken to the catheterization laboratory where balloon dilation of the aortic valve was repeated and a
stent was placed across the atrial septum under fluoroscopy. Following the catheterization, the
echocardiogram reported a small left ventricle (LV) with endocardial fibroelastosis, aortic stenosis with a
gradient of 70 mm Hg, and no aortic insufficiency.
Despite the efforts to dilate the aortic valve and support growth of the LV, her cardiac function
remained poor and on day of life (DOL) 10, the infant underwent a stage 1 Sano Damus-Kaye-Stansel
procedure. Her procedure was altered from the typical Norwood procedure for HLHS in the hope to
continue to grow the LV for an eventual two ventricle heart. The procedure involved: 1) transection of the
main pulmonary artery (MPA), patch closure of the distal MPA, and placement of a right ventricle to
pulmonary artery (RV-PA) conduit for pulmonary circulation 2) division of the proximal MPA and
anastomosis to the ascending aorta (both the MPA and aortic arch were patch augmented), 3) aortic
valvulotomy and commiseration of aortic valve fusion, 4) patent ductus arteriosis ligation, and 5) removal
of atrial stent and resection of the atrial septum. An illustration of her post-surgical cardiac anatomy is
provided in Figure 3.1. Total cardiopulmonary bypass time was 3 hours and 11 mins. She did not
experience any major complications during the procedure. Sternal closure was delayed per standard care
at this institution due to typical swelling of the intrathoracic structures. She was extubated on DOL 24 to
continuous positive airway pressure. On DOL 25 she was transitioned to nasal cannula and then
transitioned to room air on DOL 27. Her most recent echocardiogram at the time of the study revealed a

45
mild to moderate hypoplastic LV with endocardial fibroelastosis, hypoplastic aortic valve annulus, mild
aortic regurgitation, patent aortic arch, mild tricuspid valve regurgitation, right ventricular dilation and
hypertrophy with good RV function, and mild to moderate LV dysfunction. Her course was also
complicated by postoperative chylothorax, hypothyroid, gastroesophageal reflux, and neonatal abstinence
syndrome following prolonged perioperative narcotic exposure.
Oral feeding was initiated on DOL 26 while on nasal cannula and for the first 10 days of oral
feeding, she took 0-15 mL by mouth per feeding. On DOL 38, the infant was evaluated by the feeding
team; they noted that the infant did not readily open her mouth for the feeding, showed no rooting
response, used a munching motion when the nipple was placed on the hard palate, had pooling in the
oral cavity, and gagged three times, but did not show overt signs or symptoms of aspiration. She
continued to be offered oral feedings. Study feeding 1 occurred on DOL 41 after the infant was
consistently taking ≥ 20 mL per feeding for two days. Feeding 2 occurred on DOL 42, and Feeding 3
occurred on DOL 46. Feeding experience data at the time of each study feeding is presented in table 3.3.
All of her oral feeding experience was with bottle-feeding and a variety of bottle nipples had been used.
The lapse of time between study feeding 2 and study feeding 3 was a result of the infant having a
gastrostomy tube surgically placed. During this time, the infant was reintubated for the procedure and was
not given any fluids enterally for 24 hours.
At the time of the study feedings, the infant was regularly receiving the following medications:
Captopril for afterload reduction, Lasix for diuresis, Levothyroxine for treatment of hypothyroid,
Omeprazole for treatment of gastroesophageal reflux, Aspirin for anticoagulation given the artificial RV-
PA conduit, Simethicone for treatment of gastrointestinal discomfort, and Acetaminophen as needed for
pain management. She had received her last dose of a methadone taper for treatment of neonatal
abstinence syndrome on DOL 39. In the evening of DOL 41, approximately 12 hours after study feeding 1
and 12 hours prior to study feeding 2, her Cardiac Children’s Hospital Early Warning Score (C-CHEWS)
(McLellan & Connor, 2013) was rated a 3 and she was given a rescue dose of methadone. Otherwise, in
the 24 hours prior to and following each study feeding, her C-CHEWS score was rated 0-1 by the infant’s
nurse.
Laboratory values for electrolytes, hematology, and thyroid function were within normal limits at

46
the time of the study, with the exception of elevated bicarbonate and decreased chloride levels. This mild
electrolyte imbalance is a physiologic response to normalize pH in the presence of abnormal
oxygen/carbon dioxide balance as a result of her cardiac anatomy (Adams, Swan, & Hall, 1970). Her
most recent venous blood gas was acceptable given her cardiac disease.
Feeding Description
The infant was randomized to the following order of flow conditions- Feeding 1: Slow-flow;
Feeding 2: Standard-flow; and Feeding 3: Slow-flow. The flow conditions are referred to as Slow and
Standard. Feeding description data is available in Table 3.4. The nipple-in duration of feeding 1 (Slow)
was nearly twice as long as feedings 2 (Standard) or 3 (Slow), however the infant consumed
approximately the same amount of milk for all three of the feedings. As a result, the milk flow rate for
feeding 1 (Slow) was slower than for feedings 2 (Standard) or 3 (Slow). A nasogastric (NG) tube was
present in her left nare for feeding 1(Slow), but during feeding 2 (Standard) it had been removed to trial
her ability to meet nutritional requirements by oral intake. At the time of feeding 3 (Slow), she had a
gastrostomy tube in place and therefore no longer required a NG tube. Skimmed breastmilk 30
calories/ounce was offered for all three study feedings. Breast milk was skimmed of long-chain fatty acids,
which can reaccumulate as chyle in the pleural space in the presence of chylothorax, and replaced with
medium-chain triglycerides (Chan & Lechtenberg, 2007).
Behavioral Outcomes
Feeder Actions. Feedings 1 (Slow) and 2 (Standard) were performed by the same speech-
language pathologist and member of the feeding team. Feeding 3 (Slow) was performed by the infant’s
mother, who had been present at the infant’s bedside throughout her hospitalization and had fed her
more often than anyone else. All three feedings were performed with the infant in a supine position at
approximately a 45 degree angle. The infant was swaddled with the shoulders and arms supported
throughout feedings 1 (Slow) and 2 (Standard). During feeding 3 (Slow), the infant was more loosely
swaddled and over the course of the feeding, the swaddle became less supportive. Throughout all three
feedings, her head was in a midline, neutral position appropriate for feeding. During feeding 3 (Slow), the
feeder spent more time burping the infant than during either feeding 1 (Slow) or 2 (Standard) and the
infant was given a pacifier for a longer period of time during feeding 3 (Slow) (Table 3.5). Otherwise, the

47
number of events of stimulating the infant to suck, decreasing milk flow, and repositioning were not
considerably different between the feedings.
Infant Behavior. During the 6 minute baseline period prior to feeding 1 (Slow), the infant was in
active sleep 100% of the time and had no movement 97.3% of the time. During the baseline period prior
to feeding 2 (Standard), the infant was in active sleep 100% of the time and had no movement 75.9% of
the time. In the baseline period prior to feeding 3 (Slow), the infant was in active sleep 50% of the time,
was alert 3%, and in a drowsy daze 47% of the time; she had no movement 71.5% of the time.
Baby G had seven coughing events during feeding 1 (Slow), with a total duration of coughing of
50.5 secs, compared to two coughing events during feeding 2 (Standard; duration 15.2 secs), and one
very brief event (1.13 secs) during feeding 3 (Slow) (Table 3.6). She gagged more during feeding 2
(Standard; four events; duration 12.7 secs) compared to one event of gagging (2.2 secs) during feeding 1
(Slow) and none during feeding 3.
In terms of her engagement in the feeding, she was most fully engaged during feeding 2
(Standard) (96%) (Table 3.6). During feeding 1 (Slow), she was fully engaged for 91.6% of the nipple-in
time. She was least fully engaged during feeding 3 (Slow; 44.8%). In all three feedings, she was either
fully engaged or disengaged; there was no low engagement in any of the feedings. During feeding 3
(Slow), she was disengaged and avoiding the feeding during 55.2% of the nipple-in time.
Behavioral organization during nipple-in periods followed a similar pattern as engagement. During
feeding 2 (Standard), she was fully organized for 29.3% of the feeding, while she was only fully organized
for 4.8% of feeding 1 (Slow). She was never fully organized during feeding 3 (Slow). She showed signs of
compelling disorganization during nearly half (47.9%) of feeding 3 (Slow), while only 5.5% of feeding 1
(Slow) and 1.9% of feeding 2 (Standard).
Physiologic Outcomes
HR. Mean HR increased from baseline to feeding during all three feedings and then decreased to
below baseline values during all recovery periods (Table 3.7). During feedings 2 (Standard) and 3 (Slow),
mean HR increased similarly from baseline to feeding (10.2 vs. 9.8 bpm, respectively). Mean HR
increased the least during feeding 1 (Slow; 4.9 bpm). In Figure 3.2, mean HR was plotted over time and a
quadratic regression line was fit to the data, which revealed a concave curve for all three feedings (i.e.,

48
mean HR increased from baseline to feeding and decreased during recovery). Consistent with the mean
HR values, Feeding 3 (Slow) had the steepest curve, indicating the greatest change from baseline to
feeding, and feeding 1 (Slow) had the flattest curve, indicating the least change per unit of time (Figure
3.2). The infant did not experience bradycardia during any of the analyzed periods, but did have transient
elevations in HR above 190 bpm during both feedings 1 (Slow; maximum HR 194.2 bpm) and 2
(Standard; maximum HR 191.1 bpm).The CV increased from baseline to feeding during all feedings as
well, indicating greater variation in HR during feeding. The CV of HR remained elevated above baseline
during the recovery periods of all three feedings and were similar in value (Table 3.7). In the Phase 2
analysis, LMM was used to evaluate the effect of flow condition on HR during feeding, covaried on
baseline HR. The mean HR during feeding was significantly higher during standard-flow feeding than
during slow-flow feeding (p=0.01) (Table 3.8).
Sp02. Mean Sp02 during feeding was highest during feeding 1 (Slow; 87.7%) compared to
feeding 2 (Standard; 83.5%) and feeding 3 (Slow; 84.4%) (Table 3.9). During feeding 1 (Slow), the Sp02
increased from baseline by 3.76%, while during feeding 2 (Standard), Sp02 decreased by 3.28%, and it
remained essentially unchanged during feeding 3 (Slow; 0.03%). Minimum Sp02 was the same (70.7%)
for both feedings 1 (Slow) and 2 (Standard), while Sp02 dropped to a minimum of 62.8% during feeding 3
(Slow). Maximum Sp02 was higher during feeding 1 (Slow; 98.6%) compared to feedings 2 (Standard)
and 3 (Slow) (91.6% for both). The CV of Sp02 was similar across all feedings, but in all cases, increased
from baseline to feeding and decreased during recovery. Mean Sp02 was plotted over time in Figure 3.3
and a quadratic regression line fit to the data revealed a concave curve for feeding 1 (Slow) (i.e., Sp02
increased from baseline to feeding and decreased during recovery) and a convex curve for feeding 2
(Standard) (i.e., Sp02 decreased from baseline to feeding and increased during recovery). The regression
line for feeding 3 (Slow) was also convex, but was nearly flat as it decreased from baseline to feeding and
then continued to decrease during recovery.
The grand mean for baseline Sp02 for all feedings was calculated to be 84.7% (range 83.8 –
86%) with 81 ‒ 88.9% being equivalent to +/- 5% of baseline. During feeding 1 (Slow), the infant had 3
events with the Sp02 rising greater than 10% above baseline (i.e., >93%), which accounted for 8% of the
feeding period (Table 3.9). There were desaturation events greater than 10% below baseline (<76%) in all

49
feedings, accounting for 2.3% of each feeding 1 (Slow) and 2 (Standard) and 4.7% of feeding 3 (Slow). In
Phase 2, the LMM analysis revealed a trend toward a significant effect of flow on Sp02 (p=0.1), with the
Sp02 being higher during slow-flow feedings (Table 3.8).
RR. Mean RR was high during all three feedings, ranging from 68.4 breaths/min during feeding 1
(Slow) to 75.8 breaths/min during feeding 3 (Slow) (Table 3.9). The infant increased her RR during
feeding compared to baseline for all three feedings. The change from baseline to feeding was greatest for
feeding 2 (Standard; 18.5 breaths/min) and similar for feedings 1 (Slow; 4.4 breaths/min) and 3 (Slow; 3.6
breaths/min). Mean RR returned to near or below baseline during the recovery periods of feedings 2
(Standard) and 3 (Slow), but remained elevated above baseline during the recovery period after feeding 1
(Slow). In Figure 3.4, mean RR was plotted over time and revealed a nearly flat regression line for
feeding 1 (Slow) with a slightly positive slope, although a closer look at the repeated measures reveals
considerable variation in the mean RR values at each time point. The infant had one apnea during the
first nipple-in episode of feeding 1 (Slow), where mean RR for this episode was 31 breaths/min.
Otherwise, she did not have any apneic episodes during feeding. Consistent with the greatest changes in
mean RR during feeding 2 (Standard), the regression line for feeding 2 had the steepest curve and was
concave (i.e., increased from baseline to feeding, then decreased during recovery) (Figure 3.4). Feeding
3 (Slow) also had a concave curve, but was less steep (Figure 3.4).
Although apneic episodes were rare during feeding, this infant did have 2 apneic episodes during
the baseline period prior to feeding 1 (Slow) and three episodes during the baseline period prior to
feeding 2 (Standard). She had no apneic episodes prior to feeding 3 (Slow). The frequency of apneic
episodes during the baseline period of feeding 2 (Standard) may explain the relatively low mean RR of 53
breaths/min, and resultant large increase from baseline to feeding. During the 30 minute recovery period,
she had five apneic episodes after feeding 1 (Slow), eight after feeding 2 (Standard), and only one after
feeding 3 (Slow). In the Phase 2 analysis, LMM revealed that there was a statistically significant effect of
flow condition on RR during feeding (p=0.09); she had a higher RR during slow-flow feeding than during
standard-flow, when covaried on baseline RR.
Discussion
Feeding was a challenging event for this infant and was associated with adverse events, such as

50
coughing and gagging, and evidence of physiologic expense and behavioral disorganization regardless of
whether she was fed with a slow-flow or standard-flow nipple. There is evidence throughout the literature
that infants with HLHS have difficulty feeding (Davis, et al., 2008; Jadcherla, et al., 2009), but this is the
first study that we know of that has looked closely at the physiologic and behavioral effects that occur as
an infant with HLHS faces the challenge of oral feeding.
The medical course of this infant with HLHS was not atypical for infants with similar cardiac
disease. Her intubation time was somewhat lengthy as a result of her slightly delayed stage 1 procedure
and the presence of chylothorax postoperatively, but she did not experience any life-threatening
complications and had the benefit of some left ventricular function.
In comparing the feedings to one another, the feeders’ actions were not considerably different.
During feeding 3 (Slow), the infant’s mother offered her a pacifier and burped her more often than during
feedings 1 (Slow) and 2 (Standard). It is speculated that this was done in an attempt to help the infant to
organize her behavior for the feeding. The behavioral outcomes of feeding 3 (Slow) show that the infant
was never fully organized. Between feedings 2 (Standard) and 3 (Slow), the infant was reintubated for
placement of a gastrostomy tube and feeding 3 was particularly difficult for her. Her behavioral state prior
to feeding 3 (Slow) was also different with her being in active sleep only 50% of the time, compared to
100% of both baseline periods prior to feedings 1 (Slow) and 2 (Standard). This change in behavioral
state during rest may be indicative of pain related to her abdominal incision, since she was given
acetaminophen immediately prior to the feeding and it may not have had the time to take effect. When a
pacifier was offered, she was able to calm down and appeared ready for feeding, but as soon as flow
started when the bottle nipple was placed in her mouth, she would become disorganized again.
The behavioral outcomes provided important information about this infant’s response to feeding.
Feeding was behaviorally distressing for Baby G. She coughed with concerning frequency during feeding
1 (7 events accounting for 50.5 seconds), despite the use of a slow-flow nipple. Given her surgical
history, she is at high risk for aspiration due to vocal cord and/or swallowing dysfunction (Carpes, et al.,
2011; Sachdeva, et al., 2007; Skinner, et al., 2005). Although the feeding team evaluation prior to the
study did not find evidence of aspiration, at the time of the study, she had not had an evaluation of her
vocal cord movement or a swallow study to evaluate the safety of her swallow during feeding. One

51
difference between feeding 1 (Slow) and the other two study feedings was the presence of a nasogastric
tube during feeding. Theoretically, the presence of a nasogastric tube in the posterior oropharynx may
alter the anatomy during swallowing and increase the risk of aspiration, which may have contributed to
the increased coughing seen in feeding 1 (Slow).
Clinicians need to be vigilant in assessing for evidence of aspiration events, which have the
potential to not only be life-threatening in these very high-risk infants, but also be experienced negatively
by the infant, which has ramifications for future engagement in oral feeding. Some institutions have
moved away from the use of videofluroscopic swallow studies because of radiation exposure. If
fluoroscopy is to be avoided, new techniques for evaluating the safety of swallowing during feeding in
infants need to be developed. For example, pharyngo-esophageal micromanometry may be a useful
method for evaluating swallowing and peristalsis (Barlow, 2009).
Baby G had 4 gagging episodes during feeding 2 (Standard), which was also concerning. The
gag reflex is a protective mechanism to prevent aspiration and choking and occurs when food or fluid
remains in the posterior oropharynx after swallowing (Morris & Klein, 2000). The higher flow rate of the
standard-flow condition may have resulted in pooling of milk in the posterior oropharynx, especially if she
was having difficulty swallowing completely, which initiated the gag reflex. Aside from being an indication
that this infant was at high risk for aspiration, gagging is a negative experience during feeding (Byars, et
al., 2003). This infant had multiple factors that put her at risk for aversion to oral feeding, including
prolonged intubation, multiple intubations, gastroesophageal reflux, prolonged nasogastric tube use, and
prolonged period without oral feeding (Dodrill, et al., 2004; Einarson & Arthur, 2003; Hyman, 1994;
Jadcherla, Wang, Vijayapal, & Leuthner, 2010). Infants with HLHS are frequently found to experience
long-term feeding difficulty (Hill, et al., 2014; Maurer, et al., 2011), and negative experiences like gagging
during feeding should be actively avoided to prevent the development of long-term feeding disorders.
As discussed previously, feeding 3 (Slow) was particularly difficult for this infant and she
displayed indicators of disengagement, avoiding feeding and compelling disorganization during a
significant proportion of this feeding, despite being slow-flow. This study feeding occurred about 48 hours
after placement of the gastrostomy tube, which required a reintubation. A number of factors associated
with the procedure, including an additional negative oral experience, pain at the incision site, and swelling

52
of the pharyngeal structures, may have contributed to the difficulty that she experienced during feeding 3.
Feedings 1 (Slow) and 2 (Standard) were relatively similar with regards to her level of engagement in the
feeding and, although she was organized for more of feeding 2 than feeding 1 (29.3% vs. 4.8%), she was
compellingly disorganized during very little of either of those two feedings.
Physiologically, feeding was a challenge for this infant and, consistent with Polyvagal Theory
(Porges, 1995), her SNS response to this challenge was to increase HR in order to meet physiologic
demands. Normal HR range for young infants is considered 110-150 bpm (Park, 2010) and her HR at
baseline was at the high end to above normal (range 137.3 – 172.9 bpm). Her HR increased during
feeding to 141.8 – 194.2 bpm. In this case, an increase in HR much above baseline was potentially
problematic because when the HR rises above approximately 180 bpm, ventricular filling time and end-
diastolic volume are diminished and myocardial oxygen consumption increases (Gupta, 2014). Since
myocardial perfusion occurs during the diastolic phase, increases in HR above 180 bpm have the
potential to cause cardiac ischemia and ventricular dysfunction (Gupta, 2014). In an infant recovering
from open heart surgery and with pre-existing diminished ventricular function, cardiac protection is critical.
The results of the HR data suggest that feeding 1 (Slow) allowed this infant to maintain her HR closest to
baseline and the LMM analysis also revealed that slow-flow bottle-feeding allowed this infant to maintain
a lower HR during feeding than standard-flow feeding (p=0.01), indicating that slow-flow feeding may
have been less physiologically taxing.
The results of the respiratory indices were less clearly supportive of either flow condition. The
unique cardiac physiology of infants after stage 1 palliation for HLHS requires a careful balance of
pulmonary to systemic blood flow ratio (Qp:Qs). In this infant, since the RV was essentially providing blood
flow to both the pulmonary and systemic circulations, the vascular resistance in each of these systems
helped to determine the ratio of blood that flowed in either direction. Management of infants after stage 1
palliation aims to maintain Qp:Qs = 1, which is generally achieved with a systemic arterial oxygen
saturation of approximately 75-80% (Photiadis, et al., 2006).
Sp02 as measured in this study is a measure of arterial oxygen saturation. During baseline, this
infant’s mean Sp02 was 83.8 – 86%, which was already higher than the target range (Photiadis, et al.,
2006). Given the fragile balance of Qp:Qs, the goal for Sp02 during feeding should be to remain as close

53
to baseline as possible. Sp02 outside of the range of 75-90% is considered concerning in this population
(Feinstein, et al., 2012). These infants are already hypoxic and further significant decreases in
oxygenation are potentially detrimental to oxygen delivery to the systemic and coronary perfusion.
Similarly, increases in Sp02 above 90% are also problematic, as they suggest preferential shunting of
blood to the pulmonary circulation, which may result in excessive pulmonary blood flow and reduced
systemic perfusion. In addition to the obvious issues with reduced systemic perfusion and/or oxygen
delivery, such as perfusion of the brain and heart, adequate perfusion and oxygen delivery to the
gastrointestinal tract is critical for the infant to utilize the nutrients that are ingested during feeding.
Given the constraints of the physiology in this patient, the LMM results of the analysis of Sp02
indicating a trend toward higher Sp02 during slow-flow feedings (p=0.1) was not necessarily better.
During feeding 1 (Slow), the infant had frequent increases in Sp02 greater than 5% above baseline
(>89%). This was surprising given the number and duration of coughing events. Coughing can be a sign
of aspiration, which is typically associated with decreases in Sp02. In this infant, coughing events resulted
in a rise in Sp02. The mechanism behind this is unclear. It may be that the infant had small residual
pleural effusions and coughing resulted in increased lung volume and therefore a temporary fall in
pulmonary vascular resistance, resulting in increased Sp02 (Gabrielli, et al., 2009). During feeding 3
(Slow), the infant only had 1 brief coughing event, but still had several increases in Sp02 greater than 5%
above baseline. The maximum Sp02 during feeding 3 (Slow), however, was 91.6% compared to 98.6% in
feeding 1 (Slow). During feeding 2 (Standard), the infant had rare events above 89% or below 76%.
The results of RR during feeding also suggested that both feeding conditions caused significant
physiologic distress. The LMM analysis revealed that RR was higher during slow-flow feedings (72.1 vs.
71.5 breaths/min; p=0.09), however the change from baseline to feeding was greatest for feeding 2
(Standard) (18.5 breaths/min). Normal RR for infants is considered to be approximately 24-50 breaths/min
(Bardella, 1999). On one hand, since Baby G’s RR was above normal, the higher RR during slow-flow
feeding could be interpreted as being an indicator of this feeding condition being more physiologically-
demanding and requiring the infant to therefore increase RR accordingly. On the other hand, this could be
interpreted as being supportive of physiologic stability because the infant is able to breathe during
feeding. Some medically fragile infants are unable to coordinate breathing with sucking and swallowing

54
during feeding and experience a decrease in RR (Mathew, 1991a).
This infant’s mean RR across all three feedings was approximately 72 breaths/min, which is
equivalent to one breath every 0.83 seconds. In normal infants, swallowing behavior is dominant to
respiration in order to protect the airway from aspiration, and respiration is paused for about 0.5-1.5
seconds during swallowing (Barlow, 2009). At this rate of respiration, it would have been very difficult, if
not impossible, for her to fit a safe swallow in between breaths. Since she was hypoxic at rest, she may
have been less able to tolerate a decrease in respiration during feeding than infants who are normally
oxygenated at the start of feeding. RR does not give any indication of how safely the infant is breathing
during feeding and it may have been that her need to breathe was so great that she did so during feeding
despite the risk for aspiration. The coordination of sucking, swallowing, and breathing is controlled by a
complex system of interacting nervous system networks that are dependent on sensory experiences to
facilitate pattern development (Barlow, 2009). Given that this infant was intubated for the first 24 days of
life, she had been deprived of early oral sensory input that would have supported the development of
these patterns for safe swallowing and breathing.
There were limitations to the respiration data, however, and these results should be interpreted
with caution. Respiratory rate was evaluated by chest movement using respiratory inductance
plethysmography. Although a minimum change in chest movement was used to identify a respiratory
cycle, this method did not identify a change in tidal volume. There may have been considerable
alterations in minute ventilation due to interrupted or shallow breaths during feeding that were not
identified. The reliability of RIP for measuring chest wall movements in infants who have undergone a
median sternotomy and have the potential for increased pliability of the chest wall may warrant further
investigation.
Another limitation of the study was the time between study feedings, particularly between
feedings 2 and 3. The effect of maturation and history could have been limited by performing all three
study feedings in one day, but the research team and clinical staff were concerned that this would
unnecessarily stress an already vulnerable baby. As a single case experiment, there are natural
limitations to the study data, but this design allowed for close evaluation of this infant’s response to the
different feeding conditions while considering the variable context of each feeding.

55
Conclusion
Although this was a single-subject experiment and the results cannot be assumed to reflect the
feeding responses of all infants with HLHS, this study provides data that reflects what many clinicians
have long observed- infants with HLHS can experience significant distress during feeding. This is the first
extensive examination of the physiologic and behavioral responses of an infant with HLHS to the
challenge of oral feeding. Despite the use of a very slow-flow nipple (Dr. Brown’s Preemie) for the slow-
flow feeding condition, this infant experienced significant distress during feeding. Feeding typically occurs
every three hours in young infants and this degree of distress eight times a day is highly problematic for
this fragile infant. Feeding interventions aimed at reducing physiologic and behavioral stress, preserving
metabolic resources, and encouraging positive oral experiences are needed to support infants with
HLHS, especially during the tumultuous time between stage 1 and stage 2 palliative procedures.
The results of this study suggest that future studies should consider testing an even slower flow
nipple combined with additional supportive feeding interventions. A semi-elevated side-lying position has
been found to support physiologic stability in infants born premature by slowing the movement of the
bolus to the back of the oral cavity and reducing the work of breathing (Park, Thoyre, Knafl, Hodges, &
Nix, 2014). In the population of infants with HLHS, a right side-lying position with the left vocal cord
positioned up may be supportive for these same reasons as well as minimizing the risk of aspiration
resulting from any malfunction of the left vocal cord; positioning the functioning right vocal cord down
utilizes it for primary protection of the airway.
A right side-lying position is easily attained during breastfeeding with the infant positioned in a
cross-body/cradle hold while feeding from the left breast or a football hold when feeding from the right
breast. Although there is evidence that breastfeeding may reduce the stress of feeding in preterm infants
(Chen, Wang, Chang, & Chi, 2000; Meier, 1988) and infants with other types of congenital heart disease
(Marino, O'Brien, & LoRe, 1995), clinicians continue to express concern about allowing infants with HLHS
to feed at breast. Research needs to be done to evaluate whether these concerns are valid for this
population. With the use of test weighing (Meier, Lysakowski, Engstrom, Kavanaugh, & Mangurten,
1990), there should be no concern about ability to assess intake and there is the potential for highly
significant benefits to both mother and baby with breastfeeding (Ip, et al., 2007).

56
Future studies also need to evaluate the coordination of sucking, swallowing, and breathing in
this population of infants that have been deprived of early oral feeding experience. These infants may
benefit from a co-regulatory approach to feeding with close evaluation by the feeder of sucking,
swallowing, and breathing behavior (Thoyre, Holditch-Davis, Schwartz, Melendez Roman, & Nix, 2012).
Using this approach, the feeder could cue the infant to rest (i.e., pacing) and recover before he or she
becomes overtly distressed.
The results of this study support the need for further investigation of the responses of infants with
HLHS to oral feeding and the development of feeding methods to support these extremely fragile infants
as they learn to feed orally and await further surgical intervention. Identifying methods to reduce
physiologic and behavioral distress during feeding in these babies has the potential to facilitate recovery
and growth, as well as prevent long-term neurodevelopmental and feeding difficulties. Feeding has been
identified by parents of infants with CHD to be a source of stress (Medoff-Cooper, Naim, Torowicz, &
Mott, 2010; Svavarsdottir & McCubbin, 1996). Emphasis should be placed on identifying feeding
strategies that are simple, easily implemented by parents, and will reduce, not increase, parenting stress.

57
Table 3.1.
Specific Measures
Variable Measure
Infant Characteristics
Pregnancy and Birth History, Medical Course, Feeding Experience
Feeding Description
Feeding Duration, Nipple-In Duration, Milk Consumed, Milk Flow,
Nasogastric Tube Presence, and Milk Type
Behavioral
Feeder Actions: Stimulating Sucking, Decreasing Milk Flow, Repositioning, Burping, and Pacifier
Infant Behavior: Baseline: Movement and Behavioral State; Feeding: Coughing, Gagging, Engagement, and Behavioral Organization
Physiologic HR, Sp02, and RR
Note. HR = heart rate; Sp02 = oxygen saturation; RR = respiratory rate.

58
Table 3.2. Coding Scheme Descriptions of Behavioral State, Engagement, and Organization
Category Description
Behavioral State
Cry/Fuss Infant is crying wholeheartedly or fussing (emits at least three brief fuss sounds during epoch). Infant is usually active. Eyes are usually closed.
Alert Eyes are open and bright, and may be scanning. Motor activity is typically low, but the infant may be active.
Drowse/Daze Eyes are “heavy-lidded” or “slit-like”, and occasionally opening and closing slowly or open but dazed. Motor activity is typically low, respiration is even.
Sleep Eyes closed. Sporadic motor movements, but tone low between movements.
Engagement
Fully engaged Ready, participating in feeding; directing energy toward feeding; flexed arms/hands with observable tone; cues of readiness to continue feeding.
Low engagement Low or no energy, as evidenced by loss of energy or low muscle tone; may still be sucking but passively/reflexively.
Disengaged, avoiding Infant is directing energy away from feeding, using energy to move away from the nipple, pushing away, pulling away, turning away, extending arms
Organization
Organized behaviorally No indicators of disorganized behavior.
Mild disorganization Mild indicators of disorganized behavior (e.g., slight eyebrow raise or eyelid flutter, splayed fingers or furrowed brow).
Compelling disorganization
Compelling indicators that the infant is actively trying to pull away from nipple, or extending fingers or arms, pushing nipple away, or flaccid. Behaviors may be isolated or occur along with eyebrow raise or eyelid flutter, furrowed brow.
Table 3.3.
Feeding Experience
Feeding 1 (Slow) Feeding 2 (Standard) Feeding 3 (Slow)
Number of Oral Feeding Experiences
117 124 149
Oral Intake in Previous 24 hours
63% 61% 91%
Note. Oral intake in previous 24 hours = percent of prescribed nutrition consumed orally in prior 24 hours.

59
Table 3.4.
Feeding Description
Feeding 1 (Slow) Feeding 2 (Standard) Feeding 3 (Slow)
Feeding Duration (mins) 21.2 13.7 15.5
Nipple-In Duration (mins) 14.3 6.6 7.1
Milk Consumed (mL) 40 40 35
Milk Flow (mL/min) 2.8 6.1 4.9
Nasogastric Tube Present Yes No No
Note. Feeding duration = time from first nipple-in to last nipple-out. Nipple-in duration = time the nipple was in the infant’s mouth. Milk Flow = Milk Consumed/Nipple-In duration. Mins = minutes. mL = milliliters. Table 3.5.
Feeder Actions
Feeding 1 (Slow) Feeding 2 (Standard) Feeding 3 (Slow)
Stimulating Sucking (No.) 4 3 2
Decreasing Milk Flow (No.) 1 0 3
Repositioning (No.) 4 6 1
Burping (secs) 118.2 104.5 241.3
Pacifier (secs) 25.8 50.9 144.5
Note. The variables stimulating sucking, decreasing milk flow, and repositioning were calculated during the nipple-in period and are given in number of events. Burping and pacifier durations were calculated during the entire feeding period and are given in seconds. No. = Number. Secs = seconds.

60
Table 3.6.
Behavioral Outcomes During Feeding
Feeding 1 (Slow) Feeding 2 (Standard) Feeding 3 (Slow)
Distress Behaviors
Coughing
Number of Events 7 2 1
Duration (secs) 50.5 15.2 1.13
Gagging
Number of Events 1 4 0
Duration (secs) 2.2 12.7 0
Engagement
Full Engagement 91.6 % 96.0% 44.8%
Low Engagement 0% 0% 0%
Disengaged, Avoiding 8.4% 4% 55.2%
Organization
Organized 4.8% 29.3% 0%
Mild Disorganization 89.7% 68.8% 52.1%
Compelling Disorganization 5.5% 1.9% 47.9%
Note. Distress behaviors were evaluated during the entire feeding period, including time when the nipple was not in the infant’s mouth. Engagement and organization was evaluated only during nipple-in periods. Secs = seconds. Table 3.7.
Heart Rate Indices
Feeding 1 (Slow) Feeding 2 (Standard) Feeding 3 (Slow)
Base Feed Recover Base Feed Recover Base Feed Recover
HR (bpm)
Mean 167.9 172.9 162.6 156.6 166.6 152.8 146.6 156.8 142.8
Minimum 161.3 149.6 127.7 150.8 152.3 127.1 137.3 141.8 127.9
Maximum 172.9 194.2 176.5 162.6 191.1 170.5 152.7 172.9 156.3
Change from Baseline 4.9 -5.3 9.8 -3.9 10.2 -3.8
CV 0.010 0.023 0.026 0.013 0.018 0.025 0.019 0.027 0.024
Note. Mean values for HR were calculated as a true mean of the entire baseline, feeding, and recovery periods. HR = heart rate. Bpm = beats per minute. Base = baseline. Feed = feeding. Recover = recovery. CV = coefficient of variation (standard deviation/mean).

61
Table 3.8.
Physiologic Changes During Feeding by Flow Condition
Slow Standard p
HR (bpm) 166.2 166.6 0.01*
Sp02 (%) 86.3 83.5 0.1**
RR (breaths/min) 72.1 71.5 0.09*
Note. Linear Mixed Modeling was used to analyze the physiologic variables during feeding, covaried on baseline values. Results were grouped by flow condition (slow vs. standard). HR = heart rate; bpm = beats per minute. Sp02 = oxygen saturation; RR = respiratory rate; Min = minute. * p < 0.1. ** p < 0.2.
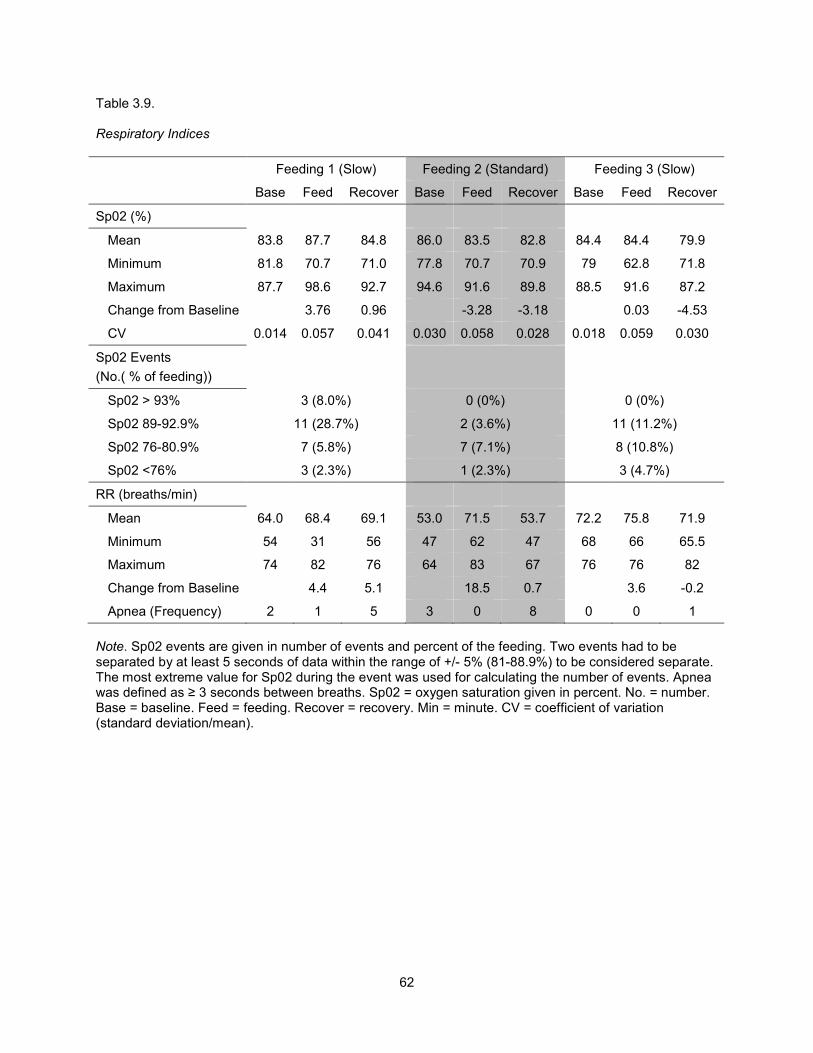
62
Table 3.9.
Respiratory Indices
Feeding 1 (Slow) Feeding 2 (Standard) Feeding 3 (Slow)
Base Feed Recover Base Feed Recover Base Feed Recover
Sp02 (%)
Mean 83.8 87.7 84.8 86.0 83.5 82.8 84.4 84.4 79.9
Minimum 81.8 70.7 71.0 77.8 70.7 70.9 79 62.8 71.8
Maximum 87.7 98.6 92.7 94.6 91.6 89.8 88.5 91.6 87.2
Change from Baseline 3.76 0.96 -3.28 -3.18 0.03 -4.53
CV 0.014 0.057 0.041 0.030 0.058 0.028 0.018 0.059 0.030
Sp02 Events
(No.( % of feeding))
Sp02 > 93% 3 (8.0%) 0 (0%) 0 (0%)
Sp02 89-92.9% 11 (28.7%) 2 (3.6%) 11 (11.2%)
Sp02 76-80.9% 7 (5.8%) 7 (7.1%) 8 (10.8%)
Sp02 <76% 3 (2.3%) 1 (2.3%) 3 (4.7%)
RR (breaths/min)
Mean 64.0 68.4 69.1 53.0 71.5 53.7 72.2 75.8 71.9
Minimum 54 31 56 47 62 47 68 66 65.5
Maximum 74 82 76 64 83 67 76 76 82
Change from Baseline 4.4 5.1 18.5 0.7 3.6 -0.2
Apnea (Frequency) 2 1 5 3 0 8 0 0 1
Note. Sp02 events are given in number of events and percent of the feeding. Two events had to be separated by at least 5 seconds of data within the range of +/- 5% (81-88.9%) to be considered separate. The most extreme value for Sp02 during the event was used for calculating the number of events. Apnea was defined as ≥ 3 seconds between breaths. Sp02 = oxygen saturation given in percent. No. = number. Base = baseline. Feed = feeding. Recover = recovery. Min = minute. CV = coefficient of variation (standard deviation/mean).

63
Figure 3.1. Illustration of post-surgical cardiac anatomy of Baby G. Deoxygenated blood returning from the body to the right atrium (RA) is indicated in blue. Oxygenated blood returning from the lungs to the left atrium (LA) is indicated in red and moves in two directions: 1) across the atrial septum and 2) to the hypoplastic left ventricle (LV) where it exits the aortic valve. There is mixing of blood in the RA. Mixed blood is indicated in purple and can be seen exiting the right ventricle (RV) in two directions: 1) via the RV-pulmonary artery (RV-PA) conduit to the lungs and 2) via the proximal pulmonary artery, which has been surgically connected to the aorta (Ao), to the body. Drawing courtesy of Britt Pados.
RA
LA
RV
LV
RV-PA Conduit
PA
Ao

64
Figure 3.2. Heart Rate (bpm) plotted every 1 minute during baseline (6 minutes) and feeding (indicated in grey), and every 2 minutes during recovery (30 minutes). Quadratic regression equations- Feeding 1 (Slow): y= -0.02x2 + 0.70x + 167.01 (R2=0.60); Feeding 2 (Standard): y= -0.03x2 + 0.92x +157.07 (R2=0.71); Feeding 3 (Slow): y= -0.04x2 + 1.41x + 143.67 (R2=0.75). bpm = beats per minute.
Figure 3.3. Sp02 plotted every 1 minute during baseline (6 minutes) and feeding (in grey), and every 2 minutes during recovery (30 minutes). Quadratic regression equations: Feeding 1 (Slow): y= -0.01x2 + 0.38x + 83.61 (R2=0.11); Feeding 2 (Standard): y= 0.004x2 + 0.30x + 86.94 (R2=0.28); Feeding 3 (Slow): y=0.0003x2 – 0.18x +86.38 (R2=0.40). Sp02 = oxygen saturation.
135
140
145
150
155
160
165
170
175
180
185
1 2 3 4 5 6 1 2 3 4 5 6 7 8 9 101112131415161718192021 2 4 6 8 1012141618202224262830
Heart
Rate
(b
pm
)
Feeding
Heart Rate
Feeding 1 (Slow)
Feeding 2 (Standard)
Feeding 3 (Slow)
Baseline
1
2
3
Recovery
67
72
77
82
87
92
97
1 2 3 4 5 6 1 2 3 4 5 6 7 8 9 101112131415161718192021 2 4 6 8 1012141618202224262830
Sp
02
(%
)
Feeding
Oxygen Saturation
Feeding 1 (Slow)
Feeding 2 (Standard)
Feeding 3 (Slow)
Baseline
1
2
3
Recovery

65
Figure 3.4. RR (breaths/min) plotted every 1 minute during baseline (6 minutes) and nipple-in periods of feeding (in grey), and every 2 minutes during recovery (30 minutes). Quadratic regression equations- Feeding 1 (Slow): y= 0.004x2 + 0.03x + 65.89 (R2= 0.03); Feeding 2 (Standard): y= -0.08x2 + 2.55x + 48.61 (R2=0.57); Feeding 3 (Slow): y= -0.02x2 + 0.63x + 71.08 (R2=0.19). RR = respiratory rate.
20.00
30.00
40.00
50.00
60.00
70.00
80.00
90.00
1 2 3 4 5 6 1 2 3 4 5 6 7 8 9 10 11 12 13 14 2 4 6 8 10 12 14 16 18 20 22 24 26 28 30
RR
(b
rea
ths
/min
)
Feeding
Respiratory Rate
Feeding 1 (Slow)
Feeding 2 (Standard)
Feeding 3 (Slow)
Baseline
3
1
2
Recovery

66
APPENDIX 3.1: STUDY FEEDING PROTOCOL
Pre-Feeding Preparation:
1. Swaddle infant with hips and shoulder girdles supported in flexed position and lower arms free to
move.
2. Hold infant en face supported at shoulders with blanket and feeders’ hands.
3. Hold infant in a flexed body position (shoulders adducted, hips and knees flexed).
4. Provide minimal movement of the infant’s body.
5. Speak softly to the infant to bring infant to an alert state.
Feeding Strategies:
1. Hold infant in left arm supported at the shoulders.
2. Hold infant in a flexed body position.
3. Hold infant in a head elevated position at 45 degrees.
4. Provide minimal movement of the infant’s body.
5. Avoid prodding of the nipple to encourage sucking.
6. Avoid increasing milk flow from the nipple by manipulating the nipple in any way.
7. Place nipple in infant’s mouth when he/she displays cues of readiness to feed, including opening
mouth and lowering tongue on presentation of nipple.
8. If infant displays signs of physiologic distress, defined as tachycardia (HR>200 beats/min),
bradycardia (HR < 80 beats/min) or a decrease in Sa02 by more than 10% from baseline, remove
the bottle and allow recovery period. Reinitiate feeding when the infant is physiologically stable
and displays cues of readiness to feed.
9. If infant is no longer engaged in the feeding, remove the bottle and burp if needed. Reinitiate
feeding when the infant displays cues of readiness to feed.
10. Discontinue feeding if the infant has taken the prescribed amount or if 30 minutes have elapsed
from the first time the bottle was placed in the infant’s mouth.

67
APPENDIX 3.2: PROTOCOL FOR DATA COLLECTION
This protocol was created by Jinhee Park on 6/27/2011 and modified for the purposes of this study by Britt Pados on 10/10/2012. Prior to Arriving at Infant’s Bedside:
• Check everything that belongs on the feeding cart (use the checklist).
• Turn on the Lenovo computer and select ‘computer only log on’ (enter ID and password).
• Turn on the BioNex Chassis and all the equipment and open the BioLab 3.0.10 icon.
• Open the BioLab 3.0.10.
• Open the configuration file (Diss_config_file.mwcfg) that was previously set up and saved in the Dissertation folder on the desktop.
• Check the settings of the equipment according to the Protocol for Preparation of the Data Collection Cart.
• Check the settings of the configuration window:
General settings

68
Channel setting
Scale setting for Sp02 channel

69
Audio/Video Setting
Trending setting
• Exit the BioLab program.
• Shut down the all equipment and computer.
• Disconnect the pulse oximeter sensor, transducer, respiration band, ECG leads, and microphone from the equipment and put them back into the first drawer.
• Fold the camera up inside the room under the top of the cart.

70
At the Infant’s Bedside:
• Make environment is as quiet as possible (Pull the curtain down, Dim the lights, etc.)
• Connect the cables to the BioNex Chassis and to the equipment
• Turn the computer on (The receiver of wireless mouse must be unplugged from the USB port before you turn on the computer).
• Turn on the power of the BioNex Chassis and all equipment (Pulse oximeter, Microphone, ECG, Ambu Sleepmate, and camera)
• Open BioLab 3.0.6.
• Open the configuration file (Diss_config_file.mwcfg) that previously set up and saved in the Dissertation folder on the desktop.
• Put sensors on the baby � Pulse oximeter: Place pulse oximeter sensor on the infant’s left foot and secure with
additional placement wrap. � ECG: place electrodes on the infant’s chest as below. Note. Do not remove the infant’s own
electrodes if he/she has them, but you can move them if needed. � Skin conductance ECG: Place electrodes on the infant’s foot and ankle as shown below.
� Respiration: Place respiratory band around the infant’s chest at nipple level on the top of the infant’s clothes.
� Microphone: Place the mic on the infant’s mid neck at the suprasternal notch with double-sided tape and secure with a hydrogel tape.
• Make sure the signals are all good before the infant is settled.
• Let all instruments warm up 30 min
Baseline data collection:
• Begin to record after completion of the feeding prior to the first study feeding (When recording, you can see green light on the right bottom) � Click AQUIRE on the bottom of the configuration window
• Enter the random, 5-digit subject ID in Britt’s dissertation folder
• Hit START/STOP button on the upper left of the BioLab acquisition screen to start recording.
• Video camera should be collecting a picture of the infant’s entire body. Hit record button on the video camera.

71
• Send the analog out calibration signals from the Masimo to the BioNex Chassis.
� Pulse wave: Hit menu , select ‘output’, and set ‘Analog 1’ to ‘0V Signal’. Verify that the BioLab shows a voltage of approximately 0V on pulse wave channel. Set ‘Analog 1’ to ‘1V Signal’ and then verify that the BioLab shows a voltage of approximately 1V on pulse wave channel.
� Hit menu , select ‘output’, and set ‘Analog 2’ to ‘0V Signal’. Verify that that the BioLab shows an approximately 0% of Sp02 on the second channel. Set ‘Analog 2’ to ‘1V Signal’ and then verify that the BioLab shows approximately 100% of Sp02 on the second channel.
• Continue to record until the infant wakes for the feeding after data collection is complete.
• Monitor the quality of data signals in each channel. If the signal is lost or has too much noise, PI should be informed. � Pulse wave & EKG
Normal EKG signal: regular R-R interval
It usually comes with regular pulse wave form.
When the baby is moving, EKG can be disturbed a bit.

72
If the signal goes flat or has irregular waveform for few seconds, report this to PI.
� SaO2: The signals on the Masimo and the BioLab need to be corresponding to each other. Note: The alarm of the Masimo will be indicated only by the symbol of alarm flashing. Please let PI know if alarm is flashing.
� Swallowing
� Respiration
Data collection during feeding:
• When the infant wakes up for feeding, routine nursery care will be provided by his/her assigned nurse or parent.
• Weigh infant in clothing and diaper in which he/she will be fed.
• Swaddle the infant.
• Proceed with feeding according to predetermined feeding order. Video camera angle will need to be adjusted for feeding position to capture the infant from the waist up.
• Write a memo when significant events occur using Journal (F12) of the BioLab program.

73
• When feeding is determined to be finished, record the length of feeding time.
• Weigh infant in same clothing and diaper as prior to feeding.
• Post feeding nursery care will be provided by nurse and/or parent and infant will be placed supine in crib or held by family member. Pacifier may be offered as necessary.
Data collection after feeding
• All equipment is to remain on the infant and the physiologic data collection continues.
• The video camera should be repositioned to capture the infant’s entire body in the crib and video recording begun.
After Data collection
• Shut down all equipment, computer, and BioNex Chassis.
• Gently remove all monitoring equipment.
• Wipe down all cables and monitoring equipment as it is put away from the baby and put it back into the drawer in the physiologic cart. Note: Put the equipment that requires cleaning into the zip bag (e.g., microphone, resp. band).
• Wash bottle and nipple used for study according to unit standard of practice.
• Clean up all the equipment or throw away if it is disposable. <Pulse oximeter sensor and cable>
� Wash the light blue band. � Wipe down the black band and the crystal sensor with alcohol swab or disinfectant wipes. <Respiration band>
� Wash the light blue band. � Wipe down the black band and the crystal sensor with alcohol swab or disinfectant wipes. <Others>
� Wipe down other equipment with alcohol swab or disinfectant wipes.
• Back up the data on an encrypted, password-protected external hard drive and lock in filing cabinet.
• Download the trend data from the Masimo Radical-7 pulse co-oximeter.
� Assure that the Radical-7 serial output mode is set to “ASCII2” (MENU <OUPUT) � Open Trendcom software on the computer. � Under the ‘instrument’ menu in Trendcom, select ‘Radical-7 (V7619 or greater)’. � Under the ‘COM Port’ menu, select ‘COM5’. � Click on ‘Retrieve Trend’. The following message may appear: “please make sure the Radical
is set to ASCII2 output mode” and click OK. � Name the file. � Save the file to the appropriate folder. � You will have date, time, Sp02, pulse rate and perfusion index (PI) every 2 seconds that is s
ame as averaging rate you set.

74
• Download the video files from the Panasonic HDC-TM700 if you need a high resolution AVCHD video file. � Assure that HD Writer AE 2.1 is installed in the computer. � Connect the video camera to the computer with the USB cable. � Turn the video camera on. � Open HD Writer AE 2.1. � Click ‘Copy to PC’< ‘Video Camera (E)’< ‘Next’. � Select the video file what you want to download. � Assign the folder and name the file. � Click ‘Execute’.
• After downloading the video files, format built-in memory on the Panasonic camera � MENU<SETUP<FORMAT MEDIA<BUILT-IN MEMORY. � When formatting is complete, touch ‘EXIT’ to exit the message screen.

APPENDIX 3.3: OBSERVATIONAL CODING SCHEME
Code Class and Codes Description
1.0 Structure of the Feeding Mutually exclusive/continuous codes: 1.1 Nipple in
1.2 Nipple out 1.3 Non-feeding
Fully seated nipple
Code when entire nipple is visible as outside the infant’s lips/outside the mouth (visualize nipple tip); can be resting on outside of lips. Default code at start of coding session. Nipple is not in, no feeding.
2.0 Caregiver Feeding Actions Mutually exclusive/continuous codes: 2.1 No nipple in 2.2 Nipple held still 2.3 Increase intraoral stimulus to suck 2.4 Decrease milk flow by
moving nipple
2.5 Unsure/unable to determine
Default code at start of coding session. Nipple in neutral position; no or minimal or brief movement of the nipple in the infant’s mouth; other than the very first code when nipple in, if nipple held still is 1 second or less it is considered increase intraoral stimulus to suck (e.g., decrease milk flow – up for less than one second and then decrease again, the up is considered stim) Movement of the nipple that may stimulate a suck; intention is not assumed; the feeder may be adjusting the nipple to hold the bottle better or to seat the nipple on the tongue better, may occur in the process of checking to see if the infant is drooling, or trying to arouse the infant or to stimulate the infant to engage in sucking by moving the nipple; from the infant’s perspective, the nipple has moved in the mouth and this reflexively may stimulate sucking; it may also cause fluid to drip into the mouth placing a demand on the infant to manage the fluid; has the effect of increasing the stimulus of the nipple; if less than 5 seconds between increase oral stimulus events in the absence of decrease milk flow, increase intraoral stimulus stays on. For breast feeding, this could include mom moving her breast tissue sufficient to have the potential of stimulating the suck, making an airspace for the infant’s nose may or may not be sufficient to stimulate the suck – i.e., it can be done without stimulating the suck (e.g., moving the nipple shield away from the infant’s nose); mom positioning infant for the latch is not stimulating suck Moving nipple down, back, or to the side – has the effect of decreasing the milk flow or of milk in the nipple; code nipple still when nipple is moved back to the neutral position; may include stimulation but flow is not available so decrease milk flow is the correct code
78

3.0 Vestibular Stimulation Mutually exclusive/continuous codes: 3.1 Non-feeding vestibular 3.2 No vestibular stimulation 3.3 Infant moved in space,
rhythmically 3.4 Repositioned 3.5 Unsure/unable to determine
vestibular
* The video was focused on the infant; this may be difficult to code. Default code at start of coding session. Infant rocked or bounced; moved in space; has more than an event quality; has some repetitive, rhythmical quality; turned off if stimulus from reposition occurs. Pillow placed under baby; position adjusted; maternal or infant movement that is time limited and brings infant essentially back to same position (not more upright, not more flat/back). Goes back to no vestibular right away after adjustment.
4.0 Infant Engagement: Mutually exclusive/continuous codes: 4.1 Non-feeding engagement 4.2 Fully engaged 4.3 Low engagement
4.4 Disengaged, avoiding 4.5 Unsure/unable to determine
Default code at start of coding session. Ready, participating in the feeding; engaged, directing energy toward feeding, bringing energy to the feeding; flexed arms/hands with observable motor tone; observable cues of readiness to continue feeding; may bring body toward feeding position – midline, flexed
Low or no energy, as evidenced by loss of energy or low muscle tone; may still be sucking but passively/reflexively
Observable indicators that the infant is directing energy away from feeding, using energy to move away from the nipple, pushing away, pulling away, turning away, extending arms As all categories, more than 5 seconds apart from each other to count as a new state.
79

5.0 Infant Behavioral Organization Mutually exclusive/continuous codes*: 5.1 Non-feeding organization 5.2 Organized behaviorally 5.3 Mild cues of disorganization 5.4 Compelling cues of disorganization
5.5 Unsure/unable to determine
Default code at start of coding session. No indicators of disorganized behavior Mild indicators of disorganized behavior, e.g., slight eyebrow raise or eyelid flutter (not due to social initiative), splayed fingers or furrowed brow. Compelling Indicators that the infant is actively trying to pull away from nipple, or extending fingers or arms, pushing nipple away. These behaviors may be isolated or may occur along with eyebrow raise or eyelid flutter, furrowed brow. May be flaccid. More than 5 seconds apart from each other to count as a new state.
6.0 Activity Level Mutually exclusive/continuous codes*: 6.1 No movement
6.2 Movement
6.3 Unsure
No movement of any part of infant except for eyes and small, slow movements of face. Movement of any part of body except eyes and face. Unable to determine activity level.
7.0 Behavioral state Interval codes every 10 seconds
7.1 Cry/Fuss The infant is crying wholeheartedly or fussing (emits at least three brief fuss sounds during epoch). The infant is usually active. The eyes are usually closed during crying.
7.2 Active Waking The infant’s eyes are usually open, dull and unfocused. Motor activity varies but is typically high. During periods of high-level activity the eyes may close.
7.3 Alert The infant’s eyes are open and bright, and may be scanning. Motor activity is typically low, but the infant may be active.
7.4 Drowse/Daze The infant’s eyes are “heavy-lidded” or “slit-like”, and occasionally opening and closing slowly OR open but dazed in appearance. The level of motor activity is typically low and respiration is fairly even.
80

7.5 Sleep-Wake Transition The infant shows behaviors of both wakefulness and sleep. There is generalized motor activity (usually this movement involves trunk), and although the eyes are typically closed, there may be rapid opening and closing of the eyes. Brief fussy vocalizations may occur.
Note. Generally 4 epochs (40 seconds) of continuous activity without REMs in the middle of sleep are scored sleep-wake transition.
Exception of 40 seconds rule.
• If the infant is disturbed by the caregiver while the camera angle is blocked and the infant was moving after the camera was back on, then S-W transition could be coded for less than 40 seconds by counting the period when the camera angle was blocked (we assume during that period, the infant was in movement).
• In the middle of waking, S-W transition could occur for less than 40 seconds.
7.6 Active Sleep The infant’s eyes are closed (may not be fully closed with REM observed). Respiration is uneven and primarily costal in nature. Sporadic motor movements occur, but muscle tone is low between these movements. REMs occur intermittently in this state.
7.7 Quiet Sleep The infant’s eyes are closed. Respiration is relatively slow and is abdominal in nature. A tonic level of motor tone (i.e., has some tone, not lethargic) is maintained, and motor activity is limited to occasional startles, sigh sobs, or other brief discharges.
*To code as Quiet sleep, this state should stay at least for 1 minute (60 seconds)
Note. Generally 2 epochs (20 seconds) of continuous movement when transitioning from quiet sleep are scored active sleep.
7.8 Unclassified Sleep
The infant is asleep but the video is not clear enough to distinguish specific sleep states (active vs. quite sleep).
7.9 Unscorable States Scored whenever the video is not clear enough to score states, e.g., the caregiver is blocking the camera angle.
8.0 Caregiver Activity Mutually exclusive/continuous codes*
8.1 No burping Default code at start of coding session. Caregiver is not burping infant.
8.2 Burping Caregiver is burping infant. Code from beginning of patting to end of patting.
81

9.0 Infant Behavior Mutually exclusive/continuous codes*
9.1 None
Default code at start of coding session. Infant is not coughing, gagging, or stooling.
9.2 Coughing
The infant is coughing. Code from first sound of cough to last sound of cough.
9.3 Gagging The infant is gagging, retching, or heaving. There may or may not be sound associated with the gag. Infant may thrust tongue, move the body or head as if to vomit, but without obvious expulsion of fluid.
9.4 Stooling The infant shows behaviors related to stooling, including bearing down.
10.0 Pacifier Use Mutually exclusive/continuous codes*
10.1 No pacifier
No pacifier is in the infant’s mouth. When pacifier is removed, code “no pacifier” when the entire nipple of the pacifier can be seen.
10.2 Pacifier A pacifier is in the infant’s mouth. Code from when the pacifier is fully seated in the infant’s mouth.
11.0 Sa02 Mutually exclusive/continuous codes*
11.1 >93% Oxygen saturation greater than 93% (>10 increase above baseline).
11.2 89-93% Oxygen saturation 89-93% (5-10% increase above baseline).
11.3 81-88.9% Oxygen saturation 81-88.9% (within +/- 5% of baseline).
11.4 76-80.9% Oxygen saturation 76-80.9% (5-10% decrease below baseline).
11.5 <76% Oxygen saturation < 76% (> 10% decrease below baseline).
11.6 Artifact Oxygen saturation reading is not reliable.
82

Independent variables selected at the end of the observation:
Shoulder Position 1) Most of the time 2) Some of the time 3) Rare or none of the time 4) Unable to determine
Shoulders flexed toward midline (either due to how the infant is able to position self, how infant is being held, or by a blanket swaddle)
Arm Position 1) Most of the time 2) Some of the time 3) Rare or none of the time 4) Unable to determine
Arms flexed toward midline (either due to how the infant is able to position self, how infant is being held, or by a blanket swaddle)
Containment (predominantly)
1) No blanket 2) Blanket supporting lower body 3) Blanket supporting arms in midline flexed position but shoulders extended 4) Blanket supporting arms and shoulders in midline flexed position
Trunk Position (predominantly)
1) Supine 2) Side-lying - full side-lying has ear, shoulder and hip toward ceiling 3) In-between supine and side-lying 4) Cradled – infant is held in the crook/elbow area of the mom’s arm 5) Unable to determine
Upright Versus Flat Trunk Position (predominantly)
1) Upright/inclined (approximately 90 degrees) 2) Semi-upright/inclined (approximately 45 degrees) 3) Completely or nearly flat 4) Unable to determine
Midline Alignment of Head and Neck (predominantly)
1) Most of the time
2) Some of the time
3) Rare or none of the time
4) Unable to determine
Chin and sternum in straight line/aligned; head and neck in midline alignment; head not tilted or rotated toward one of the shoulders
Anterior/Posterior Neck Alignment (predominantly)
1) Neutral neck - slight chin tuck; neck flexion, so that the chin is directed slightly downward and inward 2) Extension backward (sniffing position) 3) Flexion – moderate to excessive chin tuck 4) Unable to determine
83

84
APPENDIX 3.4: RESPIRATORY DATA MANAGEMENT PROTOCOL
This protocol was created by Dr. Jinhee Park and modified for the purposes of this study by Britt Pados. Definitions of Respiratory Variables
• Respiratory rate: Number of peaks per minute.
• Apnea: Pause in respiration lasting ≥ 3 seconds.
A. Converting Biolab file (.mw) to an AcqKnowledge file (.acq)
1. Open the file collected with the BioLab 3.1.0K. 2. In the configuration window, cancel the channels except for respiration by clicking ON/OFF button
on the left side of each channel. 3. Click VIEW and you can see the respiration channel only. 4. Click SAVE ALL TEXT to save the respiration channel as a text file. Save this with the same
name plus _resp (i.e., xxxxx_resp.txt). 5. Open the AcqKnowledge 4.2. 6. Click FILE > OPEN and select the text file you saved from the BioLab program 7. Put wave data start on the line (3), sample rate interval (1 millisecs), column delimiter (tab) when
the window pops up to ask these. *Make sure the line data start by opening the text file with word pad
8. Two channels will be opened: Channel 0 (Time) and Channel 1 (Respiration) 9. Save this waveform file as xxxxx_resp.acq
B. Mark the peaks on the respiratory waveform
1. File preparation a) Open the acqknowledge file (xxxxx_resp.acq) that converted from the BioLab. b) Take off the visibility of channel 0 on the screen by clicking channel icon with holding down
ALT key in the upper part of graph display. c) When you see only channel 1(Respiration), duplicate the respiration channel on channel 2 to
work on (EDIT<DUPLICATE WAVEFORM) d) Take off the visibility of original waveform and then you can only see the duplicated
respiration channel on the channel 2. e) Filter the waveform to adjust the file adequately to mark peaks and troughs
(TRANSFORM<DIGITAL FILTER<FIR<HIGH PASS) and fix the frequency cutoff at “0.5” Hz then click OK. Make sure if the frequency cutoff is too high, the peak will be flattened.
f) Smooth the waveform to remove noisy points on the waveform (TRANSFORM<SMOOTHING)

85
g) In the field for smoothing factor, put the number that multiply 0.1 by the sample rate of the waveform (i.e., sampling rate * 0.1=1000*0.1=100) and choose mean value and transform entire waveform.
h) Resample the waveform to appropriate rate for respiration. It would be recommended to use the number that multiply maximum signal of respiration of infant with CHD by 4 (i.e., 80 per minute * 4 = 320). So, resample to 500. (TRANSFORM<RESAMPLE WAVEFORM)
i) Duplicate channel 2 to now mark peaks in channel 3. Take off visibility of channel 2.
2. Mark the peaks
a. Run cycle detector (ANALYSIS<FIND CYCLE or Click on the toolbar). Set up the dialog box as the below. Make sure the cursor need to be at the beginning of the waveform before running cycle detector. Do not hit OK or Enter. Proceed to the Selection Tab.
Note.
You can move cursor or make selection on the waveform using I-beam tool on the toolbar.
You can autoscale the waveform vertically using on the toolbar.
You can autoscale the waveform vertically using on the toolbar.

86
b. Next, choose the selection tab and set it up as below.
c. Then, click “PREVIEW” to see if the peaks are captured adequately. Play with the data until a majority of peaks are captured by adjusting threshold.

87
d. When you are satisfied with the peaks captured, select the output tab and set it up as below.
e. Select “Find All Cycles.” Then, you can see the arrow marked on the waveform.

88
3. Clean Artifact: Clean artifacts by removing and adding marks manually.
a) To remove a mark, click event zap tool and put the cursor on the mark you want to remove and click. To add a mark, the first time you insert a mark, you need to move the cursor onto the waveform and right click. Go to Assign Current Event Type � Notes �
Medium Arrow. To insert a mark click
b) Rules for Marking Peaks on Respiratory Waveforms:
Definition of Peak = The point of maximum chest circumference, between inspiration and expiration.
i. Determine minimum voltage change of an adequate breath: Identify period of stable,
regular breathing within the baseline period prior to the feeding. The waveform should look similar to this:
ii. Calculate the mean voltage change associated with each breath. To calculate voltage
change, use the I-beam tool and select the area from the trough to the peak. Use the calculate features at the top to select channel 3, P-P (peak to peak) and the voltage change will appear in the box.
iii. Calculate the mean voltage from 5 regular breaths. Calculate 20% of this mean and this will be the minimum voltage change necessary for a peak to be considered an adequate breath. The breath must meet this minimum voltage change prior to and after the peak in order to be considered as having met an adequate respiratory cycle of inhalation and exhalation.
iv. Note these common variations in the respiratory waveform:

89
Gasp or big breaths: mark as a valid breath because it is also a respiratory effort to achieve oxygen.
Breaths with double peaks
If both peaks meet the minimum required voltage change prior to and after the peak, then mark both breaths. If not, mark only the highest peak. Below, the is an example on the left of a breath where there is not a complete exhale before the next inhale (the trough does not return all the way down to where the prior inhale started), but there was adequate voltage change before and after the peak to be considered a breath. On the right, this would be considered an interrupted exhale; there is not a significant voltage change associated with an inhale to be considered a breath.
Respiratory Pause

90
C. Create Excel File:
1. Next, click the event palette tool in the top right corner or go DISPLAY<SHOW<EVENT PALETTE. Set up the event palette as below. Next, select “Summarize in Journal…” and select “yes” when the program asks if you want to create a journal.
2. An Event Journal Summary box will pop up. Set it up as below and choose OK.

91
3. The Event Summary Journal will appear under the waveform. Click on the “Save” Icon.
4. Select the location you want to save the file to. Name the file (e.g., F1_B_resp_eventsummary) and save as type “Excel Spreadsheet.”
5. Copy all data from sheet 1 into sheet 2. Name sheet 2 “MW Time.”
6. In sheet 2, delete the first row that contains “Event Summary” and delete columns A (Index),
C (Type), D (Channel), and E (Label).
7. Rename what is now column A “Time” to “ACQ Time”. Name column B “ACQ Time Number Only” and “column C “MW Time.”
8. Copy the data from column A into column B.
9. Select the data in column B and click “Find & Select” � Replace � Find what: sec / Replace
with: (leave blank). Select “Replace All.”
10. Repeat this last step, but now Replace � Find what: min / Replace with: (leave blank). Select “Replace All.” Close this box.
11. In Column C (MW Time) create a formula so that the data in column C is equal to the data
from column B if the data was in seconds (refer to column A). Starting with the row of data that is in mins in column A, create a formula in column C = column B * 60. This will convert the minute data into seconds.
12. The database should now look like this in sheet 2:
13. Now, select the data segment(s) that you are interested in and copy to a new sheet. The analysis for baseline and recovery periods is slightly different than the feeding periods.

92
For feeding periods:
Name sheet 3 “Nipple Ins Cleaned.” In sheet 3, name column A “MW Time”, name column B “Peak Times” and name column C “Interval.” Copy the data from column A into column B so that column B “Count” contains each event’s MW Time. The data in column B will be used to calculate RR as the number of events per minute.
After the event times are copied to column B, then add to column A: 1) the MW time that corresponds to the either the start of baseline/recovery or the nipple-in time. 2) the MW time that corresponds to the end of the baseline/recovery period or the nipple-out time.
Create a formula in column C to calculate the interval between peaks. The interval data is not specific enough to report interval data, but will be used to identify pauses > 3 seconds.
For baseline & recovery periods:
Name sheet 3 to describe the data segment that is contained in the sheet (e.g., 510-870 Cleaned).
D. CLEAN DATA & CALCULATE RR & APNEAS
1. In sheet 3, select data in column C (Interval) � Conditional Formatting � Highlight Cells � Equal to � enter “0”
2. Delete the rows of data that accompany an interval of “0.” Your data is now clean.
a. For baseline and recovery periods, create columns for Epoch, MW Start Time, count,
MeanRR, MinRR, MaxRR, and apnea. The database should look like this:
b. For feeding periods, create columns for epoch, MW Time, duration, behavior, count, MeanRR, MinRR, MaxRR, and apnea. The database should look like this:

93
c. Set up formulas to calculate the variables: Count – use the “count” function and select an epoch of data (1 min for baseline, nipple-
in epoch for feeding, or 2 min for baseline)
MeanRR – divide the Count column by the Duration of the epoch (use the duration
column for feeding periods)
MinRR- calculate min value for the RR value of all feeding epochs.
MaxRR-calculate the max value for RR for all feeding epochs.
Apnea – identify the number of pauses > 3 seconds. For any apnea identified, review the
acq file to confirm.

APPENDIX 3.5: LINEAR MIXED MODELING ANALYSIS OF CHAPTER 3 DATA
Linear mixed modeling (LMM) was used to analyze these repeated-measures physiologic data. The variable name is denoted in square
brackets. The effects of flow (slow-flow vs. standard-flow) [FLOW] on the outcome measures described below were evaluated using appropriate
covariance structures to account for correlation within the same feeding [FDG] and within the same flow category [FLOW]. When appropriate,
baseline values were used as a covariate in the model.
For each dependent variable, a step-wise LMM analysis was done. The model tested, model problems, results, and AIC/BIC scores are
tabled below. Decisions about variables included in the random effects models and fixed effects models are also described within each table. The
results of the final model selected are presented and interpreted at the end of each table.
A. Mean Heart Rate During Feeding [MeanFHR]:
Model Model Problems Results AIC BIC
The purpose of this analysis was to evaluate whether there was a difference between slow-flow and standard-flow feedings for the outcome variable mean heart rate during feeding [MeanFHR], taking into account correlation within the same feeding [FDG] and within flow category [FLOW], as well as covarying on baseline heart rate [MeanBHR]. MeanFHR was calculated every 1 minute during feeding. MeanBHR was calculated as a single measure for the entire 6 minute baseline period.
The fixed effects model was determined first, starting with a full factorial model and then reducing in a step-wise fashion.
*Model A1;
proc mixed data=sv covtest method=ML;
class id flow fdg;
model meanFHR=flow|fdg/ solution;
random intercept fdg meanBHR / subject=id v=1 vcorr=1;
run;
Overparameterized
*Model A2;
proc mixed data=sv covtest method=ML;
class id flow fdg;
model meanFHR=flow fdg/ solution;
random intercept fdg meanBHR / subject=id v=1 vcorr=1;
Overparameterized
94

run;
*Model A3;
proc mixed data=sv covtest method=ML;
class id flow fdg;
model meanFHR=flow/ solution;
random intercept fdg meanBHR / subject=id v=1 vcorr=1;
run;
The model was able to estimate the fixed effect of flow, but was still overparameterized and not able to estimate covariance parameters.
The simple fixed effects model with flow is most appropriate. Next, the random effects model was simplified.
*Model A4; proc mixed data=sv covtest method=ML; class id flow fdg; model meanFHR=flow/ solution; random intercept fdg / subject=id v=1 vcorr=1;
run;
G matrix not positive definite.
FLOW p=0.8294 257.9 249.9
*Model A5; proc mixed data=sv covtest method=ML; class id flow fdg; model meanFHR=flow/ solution; random intercept meanBHR / subject=id v=1 vcorr=1;
run;
G matrix not positive definite.
FLOW p=0.0139 253.6 245.6
Model A5 with meanBHR as a covariate improved the AIC/BIC scores. Next, the random effects model with just intercept tested.
*Model A6; proc mixed data=sv covtest method=ML; class id flow fdg; model meanFHR=flow/ solution; random intercept / subject=id v=1 vcorr=1; run;
G matrix not positive definite.
FLOW p=0.8599 339.8 333.8
Model A5 continues to have better AIC/BIC scores. MeanBHR contributes significantly to the model. Next, the model was tested without the random intercept.
*Model A7; proc mixed data=sv covtest method=ML; class id flow fdg; model meanFHR=flow/ solution; random meanBHR / subject=id v=1 vcorr=1; run;
G matrix not positive definite.
FLOW p=0.8599 339.8 333.8
The most appropriate random effects model was with random intercept and meanBHR. Finally, the fixed effects model was retested with this
95
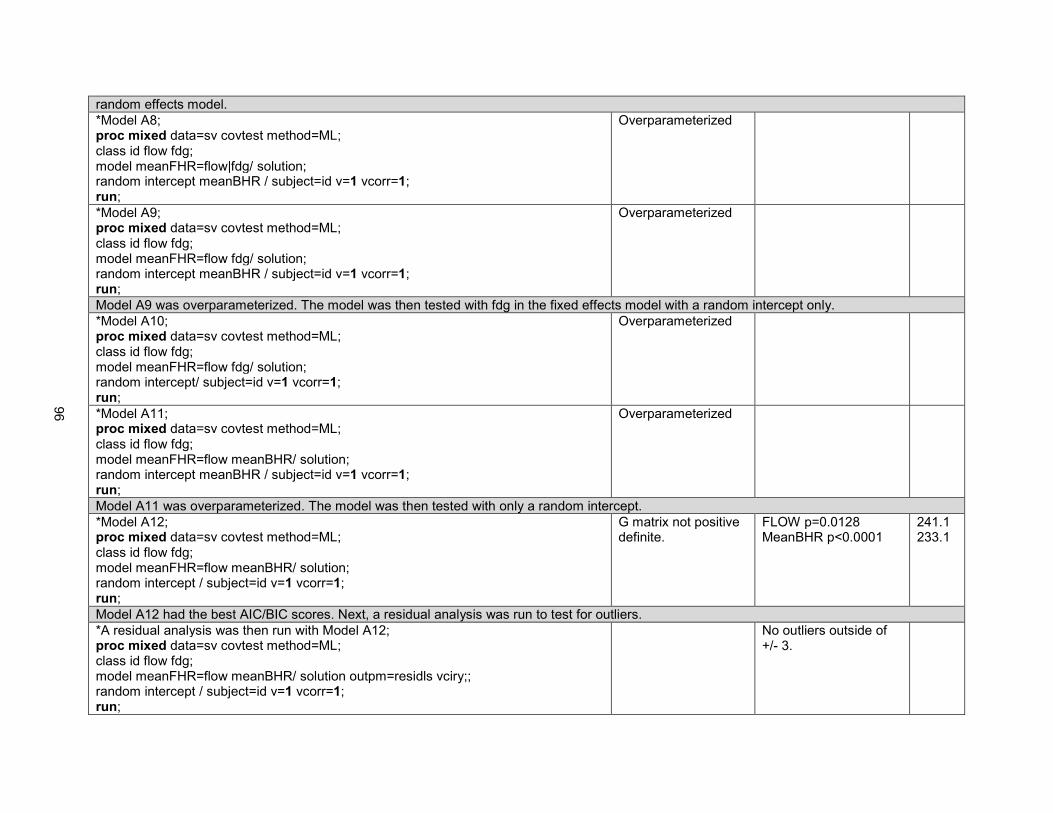
random effects model.
*Model A8; proc mixed data=sv covtest method=ML; class id flow fdg; model meanFHR=flow|fdg/ solution; random intercept meanBHR / subject=id v=1 vcorr=1; run;
Overparameterized
*Model A9; proc mixed data=sv covtest method=ML; class id flow fdg; model meanFHR=flow fdg/ solution; random intercept meanBHR / subject=id v=1 vcorr=1; run;
Overparameterized
Model A9 was overparameterized. The model was then tested with fdg in the fixed effects model with a random intercept only.
*Model A10; proc mixed data=sv covtest method=ML; class id flow fdg; model meanFHR=flow fdg/ solution; random intercept/ subject=id v=1 vcorr=1; run;
Overparameterized
*Model A11; proc mixed data=sv covtest method=ML; class id flow fdg; model meanFHR=flow meanBHR/ solution; random intercept meanBHR / subject=id v=1 vcorr=1; run;
Overparameterized
Model A11 was overparameterized. The model was then tested with only a random intercept.
*Model A12; proc mixed data=sv covtest method=ML; class id flow fdg; model meanFHR=flow meanBHR/ solution; random intercept / subject=id v=1 vcorr=1; run;
G matrix not positive definite.
FLOW p=0.0128 MeanBHR p<0.0001
241.1 233.1
Model A12 had the best AIC/BIC scores. Next, a residual analysis was run to test for outliers.
*A residual analysis was then run with Model A12; proc mixed data=sv covtest method=ML; class id flow fdg; model meanFHR=flow meanBHR/ solution outpm=residls vciry;; random intercept / subject=id v=1 vcorr=1; run;
No outliers outside of +/- 3.
96

data residls; set residls; label pred="Predicted Value" scaledresid="Scaled Residual"; format pred scaledresid 7.2; run;
The mean procedure was run to get group estimates for MeanFHR for the two flow groups.
FLOW=0
Analysis Variable : MeanFHR
N Mean Std Dev Minimum Maximum
36 166.1846942 8.5589935 151.6216490 178.4073630
FLOW=1
Analysis Variable : MeanFHR
N Mean Std Dev Minimum Maximum
13 166.6037602 1.9479823 164.1655760 169.6276220
Proc means was also used to estimate values per feeding.
FDG=1
Variable N Mean Std Dev Minimum Maximum
MeanFHR 21 172.9042224 2.7391000 168.9036340 178.4073630
97

MeanBHR
21
167.9021414
0
167.9021414
167.9021414
FDG=2
Variable N Mean Std Dev Minimum Maximum
MeanFHR
MeanBHR
13
13
166.6037602
156.6497913
1.9479823
0
164.1655760
156.6497913
169.6276220
156.6497913
FDG=4
Variable N Mean Std Dev Minimum Maximum
MeanFHR
MeanBHR
15
15
156.7773549
146.5621806
3.1425173
0
151.6216490
146.5621806
162.3923536
146.5621806
Interpretation of results: Taking into account correlation between measurements within the same feeding and within the same flow group
(slow or standard) and covarying on baseline heart rate, mean heart rate was significantly lower when the infant was fed with slow-flow than with
standard flow (p=0.01; 166.2 vs. 166.6).
B. Mean Oxygen Saturation During Feeding (MeanFSat):
Model Model Problems Results AIC BIC
The purpose of this analysis was to evaluate whether there was a difference between slow-flow and standard-flow feedings for the outcome variable mean oxygen saturation during feeding, taking into account correlation within the same feeding [FDG] and within flow category [FLOW], as well as covarying on baseline oxygen saturation [MeanBSat]. MeanFSat was calculated every 1 minute during feeding. MeanBSat was calculated as a single measure for the entire 6 minute baseline period.
Starting with a maximal fixed effects model, the random effects model was determined. First, a maximal random effects model was tested and then one variable was removed at a time.
*Model B1; proc mixed data=sv covtest method=ML; class id flow fdg; model meanFSat=flow fdg meanBSat / solution; random intercept flow fdg meanBSat / subject=id v=1 vcorr=1; run;
Overparameterized
98

*Model B2; proc mixed data=sv covtest method=ML; class id flow fdg; model meanFSat=flow fdg meanBSat / solution; random intercept flow fdg / subject=id v=1 vcorr=1; run;
Overparameterized
*Model B3; proc mixed data=sv covtest method=ML; class id flow fdg; model meanFSat=flow fdg meanBSat / solution; random intercept flow meanBSat / subject=id v=1 vcorr=1; run;
Overparameterized
*Model B4; proc mixed data=sv covtest method=ML; class id flow fdg; model meanFSat=flow fdg meanBSat / solution; random intercept fdg meanBSat / subject=id v=1 vcorr=1; run;
Overparameterized
*Model B5; proc mixed data=sv covtest method=ML; class id flow fdg; model meanFSat=flow fdg meanBSat / solution; random intercept flow/ subject=id v=1 vcorr=1; run;
Overparameterized
*Model B6; proc mixed data=sv covtest method=ML; class id flow fdg; model meanFSat=flow fdg meanBSat / solution; random intercept fdg / subject=id v=1 vcorr=1; run;
Overparameterized
*Model B7; proc mixed data=sv covtest method=ML; class id flow fdg; model meanFSat=flow fdg meanBSat / solution; random intercept meanBSat / subject=id v=1 vcorr=1; run;
Overparameterized
*Model B8; proc mixed data=sv covtest method=ML; class id flow fdg; model meanFSat=flow fdg meanBSat / solution;
Overparameterized
99

random intercept / subject=id v=1 vcorr=1; run;
All of the models tested thus far were overparameterized. Next, the fixed effects model was determined with only a random intercept.
*Model B9; proc mixed data=sv covtest method=ML; class id flow fdg; model meanFSat=flow fdg / solution; random intercept / subject=id v=1 vcorr=1; run;
Overparameterized
*Model B10; proc mixed data=sv covtest method=ML; class id flow fdg; model meanFSat=flow meanBSat / solution; random intercept / subject=id v=1 vcorr=1; run;
Estimated G matrix not positive definite.
FLOW p=0.0935 MeanBSat=0.0194
265.4 257.4
Model B10 is the only model thus far that has not been overparametized. Using this fixed effects model, variables were then added back into the random effects model.
*Model B11; proc mixed data=sv covtest method=ML; class id flow fdg; model meanFSat=flow meanBSat / solution; random intercept fdg / subject=id v=1 vcorr=1; run;
Estimated G matrix not positive definite.
FLOW p=0.0935 MeanBSat=0.0194
265.4 257.4
*Model B12; proc mixed data=sv covtest method=ML; class id flow fdg; model meanFSat=flow meanBSat / solution; random intercept meanBSat / subject=id v=1 vcorr=1; run;
Overparameterized
Model B10 and B11 had the same results and AIC/BIC scores, but B10 is more parsimonious, so this is the better model. B12 was overparameterized. A residual analysis was then run using model B10.
proc mixed data=sv covtest method=ML; class id flow fdg; model meanFSat=flow meanBSat / solution outpm=residls vciry; random intercept / subject=id v=1 vcorr=1; run; data residls;
Outliers outside of -3.
100

set residls; label pred="Predicted Value" scaledresid="Scaled Residual"; format pred scaledresid 7.2; run;
Since there were outliers outside of -3, a square root transformation was applied.
%let ypower=0.5; data adjusted; set sv; ytrans=meanFSat**&ypower; label ytrans="meanFSat to Power &ypower"; run; proc mixed data=adjusted covtest method=ML; class id flow fdg; model ytrans=flow meanBSat / solution outpm=residls vciry; random intercept / subject=id v=1 vcorr=1; run;
No longer ouliers. FLOW p=0.0976 MeanBSat p=0.0207
Proc means was used to estimate group values for meanFSat.
proc sort data=sv; by flow; Proc means data=sv; by flow; var meanFSat; run;
101

FLOW=0
Analysis Variable : MeanFSat
N Mean Std Dev Minimum Maximum
36 86.3247774 4.3283691 71.3568713 95.5532011
FLOW=1
Analysis Variable : MeanFSat
N Mean Std Dev Minimum Maximum
10 83.5143588 4.2417796 77.2311341 90.3147783
Proc means was also used to estimate values per feeding.
FDG=1
Variable N Mean Std Dev Minimum Maximum
MeanFSat
MeanBSat
21
21
87.6830048
83.8056300
3.9699620
0
77.4790997
83.8056300
95.5532011
83.8056300
FDG=2
Variable N Mean Std Dev Minimum Maximum
MeanFSat
MeanBSat
10
10
83.5143588
85.9930982
4.2417796
0
77.2311341
85.9930982
90.3147783
85.9930982
FDG=4
Variable N Mean Std Dev Minimum Maximum
MeanFSat
MeanBSat
15
15
84.4232591
84.3901546
4.2048298
0
71.3568713
84.3901546
88.8088242
84.3901546
Note. Do not use the min and max values from these results. Actual min and max values were calculated from the data that was analyzed at 1 sample/sec.
102

Interpretation of results: Taking into account correlation between measurements within the same feeding and within the same flow group
(slow or standard) and covarying on baseline oxygen saturation, there was a trend toward a difference in mean oxygen saturation between the
flow groups (p=0.0976; 86.3 vs. 83.5%).
C. Respiratory Rate (RR)
Model Model Problems Results AIC BIC
The purpose of this analysis was to evaluate whether there was a difference between slow-flow and standard-flow feedings for the outcome variable RR during feeding [MeanFRR], taking into account correlation within the same feeding [FDG] and within flow category [FLOW], as well as covarying on baseline RR [MeanBRR]. MeanFRR was calculated every 1 minute during feeding. MeanBRR was calculated as a single measure for the entire 6 minute baseline period.
Starting with a maximal fixed effects model, the random effects model was determined. First, a maximal random effects model was tested and then one variable was removed at a time.
*Model C1; proc mixed data=rr covtest method=ML; class id flow fdg; model meanFRR=flow fdg meanBRR/ solution; random intercept fdg meanBRR / subject=id v=1 vcorr=1; run;
Overparameterized
*Model C2; proc mixed data=rr covtest method=ML; class id flow fdg; model meanFRR=flow fdg meanBRR/ solution; random intercept fdg / subject=id v=1 vcorr=1; run;
Overparameterized
*Model C3; proc mixed data=rr covtest method=ML; class id flow fdg; model meanFRR=flow fdg meanBRR/ solution; random intercept meanBRR / subject=id v=1 vcorr=1; run;
Overparameterized
*Model C4; proc mixed data=rr covtest method=ML; class id flow fdg; model meanFRR=flow fdg meanBRR/ solution; random intercept / subject=id v=1 vcorr=1; run;
Overparameterized
103

All of the above models were overparameterized. Next, the fixed effects model was reduced one variable at a time.
*Model C5; proc mixed data=rr covtest method=ML; class id flow fdg; model meanFRR=flow fdg/ solution; random intercept / subject=id v=1 vcorr=1; run;
Overparameterized
*Model C6; proc mixed data=rr covtest method=ML; class id flow fdg; model meanFRR=flow meanBRR/ solution; random intercept / subject=id v=1 vcorr=1; run;
Estimated G matrix not positive definite.
Type 3 Tests of Fixed Effects
Effect Num DF
Den DF
F Value
Pr > F
FLOW 1 37 2.88 0.0979
MeanBRR 1 37 3.88 0.0565
305.5 297.6
Model C6 was the first model that was not overparameterized. Next, the model was tested without meanBRR in the fixed effects.
*Model C7; proc mixed data=rr covtest method=ML; class id flow fdg; model meanFRR=flow/ solution; random intercept / subject=id v=1 vcorr=1; run;
Estimated G matrix not positive definite.
Flow p=0.875 307.3 301.3
MeanBRR contributes significantly to the fixed effects model. Using the fixed effects model in model C6, the random effects model was then confirmed by adding the variables back in, one at a time.
*Model C8; proc mixed data=rr covtest method=ML; class id flow fdg; model meanFRR=flow meanBRR/ solution; random intercept fdg / subject=id v=1 vcorr=1; run;
Not able to estimate covariance parameters.
*Model C9; proc mixed data=rr covtest method=ML; class id flow fdg; model meanFRR=flow meanBRR/ solution; random intercept meanBRR / subject=id v=1 vcorr=1; run;
Overparameterized
The above models were not improved by adding variables back to the random effects model. Next, the random effects model was tested without intercept in the model.
*Model C10; proc mixed data=rr covtest method=ML;
Overparameterized
104

class id flow fdg; model meanFRR=flow meanBRR/ solution; random meanBRR / subject=id v=1 vcorr=1; run;
*Model C11; proc mixed data=rr covtest method=ML; class id flow fdg; model meanFRR=flow meanBRR/ solution; random fdg / subject=id v=1 vcorr=1; run;
Estimated G matrix not positive definite.
Type 3 Tests of Fixed Effects
Effect Num DF
Den DF
F Value
Pr > F
FLOW 1 37 2.88 0.0979
MeanBRR 1 37 3.88 0.0565
305.6 302.0
Model C11 had a better AIC score than model C6, but model C6 had a better BIC score.
*Model C11 with residual analysis; proc mixed data=rr covtest method=ML; class id flow fdg; model meanFRR=flow meanBRR/ solution outpm=residls vciry; random fdg / subject=id v=1 vcorr=1; run; data residls; set residls; label pred="Predicted Value" scaledresid="Scaled Residual"; format pred scaledresid 7.2; run;
Estimated G matrix not positive definite.
Type 3 Tests of Fixed Effects
Effect Num DF
Den DF
F Value
Pr > F
FLOW 1 37 2.88 0.0979
MeanBRR 1 37 3.88 0.0565
There are outliers outside of -3.
305.6 302.0
105

Since there were outliers, the data was transformed. First, a square root transformation was applied.
%let ypower=0.5; data adjusted; set rr; ytrans=meanFRR**&ypower; label ytrans="meanFRR to Power &ypower"; run; *Model C11 with square root transformation; proc mixed data=adjusted covtest method=ML; class id flow fdg; model ytrans=flow meanBRR/ solution outpm=residls vciry; random fdg / subject=id v=1 vcorr=1; run;
Estimated G matrix not positive definite.
Type 3 Tests of Fixed Effects
Effect Num DF
Den DF
F Value
Pr > F
FLOW 1 37 3.11 0.0861
MeanBRR 1 37 3.92 0.0551
106

This square root transformation improved the data, but there was still an outlier outside of -3. Next, a log transformation was applied.
*Log transformation; data adjusted; set rr; ytrans=log(meanFRR); label ytrans="MeanFRR to Log"; run; proc mixed data=adjusted covtest method=ML; class id flow fdg; model ytrans=flow meanBRR/ solution outpm=residls vciry; random fdg / subject=id v=1 vcorr=1; run;
107

Log transformation did not improve the data. Model D11 with square root transformation was used for the analysis. In this case, it does not make sense to remove outliers because the outliers are true data points and important for the analysis of these results. Proc means was used to estimate group values.
The MEANS Procedure FLOW=0
Analysis Variable : MeanFRR
N Mean Std Dev Minimum Maximum
28 72.0714286 11.8037300 31.0000000 87.0000000
FLOW=1
Analysis Variable : MeanFRR
N Mean Std Dev Minimum Maximum
12 71.5000000 7.4406745 62.0000000 83.0000000
Proc means was used to estimate values per feeding.
The MEANS Procedure FDG=1
Variable N Mean Std Dev Minimum Maximum
MeanFRR 14 68.3571429 14.8044024 31.0000000 82.0000000
108
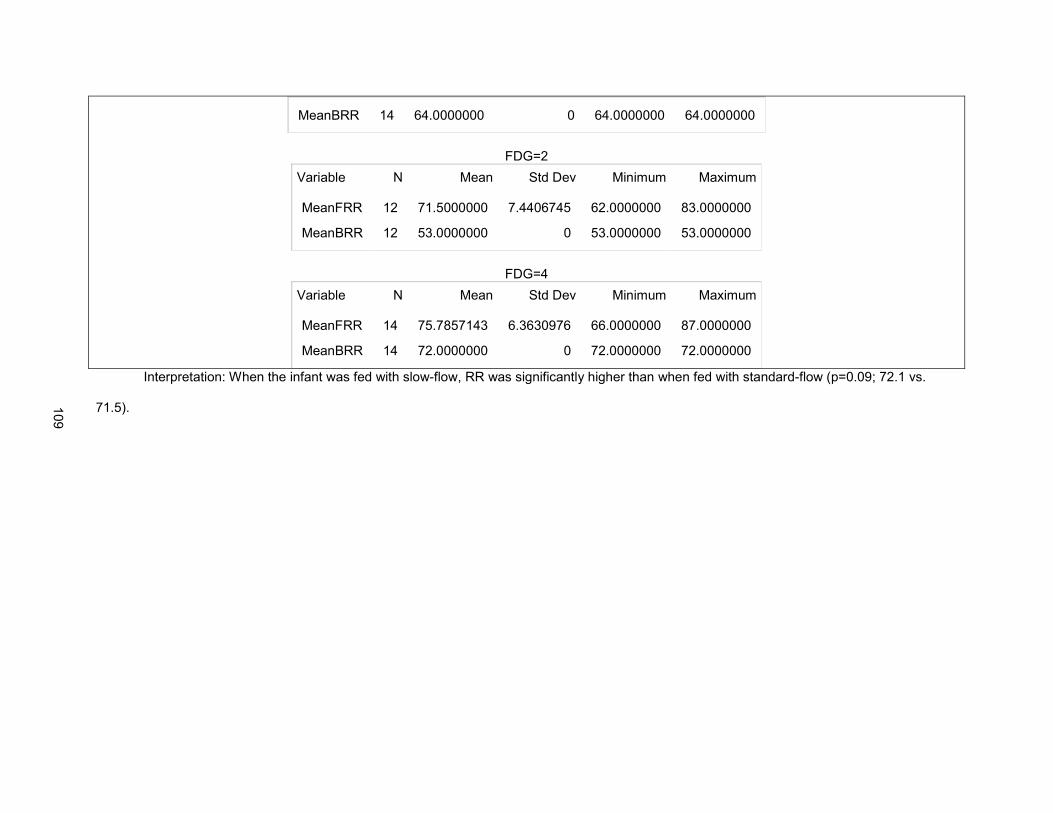
MeanBRR
14
64.0000000
0
64.0000000
64.0000000
FDG=2
Variable N Mean Std Dev Minimum Maximum
MeanFRR
MeanBRR
12
12
71.5000000
53.0000000
7.4406745
0
62.0000000
53.0000000
83.0000000
53.0000000
FDG=4
Variable N Mean Std Dev Minimum Maximum
MeanFRR
MeanBRR
14
14
75.7857143
72.0000000
6.3630976
0
66.0000000
72.0000000
87.0000000
72.0000000
Interpretation: When the infant was fed with slow-flow, RR was significantly higher than when fed with standard-flow (p=0.09; 72.1 vs.
71.5).
109

110
REFERENCES
Adams, F. H., Swan, H. J. C., & Hall, V. E. (1970). Pathophysiology of congenital heart disease: Proceedings of a conference held July, 1967. Berkeley, CA: University of California Press.
al-Sayed, L. E., Schrank, W. I., & Thach, B. T. (1994). Ventilatory sparing strategies and swallowing
pattern during bottle feeding in human infants. Journal of Applied Physiology, 77(1), 78-83. Retrieved from http://jap.physiology.org/
Bamford, O., Taciak, V., & Gewolb, I. H. (1992). The relationship between rhythmic swallowing and
breathing during suckle feeding in term neonates. Pediatric Research, 31(6), 619-624. doi: 10.1203/00006450-199206000-00016
Bardella, I. J. (1999). Pediatric advanced life support: A review of the AHA recommendations. American
Heart Association. American Family Physician, 60(6), 1743-1750. Retrieved from http://www.aafp.org
Barlow, D. H., & Hayes, S. C. (1979). Alternating treatments design: One strategy for comparing the
effects of two treatments in a single subject. Journal of Applied Behavioral Analysis, 12(2), 199-210. doi: 10.1901/jaba.1979.12-199
Barlow, S. M. (2009). Central pattern generation involved in oral and respiratory control for feeding in the
term infant. Current Opinions in Otolaryngology & Head and Neck Surgery, 17(3), 187-193. doi: 10.1097/MOO.0b013e32832b312a
Byars, K. C., Burklow, K. A., Ferguson, K., O'Flaherty, T., Santoro, K., & Kaul, A. (2003). A
multicomponent behavioral program for oral aversion in children dependent on gastrostomy feedings. Journal of Pediatric Gastroenterology and Nutrition, 37(4), 473-480. Retrieved from http://journals.lww.com/jpgn
Carpes, L. F., Kozak, F. K., Leblanc, J. G., Campbell, A. I., Human, D. G., Fandino, M., et al. (2011).
Assessment of vocal fold mobility before and after cardiothoracic surgery in children. Archives of Otolaryngology and Head & Neck Surgery, 137(6), 571-575. doi: 10.1001/archoto.2011.84
Chan, G. M., & Lechtenberg, E. (2007). The use of fat-free human milk in infants with chylous pleural
effusion. Journal of Perinatology, 27(7), 434-436. doi: 10.1038/sj.jp.7211768 Chen, C. H., Wang, T. M., Chang, H. M., & Chi, C. S. (2000). The effect of breast- and bottle-feeding on
oxygen saturation and body temperature in preterm infants. Journal of Human Lactation, 16(1), 21-27. doi: 10.1177/089033440001600105
Colley, J. R., & Creamer, B. (1958). Sucking and swallowing in infants. British Medical Journal, 2(5093),
422-423. Retrieved from www.bmj.com Davis, D., Davis, S., Cotman, K., Worley, S., Londrico, D., Kenny, D., et al. (2008). Feeding difficulties
and growth delay in children with hypoplastic left heart syndrome versus d-transposition of the great arteries. Pediatric Cardiology, 29(2), 328-333. doi: 10.1007/s00246-007-9027-9
Dawson, J. A., Myers, L. R., Moorhead, A., Jacobs, S. E., Ong, K., Salo, F., et al. (2013). A randomised trial of two techniques for bottle feeding preterm infants. Journal of Paediatrics and Child Health, 49(6), 462-466. doi: 10.1111/jpc.12208
Dodrill, P., McMahon, S., Ward, E., Weir, K., Donovan, T., & Riddle, B. (2004). Long-term oral sensitivity
and feeding skills of low-risk pre-term infants. Early Human Development, 76(1), 23-37. doi: 10.1016/j.earlhumdev.2003.10.001

111
Einarson, K. D., & Arthur, H. M. (2003). Predictors of oral feeding difficulty in cardiac surgical infants. Pediatric Nursing, 29(4), 315-319. Retrieved from: http://www.pediatricnursing.net
Feinstein, J. A., Benson, D. W., Dubin, A. M., Cohen, M. S., Maxey, D. M., Mahle, W. T., et al. (2012).
Hypoplastic left heart syndrome: Current considerations and expectations. Journal of the American College of Cardiology, 59(1 Suppl), S1-42. doi: 10.1016/j.jacc.2011.09.022
Gabrielli, A., Layon, A. J., Yu, M., Civetta, J. M., Taylor, R. W., & Kirby, R. R. (2009). Civetta, Taylor, &
Kirby's Critical Care (4th ed.). Philadelphia: Lippincott Williams & Wilkins. Goldfield, E. C., Smith, V., Buonomo, C., Perez, J., & Larson, K. (2013). Preterm infant swallowing of thin
and nectar-thick liquids: Changes in lingual-palatal coordination and relation to bolus transit. Dysphagia, 28(2), 234-244. doi: 10.1007/s00455-012-9440-y
Grossfeld, P. (2007). Hypoplastic left heart syndrome: New insights. Circulation Research, 100(9), 1246-
1248. doi: 10.1161/01.RES.0000268192.20525.c2 Gupta, S., & Sinha, S.K. (2014). Shock and hypotension in the newborn. Retrieved October 25, 2014,
from http://emedicine.medscape.com/article/979128-overview Hill, G. D., Silverman, A. H., Noel, R. J., Simpson, P. M., Slicker, J., Scott, A. E., et al. (2014). Feeding
dysfunction in children with single ventricle following staged palliation. Journal of Pediatrics, 164(2), 243-246 e241. doi: 10.1016/j.jpeds.2013.09.030
Hoffman, J. I., & Kaplan, S. (2002). The incidence of congenital heart disease. Journal of the American
College of Cardiology, 39(12), 1890-1900. doi: 10.1016/S0735-1097(02)01886-7 Hyman, P. E. (1994). Gastroesophageal reflux: One reason why baby won't eat. Journal of Pediatrics,
125(6 Pt 2), S103-109. doi: 10.1016/S0022-3476(05)82933-6 Ip, S., Chung, M., Raman, G., Chew, P., Magula, N., DeVine, D., et al. (2007). Breastfeeding and
maternal and infant health outcomes in developed countries. Evidence Report-Technology Assessment (153), 1-186. Retrieved from http://aapgrandrounds.aappublications.org/content/18/2/15
Jadcherla, S. R., Vijayapal, A. S., & Leuthner, S. (2009). Feeding abilities in neonates with congenital
heart disease: A retrospective study. Journal of Perinatology, 29(2), 112-118. doi: 10.1038/jp.2008.136
Jadcherla, S. R., Wang, M., Vijayapal, A. S., & Leuthner, S. R. (2010). Impact of prematurity and co-
morbidities on feeding milestones in neonates: A retrospective study. Journal of Perinatology, 30(3), 201-208. doi: 10.1038/jp.2009.149
Kao, H. M., Lin, C. H., & Chang, Y. J. (2010). Feeding with cross-cut teats has better sucking effects and
oxygenation in preterm infants with chronic lung disease. Journal of Clinical Nursing, 19(21-22), 3016-3022. doi: 10.1111/j.1365-2702.2010.03290.x
Kratochwill, T. R., Hitchcock, J., Horner, R.H., Levin, J.R., Odom, S.L., Rindskopf, D.M., & Shadish, W.R.
(2010). Single-case design technical documentation. Retrieved from What Works Clearinghouse website: http://ies.ed.gov/ncee/wwc/pdf/wwc_scd.pdf.
Kratochwill, T. R., & Levin, J. R. (2010). Enhancing the scientific credibility of single-case intervention
research: Randomization to the rescue. Psychological Methods, 15(2), 124-144. doi: 10.1037/a0017736

112
Lander, J. (1998). Within-subjects designs. In P. J. Brink & M. J. Wood (Eds.), Advanced design in nursing research (2nd ed.). Thousand Oaks, CA: Sage Publications.
Lau, C., & Schanler, R. J. (2000). Oral feeding in premature infants: Advantage of a self-paced milk flow.
Acta Paediatrica, 89(4), 453-459. doi: 10.1080/080352500750028186. Marino, B. L., O'Brien, P., & LoRe, H. (1995). Oxygen saturations during breast and bottle feedings in
infants with congenital heart disease. Journal of Pediatric Nursing, 10(6), 360-364. doi: 10.1016/S0882-5963(05)80033-8
Masimo. (2012). Radical-7. Retrieved January 12, 2012, from http://www.masimo.com/pdf/radical-
7/LAB4540E_radical-7_brochure.pdf Mathew, O. P. (1988). Nipple units for newborn infants: A functional comparison. Pediatrics, 81(5), 688-
691. Retrieved from http://pediatrics.aappublications.org/ Mathew, O. P. (1991a). Breathing patterns of preterm infants during bottle feeding: Role of milk flow.
Journal of Pediatrics, 119(6), 960-965. doi: 10.1016/S0022-3476(05)83056-2 Mathew, O. P. (1991b). Science of bottle feeding. Journal of Pediatrics, 119(4), 511-519. doi:
10.1016/S0022-3476(05)82397-2 Mathew, O. P., Belan, M., & Thoppil, C. K. (1992). Sucking patterns of neonates during bottle feeding:
Comparison of different nipple units. American Journal of Perinatology, 9(4), 265-269. doi: 10.1055/s-2007-994786
Maurer, I., Latal, B., Geissmann, H., Knirsch, W., Bauersfeld, U., & Balmer, C. (2011). Prevalence and
predictors of later feeding disorders in children who underwent neonatal cardiac surgery for congenital heart disease. Cardiology in the Young, 21(3), 303-309. doi: 10.1017/S1047951110001976
McLellan, M. C., & Connor, J. A. (2013). The Cardiac Children's Hospital Early Warning Score (C-
CHEWS). Journal of Pediatric Nursing, 28, 171-178. doi: 10.1016/j.pedn.2012.07.009 Medoff-Cooper, B., Naim, M., Torowicz, D., & Mott, A. (2010). Feeding, growth, and nutrition in children
with congenitally malformed hearts. Cardiology in the Young, 20 Suppl 3, 149-153. doi: 10.1017/S1047951110001228
Meier, P. (1988). Bottle- and breast-feeding: Effects on transcutaneous oxygen pressure and temperature
in preterm infants. Nursing Research, 37(1), 36-41. Retrieved from http://journals.lww.com/nursingresearchonline/pages/default.aspx
Meier, P., Lysakowski, T. Y., Engstrom, J. L., Kavanaugh, K. L., & Mangurten, H. H. (1990). The accuracy
of test weighing for preterm infants. Journal of Pediatric Gastroenterology & Nutrition, 10(1), 62-65. Retrieved from http://journals.lww.com/jpgn
Morris, S. E., & Klein, M. D. (2000). Pre-Feeding Skills (2nd ed.). Edmonton, Canada: Therapy Skill
Builders. Nixon, G. M., Charbonneau, I., Kermack, A. S., Brouillette, R. T., & McFarland, D. H. (2008). Respiratory-
swallowing interactions during sleep in premature infants at term. Respiratory Physiology & Neurobiology, 160(1), 76-82. doi: 10.1016/j.resp.2007.08.010
Pados, B. F., Park, J., Thoyre, S.M., Estrem, H., and Nix, W.B. (2014). Milk flow rates from bottle nipples
used for feeding hospitalized infants. Manuscript in preparation.

113
Park, J., Thoyre, S., Knafl, G. J., Hodges, E. A., & Nix, W. B. (2014). Efficacy of semielevated side-lying positioning during bottle-feeding of very preterm infants: A pilot study. Journal of Perinatal & Neonatal Nursing, 28(1), 69-79. doi: 10.1097/JPN.0000000000000004
Park, M. (2010). The Pediatric Cardiology Handbook. Philadelphia: Mosby. Pearl, J. M., Nelson, D. P., Schwartz, S. M., & Manning, P. B. (2002). First-stage palliation for hypoplastic
left heart syndrome in the twenty-first century. Annals of Thoracic Surgery, 73(1), 331-339; discussion 339-340. doi: 10.1016/S0003-4975(01)02720-5
Photiadis, J., Sinzobahamvya, N., Fink, C., Schneider, M., Schindler, E., Brecher, A. M., et al. (2006).
Optimal pulmonary to systemic blood flow ratio for best hemodynamic status and outcome early after Norwood operation. European Journal of Cardiothoracic Surgery, 29(4), 551-556. doi: 10.1016/j.ejcts.2005.12.043
Porges, S. W. (1995). Orienting in a defensive world: Mammalian modifications of our evolutionary
heritage. A polyvagal theory. Psychophysiology, 32(4), 301-318. Retrieved from http://www.blackwellpublishing.com/journal.asp?ref=0048-5772.
Porges, S. W. (2001). The polyvagal theory: Phylogenetic substrates of a social nervous system.
International Journal of Psychophysiology, 42(2), 123-146. doi: S0167-8760(01)00162-3 Porges, S. W. (2003). The polyvagal theory: Phylogenetic contributions to social behavior. Physiology &
Behavior, 79(3), 503-513. doi: S0031938403001562 Porges, S. W. (2007). The polyvagal perspective. Biological Psychology, 74(2), 116-143. doi:
10.1016/j.biopsycho.2006.06.009 Reller, M. D., Strickland, M. J., Riehle-Colarusso, T., Mahle, W. T., & Correa, A. (2008). Prevalence of
congenital heart defects in metropolitan Atlanta, 1998-2005. Journal of Pediatrics, 153(6), 807-813. doi: 10.1016/j.jpeds.2008.05.059
Sachdeva, R., Hussain, E., Moss, M. M., Schmitz, M. L., Ray, R. M., Imamura, M., et al. (2007). Vocal
cord dysfunction and feeding difficulties after pediatric cardiovascular surgery. Journal of Pediatrics, 151(3), 312-315, 315 e311-312. doi: 10.1016/j.jpeds.2007.03.014
Schrank, W., Al-Sayed, L. E., Beahm, P. H., & Thach, B. T. (1998). Feeding responses to free-flow
formula in term and preterm infants. Journal of Pediatrics, 132(3 Pt 1), 426-430. doi: 10.1016/S0022-3476(98)70014-9
Skinner, M. L., Halstead, L. A., Rubinstein, C. S., Atz, A. M., Andrews, D., & Bradley, S. M. (2005).
Laryngopharyngeal dysfunction after the Norwood procedure. Journal of Thoracic and Cardiovascular Surgery, 130(5), 1293-1301. doi: 10.1016/j.jtcvs.2005.07.013
Svavarsdottir, E. K., & McCubbin, M. (1996). Parenthood transition for parents of an infant diagnosed with
a congenital heart condition. Journal of Pediatric Nursing, 11(4), 207-216. Retrieved from http://www.pediatricnursing.org/
Tervo, R. C., Estrem, T. L., Bryson-Brockmann, W., & Symons, F. J. (2003). Single-case experimental
designs: Applications in developmental-behavioral pediatrics. Journal of Developmental and Behavioral Pediatrics, 24(6), 438-448. Retrieved from http://journals.lww.com/jrnldbp
Thoyre, S. M., Holditch-Davis, D., Schwartz, T. A., Melendez Roman, C. R., & Nix, W. (2012).
Coregulated approach to feeding preterm infants with lung disease: Effects during feeding. Nursing Research, 61(4), 242-251. doi: 10.1097/NNR.0b013e31824b02ad

114
Tweddell, J. S., Hoffman, G. M., Fedderly, R. T., Ghanayem, N. S., Kampine, J. M., Berger, S., et al. (2000). Patients at risk for low systemic oxygen delivery after the Norwood procedure. Annals of Thoracic Surgery, 69(6), 1893-1899. doi: 10.1016/S0003-4975(00)01349-7

115
CHAPTER 4: HEART RATE VARIABILITY AS A FEEDING INTERVENTION OUTCOME MEASURE IN THE PRETERM INFANT
Overview
Feeding interventions for preterm infants aim to reduce the stress of feeding to promote growth.
One challenge to evaluating efficacy of feeding interventions is identifying non-invasive, sensitive
outcome measures. Heart rate variability (HRV) is a potential measure of stress that may be useful. This
study tested whether HRV was a sensitive measure of stress when usual care was compared to a gentle,
co-regulated approach (CoReg) to feeding preterm infants (n=14) born < 35 weeks post-menstrual age
using a secondary analysis of data from a within-subjects cross-over design study. HRV indices were
calculated from electrocardiogram data and compared to standard physiologic outcomes, including
oxygen saturation (Sp02), respiratory rate (RR), apneic events, heart rate (HR), and seconds of
bradycardia. Data were analyzed using linear mixed modeling. Infants were positioned side-lying more
(p<0.01) and stimulated to suck less (p=0.03) during CoReg feedings. Infants fed using the CoReg
approach had fewer apneic events (p=0.04) and higher RR (p=0.03), suggesting they were able to
breathe more during feeding. No statistically significant differences were found in Sp02, HR, bradycardia,
LF Power, HF Power, or LF/HF ratio, but infants fed using the usual care approach had significantly
higher SD12 (p=0.04), a non-linear measure of HRV based on the Poincaré plot. Higher SD12 in infants
fed with usual care suggests increased randomness in HR of non-respiratory origin. Further exploration of
HRV as an intervention outcome measure is needed, particularly evaluating non-linear indices such as
SD12.
Keywords: feeding, preterm infant, heart rate variability, stress

116
Introduction
Feeding is a physiologically challenging event for the preterm infant. Much research is being done
to evaluate interventions aimed at reducing the work of feeding for these fragile infants in order to
conserve energy for growth and prevent the development of long-term feeding problems. The typical
physiologic measures used to study the effect of interventions in this population are heart rate (HR),
respiratory rate (RR), and oxygen saturation (Sp02). These measures are non-invasive and provide
important information about the infant’s physiologic response to the work of feeding. While these
measures are generally accepted, they may not be the most sensitive measures, or alterations in their
values may be late indicators of distress. Heart rate variability (HRV) is an additional non-invasive
measure that can be used to evaluate the adaptability of the autonomic nervous system (ANS) to respond
to the physiologic stress of feeding. Feeding has been shown to produce changes in HRV (Brown, 2007;
McCain, Fuller, & Gartside, 2005; McCain, Knupp, Fontaine, Pino, & Vasquez, 2010). It is theorized that
HRV may be a more sensitive measure of physiologic stress or provide important information about infant
response to feeding in addition to these traditional measures. It remains unknown whether HRV is a
useful outcome measure of physiologic stress in intervention studies where the intervention aims to
change the level of stress experienced by the infant.
Heart Rate Variability
HRV is the rhythmic variation in HR that results from the dynamic influences of the ANS (Kleiger,
Stein, & Bigger, 2005). Contraction of the heart is initiated by an electrical impulse in the sinoatrial (SA)
node located in the right atrium (Powers & Howley, 2009). The SA node is innervated by both the
sympathetic and parasympathetic divisions of the ANS via the vagus nerve (Pumprla, Howorka, Groves,
Chester, & Nolan, 2002). The sympathetic and parasympathetic divisions have opposing effects on the
HR. Sympathetic input results in release of noradrenaline, which increases HR, while parasympathetic
input results in release of acetylcholine, which slows HR (Pumprla, et al., 2002). The balance of
sympathetic and parasympathetic input is determined by the ANS to maintain physiologic homeostasis in
response to internal and external demands (Pumprla, et al., 2002).
The variation that occurs in HR to produce HRV results from the balance of sympathetic and
parasympathetic input and is measured by variations in the time period between normal heartbeat

117
complexes, specifically R waves (Kleiger, et al., 2005). The variation in intervals between R waves (R to
R interval (rri)) has a cyclical pattern with some cyclical changes occurring infrequently or at low
frequencies (LF) and some occurring frequently or at high frequencies (HF).
Since there are connections within the vagus nerve between the heart and other physiologic
systems, input from the sympathetic nervous system (SNS) and parasympathetic nervous system (PNS)
is mediated by other cyclical rhythms in the body. Fluctuations in blood pressure and thermoregulation
contribute to LF rhythms in HRV (Pumprla, et al., 2002). Rhythmic alterations in HR that coincide with
respiration contribute to HF rhythms in HRV (Pumprla, et al., 2002). It is generally accepted that HF
components of HRV may be interpreted as a measure of PNS influences, but the interpretation of the LF
component remains controversial (Malik, et al., 1996). While some interpret the LF component as
reflecting SNS input, others believe that it reflects some combination of SNS and PNS input (Malik, et al.,
1996).
The HF rhythm associated with respiration, whereby the HR accelerates during inspiration and
decelerates during expiration, is often referred to as respiratory sinus arrhythmia (RSA) (Grossman &
Taylor, 2007). The frequency range of HRV that RSA occupies is dependent on the RR of the individual.
In human neonates, the RR ranges generally from 20 to 80 breaths per minute. Frequency is measured in
Hertz (Hz). One Hz is equal to 60 cycles per second. Therefore, a RR of 20 to 80 breaths per minute is
equal to a frequency range of 0.3-1.33 Hz (DiPietro & Porges, 1991).
There are three methods of HRV analysis: time domain, frequency domain, and non-linear
analyses. Time domain methods are preferred for long-term studies of HRV (e.g., 24 hours) while
frequency domain methods are preferred for short-term evaluation of HRV (e.g., less than 5 minutes)
(Malik, et al., 1996). The frequency domain measures of HRV include LF Power (milliseconds squared
(ms2)), HF Power (ms2), and LF/HF ratio. While the interpretation of the LF component remains under
debate, a consensus statement suggests it is worth measuring, but must be done in accordance with
standards that limit the lowest frequency measured by the length of the recording (Malik, et al., 1996). For
recordings of two minutes, the lowest appropriate LF band is 0.04 Hz and the upper bound is the lower
bound of the HF band or 0.3 Hz (Malik, et al., 1996). The LF/HF ratio is a measure of the balance of SNS
to PNS (or some combination of SNS and PNS) activity and the ability of the infant to maintain

118
physiologic stability (McCain, et al., 2010). When evaluating HRV indices, it is necessary to compare
epochs of the same length because epoch length affects the accuracy with which the frequency
components are estimated (Malik, et al., 1996).
Non-linear analysis of HRV is a relatively new technique, which is in the early stages of
development, but may contribute to the interpretation of frequency and time domain analysis by
distinguishing between sinus arrhythmia of respiratory and non-respiratory origin (Stein, Domitrovich, Hui,
Rautaharju, & Gottdiener, 2005). One method of non-linear analysis is the creation of a Poincaré plot
(Figure 4.1), where the interval between a pair of heart beats (e.g., R wave 1 and R wave 2) is plotted
against the interval between the next two heart beats (e.g., R wave 2 and R wave 3), such that the x,y
coordinates are rri, rri+1 (Stein & Reddy, 2005). Poincaré plots may be qualitatively analyzed for the shape
and dispersion of the intervals or quantitatively analyzed for the degree of randomness in the heart rate
pattern (Stein & Reddy, 2005). Quantitatively, the index SD12 provides information about the shape of the
Poincaré plot by giving the ratio of the length of the transverse axis (SD1) and longitudinal axis (SD2) of
the ellipse (Stein & Reddy, 2005). SD1 is an indicator of short-term variability of the HR and SD2 is an
indicator of intermediate-term variability of the HR (Stein & Reddy, 2005). Low SD12 indicates high
correlation between interbeat intervals while high SD12 indicates low correlation or increased
randomness in interbeat intervals (Figure 4.2). SD12 has been found to be the strongest non-linear
predictor of mortality in patients with cardiovascular disease by identifying patients with increased
randomness in the heart rate from non-respiratory sinus arrhythmia (high SD12) (Stein & Reddy, 2005).
Theoretical Framework
Polyvagal Theory (Porges, 1995) was used in this study to conceptualize the infant response to
the challenge of feeding and aid in the selection of outcome measures. Polyvagal Theory (Porges, 1995)
describes the mammalian physiologic response to varying levels of stress as a function of the two
pathways of the vagus nerve: the myelinated nucleus ambiguous (NA) and the unmyelinated dorsal motor
nucleus (DMNX). Polyvagal Theory suggests that during times of low stress, there is primarily input from
the highly-evolved NA, which results in conservation of metabolic resources for growth and restoration, as
evidenced by low HR and high HF HRV. Additionally, increased vagal tone via the NA results in increased
tone of the muscles of the head and face for social interaction and for coordination of sucking,
119
swallowing, and breathing during feeding (Porges, 2007). At the same time, minimal input from the DMNX
during times of low stress encourages digestion and absorption of nutrients from the gastrointestinal (GI)
tract (Porges, 2001).
During times of increased stress, there is upregulation first of the SNS, which responds by
increasing HR, decreasing HF HRV, activating the stress response system of the hypothalamic pituitary
axis (e.g., release of cortisol), stimulating the immune system (e.g., release of cytokines), and diverting
blood away from the GI tract to the more vital organs such as the heart, brain, and lungs (Porges, 1992,
2009). If these responses still do not meet the demands of the situation, the secondary response system
controlled by the DMNX is activated to conserve resources resulting in disengagement, hypotonia, apnea,
and bradycardia (Porges, 2003). Given the high oxygen needs of humans, the apnea and bradycardia
associated with activation of the DMNX response can lead to detrimental oxygen deprivation (Porges,
2007).
Although feeding is inherently a physiologically challenging event, the feeding encounter may be
altered to either increase or decrease the degree of stress the infant experiences. A feeding with lower
stress would theoretically support input from the NA and result in lower HR, higher HF HRV, and
improved coordination of sucking, swallowing, and breathing. Improved coordination of sucking,
swallowing, and breathing may allow the infant to maintain Sp02 and RR closer to that during non-feeding
times. Alternately, a feeding with a higher degree of stress would require activation of the stress response
systems and result in higher HR, lower HF HRV, release of cortisol and cytokines, disengagement,
hypotonia, apnea, and bradycardia.
State of the Literature
Nine published studies have measured HRV during active oral feeding of infants (Brown, 2007;
Cohen, Brown, & Myers, 2009; Harrison, 2011; Harrison & Brown, 2012; Lappi, et al., 2007; McCain, et
al., 2005; McCain, et al., 2010; Portales, et al., 1997; Suess, et al., 2000). The majority of these have
been descriptive studies of the changes that occur in HRV measures as infants develop over time
(Brown, 2007; Harrison, 2011; Harrison & Brown, 2012; Lappi, et al., 2007) or how birth characteristics,
such as birth weight, gestational age, or congenital heart disease, affect HRV responses to feeding
(Cohen, et al., 2009; Harrison, 2011; Harrison & Brown, 2012; Suess, et al., 2000). Consistent with

120
Polyvagal Theory, Portales and colleagues (1997) found that vagal tone decreased from baseline to
feeding and returned towards baseline during the post-feeding period in very low birth weight infants.
McCain (2010) described the HRV responses of three preterm infants with bronchopulmonary dysplasia
to oral feeding and also found that HF HRV decreased during feeding, but in this sample, HF HRV did not
recover to pre-feeding levels by 10 minutes post-feeding. Suess and colleagues (2000) also found that
HF HRV decreased during feeding for both a group of earlier-born (≤ 30 weeks gestational age) and a
group of later-born (≥31 weeks gestational age) preterm infants, but that in the 10 minutes after feeding,
only the later-born preterm infants began to return to pre-feeding levels. Lappi (2007) examined the
effects of nutritive versus non-nutritive sucking on HRV measures and found that nutritive sucking
resulted in a decrease in HRV at all ages studied (newborn, 6, 12, and 24 weeks of age) while non-
nutritive sucking did not have any effect on HRV at any age.
The only feeding intervention study that measured HRV as an outcome was McCain’s study
(2005) of a semi-demand protocol for healthy preterm infants, which included a protocol that used infant
cues to discontinue feeding and did not “encourage” the infant to consume the prescribed volume of
feeing. Theoretically, this protocol could decrease the amount of physiologic stress experienced by the
infant by not pushing the infant to continue feeding beyond the point they become fatigued or stressed.
This study found that during feeding, the experimental group had higher HF power and lower LF/HF ratio,
suggesting greater PNS input and lower physiologic stress (McCain, et al., 2005). The two groups were
similar in terms of mean HR and feeding bradycardia episodes, suggesting that these outcome measures
may be less sensitive than HRV (McCain, et al., 2005). McCain (2002) previously presented behavioral
state outcomes of this same data set and found that infants fed with the semi-demand approach did not
exhibit significantly different behavioral states during feeding than control infants. No other measures of
physiologic stress have been published from this study to determine whether the experimental protocol
should be considered as having decreased physiologic stress with regards to the interpretation of HRV
findings, but the findings are supportive of further exploration of the use of HRV in this way.
Different methods of feeding (breast vs. bottle) or other differences in feeding (e.g., milk flow,
position, etc.) may affect the physiologic stress of feeding (Chen, Wang, Chang, & Chi, 2000; Clark, 2007;
DiPietro, Larson, & Porges, 1987; Mathew, 1991; Park, Thoyre, Knafl, Hodges, & Nix, 2014) and

121
therefore HRV measures. Additionally, Harrison (2011) found that in a group of infants with transposition
of the great arteries, factors such as feeding skill and maternal sensitivity may affect the degree of
autonomic responsiveness to feeding. Infants with low feeding skill, but high maternal sensitivity
demonstrated increases in HF HRV over the course of feeding, suggesting that maternal sensitivity may
aid in the infant maintaining homeostasis despite their low skill level (Harrison, 2011). In all studies except
those by McCain and colleagues (2005; 2010), feeding was studied as a naturally occurring phenomenon
and the feeding experience was not controlled. Although Harrison (2012) did not control the feeding
experience, she did monitor it and reported that variations in position and sleep states were similar
between groups. McCain and colleagues (2005; 2010) did standardize the study feedings with regards to
bottles used, milk flow, and body positioning.
The research done to date utilizing HRV during feeding has been supportive of the theoretical
changes that occur within the ANS during a physiologically-stressful challenge such as oral feeding and
supports the use of this measure during feeding. Only McCain’s (2005) study has used HRV as a
measure to evaluate differences between feedings where an intervention was used to decrease the
degree of stress encountered by the infant. The purpose of this study was to test whether HRV is a
sensitive measure of physiologic stress when standard care feeding is compared to a gentle, co-regulated
approach to feeding preterm infants.
Methods
Setting and Sample
This secondary analysis of de-identified data was deemed exempt by the Institutional Review
Board. The setting of the original data collection was a Level III Neonatal Intensive Care Unit in North
Carolina.
The original sample was 20 preterm infants who were born at less than 35 weeks gestation
weighing less than 1500 grams and were less than or equal to 37 weeks post-menstrual age (PMA) at the
time of the study, remained hospitalized, and had been orally feeding at least once per day for 3
consecutive days (Thoyre, Holditch-Davis, Schwartz, Melendez Roman, & Nix, 2012). Infants may have
been receiving supplemental oxygen. Infants were excluded from the study if they had a history of Grade
IV intraventricular hemorrhage (IVH), congenital disorders that may have interfered with sucking (e.g.,

122
cleft palate, Down Syndrome, congenital hydrocephalus, or microcephaly), symptoms from substance
exposure, or a mother less than 15 years of age. Infant feeding data were excluded from this secondary
analysis if active feeding episodes with the bottle in the infant’s mouth were ≤ 2 minutes or if the HR data
were of poor quality and not analyzable for HRV.
Procedure
The data collection procedures that are described refer to the procedures carried out in the
original study (Thoyre, et al., 2012). The methods of HRV analysis described refer to the procedures
carried out in this secondary analysis. The original study was a within-subjects, cross-over design study of
a gentle, co-regulated approach to feeding preterm infants. The intervention (CoReg) included a head
elevated, side-lying position; minimal oral and tactile stimulation; and enhanced auditory assessment of
sucking, swallowing, and breathing with the use of a microphone placed on the infant’s neck to allow for
feeder co-regulation of swallowing and breathing. The CoReg approach was compared to usual care
feeding by a bedside nurse who was unaware of the intervention protocol. Infants were studied during two
feedings per day for two days (one CoReg and one usual care feeding each day) and the order of the
conditions was randomized without replacement.
Feedings were video recorded and The Observer XT (Noldus Information Technology, Asheville,
NC) was used to code the videos for the following feeder actions: positioning of the infant (side-lying or
other), number of times the feeder stimulated the infant to suck, number of times the feeder gave the
infant a pause by tipping the bottle back or stopping milk flow, and number of times the feeder gave the
infant a rest period by removing the nipple. Positioning of the infant was calculated as the percent of the
feeding the infant was in side-lying. A co-regulation score was created and defined as the number of
times the feeder provided a rest period for the infant plus the number of times the feeder cued the infant
to pause feeding by tipping the bottle back or stopping milk flow. To account for differences in the length
of feedings, frequency of feeder action events were divided by the number of minutes the bottle was in
the infant’s mouth. The observational data was used to evaluate fidelity to the CoReg protocol and to
describe the feeding method used during usual care.
In order to compare HRV outcomes to traditional physiologic outcomes used in evaluating feeding
interventions, the following measures were assessed during feeding: mean Sp02, mean RR, number of

123
apneic events, HR, and number of seconds of bradycardia. These measures were chosen based on the
expected infant responses to the challenge of feeding as described by Polyvagal Theory (Porges, 1995).
Two methods were used to assess respiratory function during feeding. Sp02 was collected using
a pulse oximeter (Ohmeda, Boulder, CO) placed on the infant’s foot. Sp02 data was sampled using a 2
second averaging window and cleaned of artifact. Mean Sp02 during feeding was calculated. Respiration
data was collected using respiratory inductance plethysmography bands placed around the infant’s chest
and abdomen (Respitrace, Ambulatory Monitoring Ind., Ardsley, NY). Electrocardiogram (ECG) data was
collected from a three-lead ECG monitor (Gould Electronics, Valley View, Ohio). Physiologic data (Sp02,
RR, and HR) was collected at a sampling rate of 1,000 samples per second, digitized by an A-D
converter, and stored on a computer using Windaq Data Acquisition software (Dataq Instruments Inc.,
Akron, OH).
Respiratory waveform data was imported into Windaq Waveform Browser (Dataq Instruments
Inc., Akron, OH), marked using an algorithm within the program, and confirmed for accuracy by the
investigators. Respiratory waveform data was used (to calculate mean RR and number of episodes of
apnea (defined as absence of breath for more than 4 seconds (sec)) (Hanlon, et al., 1997). Number of
episodes of apnea were divided by the total length of feeding to account for variation in length of
feedings.
Digitized ECG data was imported into MindWare HRV (MindWare Technologies LTD, Gahanna,
OH) for review and analysis. MindWare HRV uses an algorithm to mark each R wave peak of the QRS
heartbeat complex and to calculate the interbeat interval (IBI). Artifact is identified by IBI that is
inconsistent with those intervals before and after. The investigator manually reviewed the data to confirm
accuracy of the R wave peak detection. ECG data were used to calculate HR (in beats per minute (bpm))
and number of seconds of bradycardia (defined as HR < 100 bpm) (Dawson, et al., 2013). Mean HR was
calculated for each two-minute bottle-in period. ECG data were also used for HRV analyses.
Frequency domain analysis of HRV was performed using two-minute epochs of artifact-free data.
Power spectral analysis with Hamming windowing function was executed with the frequency bandwidths
set for LF: 0.04-0.3 Hz and HF: 0.3-1.33 Hz. The outcome measures were: LF Power (ms2), HF (ms2),
and LF/HF ratio. Two minutes was chosen as the epoch for comparison because this is the shortest

124
period that allows for the measurement of both LF and HF components of HRV (Malik, et al., 1996) and
because this is a reasonable amount of time to expect vulnerable preterm infants to be able to feed
without having the bottle removed from the mouth. Only data collected when the bottle was in the infant’s
mouth was analyzed. In some cases, the infant required prolonged breaks with the bottle out of the
mouth. Since this study aimed to evaluate HRV during feeding, only data during active feeding was
analyzed. Data for active feeding periods that were not two minutes in length were excluded.
Non-linear analysis of HRV was completed by combining all two-minute epochs of artifact-free
data during each feeding. Kubios HRV version 2.0 (Kuopio, Finland) was used to create a single Poincaré
plot for each feeding and to calculate SD12.
Statistical Analysis
Linear mixed modeling was used to analyze these repeated-measures data for effects of feeding
method (Usual care vs. CoReg) using appropriate covariance structures to account for correlation
between feedings within the same infant and within the same feeding over time, as well as variances
possibly changing over time. The order effect of feeding method was tested and included in the model,
when appropriate. Frequency domain measures of HRV have been found to have skewed distributions
(Kleiger, et al., 2005). These data were assessed for skewness and transformed, if needed. An alpha of
0.05 was used for all tests of statistical significance. A trend towards statistical significance was defined
as an alpha of 0.1. Appendix 4.1 provides details of the linear mixed modeling analyses.
Results
Sample
The sample included fourteen infants and 34 feedings. Of the 75 original feedings, 22 were
excluded because the data were collected at a sampling rate of only 50 samples per second, which is not
sufficient for HRV analysis; 14 were excluded because there were no active feeding periods of at least 2
minutes; 21 were excluded because of poor ECG data or no artifact-free segments of active oral feeding;
and 4 (all from the same infant) were excluded because of abnormal cardiac rhythm, specifically frequent
premature ventricular contractions.
All 14 infants included in the study had a usual care feeding that was included in the analysis.
Ten of the infants had at least one of each feeding type that was analyzed. There were 22 usual care

125
feedings and 12 CoReg feedings analyzed. Table 4.1 provides information about the demographic and
clinical data of the infants and feedings included in the study. The sample of infants that had a usual care
feeding analyzed (n=14) was similar to the sample of infants that had an intervention feeding analyzed
(n=10) in terms of birth weight (996 vs. 992 grams), PMA (28.6 vs. 28.8 weeks), and chronic lung disease
(79% vs. 80%). The sample of feedings that were included for usual care (n=22) and CoReg (n=12) were
also similar in terms of the age of the infant at the time of the feeding (36.4 vs. 36.9 weeks), oxygen use
on the day of the study (64% vs. 67%), and number of days of feeding experience the infant had at the
time of the study feeding (13 vs. 13).
Results
Feeder Actions. The CoReg and usual care feedings were significantly different from one
another in terms of feeder actions (Table 4.2). Taking into account correlation between feedings of the
same infant, CoReg feedings were performed with the infant in a side-lying position significantly more
than usual care feedings (p<0.01) and the feeder stimulated the infant to suck significantly less during
CoReg feedings (p=0.03). The CoReg and usual care feedings were not significantly different in terms of
the co-regulation score (p=0.80). Given the differences in feeder actions between the two feeding
methods, there was reason to believe that the physiologic stress experienced by the infant during the two
methods may be different.
Standard physiologic measures (Table 4.3). Accounting for order of study feedings and
correlation within feedings of the same infant, there were no significant differences between the two
feeding methods for mean Sp02 (p=0.26) or number of seconds of bradycardia during feeding (p=0.11).
Baseline Sp02 was used as a covariate in the analysis to evaluate mean Sp02 during feeding. There was
also no difference between the groups for HR (p=0.38), accounting for order of feedings and correlation
between feedings of the same infant and between measurements within the same feeding.
Infants fed using the CoReg method had significantly fewer feeding-related apneas (p=0.04). This
analysis also took into account order of study feedings and correlation within feedings of the same infant.
Infants fed using the CoReg method also had significantly higher RR than infants fed using usual care
(p=0.03), accounting for baseline RR, correlation within feedings of the same infant, and order of study
feedings.

126
Heart rate variability measures (Table 4.4). Taking into account correlations between feedings
of the same infant and between measurements within the same feeding, as well as taking into account
the order of study feedings, there was no statistically significant difference in LF Power (p=0.06) or HF
Power (p=0.26) between feeding methods, although there was a trend towards significance with regards
to LF Power. There were no significant differences between feeding methods for LF/HF ratio (p=0.86).
However, infants fed with the usual care technique had a significantly higher SD12 than infants fed with
the CoReg approach (p=0.04).
Discussion
A gentle, co-regulated approach to feeding involving side-lying positioning, decreased stimulation,
and enhancement of auditory assessment of sucking, swallowing, and breathing was found to
significantly reduce the number of apneic events during feeding and to allow the infants to breathe more
during feeding, as evidenced by higher RR. Side-lying positioning as a means of reducing physiologic
stress during feeding in preterm infants has been supported by another study by Park and colleagues
(2014), who also found that side-lying allowed infants to maintain respiratory rate closer to the pre-feeding
state, have briefer feeding-related apneic events, and less severe and fewer decreases in heart rate. The
results of the standard physiologic measures suggested that the intervention feeding technique reduced
the physiologic stress of feeding for this group of preterm infants, however none of the frequency domain
measures of HRV revealed a significant difference between the feeding methods. There was a trend
toward significance for the outcome LF Power (p=0.06), with infants fed with the usual care technique
having LF Power of 366 ms2 compared to 75 ms2 for infants fed with the CoReg technique. These results
suggest that infants fed with the CoReg technique may have had a trend toward lower SNS input, and
therefore less stress, during feeding. As mentioned previously, however, the interpretation of LF HRV
remains controversial.
The non-linear HRV index of SD12 revealed a significant difference between the feeding
methods. Infants fed with the usual care technique were found to have significantly higher SD12 than
infants fed with the usual care technique (p=0.04). Increased SD12 indicates increased randomness of
the heart rate, or sinus arrhythmia of non-respiratory origin as opposed to respiratory sinus arrhythmia
(RSA) (Stein, et al., 2005; Stein & Reddy, 2005). Frequency domain analyses are unable to differentiate

127
variability in the heart rate from these two sources, which is important because increased variability from
respiratory origin is considered an indicator of lower risk, while increased variability from non-respiratory
origin is an indicator of higher risk (Stein, et al., 2005). Lower SD12 in the infants fed with the CoReg
technique suggests that the intervention may have been protective in some way, although it is not clear
whether this should be interpreted as decreased stress.
Conclusion
The results of this study support further exploration of HRV as a feeding intervention outcome
and highlight the need for consideration of both linear and non-linear HRV measures during this
exploration. The significance of nonlinear HRV measures is yet to be fully defined, especially in infants,
although it was the only HRV index in this study to find a statistically significant difference between
feeding methods. Infants, particularly preterm infants, are more likely to experience bradycardia, or
transient decreases in HR, as a result of stress compared to adults. The impact of this physiologic
difference between infants and adults on HRV outcomes needs further clarification. Nonlinear HRV may
be particularly useful for evaluation of HRV in this population.
Future research may consider exploring the use of HRV for identification of readiness for oral
feeding in preterm infants and the usefulness of real-time HRV during feeding for evaluation of stress
during feeding. The combination of HRV with other measures, such as cortisol, cytokines, galvanic skin
response, and/or near infrared spectroscopy of abdominal tissue oxygenation may provide a more
comprehensive evaluation of stress during feeding. This body of literature is in the early stages of
development and would benefit from consistency in future studies with regards to the HRV parameters
measured and units reported, epoch lengths studied, and definitions of HRV frequency bandwidths so
that comparisons can be made between study findings.

128
Table 4.1.
Demographic and Clinical Data
Parameter Usual Care
(n=14a)
CoReg
(n=10a)
Birth weight (grams) 996 (713 - 1390) 992 (713 - 1390)
Birth PMA (weeks) 28.6 (24.6 - 32.3) 28.8 (24.6 - 32.3)
Gender (n, %)
Female
Male
11 (79%)
3 (21%)
8 (80%)
2 (20%)
Race (n, %)
African-American
Euro-American
Other
4 (29%)
8 (57%)
2 (14%)
2 (20%)
6 (60%)
2 (20%)
NBRS 3 (0 - 10) 3 (0 - 10)
Lung Disease (n, %)
None
RDS
CLD
0
3 (21%)
11 (79%)
0
2 (20%)
8 (80%)
IVH (n, %)
None
Grade 1
Grade 2
Grade 3
9 (64%)
4 (29%)
0
1 (7%)
7 (70%)
2 (20%)
0
1 (10%)
Usual Care
(n=22b)
CoReg
(n=12b)
Study PMA (weeks) 36.4 (33.9 - 40.3) 36.9 (34 – 40.3)
02 Day of Study (n, %)
Yes
No
14 (64%)
8 (36%)
8 (67%)
4 (33%)
02 During Feeding
Yes
No
15 (68%)
7 (32%)
10 (83%)
2 (17%)
Feeding Experience (days) 13 (2 – 39) 13 (2 – 39)
Note. Parameters are presented as mean (minimum - maximum) unless otherwise noted. NBRS = Neurobiologic Risk Score (Brazy, Goldstein, Oehler, Gustafson, & Thompson, 1993); RDS = Respiratory Distress Syndrome; CLD = Chronic Lung Disease; IVH = Intraventricular Hemorrhage; PMA = Post-menstrual age; Birth PMA = PMA at birth; Study PMA = PMA on day of study; 02 = Oxygen; a =Sample size of infants; b = Sample size of feedings.
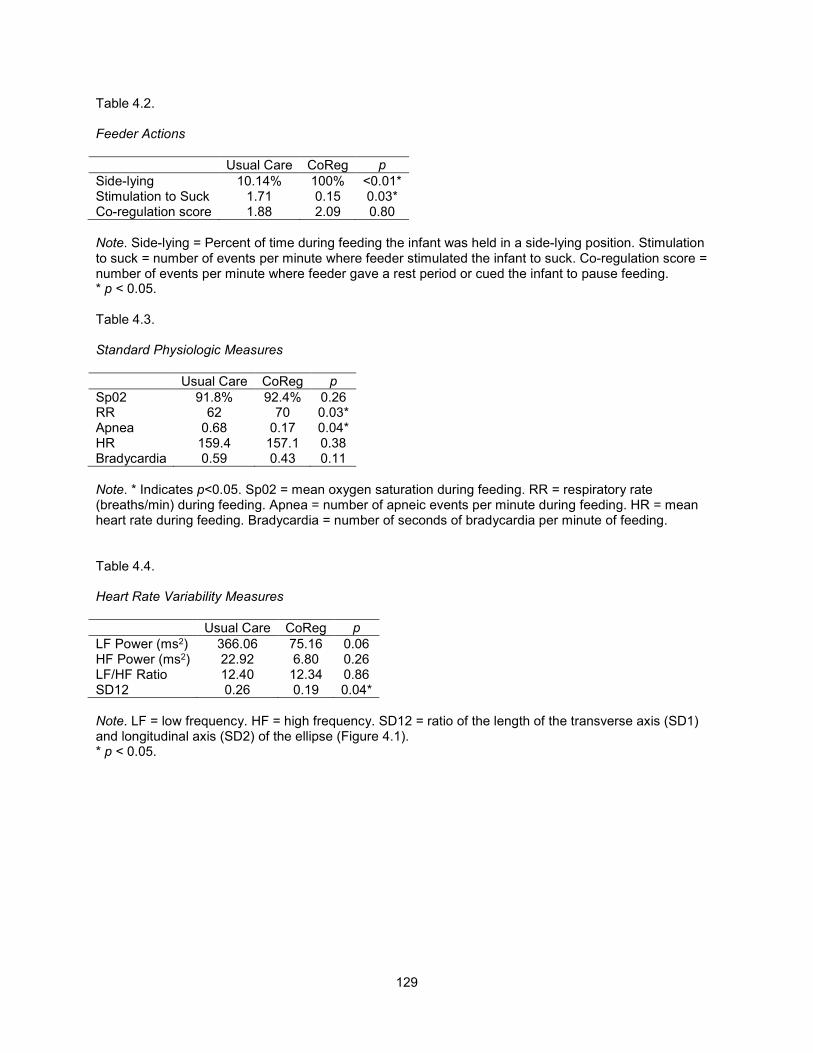
129
Table 4.2.
Feeder Actions
Usual Care CoReg p
Side-lying 10.14% 100% <0.01* Stimulation to Suck 1.71 0.15 0.03* Co-regulation score 1.88 2.09 0.80
Note. Side-lying = Percent of time during feeding the infant was held in a side-lying position. Stimulation to suck = number of events per minute where feeder stimulated the infant to suck. Co-regulation score = number of events per minute where feeder gave a rest period or cued the infant to pause feeding. * p < 0.05. Table 4.3.
Standard Physiologic Measures
Usual Care CoReg p
Sp02 91.8% 92.4% 0.26 RR 62 70 0.03* Apnea 0.68 0.17 0.04* HR 159.4 157.1 0.38 Bradycardia 0.59 0.43 0.11
Note. * Indicates p<0.05. Sp02 = mean oxygen saturation during feeding. RR = respiratory rate (breaths/min) during feeding. Apnea = number of apneic events per minute during feeding. HR = mean heart rate during feeding. Bradycardia = number of seconds of bradycardia per minute of feeding. Table 4.4.
Heart Rate Variability Measures
Usual Care CoReg p
LF Power (ms2) 366.06 75.16 0.06 HF Power (ms2) 22.92 6.80 0.26 LF/HF Ratio 12.40 12.34 0.86 SD12 0.26 0.19 0.04*
Note. LF = low frequency. HF = high frequency. SD12 = ratio of the length of the transverse axis (SD1) and longitudinal axis (SD2) of the ellipse (Figure 4.1). * p < 0.05.

130
Figure 4.1. Poincaré plot with SD1 (red) and SD2 (green).
Figure 4.2. Poincaré plot examples of low SD12 (left) and high SD12 (right). Low SD12 indicates high correlation between interbeat intervals. High SD12 indicates low correlation, or increased randomness, in interbeat intervals.

APPENDIX 4.1: LINEAR MIXED MODELING ANALYSIS OF CHAPTER 4 DATA
Linear mixed modeling (LMM) was used to analyze these repeated-measures data. The variable name is denoted in square brackets. The
effects of feeding method (intervention vs. standard-care) [GROUP] on the outcome measures described below were evaluated using appropriate
covariance structures to account for correlation between feedings of the same infant [ID] and within the same feeding over time [FDGEVENT], as
well as variances possibly changing over time [FTIMEINDEX or FHRVINDEX]. The order effect of feeding method was tested and included in the
model, if appropriate [STUDYDAY & DAYFDGORDER].
For each dependent variable, a step-wise LMM analysis was done. The model tested, model problems, results, and AIC/BIC scores are
tabled below. Decisions about variables included in the random effects models and fixed effects models are also described within each table. The
results of the final model selected are presented and interpreted at the end of each table.
Question 1: Is there a difference between the feeding methods used in the intervention and that of standard care?
The intervention included a head elevated, side-lying position; minimal oral and tactile stimulation; and enhanced auditory assessment of
sucking, swallowing, and breathing to allow for feeder co-regulation of swallowing and breathing. The intervention (CoReg) was compared to usual
care feeding by a bedside nurse who was unaware of the intervention protocol. To evaluate whether the feeding methods used in the CoReg
intervention were different from the usual care, feedings were analyzed for differences in the following variables: percent of feeding the infant was
in a side-lying position [SIDELYING], the number of events where the feeder stimulated the infant to suck [STIMSUCK], and the co-regulation
score (defined as the number of times the feeder provided a rest period for the infant plus number of times the feeder cued the infant to pause
feeding by tipping the bottle back or stopping milk flow) [COREG]. These variables had only one measurement per feeding so there was no need
to account for correlation within the same feeding event, but a given infant may have had more than one feeding, so correlation within infant [ID]
was considered.
132

A. Side-lying: Percent of feeding the infant was in a side-lying position [SIDELYING].
Model Model Problems Results AIC BIC
The purpose of this analysis was to evaluate whether there was a difference between groups for the outcome variable SIDELYING, taking into account correlation within infant (ID was included in the class statement as well as group). Since there was only 1 measurement per feeding, there was no need to account for correlation within feeding. Feeder actions do not have a carry-over effect, so there was no need to account for order effect variables. The fixed effects model only has group as a variable, so the random effects model was determined.
*Model A1; proc mixed data=hrv covtest method=ML; class id group; model sidelying=group / solution; random intercept group / subject=id type=cs v=4 vcorr=4; run;
None Group <0.0001 311.4 314.6
*Model A2; proc mixed data=hrv covtest method=ML; class id group; model sidelying=group / solution; random intercept / subject=id type=cs v=4 vcorr=4; run;
Convergence criteria met but final hessian not positive definite.
Group <0.0001 313.4 316.6
Solution for Fixed Effects
Effect GROUP Estimate Standard Error DF t Value Pr > |t|
Intercept 100.00 6.4808 9 15.43 <.0001
GROUP 0 -89.8615 8.3077 9 -10.82 <.0001
GROUP 1 0 . . . .
Interpretation of results: Taking into account correlation between feedings of the same infant, infants fed with the intervention method were
fed in a side-lying position significantly more than infants fed with standard care (p<0.0001). Estimates for percent of the feeding in a side-lying
position were for Group 0 (Usual care) 100 + -89.86 = 10.14% and for Group 1 (CoReg) = 100%.
133

B. Stimulation to Suck: STIMSUCK was the number of events where the feeder stimulated the infant to suck. A variable was created called
STIMSUCKRATE, which was calculated as the number of STIMSUCK events divided by the length of time the bottle was in the mouth. The
result is the number of events per second.
Model Model Problems Results AIC BIC
The purpose of this analysis was to evaluate whether there was a difference between groups for the outcome variable STIMSUCKRATE, taking into account correlation within infant (ID was included in the class statement as well as group). Since there was only 1 measurement per feeding, there was no need to account for correlation within feeding. Feeder actions do not have a carry-over effect, so there was no need to account for order effect variables. The fixed effects model only has group as a variable, so the random effects model was determined.
*Model B1; proc mixed data=hrv covtest method=ML; class id group; model stimsuckrate=group / solution; random intercept group / subject=id type=cs v=4 vcorr=4; run;
None Group=0.0284 -145.5 -142.3
*Model B2; proc mixed data=hrv covtest method=ML; class id group; model stimsuckrate=group / solution; random intercept / subject=id type=cs v=4 vcorr=4; run;
None Group=0.0044 -143.0 -139.8
Model B1 had the lower AIC/BIC scores, so this model was chosen.
Solution for Fixed Effects
Effect GROUP Estimate Standard Error DF t Value Pr > |t|
Intercept 0.002525 0.007868 9 0.32 0.7556
GROUP 0 0.02605 0.009990 9 2.61 0.0284
GROUP 1 0 . . . .
Interpretation of results: Taking into account correlation between feedings of the same infant, infants fed with usual care were stimulated
to suck significantly more than infants fed with the CoReg method (p=0.03). Estimates for the stimulation to suck events per second were for Usual
134

care = 0.02605 + 0.002525 = 0.028575 and for CoReg = 0.002525. Converted to minutes, infants fed with the usual care method were stimulated
to suck, on average, 1.71 times per minute. Infants fed with the CoReg method were stimulated to suck 0.15 times per minute.
C. Co-regulation score [COREG]: Co-regulation score was defined as the number of times the feeder provided a rest period for the infant plus
number of times the feeder cued the infant to pause feeding by tipping the bottle back or stopping milk flow. A variable was created called
COREGRATE, which was calculated as the co-regulation score divided by the length of time the bottle was in the mouth. The results for this
outcome are in number of co-regulation events per second.
Model Model Problems Results AIC BIC
The purpose of this analysis was to evaluate whether there was a difference between groups for the outcome variable COREGRATE, taking into account correlation within infant (ID was included in the class statement as well as group). Since there was only 1 measurement per feeding, there was no need to account for correlation within feeding. Feeder actions do not have a carry-over effect, so there was no need to account for order effect variables. The fixed effects model only has group as a variable, so the random effects model was determined.
*Model C1; proc mixed data=hrv covtest method=ML; class id group; model coregrate=group / solution; random intercept group / subject=id type=cs v=4 vcorr=4; run;
None Group = 0.7996 -120.8 -118.2
*Model C2; proc mixed data=hrv covtest method=ML; class id group; model coregrate=group / solution; random intercept / subject=id type=cs v=4 vcorr=4; run;
Stopped because of too many likelihood evaluations.
Model C1 was the better model since C2 was stopped because of too many likelihood evaluations.
Solution for Fixed Effects
Effect GROUP Estimate Standard Error DF t Value Pr > |t|
Intercept 0.03483 0.01038 9 3.35 0.0085
GROUP 0 -0.00347 0.01328 9 -0.26 0.7996
GROUP 1 0 . . . .
135

Interpretation of Results: The intervention and usual care feeding methods were not significantly different in the amount of co-regulation
provided (p=0.7996). Estimated coregrate (#/sec) for group 0 (usual care) was 0.03483 – 0.00347 = 0.03136 and Group 1 (CoReg) = 0.03483.
Converted to number of events per minute, infants fed with the usual care method were co-regulated 1.88 times per minute while infants fed with
the CoReg method were co-regulated 2.09 times per minute.
Question 2: Is there a difference between the feeding methods for standard physiologic outcome measures?
An analysis was run to determine if there was a difference in standard physiologic variables between the intervention and usual-care
feeding methods [GROUP] in terms of: mean oxygen saturation (Sa02) during feeding, feeding-related apneic and bradycardic events, mean heart
rate (HR), and mean respiratory rate (RR). These variables had only one measurement per feeding, so there was no need to account for
correlation within feedings, but correlation between feedings of the same infant was evaluated. Order of study feedings was also considered.
When baseline values for a variable were available and appropriate, these were considered in the covariance structure.
D. Mean Sa02 during feeding [MEANFDGSAO2] covarying on BASEO2:
Model Model Problems Results AIC BIC
The purpose of this analysis was to evaluate whether there was a difference between groups for the outcome variable MEANFDGSa02, taking into account correlation within infant (ID was included in the class statement as well as group). Since there was only 1 measurement per feeding, there was no need to account for correlation within feeding. If the prior feeding was particularly stressful, there is the possibility for a carry-over effect on Sa02, so order effect variables were included (studyday and dayfdgorder). Mean baseline Sa02 (BASE02) was also included in the analysis as a covariate. First, the fixed effects model was determined, with all variables in the random effects model.
*Model D1; Proc mixed data=hrv covtest method=ML; Class id group; Model MEANFDGSaO2=group studyday dayfdgorder BASEO2 / solution; Random intercept group studyday dayfdgorder BASEO2 / subject=id v=4 vcorr=4; Run;
None GROUP 0.4343
STUDYDAY 0.6350
DAYFDGORDER 0.4351
BASEO2 0.1116
180 185.8
*Model D2; Proc mixed data=hrv covtest method=ML; Class id group;
None GROUP 0.4414
STUDYDAY 0.6655
193.3 197.7
136

Model MEANFDGSaO2=group studyday dayfdgorder / solution; Random intercept group studyday dayfdgorder BASEO2 / subject=id v=4 vcorr=4; Run;
DAYFDGORDER 0.3215
*Model D3; Proc mixed data=hrv covtest method=ML; Class id group; Model MEANFDGSaO2=group studyday BASEO2 / solution; Random intercept group studyday dayfdgorder BASEO2 / subject=id v=4 vcorr=4; Run;
None GROUP 0.4939
STUDYDAY 0.5884
BASEO2 0.1081
180.7 186.5
*Model D4; Proc mixed data=hrv covtest method=ML; Class id group; Model MEANFDGSaO2=group dayfdgorder BASEO2 / solution; Random intercept group studyday dayfdgorder BASEO2 / subject=id v=4 vcorr=4; Run;
None
GROUP 0.4043
DAYFDGORDER 0.4326
BASEO2 0.1137
178.3 183.4
*Model D5; Proc mixed data=hrv covtest method=ML; Class id group; Model MEANFDGSaO2=group studyday / solution; Random intercept group studyday dayfdgorder BASEO2 / subject=id v=4 vcorr=4; Run;
None GROUP 0.5181
STUDYDAY 0.6825
192.6 196.4
*Model D6; Proc mixed data=hrv covtest method=ML; Class id group; Model MEANFDGSaO2=group dayfdgorder / solution; Random intercept group studyday dayfdgorder BASEO2 / subject=id v=4 vcorr=4; Run;
None
GROUP 0.4641
DAYFDGORDER 0.3221
191.5 195.3
*Model D7; Proc mixed data=hrv covtest method=ML; Class id group; Model MEANFDGSaO2=group BASEO2 / solution; Random intercept group studyday dayfdgorder BASEO2 /
None GROUP 0.4697
BASE02 0.1099
179.0 184.1
137

subject=id v=4 vcorr=4; Run;
*Model D8; Proc mixed data=hrv covtest method=ML; Class id group; Model MEANFDGSaO2=group / solution; Random intercept group studyday dayfdgorder BASEO2 / subject=id v=4 vcorr=4; Run;
None GROUP 0.5462
190.7 193.9
Model D4 had the best AIC/BIC scores for the fixed effects model. Using this fixed effects model, now start to remove one random effects variable at a time.
*Model D9; Proc mixed data=hrv covtest method=ML; Class id group; Model MEANFDGSaO2=group dayfdgorder / solution; Random intercept group studyday dayfdgorder BASEO2 / subject=id v=4 vcorr=4; Run;
None GROUP 0.4044
DAYFDGORDER 0.4326
BASE02 .
178.3 183.4
*Model D10; Proc mixed data=hrv covtest method=ML; Class id group; Model MEANFDGSaO2=group dayfdgorder BASEO2 / solution; Random intercept group studyday BASEO2 / subject=id v=4 vcorr=4; Run;
None
GROUP 0.4044
DAYFDGORDER
BASE02 0.0116
178.3 183.4
*Model D11; Proc mixed data=hrv covtest method=ML; Class id group; Model MEANFDGSaO2=group dayfdgorder BASEO2 / solution; Random intercept group dayfdgorder BASEO2 / subject=id v=4 vcorr=4; Run;
None GROUP 0.3958
DAYFDGORDER 0.4037
BASE02 0.0317
176.3 180.8
*Model D12; Proc mixed data=hrv covtest method=ML; Class id group; Model MEANFDGSaO2=group dayfdgorder BASEO2 / solution; Random intercept studyday dayfdgorder BASEO2 /
None GROUP .
DAYFDGORDER 0.2434
BASE02 0.0464
175.9 179.7
138

subject=id v=4 vcorr=4; Run;
*Model D13; Proc mixed data=hrv covtest method=ML; Class id group; Model MEANFDGSaO2=group dayfdgorder BASEO2 / solution; Random intercept group studyday / subject=id v=4 vcorr=4; Run;
None GROUP 0.4044
DAYFDGORDER 0.4614
BASE02 0.0311
178.3 183.4
*Model D14; Proc mixed data=hrv covtest method=ML; Class id group; Model MEANFDGSaO2=group dayfdgorder BASEO2 / solution; Random intercept group dayfdgorder / subject=id v=4 vcorr=4; Run;
None GROUP 0.3958
DAYFDGORDER 0.4038
BASE02 0.1149
176.3 180.8
*Model D15; Proc mixed data=hrv covtest method=ML; Class id group; Model MEANFDGSaO2=group dayfdgorder BASEO2 / solution; Random intercept group BASEO2 / subject=id v=4 vcorr=4; Run;
None GROUP 0.3957
DAYFDGORDER 0.5375
BASE02 0.0009
176.3 180.8
*Model D16; Proc mixed data=hrv covtest method=ML; Class id group; Model MEANFDGSaO2=group dayfdgorder BASEO2 / solution; Random intercept studyday dayfdgorder / subject=id v=4 vcorr=4; Run;
None GROUP .
DAYFDGORDER 0.2434
BASE02 .
175.9 179.7
*Model D17; Proc mixed data=hrv covtest method=ML; Class id group; Model MEANFDGSaO2=group dayfdgorder BASEO2 / solution; Random intercept studyday BASEO2 / subject=id v=4 vcorr=4; Run;
None GROUP .
DAYFDGORDER .
BASE02 0.0021
175.9 179.7
139

*Model D18; Proc mixed data=hrv covtest method=ML; Class id group; Model MEANFDGSaO2=group dayfdgorder BASEO2 / solution; Random intercept dayfdgorder BASEO2 / subject=id v=4 vcorr=4; Run;
None GROUP .
DAYFDGORDER 0.2365
BASE02 0.0029
175.9 179.7
*Model D19; Proc mixed data=hrv covtest method=ML; Class id group; Model MEANFDGSaO2=group dayfdgorder BASEO2 / solution; Random intercept group/ subject=id v=4 vcorr=4; Run;
None GROUP 0.3958
DAYFDGORDER 0.4002
BASE02 0.0006
176.3 180.8
*Model D20; Proc mixed data=hrv covtest method=ML; Class id group; Model MEANFDGSaO2=group dayfdgorder BASEO2 / solution; Random intercept studyday/ subject=id v=4 vcorr=4; Run;
None GROUP 0.2781
DAYFDGORDER 0.2434
BASE02 0.0021
175.9 179.7
*Model D21; Proc mixed data=hrv covtest method=ML; Class id group; Model MEANFDGSaO2=group dayfdgorder BASEO2 / solution; Random intercept dayfdgorder / subject=id v=4 vcorr=4; Run;
None GROUP 0.2826
DAYFDGORDER 0.2365
BASE02 0.0029
175.9 179.7
*Model D22; Proc mixed data=hrv covtest method=ML; Class id group; Model MEANFDGSaO2=group dayfdgorder BASEO2 / solution; Random intercept BASEO2 / subject=id v=4 vcorr=4; Run;
None GROUP 0.2970
DAYFDGORDER 0.2635
BASE02 0.0008
175.9 179.7
*Model D23; Proc mixed data=hrv covtest method=ML; Class id group; Model MEANFDGSaO2=group dayfdgorder BASEO2 /
None GROUP 0.2606
DAYFDGORDER 0.2250
175.9 179.7
140

solution; Random intercept / subject=id v=4 vcorr=4; Run;
BASE02 0.0003
Model D23 was the most parsimonious random effects model of the models that all had an AIC/BIC score of 175.9/179.9. Next, a residual analysis was run to evaluate the data for outliers.
*Model D23 with residual analysis; Proc mixed data=hrv covtest method=ML; Class id group; Model MEANFDGSaO2=group dayfdgorder BASEO2 / solution outpm=residls vciry; Random intercept / subject=id v=4 vcorr=4; Run; data residls; set residls; label pred="Predicted Value" scaledresid="Scaled Residual"; format pred scaledresid 7.2; run;
None No outliers outside of +/- 3.
175.9 179.7
To estimate the values for MeanFdgSa02 between groups, DAYFDGORDER and BASE02 were removed from the model
*Model D24 for estimating MeanFdgSa02 between groups; Proc mixed data=hrv covtest method=ML; Class id group; Model MEANFDGSaO2=group / solution;
None
141

Interpretation: There was not a significant difference in mean Sa02 during feeding between the two feeding methods (p=0.26). The mean
Sa02 during feeding of infants fed with the usual care method (group 0) was 92.4371 – 0.6393 = 91.8% and for the CoReg method was 92.4%.
E. Apneic Episodes: The number of feeding-related episodes of apnea (defined as absence of breath for more than 4 seconds (sec)) (Hanlon et
al., 1997) [PAUSEMORE4]. A new variable was created called FDGAPNEA, which was calculated as PAUSEMORE4 divided by the total
length of feeding (FDGTOT) in secs. The results for FDGAPNEA are in number of events per second.
SAS Code Model Problems Results AIC BIC
The purpose of this analysis was to evaluate whether there was a difference between groups for the outcome variable FDGAPNEA, taking into account correlation within infant (ID was included in the class statement as well as group). Since there was only 1 measurement per feeding, there was no need to account for correlation within feeding. If the prior feeding was particularly stressful, there is the possibility for a carry-over effect on apnea, so order effect variables were included (studyday and dayfdgorder). First, the fixed effects model was determined, with all variables in the random effects model.
*Model E1; Proc mixed data=hrv covtest method=ML; Class id group; Model FDGAPNEA =group studyday dayfdgorder / solution; Random intercept group studyday dayfdgorder / subject=id v=4 vcorr=4; Run;
None GROUP 0.0464
STUDYDAY 0.1566
DAYFDGORDER 0.0473
-223.4 -219.6
*Model E2; Proc mixed data=hrv covtest method=ML; Class id group; Model FDGAPNEA =group studyday / solution; Random intercept group studyday dayfdgorder / subject=id v=4 vcorr=4; Run;
None GROUP 0.0243
STUDYDAY 0.3339
-218.3 -214.4
Random intercept / subject=id v=4 vcorr=4; Run;
Solution for Fixed Effects
Effect GROUP Estimate Standard Error DF t Value Pr > |t|
Intercept 92.4371 1.1026 13 83.84 <.0001
GROUP 0 -0.6393 1.0475 19 -0.61 0.5489
GROUP 1 0 . . . .
142

SAS Code Model Problems Results AIC BIC
*Model E3; Proc mixed data=hrv covtest method=ML; Class id group; Model FDGAPNEA =group dayfdgorder / solution; Random intercept group studyday dayfdgorder / subject=id v=4 vcorr=4; Run;
None GROUP 0.0363
DAYFDGORDER 0.0684
-222.9 -219.8
*Model E4; Proc mixed data=hrv covtest method=ML; Class id group; Model FDGAPNEA =group / solution; Random intercept group studyday dayfdgorder / subject=id v=4 vcorr=4; Run;
None GROUP 0.0184
-219.2 -216.0
Model E1 had the best AIC/BIC scores. Starting with model E1, add the interaction terms between group and the other variables, one at a time.
*Model E5; Proc mixed data=hrv covtest method=ML; Class id group; Model FDGAPNEA =group studyday dayfdgorder group*studyday / solution; Random intercept group studyday dayfdgorder / subject=id v=4 vcorr=4; Run;
None
GROUP 0.1683
STUDYDAY 0.2085
DAYFDGORDER 0.0570
STUDYDAY*GROUP 0.8845
-221.5 -217.0
*Model E6; Proc mixed data=hrv covtest method=ML; Class id group; Model FDGAPNEA =group studyday dayfdgorder group*dayfdgorder / solution; Random intercept group studyday dayfdgorder / subject=id v=4 vcorr=4; Run;
None GROUP 0.0952
STUDYDAY 0.2699
DAYFDGORDER 0.1780
DAYFDGORDER*GROUP 0.6466
-221.8 -217.3
Adding the interaction terms did not improve the model. Using the fixed effects model in E1, now determine the random effects model.
*Model E7; Proc mixed data=hrv covtest method=ML; Class id group; Model FDGAPNEA =group studyday dayfdgorder / solution; Random intercept group studyday / subject=id v=4 vcorr=4; Run;
None GROUP 0.0430
STUDYDAY 0.1566
DAYFDGORDER 0.0473
-223.4 -219.6
*Model E8; Proc mixed data=hrv covtest method=ML; Class id group;
None GROUP 0.0430 -223.4 -219.6
143

SAS Code Model Problems Results AIC BIC
Model FDGAPNEA =group studyday dayfdgorder / solution; Random intercept group dayfdgorder / subject=id v=4 vcorr=4; Run;
STUDYDAY 0.3442
DAYFDGORDER 0.0140
*Model E9; Proc mixed data=hrv covtest method=ML; Class id group; Model FDGAPNEA =group studyday dayfdgorder / solution; Random intercept studyday dayfdgorder / subject=id v=4 vcorr=4; Run;
None GROUP 0.2676
STUDYDAY 0.4018
DAYFDGORDER 0.2861
-215.1 -211.2
*Model E10; Proc mixed data=hrv covtest method=ML; Class id group; Model FDGAPNEA =group studyday dayfdgorder / solution; Random intercept group / subject=id v=4 vcorr=4; Run;
None GROUP 0.0430
STUDYDAY 0.1343
DAYFDGORDER 0.0116
-223.4 -219.6
*Model E11; Proc mixed data=hrv covtest method=ML; Class id group; Model FDGAPNEA =group studyday dayfdgorder / solution; Random intercept studyday / subject=id v=4 vcorr=4; Run;
None GROUP 0.0521
STUDYDAY 0.4018
DAYFDGORDER 0.2826
-215.1 -211.1
*Model E12; Proc mixed data=hrv covtest method=ML; Class id group; Model FDGAPNEA =group studyday dayfdgorder / solution; Random intercept dayfdgorder / subject=id v=4 vcorr=4; Run;
None GROUP 0.0604
STUDYDAY 0.4054
DAYFDGORDER 0.2797
-215.1 -211.2
*Model E13; Proc mixed data=hrv covtest method=ML; Class id group; Model FDGAPNEA =group studyday dayfdgorder / solution; Random intercept / subject=id v=4 vcorr=4; Run;
None GROUP 0.0390
STUDYDAY 0.3883
DAYFDGORDER 0.2689
-215.1 -211.2
Model E10 was the most parsimonious random effects model with the best AIC/BIC scores. This model was used to run a residual analysis to evaluate the data for outliers.
*Model E10 with residual analysis; Proc mixed data=hrv covtest method=ML;
None No outliers outside of +/- 3.
144

SAS Code Model Problems Results AIC BIC
Class id group; Model FDGAPNEA =group studyday dayfdgorder / solution outpm=residls vciry; Random intercept group / subject=id v=4 vcorr=4; Run; data residls; set residls; label pred="Predicted Value" scaledresid="Scaled Residual"; format pred scaledresid 7.2; run;
To estimate the values for FDGAPNEA, the variables other than group were removed from the fixed effects model.
*Model E11; Proc mixed data=hrv covtest method=ML; Class id group; Model FDGAPNEA =group / solution; Random intercept group / subject=id v=4 vcorr=4; Run;
None GROUP 0.0446
-217.5 -214.3
Solution for Fixed Effects
145

SAS Code Model Problems Results AIC BIC
Effect GROUP Estimate Standard Error DF t Value Pr > |t|
Intercept 0.002806 0.002925 9 0.96 0.3624
GROUP 0 0.008569 0.003674 9 2.33 0.0446
GROUP 1 0 . . . .
Interpretation: Infants fed with the CoReg method had fewer feeding-related apneic events than infants fed with the usual care method
(p=0.043). Infants fed with usual care had 0.002806+0.008569 = 0.011375 apneas/second and infants fed with CoReg had 0.002806 apneas/sec.
Converted to minutes, infants fed with usual care had 0.68 apneas/minute and infants fed with CoReg had 0.17 apneas/minute.
F. Bradycardia: Number of seconds of bradycardia (defined as heart rate less than 100 bpm) during feeding [SECBRADY]. A new variable was
created called FDGBRADY, which was calculated as the SECBRADY divided by the total length of feeding (FDGTOT). The results of
FDGBRADY are in number of seconds of bradycardia per second of feeding.
Model Model Problems Results AIC BIC
The purpose of this analysis was to evaluate whether there was a difference between groups for the outcome variable FDGBRADY, taking into account correlation within infant (ID was included in the class statement as well as group). Since there was only 1 measurement per feeding, there was no need to account for correlation within feeding. If the prior feeding was particularly stressful, there is the possibility for a carry-over effect on bradycardia, so order effect variables were included (studyday and dayfdgorder). First, the fixed effects model was determined, with all variables in the random effects model.
*Model F1; Proc mixed data=hrv covtest method=ML; Class id group; Model FDGBRADY =group studyday dayfdgorder / solution; Random intercept group studyday dayfdgorder / subject=id v=4 vcorr=4; Run;
None GROUP 0.1241
STUDYDAY 0.8800
DAYFDGORDER 0.6156
-168.9 -164.4
*Model F2; Proc mixed data=hrv covtest method=ML; Class id group; Model FDGBRADY =group studyday / solution; Random intercept group studyday dayfdgorder / subject=id v=4 vcorr=4; Run;
None GROUP 0.1248
STUDYDAY 0.9162
-170.6 -166.7
146

Model Model Problems Results AIC BIC
*Model F3; Proc mixed data=hrv covtest method=ML; Class id group; Model FDGBRADY =group dayfdgorder / solution; Random intercept group studyday dayfdgorder / subject=id v=4 vcorr=4; Run;
None GROUP 0.1189
DAYFDGORDER 0.6238
-170.8 -167.0
*Model F4; Proc mixed data=hrv covtest method=ML; Class id group; Model FDGBRADY =group / solution; Random intercept group studyday dayfdgorder / subject=id v=4 vcorr=4; Run;
None GROUP 0.1238
-172.6 -169.4
Model F4 had the best AIC/BIC scores. Now add the interaction terms between group and the other variables.
*Model F5; Proc mixed data=hrv covtest method=ML; Class id group; Model FDGBRADY =group studyday dayfdgorder group*studyday / solution; Random intercept group studyday dayfdgorder / subject=id v=4 vcorr=4; Run;
None 0.3322
STUDYDAY 0.8206
DAYFDGORDER 0.7640
STUDYDAY*GROUP .
-167.0 -161.9
*Model F6; Proc mixed data=hrv covtest method=ML; Class id group; Model FDGBRADY =group studyday dayfdgorder group*dayfdgorder / solution; Random intercept group studyday dayfdgorder / subject=id v=4 vcorr=4; Run;
None GROUP 0.2818
STUDYDAY 0.7497
DAYFDGORDER 0.7858
DAYFDGORDER*GROUP .
-165.1 -159.3
The interaction terms did not improve the model. Using the fixed effects model in F4, determine the random effects model.
*Model F7; Proc mixed data=hrv covtest method=ML; Class id group; Model FDGBRADY =group / solution; Random intercept group studyday / subject=id v=4 vcorr=4; Run;
None GROUP 0.1282
-172.5 -169.3
*Model F8; Proc mixed data=hrv covtest method=ML; Class id group; Model FDGBRADY =group / solution;
None GROUP 0.1238
-172.6 -169.4
147

Model Model Problems Results AIC BIC
Random intercept group dayfdgorder / subject=id v=4 vcorr=4; Run;
*Model F9; Proc mixed data=hrv covtest method=ML; Class id group; Model FDGBRADY =group / solution; Random intercept studyday dayfdgorder / subject=id v=4 vcorr=4; Run;
None GROUP .
-174.4 -171.9
*Model F10; Proc mixed data=hrv covtest method=ML; Class id group; Model FDGBRADY =group / solution; Random intercept group / subject=id v=4 vcorr=4; Run;
None GROUP 0.1282
-172.5 -169.3
*Model F11; Proc mixed data=hrv covtest method=ML; Class id group; Model FDGBRADY =group / solution; Random intercept studyday / subject=id v=4 vcorr=4; Run;
None GROUP 0.1316
-174.4 -171.9
*Model F12; Proc mixed data=hrv covtest method=ML; Class id group; Model FDGBRADY =group / solution; Random intercept dayfdgorder / subject=id v=4 vcorr=4; Run;
None GROUP 0.1316
-174.4 -171.9
*Model F13; Proc mixed data=hrv covtest method=ML; Class id group; Model FDGBRADY =group / solution; Random intercept / subject=id v=4 vcorr=4; Run;
None GROUP 0.1071
-174.4 -171.9
Model F13 was the random effects model that was the most parsimonious and had the lowest AIC/BIC scores. Next, a residual analysis was run to evaluate the data for outliers.
*Model F13 with residual analysis; Proc mixed data=hrv covtest method=ML; Class id group; Model FDGBRADY =group / solution outpm=residls vciry;
There were no outliers outside of +/- 3.
148

Model Model Problems Results AIC BIC
Random intercept / subject=id v=4 vcorr=4; Run; data residls; set residls; label pred="Predicted Value" scaledresid="Scaled Residual"; format pred scaledresid 7.2; run;
Since no other variables were included in the fixed effects model, model F13 can be used for the estimates of the variable FDGBRADY.
Solution for Fixed Effects
Effect GROUP Estimate Standard Error DF t Value Pr > |t|
Intercept 0.002717 0.003582 12 0.76 0.4628
GROUP 0 0.007120 0.004171 16 1.71 0.1071
GROUP 1 0 . . . .
149
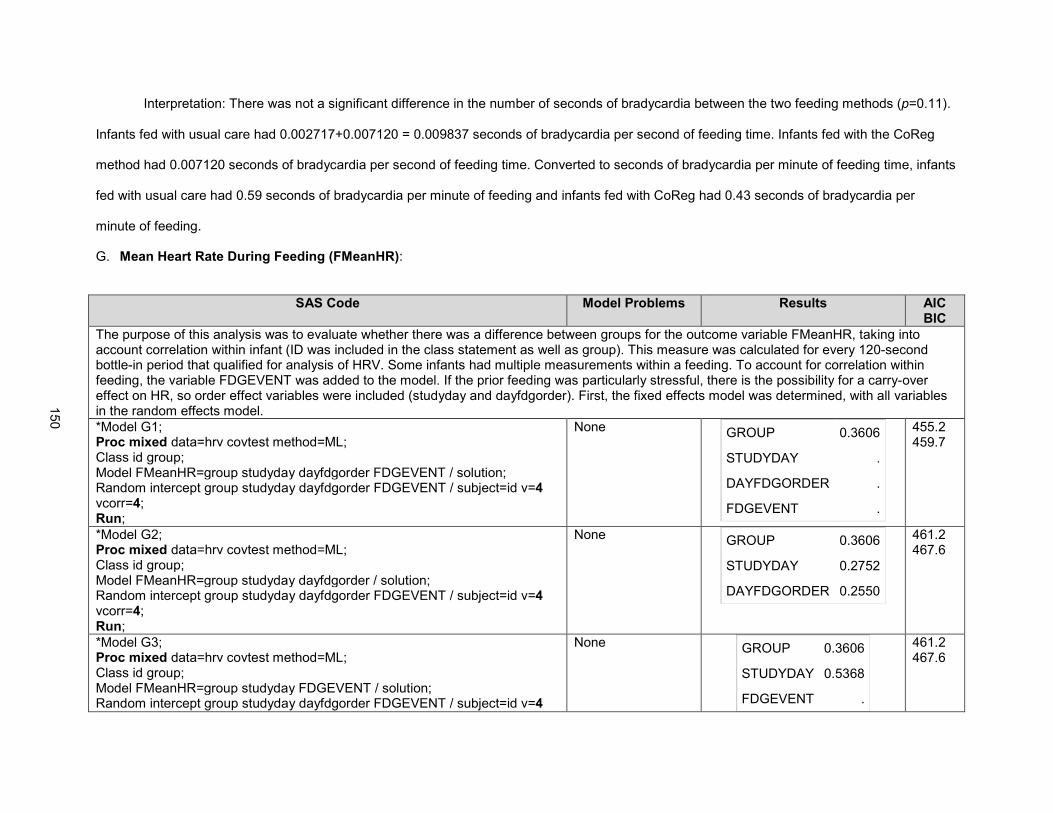
Interpretation: There was not a significant difference in the number of seconds of bradycardia between the two feeding methods (p=0.11).
Infants fed with usual care had 0.002717+0.007120 = 0.009837 seconds of bradycardia per second of feeding time. Infants fed with the CoReg
method had 0.007120 seconds of bradycardia per second of feeding time. Converted to seconds of bradycardia per minute of feeding time, infants
fed with usual care had 0.59 seconds of bradycardia per minute of feeding and infants fed with CoReg had 0.43 seconds of bradycardia per
minute of feeding.
G. Mean Heart Rate During Feeding (FMeanHR):
SAS Code Model Problems Results AIC BIC
The purpose of this analysis was to evaluate whether there was a difference between groups for the outcome variable FMeanHR, taking into account correlation within infant (ID was included in the class statement as well as group). This measure was calculated for every 120-second bottle-in period that qualified for analysis of HRV. Some infants had multiple measurements within a feeding. To account for correlation within feeding, the variable FDGEVENT was added to the model. If the prior feeding was particularly stressful, there is the possibility for a carry-over effect on HR, so order effect variables were included (studyday and dayfdgorder). First, the fixed effects model was determined, with all variables in the random effects model.
*Model G1; Proc mixed data=hrv covtest method=ML; Class id group; Model FMeanHR=group studyday dayfdgorder FDGEVENT / solution; Random intercept group studyday dayfdgorder FDGEVENT / subject=id v=4 vcorr=4; Run;
None GROUP 0.3606
STUDYDAY .
DAYFDGORDER .
FDGEVENT .
455.2 459.7
*Model G2; Proc mixed data=hrv covtest method=ML; Class id group; Model FMeanHR=group studyday dayfdgorder / solution; Random intercept group studyday dayfdgorder FDGEVENT / subject=id v=4 vcorr=4; Run;
None GROUP 0.3606
STUDYDAY 0.2752
DAYFDGORDER 0.2550
461.2 467.6
*Model G3; Proc mixed data=hrv covtest method=ML; Class id group; Model FMeanHR=group studyday FDGEVENT / solution; Random intercept group studyday dayfdgorder FDGEVENT / subject=id v=4
None GROUP 0.3606
STUDYDAY 0.5368
FDGEVENT .
461.2 467.6
150

SAS Code Model Problems Results AIC BIC
vcorr=4; Run;
*Model G4; Proc mixed data=hrv covtest method=ML; Class id group; Model FMeanHR=group dayfdgorder FDGEVENT / solution; Random intercept group studyday dayfdgorder FDGEVENT / subject=id v=4 vcorr=4; Run;
None GROUP 0.3606
DAYFDGORDER 0.5549
FDGEVENT .
461.2 467.6
*Model G5; Proc mixed data=hrv covtest method=ML; Class id group; Model FMeanHR=group FDGEVENT / solution; Random intercept group studyday dayfdgorder FDGEVENT / subject=id v=4 vcorr=4; Run;
None GROUP 0.3147
FDGEVENT .
459.5 465.3
*Model G6; Proc mixed data=hrv covtest method=ML; Class id group; Model FMeanHR=group studyday / solution; Random intercept group studyday dayfdgorder FDGEVENT / subject=id v=4 vcorr=4; Run;
None GROUP 0.2842
STUDYDAY 0.2023
460.4 466.2
*Model G7; Proc mixed data=hrv covtest method=ML; Class id group; Model FMeanHR=group dayfdgorder / solution; Random intercept group studyday dayfdgorder FDGEVENT / subject=id v=4 vcorr=4; Run;
None GROUP 0.3949
DAYFDGORDER 0.2218
458.3 463.4
*Model G8; Proc mixed data=hrv covtest method=ML; Class id group; Model FMeanHR=group / solution; Random intercept group studyday dayfdgorder FDGEVENT / subject=id v=4 vcorr=4; Run;
None GROUP 0.3531
459.7 464.8
Model G1 had the lowest AIC/BIC scores. Using this fixed effects model, the random effects model was then determined.
151

SAS Code Model Problems Results AIC BIC
*Model G9; Proc mixed data=hrv covtest method=ML; Class id group; Model FMeanHR=group studyday dayfdgorder FDGEVENT / solution; Random intercept group studyday dayfdgorder / subject=id v=4 vcorr=4; Run;
None GROUP 0.3783
STUDYDAY .
DAYFDGORDER .
FDGEVENT .
453.5 457.3
*Model G10; Proc mixed data=hrv covtest method=ML; Class id group; Model FMeanHR=group studyday dayfdgorder FDGEVENT / solution; Random intercept group studyday FDGEVENT / subject=id v=4 vcorr=4; Run;
None GROUP 0.3861
STUDYDAY .
DAYFDGORDER .
FDGEVENT .
451.5 454.7
*Model G11; Proc mixed data=hrv covtest method=ML; Class id group; Model FMeanHR=group studyday dayfdgorder FDGEVENT / solution; Random intercept group dayfdgorder FDGEVENT / subject=id v=4 vcorr=4; Run;
None
GROUP 0.3510
STUDYDAY .
DAYFDGORDER .
FDGEVENT .
453.3 457.1
*Model G12; Proc mixed data=hrv covtest method=ML; Class id group; Model FMeanHR=group studyday dayfdgorder FDGEVENT / solution; Random intercept studyday dayfdgorder FDGEVENT / subject=id v=4 vcorr=4; Run;
None GROUP 0.0760
STUDYDAY .
DAYFDGORDER .
FDGEVENT .
454.5 457.7
*Model G13; Proc mixed data=hrv covtest method=ML; Class id group; Model FMeanHR=group studyday dayfdgorder FDGEVENT / solution; Random intercept group studyday / subject=id v=4 vcorr=4; Run;
None GROUP 0.4778
STUDYDAY .
DAYFDGORDER .
FDGEVENT .
454.3 457.5
*Model G14; Proc mixed data=hrv covtest method=ML; Class id group;
None GROUP 0.1884
STUDYDAY .
456.0 459.2
152
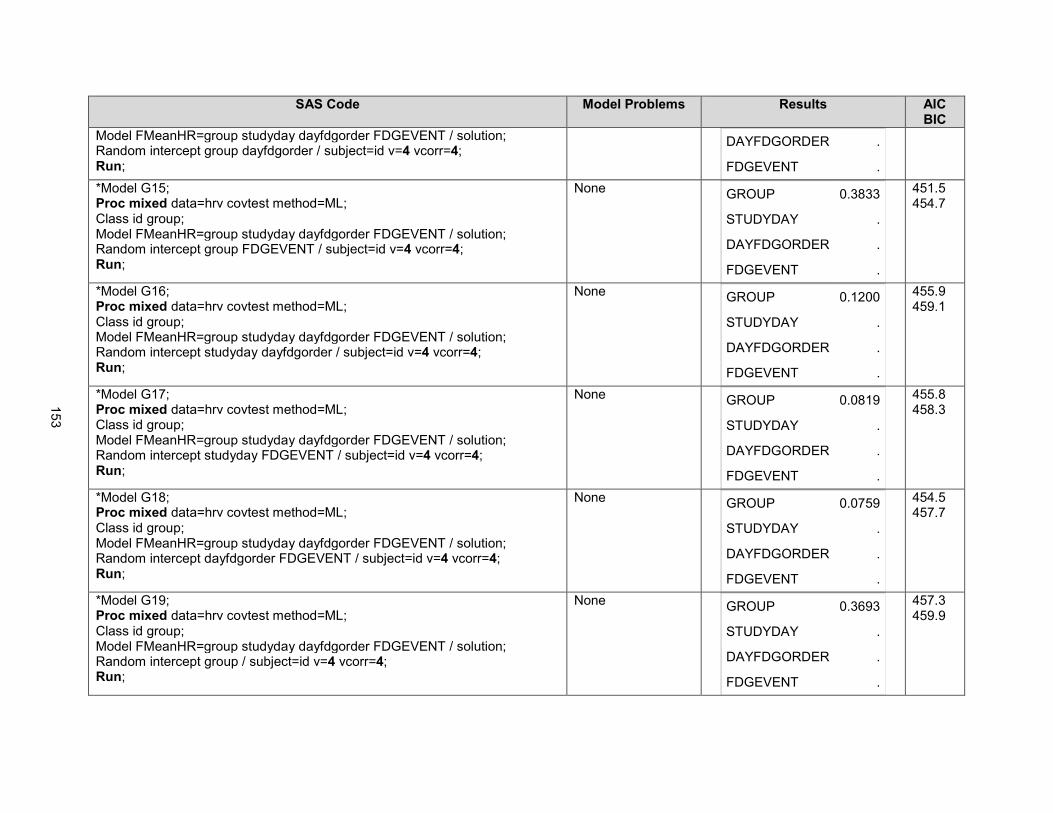
SAS Code Model Problems Results AIC BIC
Model FMeanHR=group studyday dayfdgorder FDGEVENT / solution; Random intercept group dayfdgorder / subject=id v=4 vcorr=4; Run;
DAYFDGORDER .
FDGEVENT .
*Model G15; Proc mixed data=hrv covtest method=ML; Class id group; Model FMeanHR=group studyday dayfdgorder FDGEVENT / solution; Random intercept group FDGEVENT / subject=id v=4 vcorr=4; Run;
None GROUP 0.3833
STUDYDAY .
DAYFDGORDER .
FDGEVENT .
451.5 454.7
*Model G16; Proc mixed data=hrv covtest method=ML; Class id group; Model FMeanHR=group studyday dayfdgorder FDGEVENT / solution; Random intercept studyday dayfdgorder / subject=id v=4 vcorr=4; Run;
None GROUP 0.1200
STUDYDAY .
DAYFDGORDER .
FDGEVENT .
455.9 459.1
*Model G17; Proc mixed data=hrv covtest method=ML; Class id group; Model FMeanHR=group studyday dayfdgorder FDGEVENT / solution; Random intercept studyday FDGEVENT / subject=id v=4 vcorr=4; Run;
None GROUP 0.0819
STUDYDAY .
DAYFDGORDER .
FDGEVENT .
455.8 458.3
*Model G18; Proc mixed data=hrv covtest method=ML; Class id group; Model FMeanHR=group studyday dayfdgorder FDGEVENT / solution; Random intercept dayfdgorder FDGEVENT / subject=id v=4 vcorr=4; Run;
None GROUP 0.0759
STUDYDAY .
DAYFDGORDER .
FDGEVENT .
454.5 457.7
*Model G19; Proc mixed data=hrv covtest method=ML; Class id group; Model FMeanHR=group studyday dayfdgorder FDGEVENT / solution; Random intercept group / subject=id v=4 vcorr=4; Run;
None GROUP 0.3693
STUDYDAY .
DAYFDGORDER .
FDGEVENT .
457.3 459.9
153

SAS Code Model Problems Results AIC BIC
*Model G20; Proc mixed data=hrv covtest method=ML; Class id group; Model FMeanHR=group studyday dayfdgorder FDGEVENT / solution; Random intercept studyday / subject=id v=4 vcorr=4; Run;
None GROUP 0.1727
STUDYDAY .
DAYFDGORDER .
FDGEVENT .
460.0 462.5
*Model G21; Proc mixed data=hrv covtest method=ML; Class id group; Model FMeanHR=group studyday dayfdgorder FDGEVENT / solution; Random intercept dayfdgorder / subject=id v=4 vcorr=4; Run;
None GROUP 0.0469
STUDYDAY .
DAYFDGORDER .
FDGEVENT .
457.8 460.3
*Model G22; Proc mixed data=hrv covtest method=ML; Class id group; Model FMeanHR=group studyday dayfdgorder FDGEVENT / solution; Random intercept FDGEVENT / subject=id v=4 vcorr=4; Run;
None GROUP 0.0811
STUDYDAY .
DAYFDGORDER .
FDGEVENT .
455.8 458.3
*Model G23; Proc mixed data=hrv covtest method=ML; Class id group; Model FMeanHR=group studyday dayfdgorder FDGEVENT / solution; Random intercept / subject=id v=4 vcorr=4; Run;
None GROUP 0.1524
STUDYDAY .
DAYFDGORDER .
FDGEVENT .
461.5 463.4
Model G15 was the most parsimonious model with the best AIC/BIC scores. This model was used to run a residual analysis to evaluate the data for outliers.
*Model G15 with Residual analysis; Proc mixed data=hrv covtest method=ML; Class id group; Model FMeanHR=group studyday dayfdgorder FDGEVENT / solution outpm=residls vciry; Random intercept group FDGEVENT / subject=id v=4 vcorr=4; Run; data residls;
No outliers outside of +/- 3.
154

SAS Code Model Problems Results AIC BIC
set residls; label pred="Predicted Value" scaledresid="Scaled Residual"; format pred scaledresid 7.2; run;
To estimate the values for Mean HR during feeding for the two groups, the model was run without the other variables in the fixed effects model.
*Model G16; Proc mixed data=hrv covtest method=ML; Class id group; Model FMeanHR=group / solution; Random intercept group FDGEVENT / subject=id v=4 vcorr=4; Run;
Solution for Fixed Effects
Effect GROUP Estimate Standard Error DF t Value Pr > |t|
Intercept 157.12 3.0890 9 50.86 <.0001
GROUP 0 2.2790 2.5863 9 0.88 0.4011
GROUP 1 0 . . . .
155

Interpretation: There was no significant difference in HR during feeding between the two groups (p=0.38). Heart rate during feeding was
for infants fed with usual care = 2.279 + 157.12 = 159.4 beats per minute and for infants fed with CoReg 157.12 beats per minute.
H. Respiratory Rate During Feeding (FDGRR): This variable measured the mean respiratory rate during feeding in breaths per minute.
SAS Code Model Problems Results AIC BIC
The purpose of this analysis was to evaluate whether there was a difference between groups for the outcome variable FDGRR, taking into account correlation within infant (ID was included in the class statement as well as group). There was only one measurement per feeding, so there was no need to account for correlation within feeding. If the prior feeding was particularly stressful, there is the possibility for a carry-over effect on RR, so order effect variables were included (studyday and dayfdgorder). Baseline RR was used as a covariate in the analysis. First, the fixed effects model was determined, with all variables in the random effects model.
*Model H1; Proc mixed data=hrv covtest method=ML; Class id group; Model FDGRR = group studyday dayfdgorder BASERR / solution; Random intercept group studyday dayfdgorder BASERR / subject=id v=4 vcorr=4; Run;
None GROUP 0.0656
STUDYDAY 0.8565
DAYFDGORDER 0.1990
BASERR 0.1536
261.0 266.1
*Model H2; Proc mixed data=hrv covtest method=ML; Class id group; Model FDGRR = group studyday dayfdgorder / solution; Random intercept group studyday dayfdgorder BASERR / subject=id v=4 vcorr=4; Run;
None GROUP 0.0860
STUDYDAY 0.8609
DAYFDGORDER 0.7872
271.0 275.5
*Model H3; Proc mixed data=hrv covtest method=ML; Class id group; Model FDGRR = group studyday BASERR / solution; Random intercept group studyday dayfdgorder BASERR / subject=id v=4 vcorr=4; Run;
None GROUP 0.0571
STUDYDAY 0.9180
BASERR 0.1702
261.3 265.8
*Model H4; Proc mixed data=hrv covtest method=ML; Class id group; Model FDGRR = group dayfdgorder BASERR / solution; Random intercept group studyday dayfdgorder BASERR / subject=id v=4 vcorr=4;
None GROUP 0.0631
DAYFDGORDER 0.2005
BASERR 0.1529
259.0 263.5
156

SAS Code Model Problems Results AIC BIC
Run;
*Model H5; Proc mixed data=hrv covtest method=ML; Class id group; Model FDGRR = group studyday / solution; Random intercept group studyday dayfdgorder BASERR / subject=id v=4 vcorr=4; Run;
None GROUP 0.0792
STUDYDAY 0.8727
269.1 273
*Model H6; Proc mixed data=hrv covtest method=ML; Class id group; Model FDGRR = group dayfdgorder / solution; Random intercept group studyday dayfdgorder BASERR / subject=id v=4 vcorr=4; Run;
None GROUP 0.0841
DAYFDGORDER 0.7943
269.1 272.9
*Model H7; Proc mixed data=hrv covtest method=ML; Class id group; Model FDGRR = group BASERR / solution; Random intercept group studyday dayfdgorder BASERR / subject=id v=4 vcorr=4; Run;
None GROUP 0.0569
BASERR 0.1698
259.3 263.1
*Model H8; Proc mixed data=hrv covtest method=ML; Class id group; Model FDGRR = group / solution; Random intercept group studyday dayfdgorder BASERR / subject=id v=4 vcorr=4; Run;
None GROUP 0.0809
267.1 270.3
Model H7 was the most parsimonious model with the best AIC/BIC scores. Use this model and determine the random effects model.
*Model H9; Proc mixed data=hrv covtest method=ML; Class id group; Model FDGRR = group BASERR / solution; Random intercept group studyday dayfdgorder / subject=id v=4 vcorr=4; Run;
None GROUP 0.0569
BASERR .
259.3 263.1
*Model H10; Proc mixed data=hrv covtest method=ML;
None GROUP 0.0569 259.3 263.1
157

SAS Code Model Problems Results AIC BIC
Class id group; Model FDGRR = group BASERR / solution; Random intercept group studyday BASERR / subject=id v=4 vcorr=4; Run;
BASERR 0.0353
*Model H11; Proc mixed data=hrv covtest method=ML; Class id group; Model FDGRR = group BASERR / solution; Random intercept studyday dayfdgorder BASERR / subject=id v=4 vcorr=4; Run;
None GROUP .
BASERR 0.0644
260.4 264.2
*Model H12; Proc mixed data=hrv covtest method=ML; Class id group; Model FDGRR = group BASERR / solution; Random intercept group studyday / subject=id v=4 vcorr=4; Run;
None GROUP 0.0569
BASERR 0.0353
259.3 263.1
*Model H13; Proc mixed data=hrv covtest method=ML; Class id group; Model FDGRR = group BASERR / solution; Random intercept group dayfdgorder / subject=id v=4 vcorr=4; Run;
None GROUP 0.0595
BASERR 0.1712
259.4 263.2
*Model H14; Proc mixed data=hrv covtest method=ML; Class id group; Model FDGRR = group BASERR / solution; Random intercept group BASERR / subject=id v=4 vcorr=4; Run;
None GROUP 0.0595
BASERR 0.0084
259.4 263.2
*Model H15; Proc mixed data=hrv covtest method=ML; Class id group; Model FDGRR = group BASERR / solution; Random intercept studyday dayfdgorder / subject=id v=4 vcorr=4; Run;
None GROUP .
BASERR .
260.4 264.2
*Model H16; Proc mixed data=hrv covtest method=ML; Class id group; Model FDGRR = group BASERR / solution;
None GROUP 0.2596
BASERR 0.0056
260.4 264.2
158

SAS Code Model Problems Results AIC BIC
Random intercept studyday BASERR / subject=id v=4 vcorr=4; Run;
*Model H17; Proc mixed data=hrv covtest method=ML; Class id group; Model FDGRR = group BASERR / solution; Random intercept dayfdgorder BASERR / subject=id v=4 vcorr=4; Run;
None GROUP 0.2603
BASERR 0.0099
258.4 261.6
*Model H18; Proc mixed data=hrv covtest method=ML; Class id group; Model FDGRR = group BASERR / solution; Random intercept group / subject=id v=4 vcorr=4; Run;
None GROUP 0.0594
BASERR 0.0055
259.4 263.2
*Model H19; Proc mixed data=hrv covtest method=ML; Class id group; Model FDGRR = group BASERR / solution; Random intercept studyday / subject=id v=4 vcorr=4; Run;
None GROUP 0.0459
BASERR 0.0046
260.4 264.2
*Model H20; Proc mixed data=hrv covtest method=ML; Class id group; Model FDGRR = group BASERR / solution; Random intercept dayfdgorder / subject=id v=4 vcorr=4; Run;
None GROUP 0.0543
BASERR 0.0075
258.4 261.6
*Model H21; Proc mixed data=hrv covtest method=ML; Class id group; Model FDGRR = group BASERR / solution; Random intercept BASERR / subject=id v=4 vcorr=4; Run;
None GROUP 0.0543
BASERR 0.0034
258.4 261.6
*Model H22; Proc mixed data=hrv covtest method=ML; Class id group; Model FDGRR = group BASERR / solution; Random intercept / subject=id v=4 vcorr=4; Run;
None GROUP 0.0331
BASERR 0.0016
258.4 261.6
159

SAS Code Model Problems Results AIC BIC
Model H22 is the most parsimonious model with the best AIC/BIC scores. Next, a residual analysis was run to evaluate the data for outliers.
*Model H22 with residual analysis; Proc mixed data=hrv covtest method=ML; Class id group; Model FDGRR = group BASERR / solution outpm=residls vciry; Random intercept / subject=id v=4 vcorr=4; Run; data residls; set residls; label pred="Predicted Value" scaledresid="Scaled Residual"; format pred scaledresid 7.2; run;
No outliers outside of +/- 3.
To estimate the values for RR during feeding for each group, the model was run without the other variables in the fixed effects model.
*Model H23; Proc mixed data=hrv covtest method=ML; Class id group; Model FDGRR = group / solution; Random intercept / subject=id v=4 vcorr=4; Run;
160
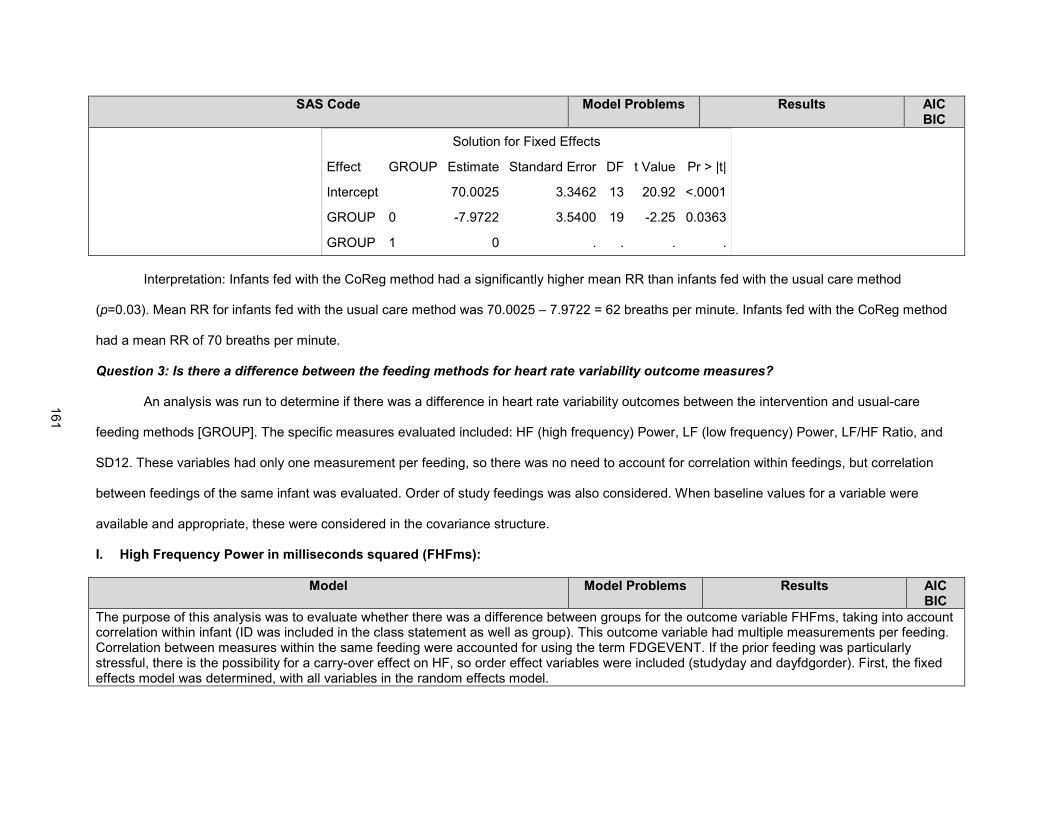
SAS Code Model Problems Results AIC BIC
Solution for Fixed Effects
Effect GROUP Estimate Standard Error DF t Value Pr > |t|
Intercept 70.0025 3.3462 13 20.92 <.0001
GROUP 0 -7.9722 3.5400 19 -2.25 0.0363
GROUP 1 0 . . . .
Interpretation: Infants fed with the CoReg method had a significantly higher mean RR than infants fed with the usual care method
(p=0.03). Mean RR for infants fed with the usual care method was 70.0025 – 7.9722 = 62 breaths per minute. Infants fed with the CoReg method
had a mean RR of 70 breaths per minute.
Question 3: Is there a difference between the feeding methods for heart rate variability outcome measures?
An analysis was run to determine if there was a difference in heart rate variability outcomes between the intervention and usual-care
feeding methods [GROUP]. The specific measures evaluated included: HF (high frequency) Power, LF (low frequency) Power, LF/HF Ratio, and
SD12. These variables had only one measurement per feeding, so there was no need to account for correlation within feedings, but correlation
between feedings of the same infant was evaluated. Order of study feedings was also considered. When baseline values for a variable were
available and appropriate, these were considered in the covariance structure.
I. High Frequency Power in milliseconds squared (FHFms):
Model Model Problems Results AIC BIC
The purpose of this analysis was to evaluate whether there was a difference between groups for the outcome variable FHFms, taking into account correlation within infant (ID was included in the class statement as well as group). This outcome variable had multiple measurements per feeding. Correlation between measures within the same feeding were accounted for using the term FDGEVENT. If the prior feeding was particularly stressful, there is the possibility for a carry-over effect on HF, so order effect variables were included (studyday and dayfdgorder). First, the fixed effects model was determined, with all variables in the random effects model.
161

*Model I1; Proc mixed data=hrv covtest method=ML; Class id group; Model FHFms=group studyday dayfdgorder fdgevent / solution; Random intercept group studyday dayfdgorder fdgevent / subject=id v=8 vcorr=8; Run;
Estimated G matrix is not positive definite. Model overparametized; not able to estimate.
GROUP 0.2368
STUDYDAY .
DAYFDGORDER .
FDGEVENT .
641.2 643.7
*Model I2; Proc mixed data=hrv covtest method=ML; Class id group; Model FHFms=group studyday dayfdgorder / solution; Random intercept group studyday dayfdgorder fdgevent / subject=id v=8 vcorr=8; Run;
Estimated G matrix is not positive definite.
GROUP 0.2368
STUDYDAY 0.8380
DAYFDGORDER 0.8393
647.2 651.7
*Model I3; Proc mixed data=hrv covtest method=ML; Class id group; Model FHFms=group studyday fdgevent / solution; Random intercept group studyday dayfdgorder fdgevent / subject=id v=8 vcorr=8; Run;
Estimated G matrix is not positive definite.
GROUP 0.2368
STUDYDAY 0.7739
FDGEVENT .
647.2 651.7
*Model I4; Proc mixed data=hrv covtest method=ML; Class id group; Model FHFms=group dayfdgorder fdgevent / solution; Random intercept group studyday dayfdgorder fdgevent / subject=id v=8 vcorr=8; Run;
Estimated G matrix is not positive definite.
GROUP 0.2368
DAYFDGORDER 0.7815
FDGEVENT .
647.2 651.7
*Model I5; Proc mixed data=hrv covtest method=ML; Class id group; Model FHFms=group studyday / solution; Random intercept group studyday dayfdgorder fdgevent / subject=id v=8 vcorr=8; Run;
Estimated G matrix is not positive definite.
GROUP 0.2384
STUDYDAY 0.8266
645.2 649.1
162

*Model I6; Proc mixed data=hrv covtest method=ML; Class id group; Model FHFms=group dayfdgorder / solution; Random intercept group studyday dayfdgorder fdgevent / subject=id v=8 vcorr=8; Run;
Estimated G matrix is not positive definite.
GROUP 0.2385
DAYFDGORDER 0.8286
645.2 649.1
*Model I7; Proc mixed data=hrv covtest method=ML; Class id group; Model FHFms=group fdgevent / solution; Random intercept group studyday dayfdgorder fdgevent / subject=id v=8 vcorr=8; Run;
Estimated G matrix is not positive definite.
GROUP 0.2438
FDGEVENT .
645.3 649.1
*Model I8; Proc mixed data=hrv covtest method=ML; Class id group; Model FHFms=group / solution; Random intercept group studyday dayfdgorder fdgevent / subject=id v=8 vcorr=8; Run;
Estimated G matrix is not positive definite.
GROUP 0.2450
643.3 646.5
Model I1 had the best AIC/BIC scores, but was overparametized. All of the models had an “estimated G matrix not positive definite.” Of the models that were not overparametized, model I8 had the best AIC/BIC scores. Use this fixed effects model and determine the random effects model.
*Model I9; Proc mixed data=hrv covtest method=ML; Class id group; Model FHFms=group / solution; Random intercept group studyday dayfdgorder / subject=id v=8 vcorr=8; Run;
Estimated G matrix is not positive definite.
GROUP 0.2450
643.3 646.5
*Model I10; Proc mixed data=hrv covtest method=ML; Class id group; Model FHFms=group / solution; Random intercept group studyday fdgevent / subject=id v=8 vcorr=8; Run;
Estimated G matrix is not positive definite.
GROUP 0.2448
643.3 646.5
163
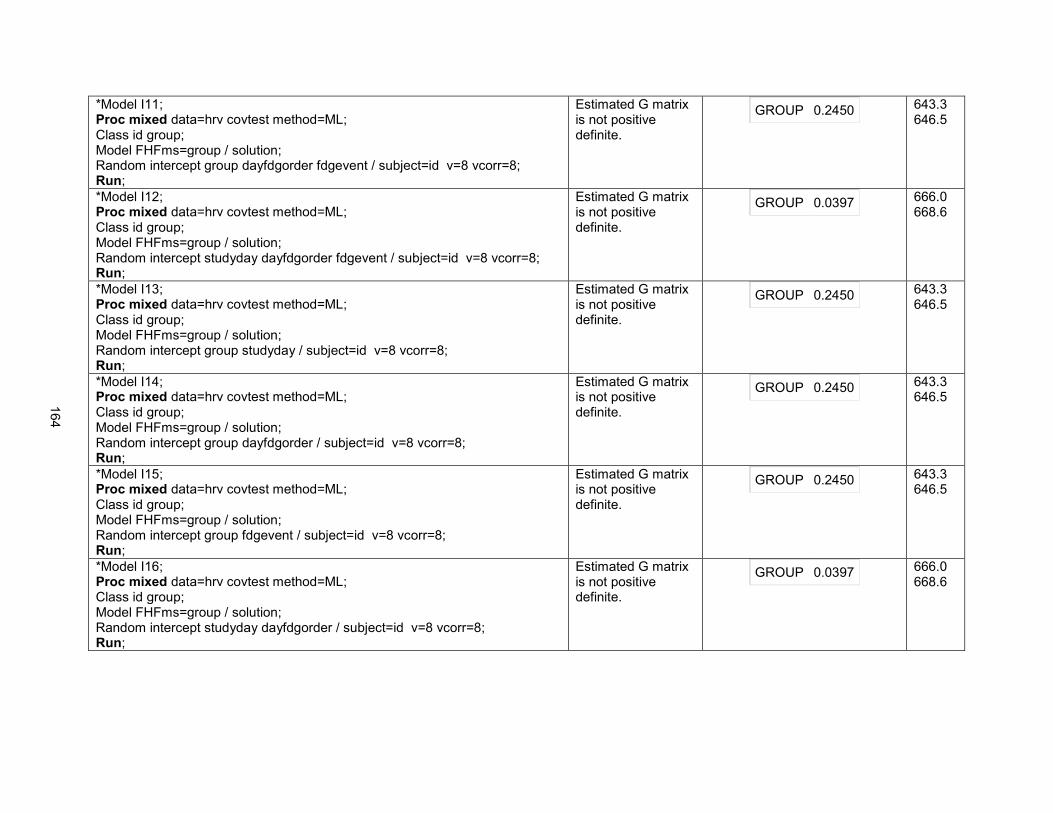
*Model I11; Proc mixed data=hrv covtest method=ML; Class id group; Model FHFms=group / solution; Random intercept group dayfdgorder fdgevent / subject=id v=8 vcorr=8; Run;
Estimated G matrix is not positive definite.
GROUP 0.2450
643.3 646.5
*Model I12; Proc mixed data=hrv covtest method=ML; Class id group; Model FHFms=group / solution; Random intercept studyday dayfdgorder fdgevent / subject=id v=8 vcorr=8; Run;
Estimated G matrix is not positive definite.
GROUP 0.0397
666.0 668.6
*Model I13; Proc mixed data=hrv covtest method=ML; Class id group; Model FHFms=group / solution; Random intercept group studyday / subject=id v=8 vcorr=8; Run;
Estimated G matrix is not positive definite.
GROUP 0.2450
643.3 646.5
*Model I14; Proc mixed data=hrv covtest method=ML; Class id group; Model FHFms=group / solution; Random intercept group dayfdgorder / subject=id v=8 vcorr=8; Run;
Estimated G matrix is not positive definite.
GROUP 0.2450
643.3 646.5
*Model I15; Proc mixed data=hrv covtest method=ML; Class id group; Model FHFms=group / solution; Random intercept group fdgevent / subject=id v=8 vcorr=8; Run;
Estimated G matrix is not positive definite.
GROUP 0.2450
643.3 646.5
*Model I16; Proc mixed data=hrv covtest method=ML; Class id group; Model FHFms=group / solution; Random intercept studyday dayfdgorder / subject=id v=8 vcorr=8; Run;
Estimated G matrix is not positive definite.
GROUP 0.0397
666.0 668.6
164

*Model I17; Proc mixed data=hrv covtest method=ML; Class id group; Model FHFms=group / solution; Random intercept studyday fdgevent / subject=id v=8 vcorr=8; Run;
Estimated G matrix is not positive definite.
GROUP 0.0397
666.0 668.6
*Model I18; Proc mixed data=hrv covtest method=ML; Class id group; Model FHFms=group / solution; Random intercept dayfdgorder fdgevent / subject=id v=8 vcorr=8; Run;
Estimated G matrix is not positive definite.
GROUP 0.0397
666.0 668.6
*Model I19; Proc mixed data=hrv covtest method=ML; Class id group; Model FHFms=group / solution; Random intercept group / subject=id v=8 vcorr=8; Run;
None GROUP 0.2449
643.3 646.5
*Model I20; Proc mixed data=hrv covtest method=ML; Class id group; Model FHFms=group / solution; Random intercept studyday / subject=id v=8 vcorr=8; Run;
Estimated G matrix is not positive definite.
GROUP 0.0383
666.0 668.6
*Model I21; Proc mixed data=hrv covtest method=ML; Class id group; Model FHFms=group / solution; Random intercept dayfdgorder / subject=id v=8 vcorr=8; Run;
Estimated G matrix is not positive definite.
GROUP 0.0386
666.0 668.6
*Model I22; Proc mixed data=hrv covtest method=ML; Class id group; Model FHFms=group / solution; Random intercept fdgevent / subject=id v=8 vcorr=8; Run;
Estimated G matrix is not positive definite.
GROUP 0.0388
666.0 668.6
165

*Model I23; Proc mixed data=hrv covtest method=ML; Class id group; Model FHFms=group / solution; Random intercept / subject=id v=8 vcorr=8; Run;
None. GROUP 0.0374
666.0 668.6
*Model I24; Proc mixed data=hrv covtest method=ML; Class id group; Model FHFms=group / solution; Random group / subject=id v=8 vcorr=8; Run;
None. GROUP 0.2337
641.3 643.9
Model I24 had the best AIC/BIC scores. This model was used to run a residual analysis to evaluate the data for outliers.
*Model I24 with residual analysis; Proc mixed data=hrv covtest method=ML; Class id group; Model FHFms=group / solution outpm=residls vciry; Random group / subject=id v=8 vcorr=8; Run; data residls; set residls; label pred="Predicted Value" scaledresid="Scaled Residual"; format pred scaledresid 7.2; run;
Outliers present outside of +/- 3.
166

Since there were outliers outside of +/- 3, the data was transformed, first using the square root.
*Square Root Transformation; %let ypower=0.5; data adjusted; set hrv; ytrans=fhfms**&ypower; label ytrans="FHFms to Power &ypower"; run; *Model I24 Square Root Transformed; Proc mixed data=adjusted covtest method=ML; Class id group; Model ytrans=group / solution outpm=residls vciry; Random group / subject=id v=8 vcorr=8; Run;
None GROUP 0.1864
There were still outliers outside of +/- 3.
167

Since there were still outliers, a log transformation was used.
*Model I24 with Log transformation; data adjusted; set hrv; ytrans=log(fhfms); label ytrans="FHFms to Log"; run; Proc mixed data=adjusted covtest method=ML; Class id group; Model ytrans=group / solution outpm=residls vciry; Random group / subject=id v=8 vcorr=8; Run;
None GROUP 0.2662
No outliers outside of +/- 3.
168

Interpretation: There was not a significant difference between the two feeding methods for HF Power (p=0.26). The estimates for HF Power (ms2)
were for the usual care group 16.1180+6.8023=22.92 and for infants fed with the CoReg method 6.80.
J. Low Frequency Power in milliseconds squared [FLFms]:
Model I24 was used to estimate group values for HF Power.
Solution for Fixed Effects
Effect GROUP Estimate Standard Error DF t Value Pr > |t|
Intercept 6.8023 10.0136 22 0.68 0.5040
GROUP 0 16.1180 13.1613 22 1.22 0.2337
GROUP 1 0 . . . .
Model Model Problems Results AIC BIC
The purpose of this analysis was to evaluate whether there was a difference between groups for the outcome variable FLFms, taking into account correlation within infant (ID was included in the class statement as well as group). This outcome variable had multiple measurements per feeding. Correlation between measures within the same feeding were accounted for using the term FDGEVENT. If the prior feeding was particularly stressful, there is the possibility for a carry-over effect on HF, so order effect variables were included (studyday and dayfdgorder). The random effects model identified from the analysis of FHFms was used. The fixed effects model was determined.
169

*Model J1; Proc mixed data=hrv covtest method=ML; Class id group; Model FLFms=group studyday dayfdgorder fdgevent / solution; Random intercept group / subject=id v=4 vcorr=4; Run;
Estimated G matrix not positive definite. Model overparameterized.
GROUP 0.3192
STUDYDAY .
DAYFDGORDER .
FDGEVENT .
1079.8 1081.7
*Model J2; Proc mixed data=hrv covtest method=ML; Class id group; Model FLFms=group studyday dayfdgorder / solution; Random intercept group / subject=id v=4 vcorr=4; Run;
Estimated G matrix not positive definite.
GROUP 0.3192
STUDYDAY 0.3606
DAYFDGORDER 0.7012
1085.8 1089.6
*Model J3; Proc mixed data=hrv covtest method=ML; Class id group; Model FLFms=group studyday fdgevent / solution; Random intercept group / subject=id v=4 vcorr=4; Run;
Estimated G matrix not positive definite.
GROUP 0.3192
STUDYDAY 0.9303
FDGEVENT 0.7012
1085.8 1089.6
*Model J4; Proc mixed data=hrv covtest method=ML; Class id group; Model FLFms=group dayfdgorder fdgevent / solution; Random intercept group / subject=id v=4 vcorr=4; Run;
Estimated G matrix not positive definite.
GROUP 0.3192
DAYFDGORDER 0.9303
FDGEVENT 0.3606
1085.8 1089.6
*Model J5; Proc mixed data=hrv covtest method=ML; Class id group; Model FLFms=group studyday / solution; Random intercept group / subject=id v=4 vcorr=4; Run;
Estimated G matrix not positive definite.
GROUP 0.3045
STUDYDAY 0.3797
1083.9 1087.1
*Model J6; Proc mixed data=hrv covtest method=ML; Class id group; Model FLFms=group dayfdgorder / solution; Random intercept group / subject=id v=4 vcorr=4; Run;
Estimated G matrix not positive definite.
GROUP 0.3510
DAYFDGORDER 0.7673
1084.6 1087.8
*Model J7; Proc mixed data=hrv covtest method=ML; Class id group;
Estimated G matrix not positive definite.
GROUP 0.3211
FDGEVENT 0.3308
1083.8 1087
170

Model FLFms=group fdgevent / solution; Random intercept group / subject=id v=4 vcorr=4; Run;
*Model J8; Proc mixed data=hrv covtest method=ML; Class id group; Model FLFms=group / solution; Random intercept group / subject=id v=4 vcorr=4; Run;
Estimated G matrix not positive definite.
GROUP 0.3373
1082.6 1085.2
Model J8 had the best AIC/BIC scores of the models above, with the except of model J1, which was overparameterized. Since model J8 still got an error message stating the estimated G matrix was not positive definite, the random effects model was simplified.
*Model J9; Proc mixed data=hrv covtest method=ML; Class id group; Model FLFms=group / solution; Random intercept / subject=id v=4 vcorr=4; Run;
None GROUP 0.0792
1099.8 1102.3
Next, the data were evaluated for outliers using a residual analysis.
*Model J9 with residual analysis; Proc mixed data=hrv covtest method=ML; Class id group; Model FLFms=group / solution outpm=residls vciry; Random intercept / subject=id v=4 vcorr=4; Run; data residls; set residls; label pred="Predicted Value" scaledresid="Scaled Residual"; format pred scaledresid 7.2; run;
There are outliers outside of +/- 3.
171
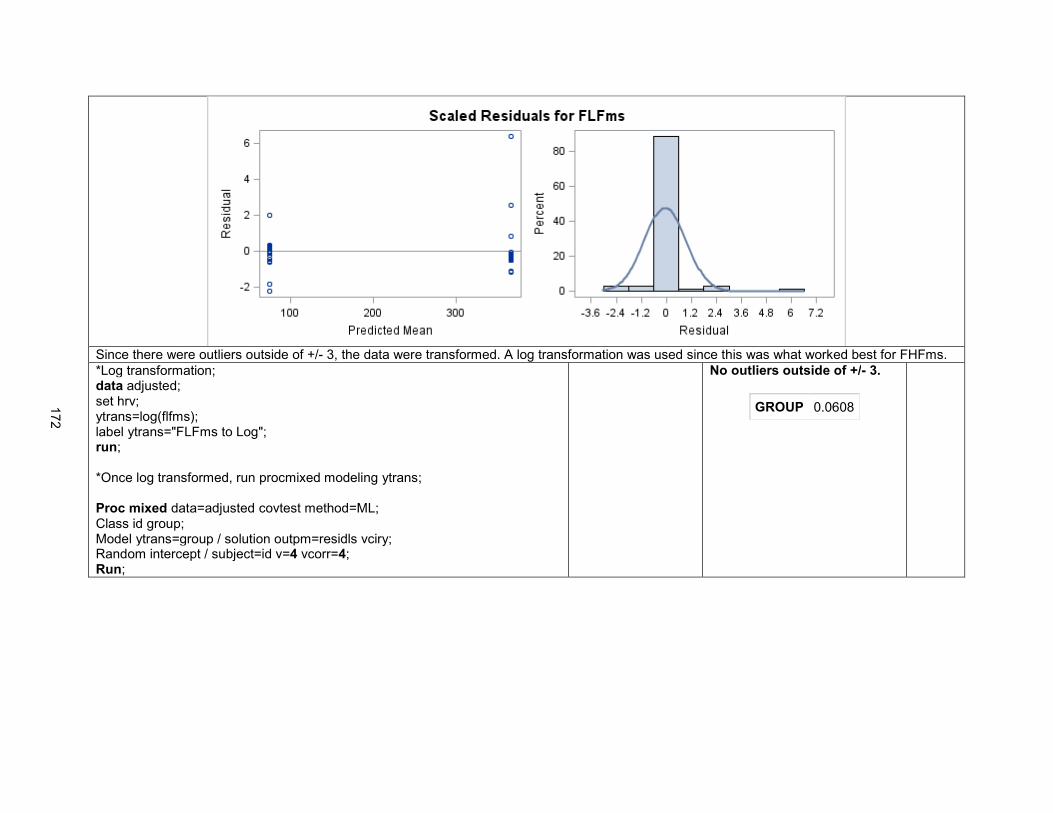
Since there were outliers outside of +/- 3, the data were transformed. A log transformation was used since this was what worked best for FHFms.
*Log transformation; data adjusted; set hrv; ytrans=log(flfms); label ytrans="FLFms to Log"; run; *Once log transformed, run procmixed modeling ytrans; Proc mixed data=adjusted covtest method=ML; Class id group; Model ytrans=group / solution outpm=residls vciry; Random intercept / subject=id v=4 vcorr=4; Run;
No outliers outside of +/- 3.
GROUP 0.0608
172

Interpretation: There was no significant difference between the two feeding methods for LF Power, although there was a trend toward significance
(p=0.06). Infants fed with the usual care group had LF Power 75.1561 + 290.90 = 366.06 ms2 and infants fed with the CoReg method had LF
Power of 75.16 ms2. If LF Power is an indicator of increased sympathetic input (i.e., more stress), then these results suggest that infants fed with
the CoReg method had less sympathetic input (i.e., less stress).
Model J9 was used to estimate values for FLFms for the two groups.
Solution for Fixed Effects
Effect GROUP Estimate Standard Error DF t Value Pr > |t|
Intercept 75.1561 157.14 13 0.48 0.6404
GROUP 0 290.90 162.60 54 1.79 0.0792
GROUP 1 0 . . . .
173

K. Low Frequency to High Frequency Ratio [FLFtoHFRatioms]:
Model Model Problems Results AIC BIC
The purpose of this analysis was to evaluate whether there was a difference between groups for the outcome variable FLFtoHFRatioms, taking into account correlation within infant (ID was included in the class statement as well as group). This outcome variable had multiple measurements per feeding. Correlation between measures within the same feeding were accounted for using the term FDGEVENT. If the prior feeding was particularly stressful, there is the possibility for a carry-over effect on LF/HF ratio, so order effect variables were included (studyday and dayfdgorder). The random effects model identified from the analysis of FHFms was used. The fixed effects model was determined.
*Model K1; Proc mixed data=hrv covtest method=ML; Class id group; Model FLFtoHFRatioms=group studyday dayfdgorder fdgevent / solution; Random intercept group / subject=id v=4 vcorr=4; Run;
Estimated G matrix not positive definite. Model overparameterized.
GROUP 0.9425
STUDYDAY .
DAYFDGORDER .
FDGEVENT .
515.7 517.6
*Model K2; Proc mixed data=hrv covtest method=ML; Class id group; Model FLFtoHFRatioms=group studyday dayfdgorder / solution; Random intercept group / subject=id v=4 vcorr=4; Run;
Estimated G matrix not positive definite.
GROUP 0.9425
STUDYDAY 0.8683
DAYFDGORDER 0.3873
521.7 525.5
*Model K3; Proc mixed data=hrv covtest method=ML; Class id group; Model FLFtoHFRatioms=group studyday fdgevent / solution; Random intercept group / subject=id v=4 vcorr=4; Run;
Estimated G matrix not positive definite.
GROUP 0.9425
STUDYDAY 0.4089
FDGEVENT 0.3873
521.7 525.5
*Model K4; Proc mixed data=hrv covtest method=ML; Class id group; Model FLFtoHFRatioms=group dayfdgorder fdgevent / solution; Random intercept group / subject=id v=4 vcorr=4; Run;
Estimated G matrix not positive definite.
GROUP 0.9425
DAYFDGORDER 0.4089
FDGEVENT 0.8683
521.7 525.5
*Model K5; Proc mixed data=hrv covtest method=ML; Class id group; Model FLFtoHFRatioms=group studyday / solution; Random intercept group / subject=id v=4 vcorr=4; Run;
Estimated G matrix not positive definite.
GROUP 0.9949
STUDYDAY 0.9267
520.4 523.6
174

*Model K6; Proc mixed data=hrv covtest method=ML; Class id group; Model FLFtoHFRatioms=group dayfdgorder / solution; Random intercept group / subject=id v=4 vcorr=4; Run;
Estimated G matrix not positive definite.
GROUP 0.9695
DAYFDGORDER 0.3940
519.7 522.9
*Model K7; Proc mixed data=hrv covtest method=ML; Class id group; Model FLFtoHFRatioms=group fdgevent / solution; Random intercept group / subject=id v=4 vcorr=4; Run;
Estimated G matrix not positive definite.
GROUP 0.9483
FDGEVENT 0.7938
520.3 523.5
*Model K8; Proc mixed data=hrv covtest method=ML; Class id group; Model FLFtoHFRatioms=group / solution; Random intercept group / subject=id v=4 vcorr=4; Run;
Estimated G matrix not positive definite.
GROUP 0.9793
518.4 520.9
Model K8 had the best AIC/BIC scores of the above models that were not overparameterized. Since the G matrix was not positive definite, the random effects model was simplified.
*Model K9; Proc mixed data=hrv covtest method=ML; Class id group; Model FLFtoHFRatioms=group / solution; Random intercept / subject=id v=4 vcorr=4; Run;
None
GROUP 0.9788
518.4 520.9
Model K9 did not have any model problems and had the same AIC/BIC as model K8. This model was used to run a residual analysis.
*Model K9 with residual analysis; Proc mixed data=hrv covtest method=ML; Class id group; Model FLFtoHFRatioms=group / solution outpm=residls vciry; Random intercept / subject=id v=4 vcorr=4; Run; data residls; set residls; label pred="Predicted Value" scaledresid="Scaled Residual"; format pred scaledresid 7.2; run;
None There are outliers outside of +/- 3.
175
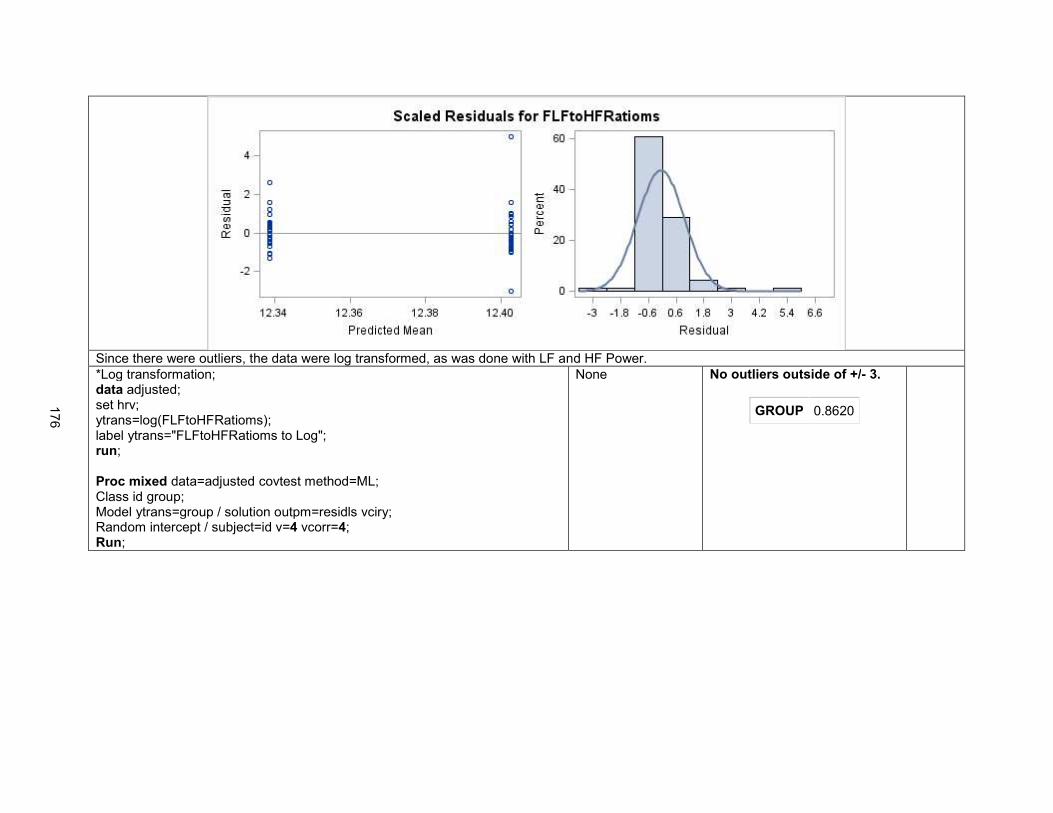
Since there were outliers, the data were log transformed, as was done with LF and HF Power.
*Log transformation; data adjusted; set hrv; ytrans=log(FLFtoHFRatioms); label ytrans="FLFtoHFRatioms to Log"; run; Proc mixed data=adjusted covtest method=ML; Class id group; Model ytrans=group / solution outpm=residls vciry; Random intercept / subject=id v=4 vcorr=4; Run;
None No outliers outside of +/- 3.
GROUP 0.8620
176

Interpretation: There was no significant difference in LF to HF Ratio between the two feeding methods (p=0.86). The LF to HF Ratio for infants fed
with the usual care method was 12.3387 + 0.06399 = 12.4 and for the CoReg method was 12.34.
Model K9 was used to estimate values for LF/HF Ratio for the groups.
Solution for Fixed Effects
Effect GROUP Estimate Standard Error DF t Value Pr > |t|
Intercept 12.3387 2.4233 13 5.09 0.0002
GROUP 0 0.06399 2.3936 54 0.03 0.9788
GROUP 1 0 . . . .
177

L. SD12:
SAS Code Model Problems Results AIC BIC
The purpose of this analysis was to evaluate whether there was a difference between groups for the outcome variable SD12, taking into account correlation within infant (ID was included in the class statement as well as group). This outcome variable had only one measurement per feeding. If the prior feeding was particularly stressful, there is the possibility for a carry-over effect on SD12, so order effect variables were included (studyday and dayfdgorder). First, the fixed effects model was determined, with all variables in the random effects model.
*Model L1; Proc mixed data=hrv covtest method=ML; Class id group; Model SD12=group studyday dayfdgorder / solution; Random intercept group studyday dayfdgorder / subject=id v=4 vcorr=4; Run;
None GROUP 0.0417
STUDYDAY 0.9026
DAYFDGORDER 0.4528
-48.7 -43.6
*Model L2; Proc mixed data=hrv covtest method=ML; Class id group; Model SD12=group studyday / solution; Random intercept group studyday dayfdgorder / subject=id v=4 vcorr=4; Run;
None GROUP 0.0496
STUDYDAY 0.9079
-50.2 -45.7
*Model L3; Proc mixed data=hrv covtest method=ML; Class id group; Model SD12=group dayfdgorder / solution; Random intercept group studyday dayfdgorder / subject=id v=4 vcorr=4; Run;
None GROUP 0.0384
DAYFDGORDER 0.4536
-50.7 -46.2
*Model L4; Proc mixed data=hrv covtest method=ML; Class id group; Model SD12=group / solution; Random intercept group studyday dayfdgorder / subject=id v=4 vcorr=4; Run;
None GROUP 0.0495
-52.2 -48.3
Model L4 had the best AIC/BIC scores. Use this fixed effects model and now determine the random effects model.
*Model L5; Proc mixed data=hrv covtest method=ML; Class id group; Model SD12=group / solution; Random intercept group studyday / subject=id v=4 vcorr=4;
None GROUP 0.0510
-54 -50.8
178

SAS Code Model Problems Results AIC BIC
Run;
*Model L6; Proc mixed data=hrv covtest method=ML; Class id group; Model SD12=group / solution; Random intercept group dayfdgorder / subject=id v=4 vcorr=4; Run;
None
GROUP 0.0495
-52.2 -48.3
*Model L7; Proc mixed data=hrv covtest method=ML; Class id group; Model SD12=group / solution; Random intercept studyday dayfdgorder / subject=id v=4 vcorr=4; Run;
None GROUP 0.2418
-53.8 -50.6
*Model L8; Proc mixed data=hrv covtest method=ML; Class id group; Model SD12=group / solution; Random intercept group / subject=id v=4 vcorr=4; Run;
None GROUP 0.0510
-54 -50.8
*Model L9; Proc mixed data=hrv covtest method=ML; Class id group; Model SD12=group / solution; Random intercept studyday / subject=id v=4 vcorr=4; Run;
None GROUP 0.0332
-55.8 -53.2
*Model L10; Proc mixed data=hrv covtest method=ML; Class id group; Model SD12=group / solution; Random intercept dayfdgorder / subject=id v=4 vcorr=4; Run;
None GROUP 0.0367
-53.8 -50.6
*Model L11; Proc mixed data=hrv covtest method=ML; Class id group; Model SD12=group / solution; Random intercept / subject=id v=4 vcorr=4; Run;
None GROUP 0.0233
-55.8 -53.2
Model L11 is the most parsimonious model with the best AIC/BIC scores. A residual analysis was run to evaluate the data for outliers.
179

SAS Code Model Problems Results AIC BIC
*Model L11 with residual analysis; Proc mixed data=hrv covtest method=ML; Class id group; Model SD12=group / solution outpm=residls vciry; Random intercept / subject=id v=4 vcorr=4; data residls; set residls; label pred="Predicted Value" scaledresid="Scaled Residual"; format pred scaledresid 7.2; run;
None There were outliers outside of +/- 3.
The data were log transformed.
*Log transformation; data adjusted; set hrv; ytrans=log(sd12); label ytrans="SD12 to Log"; run; Proc mixed data=adjusted covtest method=ML;
None No outliers outside of +/- 3.
GROUP 0.0407
180

SAS Code Model Problems Results AIC BIC
Class id group; Model ytrans=group / solution outpm=residls vciry; Random intercept group / subject=id v=4 vcorr=4; Run;
The results of model L11 were used to estimate group values.
Solution for Fixed Effects
Effect GROUP Estimate Standard Error DF t Value Pr > |t|
Intercept 0.1878 0.03053 13 6.15 <.0001
GROUP 0 0.06988 0.02832 19 2.47 0.0233
GROUP 1 0 . . . .
Interpretation: Infants fed with the usual care method had a significantly higher SD12 than infants fed with the CoReg method (p=0.04). Infants fed
with the usual care method had an SD12 of 0.06988 + 0.1878 = 0.25768 and infants fed with CoReg had an SD12 of 0.1878.
181

181
REFERENCES
Brazy, J. E., Goldstein, R. F., Oehler, J. M., Gustafson, K. E., & Thompson, R. J., Jr. (1993). Nursery neurobiologic risk score: Levels of risk and relationships with nonmedical factors. Journal of Developmental and Behavioral Pediatrics, 14(6), 375-380. Retrieved from http://journals.lww.com/jrnldbp
Brown, L. (2007). Heart rate variability in premature infants during feeding. Biological Research for
Nursing, 8(4), 283-293. doi: 10.1177/1099800406298542 Chen, C. H., Wang, T. M., Chang, H. M., & Chi, C. S. (2000). The effect of breast- and bottle-feeding on
oxygen saturation and body temperature in preterm infants. Journal of Human Lactation, 16(1), 21-27. doi: 10.1177/089033440001600105
Clark, L., Kennedy, G., Pring, T., & Hird, M. (2007). Improving bottle feeding in preterm infants:
Investigating the elevated side-lying position. Infant, 3(4), 154-158. Retrieved from http://www.neonatal-nursing.co.uk/
Cohen, M., Brown, D. R., & Myers, M. M. (2009). Cardiorespiratory measures before and after feeding
challenge in term infants are related to birth weight. Acta Paediatrica, 98(7), 1183-1188. doi: 10.1111/j.1651-2227.2009.01284.x
Dawson, J. A., Myers, L. R., Moorhead, A., Jacobs, S. E., Ong, K., Salo, F., et al. (2013). A randomised
trial of two techniques for bottle feeding preterm infants. Journal of Paediatrics and Child Health, 49(6), 462-466. doi: 10.1111/jpc.12208
DiPietro, J. A., Larson, S. K., & Porges, S. W. (1987). Behavioral and heart rate pattern differences
between breast-fed and bottle-fed neonates. Developmental Psychology, 23(4), 467-474. doi: 10.1037/0012-1649.23.4.467.
DiPietro, J. A., & Porges, S. W. (1991). Vagal responsiveness to gavage feeding as an index of preterm
status. Pediatric Research, 29(3), 231-236. doi: 10.1203/00006450-199103000-00003 Grossman, P., & Taylor, E. W. (2007). Toward understanding respiratory sinus arrhythmia: Relations to
cardiac vagal tone, evolution and biobehavioral functions. Biological Psychology, 74(2), 263-285. doi: 10.1016/j.biopsycho.2005.11.014
Hanlon, M. B., Tripp, J. H., Ellis, R. E., Flack, F. C., Selley, W. G., & Shoesmith, H. J. (1997). Deglutition
apnoea as indicator of maturation of suckle feeding in bottle-fed preterm infants. Developmental Medicine & Child Neurology, 39(8), 534-542. doi: 10.1111/j.1469-8749.1997.tb07482.x
Harrison, T. M. (2011). Trajectories of parasympathetic nervous system function before, during, and after
feeding in infants with transposition of the great arteries. Nursing Research, 60(3 Suppl), S15-27. doi: 10.1097/NNR.0b013e31821600b1
Harrison, T. M., & Brown, R. L. (2012). Autonomic nervous system function in infants with transposition of
the great arteries. Biological Research For Nursing, 14(3), 257-268. doi: 10.1177/1099800411407687
Kleiger, R. E., Stein, P. K., & Bigger, J. T., Jr. (2005). Heart rate variability: Measurement and clinical
utility. Annals of Noninvasive Electrocardiology, 10(1), 88-101. doi: 10.1111/j.1542-474X.2005.10101.x

182
Lappi, H., Valkonen-Korhonen, M., Georgiadis, S., Tarvainen, M. P., Tarkka, I. M., Karjalainen, P. A., et al. (2007). Effects of nutritive and non-nutritive sucking on infant heart rate variability during the first 6 months of life. Infant Behavior and Development, 30(4), 546-556. doi: 10.1016/j.infbeh.2007.04.005
Malik, M., Bigger, J. T., Camm, A. J., Kleiger, R. E., Malliani, A., Moss, A. J., et al. (1996). Heart rate
variability: Standards of measurement, physiological interpretation, and clinical use. European Heart Journal, 17(3), 354-381. Retrieved from http://eurheartj.oxfordjournals.org
Mathew, O. P. (1991). Breathing patterns of preterm infants during bottle feeding: Role of milk flow.
Journal of Pediatrics, 119(6), 960-965. doi: 10.1016/S0022-3476(05)83056-2 McCain, G. C., Fuller, E. O., & Gartside, P. S. (2005). Heart rate variability and feeding bradycardia in
healthy preterm infants during transition from gavage to oral feeding. Newborn & Infant Nursing Reviews, 5(3), 124-132. doi: 10.1053/j.nainr.2005.04.005
McCain, G. C., & Gartside, P. S. (2002). Behavioral Responses of Preterm Infants to a Standard-Care
and Semi-Demand Feeding Protocol. Newborn & Infant Nursing Reviews, 2(3), 187-193. doi: 10.1053/nbin.2002.35124
McCain, G. C., Knupp, A. M., Fontaine, J. L., Pino, L. D., & Vasquez, E. P. (2010). Heart rate variability
responses to nipple feeding for preterm infants with bronchopulmonary dysplasia: Three case studies. Journal of Pediatric Nursing, 25(3), 215-220. doi: 10.1016/j.pedn.2009.01.009
Park, J., Thoyre, S., Knafl, G. J., Hodges, E. A., & Nix, W. B. (2014). Efficacy of semielevated side-lying
positioning during bottle-feeding of very preterm infants: A pilot study. Journal of Perinatal & Neonatal Nursing, 28(1), 69-79. doi: 10.1097/JPN.0000000000000004
Porges, S. W. (1995). Orienting in a defensive world: Mammalian modifications of our evolutionary
heritage. A polyvagal theory. Psychophysiology, 32(4), 301-318. Retrieved from http://www.blackwellpublishing.com/journal.asp?ref=0048-5772.
Portales, A. L., Porges, S. W., Doussard-Roosevelt, J. A., Abedin, M., Lopez, R., Young, M. A., et al.
(1997). Vagal regulation during bottle feeding in low-birthweight neonates: Support for the gustatory-vagal hypothesis. Developmental Psychobiology, 30(3), 225-233. doi: 10.1002/(SICI)1098-2302(199704)30:3<225::AID-DEV5>3.0.CO;2-R
Powers, S. K., & Howley, E. T. (2009). Exercise physiology: Theory and application to fitness and
performance. Boston: McGraw-Hill. Pumprla, J., Howorka, K., Groves, D., Chester, M., & Nolan, J. (2002). Functional assessment of heart
rate variability: Physiological basis and practical applications. International Journal of Cardiology, 84(1), 1-14. doi: S0167527302000578
Stein, P. K., Domitrovich, P. P., Hui, N., Rautaharju, P., & Gottdiener, J. (2005). Sometimes higher heart
rate variability is not better heart rate variability: Results of graphical and nonlinear analyses. Journal of Cardiovascular Electrophysiology, 16(9), 954-959. doi: 10.1111/j.1540-8167.2005.40788.x
Stein, P. K., & Reddy, A. (2005). Non-linear heart rate variability and risk stratification in cardiovascular
disease. Indian Pacing and Electrophysiology Journal, 5(3), 210-220. doi: 10.1111/j.1540-8167.2005.40788.x

183
Suess, P. E., Alpan, G., Dulkerian, S. J., Doussard-Roosevelt, J., Porges, S. W., & Gewolb, I. H. (2000). Respiratory sinus arrhythmia during feeding: A measure of vagal regulation of metabolism, ingestion, and digestion in preterm infants. Developmental Medicine & Child Neurology, 42(3), 169-173. doi: 10.1111/j.1469-8749.2000.tb00065.x
Thoyre, S. M., Holditch-Davis, D., Schwartz, T. A., Melendez Roman, C. R., & Nix, W. (2012).
Coregulated approach to feeding preterm infants with lung disease: Effects during feeding. Nursing Research, 61(4), 242-251. doi: 10.1097/NNR.0b013e31824b02ad

184
CHAPTER 5: DISCUSSION
The research presented in the three studies that compose this dissertation add significantly to the
literature on feeding medically fragile infants. In chapter two, the milk flow rates and variability in milk flow
from 29 types of bottle nipples used in hospitals for feeding medically fragile infants was presented. This
data is highly relevant to clinical practice as it may help guide clinicians in choosing appropriate nipples
for supporting safe oral feeding in medically fragile infants. The information gained in this study also
guided the selection of the bottle nipples for the study of feeding an infant with hypoplastic left heart
syndrome (HLHS), which was presented in chapter three.
Chapter three presented the first of its kind study of the physiologic and behavioral responses of
an infant with HLHS to the challenge of oral feeding with either a standard-flow or slow-flow nipple. The
results of this study suggest that despite a slow-flow nipple, this infant experienced significant distress
during oral feeding. This data confirms anecdotal evidence from clinicians that infants with HLHS
experience significant distress during feeding. This study supports the need for further investigation into
the responses of infants with HLHS to oral feeding and the identification of oral feeding interventions for
this extremely fragile population.
Finally, chapter four presented a study evaluating heart rate variability (HRV) as a new outcome
measure for assessing feeding-related stress. The findings of this study were not conclusive regarding
the usefulness of HRV for this purpose, but support further evaluation of this measure, particularly non-
linear methods of HRV analysis. The findings were also supportive of a gentle, co-regulated approach to
feeding, which involved a side-lying position, minimal stimulation, and enhanced auditory assessment by
the feeder of the infant’s swallowing and breathing. This feeding technique may prove useful for other
populations of medically fragile infants, like infants with HLHS.
Future Directions For Research
Mastering oral feeding is usually a criteria for discharge from the hospital for medically fragile
infants. The study presented in chapter two will help to guide clinicians in choosing bottle nipples that will

185
be supportive of these fragile infants while in the hospital, but the transition to home is often a difficult
one. The nipples that are available in the hospital are typically single-use nipples that are supplied to the
hospital by formula companies (e.g., Enfamil and Similac). These nipples are not readily available for
purchase outside of the hospital, so parents must make decisions about which nipples to purchase for
use at home. While there are abundant options, there is currently no data available on the milk flow rates
of bottle nipples used for feeding infants after discharge. To build upon the data presented in chapter two,
a study will be conducted to test milk flow rates of bottle nipples available in the community setting. This
data will help clinicians to guide parents in selecting a bottle nipple that will be of similar flow to that with
which the infant has been successful in the hospital.
Further study of the responses of infants with HLHS to oral feeding is critically needed. The
results of the study presented in chapter three suggest that an even slower-flow nipple than was used in
the study may be more appropriate for these fragile infants. Given their fragile physiologic state and
multiple risk factors for feeding difficulty, it is likely that a combination of interventions will be most
successful in supporting oral feeding. A study of a larger sample of infants with HLHS using a
combination of a slower-flow nipple (e.g., Dr. Brown’s Ultra-Preemie) and a gentle, co-regulated approach
to feeding, such as that used in the study presented in chapter four, would be a valuable future study in
this population. Additionally, a study evaluating the physiologic and behavioral responses to breast-
feeding in infants with HLHS is needed. Using HRV as an outcome measure in these studies may provide
additional information about the stress responses of these infants to different feeding methods.
Further evaluation of the use of HRV as an outcome measure is also needed. An analysis of the
HRV outcomes of the data presented in chapter three will be conducted to contribute to the development
of this potential outcome measure and to assess the nervous system response to the different flow
conditions. Secondary analyses of HRV outcomes are also planned for data from a study that evaluated
the effect of side-lying positioning in preterm infants (Park, Thoyre, Knafl, Hodges, & Nix, 2014) and a
larger study of the co-regulated approach to feeding preterm infants (Thoyre, NIH, Grant Number R21
NR012507).
Both populations of medically fragile infants that were included in this dissertation are at risk for
long-term feeding difficulty. The Feeding Flock Feeding Interest Group at the University of North Carolina

186
at Chapel Hill, including Suzanne Thoyre, Jinhee Park, Hayley Estrem, Eric Hodges, Cara McComish,
and myself are in the process of developing a set of parent-report instruments that may aid in the early
identification of children with feeding problems and the assessment of the efficacy of treatment
interventions. The Pediatric Eating Assessment Tool (Pedi-EAT) is a measure of problematic feeding
behaviors for children ages 6 months to 7 years (Thoyre, et al., 2014). The Pedi-EAT has been validated
and the Feeding Flock has plans to test this with a large sample of children with feeding problems as well
as those who are typically developing. The Pedi-EAT will be a valuable tool for the long-term follow-up of
children with HLHS and those born preterm as they transition from a liquid diet to solid foods.
Additional measures that are in development include the Child Oral and Motor Proficiency Scale
(ChOMPS), which is a parent-report measure of a child’s skills related to eating and the Family
Management Measure: Feeding (FaMM Feed), which is an adaptation of Knafl and colleagues (2011)
Family Management Measure. The purpose of the FaMM Feed is to assess the family’s approach to
managing their child’s eating problem. The ChOMPS and FaMM Feed have undergone content validity
testing by clinical and research experts in the field of pediatric feeding and plans are underway to further
evaluate the content validity of these measures through cognitive interviewing of experiential experts (i.e.,
parents). These instruments will be useful for the long-term evaluation of the skill acquisition of preterm
infants and those with HLHS as they enter childhood and the ways in which families manage the
challenges of feeding difficulty.

187
REFERENCES
Knafl, K., Deatrick, J. A., Gallo, A., Dixon, J., Grey, M., Knafl, G., et al. (2011). Assessment of the psychometric properties of the Family Management Measure. Journal of Pediatric Psychology, 36(5), 494-505. doi: 10.1093/jpepsy/jsp034
Park, J., Thoyre, S., Knafl, G. J., Hodges, E. A., & Nix, W. B. (2014). Efficacy of semielevated side-lying
positioning during bottle-feeding of very preterm infants: A pilot study. Journal of Perinatal & Neonatal Nursing, 28(1), 69-79. doi: 10.1097/JPN.0000000000000004
Thoyre, S. M., Pados, B. F., Park, J., Estrem, H., Hodges, E. A., McComish, C., et al. (2014).
Development and content validation of the Pediatric Eating Assessment Tool (Pedi-EAT). American Journal of Speech Language Pathology, 23(1), 46-59. doi: 10.1044/1058-0360(2013/12-0069)


![North Carolina register [serial] - NC.gov](https://static.fdokumen.com/doc/165x107/6327f539e491bcb36c0b8a23/north-carolina-register-serial-ncgov.jpg)