Effect of feeding frequency, feeding level and temperature on energy metabolism in Sparus aurata
18
ELSEVIER Aquaculture 148 (1997) 125-142 Effect of feeding frequency, feeding level and temperature on energy metabolism in Sparus aurata J. Guinea a, * , F. Femandez b a Departamento de Fisiologk Fucultud de Biologia, Universidud de Barcelona, Diugonul645. 08071 Barcelona , Spnin b Departamento de Ecologic, Facultud de Biologia, Universidad de Burcelonu, Diagonal 645, 08071 Burcelonu , Spuin Accepted 19 August 1996 Abstract The influences of temperature, ration size and food distribution on the energy metabolism of Sparus aurata were studied by monitoring oxygen consumption. For each factor combination rates of oxygen consumption (Rmean) were partitioned into components, representing resting rates (Rrest) and apparent specific dynamic action rates (Rsda). Maximal hourly rates (Rpeak) were also determined. Feeding led to an increase in oxygen consumption rates which lasted for approximately 37-39 h, with a peak between 1 and 6 h after feeding. The exact time course of the change in oxygen consumption was dependent on temperature, ration size and food distribution. An increase in food intake led to a rise in Rmean, Rsda and Rpeak but not Rrest. For a given ration level, an increase in temperature led to an increase in Rmean, Rrest, Rpeak and Rsda and in the fraction of food energy allocated to metabolism, but did not alter the distribution of such energy into maintenance needs and apparent specific dynamic action (SDA) effects. Keywords: Energy metabolism; Feeding frequency; Feeding level; Temperature; Apparent SDA; Spurus uurutu 1. Introduction In land-based aquaculture, fish respiration leads to a reduction in water oxygen content. In extensive aquaculture, such losses can be replenished by oxygen diffusion * Corresponding author. 0044~8486/97/$17.00 Copyright 0 1997 Elsevier Science B.V. All rights reserved. PII SOO44-8486(96)0 1424-X
-
Upload
independent -
Category
Documents
-
view
0 -
download
0
Transcript of Effect of feeding frequency, feeding level and temperature on energy metabolism in Sparus aurata
ELSEVIER Aquaculture 148 (1997) 125-142
Effect of feeding frequency, feeding level and temperature on energy metabolism in Sparus aurata
J. Guinea a, * , F. Femandez b
a Departamento de Fisiologk Fucultud de Biologia, Universidud de Barcelona, Diugonul645. 08071 Barcelona , Spnin
b Departamento de Ecologic, Facultud de Biologia, Universidad de Burcelonu, Diagonal 645, 08071 Burcelonu , Spuin
Accepted 19 August 1996
Abstract
The influences of temperature, ration size and food distribution on the energy metabolism of Sparus aurata were studied by monitoring oxygen consumption.
For each factor combination rates of oxygen consumption (Rmean) were partitioned into components, representing resting rates (Rrest) and apparent specific dynamic action rates (Rsda). Maximal hourly rates (Rpeak) were also determined.
Feeding led to an increase in oxygen consumption rates which lasted for approximately 37-39 h, with a peak between 1 and 6 h after feeding. The exact time course of the change in oxygen consumption was dependent on temperature, ration size and food distribution.
An increase in food intake led to a rise in Rmean, Rsda and Rpeak but not Rrest. For a given ration level, an increase in temperature led to an increase in Rmean, Rrest, Rpeak and Rsda and in the fraction of food energy allocated to metabolism, but did not alter the distribution of such energy into maintenance needs and apparent specific dynamic action (SDA) effects.
Keywords: Energy metabolism; Feeding frequency; Feeding level; Temperature; Apparent SDA; Spurus uurutu
1. Introduction
In land-based aquaculture, fish respiration leads to a reduction in water oxygen content. In extensive aquaculture, such losses can be replenished by oxygen diffusion
* Corresponding author.
0044~8486/97/$17.00 Copyright 0 1997 Elsevier Science B.V. All rights reserved. PII SOO44-8486(96)0 1424-X
126 J. Guinea, F. Fernandez / Aquaculture 148 (1997) 125-142
from the atmosphere or by oxygen production by algae. However, in intensive aquacul- ture using high fish density, artificial reoxygenation is required either by aeration or by oxygen injection.
In this context it is most useful to know the oxygen consumption rates of the species cultured and how it is affected by factors such as temperature, feeding level and feeding
schedule. The gilthead sea bream Spurus aurutu is a common teleost in the Mediterranean sea,
where it is one of the most commonly used species in aquaculture both in land-based farms and in cages at sea (Le-Breton, 1994). However, there are only a few studies on the effect of temperature on oxygen consumption (Quantz and Tandler, 1984; Lemarie et
al., 19921, and none on the effect of feeding. The effect of temperature on metabolic rate has been widely studied in several
species, although different approximations have been used. It has been studied in fasted
inactive fish (standard metabolism) (Fry and Hart, 1948; Kanungo and Prosser, 1959; Beamish, 19641, in active fish swimming at a controlled speed (Brett, 1964; Beamish,
1970; Soofiani and Priede, 1985; Kaufmann and Wieser, 1992) and in fed fish performing routine activity (Kutty and Mohamed, 1975; Morris and North, 1984; Eccles, 1985; Guinea and Fernandez, 1991). We used this last approximation as we considered
it most representative of the conditions expected in the natural environment The increase in oxygen consumption related to food ingestion, known as specific
dynamic action @DA) or heat increment (HI), has also been studied in several fish species (Muir and Niimi, 1972; Brett, 1976; Jobling and Davies, 1980; Soofiani and Hawkins, 1982; Hamada and Maeda, 1983; LeGrow and Beamish, 1986). Also, several approximations have been used, mainly addressed to separating SDA rates from activity rates (Jobling, 1993). Studies have been conducted in small respirometers to minimize
activity while SDA measurements are performed (Soofiani and Hawkins, 19821, and in flatfishes that have low levels of sporadic activity (Jobling and Davies, 1980). In the present study, we used a respirometer that allowed fish to eat and move freely, and no effort was made to distinguish between energy devoted to SDA or activity, as we were interested in all the energy expenditure (including swimming activity) related to feeding, digestion and metabolism of food. For that reason we use the widely accepted term “apparent SDA’ ’ .
2. Materials and methods
2.1. Fish
Gilthead sea bream, Spar-us uurutu (l-5 g>, were acquired from a hatchery, and were grown to a weight of 30-100 g, using procedures similar to those described by Guinea and Fernandez (1991). Aquaria were installed in isothemric rooms at 21”C, and a photoperiod of 11 light/ 13 dark was maintained using fluorescent lamps. Fish were fed dry pellets of known composition once a day at 9:30 h (Table 1). The amount of food supplied was 3% of body weight (BW) for fish of l-10 g, 2% BW for lo-30 g and 1% BW for fish from 30 g onwards.

J. Guinea, F. Fernandez/Aquaculture 148 (1997) 125-142 127
Table 1 Composition and proximate content of the diet used in maintenance and experiments
%
Composition
White fish meal ’
Corn starch (gelatinized)
Fish oil h
Vitamin mixture ’
NaCl
BHT d
Danagel (binder)
Proximate content
Moisture
Ash
Crude protein
Carbohydrates
Crude fat
Gross energy (kJ g- ’ ) e
75.0
22.0
1.0
0.47
0.25
0.03
0.08
7.5
15.4
46.1
24.4
6.6
17.9
a White fish meal containing 8% moisture, 60.9% crude protein, 7.2% fat, 18.3% ash and 0.6% fibre.
h Vitapex.
’ Vitamin premix (g or IU kg-’ diet): vitamin A, 8000000 IU; vitamin D,, 1000000 IU; vitamin E, 25;
vitamin B,, 25; vitamin B,, 15; vitamin B,, 5; vitamin B,,, 0.08; vitamin K, 4; niacin, 40; calcium
pantothenate, 20; choline chloride, 400; folic acid, 3; ascorbic acid, 250.
d BHT, butylated-hydroxytolune (antioxidant).
e Energy (kJ g-‘) = (% prot. X 23.6+ % fat X 36.2 + % carb. X 17.2)/100 (Brett and Groves, 1979).
2.2. Respirometer
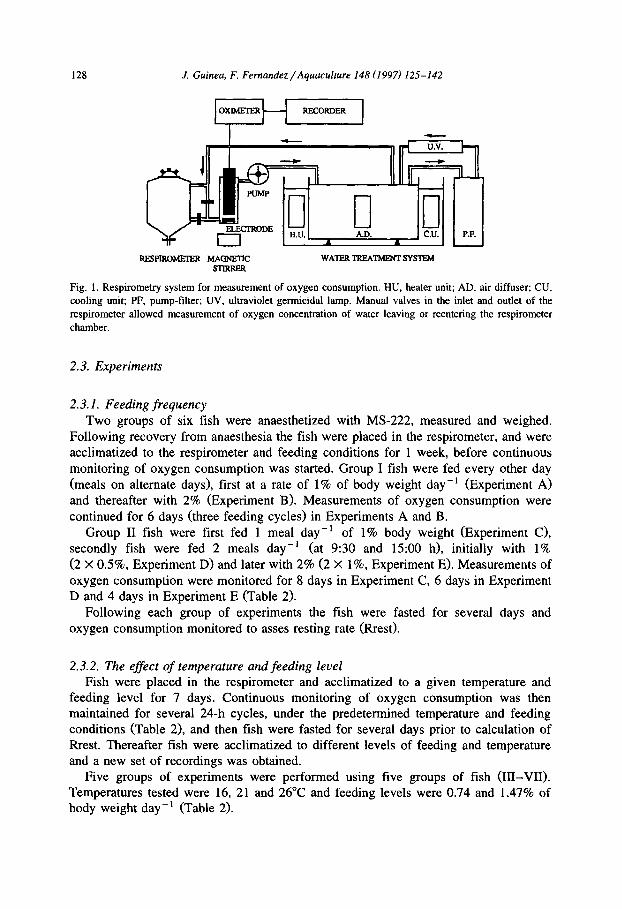
Oxygen consumption was measured using a closed circuit flow-through respirometer based on the design of Guinea and FernPndez (1991). A pump ensured a continuous flow of water from the respirometry chamber (50 1 capacity) to an oxymeter and to a 50-l water tank provided with a heater/cooling thermostatic system and a water regeneration system, allowing tank water to recirculate 12 times h-’ through pump filters and germicide UV lamps (Fig. 1).
The glass respirometry chamber was surrounded by a sheet of opaque foam rubber to exclude external visual stimuli and to increase thermal insulation. A light-dark cycle of 11 h/13 h was ensured by a 15-W lamp installed inside the sheet.
The oxygen concentration in the water leaving the respirometer was monitored
continuously by means of an oxymeter (WTW 0X1-90) provided with a polarographic oxygen probe (WTW EOT-190). The oxygen concentration in the water reentering the respirometer was monitored frequently. Prior to each series of experiments the oxygen electrode was calibrated (WTW quick calibration with OxiCal” beaker) and oxygen concentration was corrected for salinity measured using a hand refractometer (ATAGO S-10). Food was provided to fish within the respirometer via the water inlet located within the water regeneration tank. In this way no interruption of oxygen recording was needed to feed the fish.
128 1. Guinea, F. Fernandez/Aquaculture 148 (1997) 125-142
RFSlROhETER MAGNETIC WATER TREATMENT SYSTEM
STIRRER
Fig. 1. Respirometry system for measurement of oxygen consumption. HU, heater unit; AD, air diffuser; CU, cooling unit; PF, pump-filter; UV, ultraviolet germicidal lamp. Manual valves in the inlet and outlet of the respirometer allowed measurement of oxygen concentration of water leaving or reentering the respirometer chamber.
2.3. Experiments
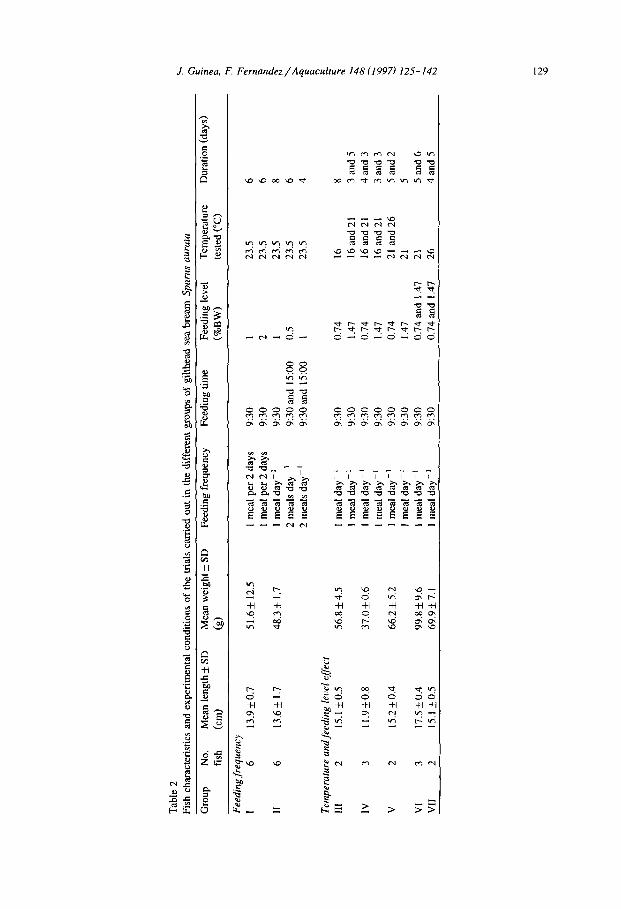
2.3. I. Feeding frequency Two groups of six fish were anaesthetized with MS-222, measured and weighed.
Following recovery from anaesthesia the fish were placed in the respirometer, and were acclimatized to the respirometer and feeding conditions for 1 week, before continuous monitoring of oxygen consumption was started. Group I fish were fed every other day
(meals on alternate days), first at a rate of 1% of body weight day-’ (Experiment A) and thereafter with 2% (Experiment B). Measurements of oxygen consumption were
continued for 6 days (three feeding cycles) in Experiments A and B. Group II fish were first fed 1 meal day-’ of 1% body weight (Experiment C),
secondly fish were fed 2 meals day- * (at 9:30 and 15:OO h), initially with 1% (2 X 0.5%, Experiment D) and later with 2% (2 X l%, Experiment E). Measurements of
oxygen consumption were monitored for 8 days in Experiment C, 6 days in Experiment D and 4 days in Experiment E (Table 2).
Following each group of experiments the fish were fasted for several days and
oxygen consumption monitored to asses resting rate @rest).
2.3.2. The effect of temperature and feeding level Fish were placed in the respirometer and acclimatized to a given temperature and
feeding level for 7 days. Continuous monitoring of oxygen consumption was then maintained for several 24-h cycles, under the predetermined temperature and feeding conditions (Table 2), and then fish were fasted for several days prior to calculation of Rrest. Thereafter fish were acclimatized to different levels of feeding and temperature and a new set of recordings was obtained.
Five groups of experiments were performed using five groups of fish (III-VII). Temperatures tested were 16, 21 and 26°C and feeding levels were 0.74 and 1.47% of body weight day-’ (Table 2).
Tab
le
2
Fish
ch
arac
teri
stic
s an
d ex
peri
men
tal
cond
ition
s of
the
tr
ials
ca
ked
out
in t
he
diff
eren
t gr
oups
of
gi
hhea
d se
a br
eam
Sp
urus
uu
ruta
Gro
up
No.
M
ean
leng
th
f SD
M
ean
wei
ght
+ SD
Fe
edin
g fr
eque
ncy
Feed
ing
time
Feed
ing
leve
l T
empe
ratu
re
fish
(c
m)
k)
(%B
W)
test
ed
(“C
)
Dur
atio
n (d
ays)
Feed
ing
freq
uenc
y I
6 13
.9*0
.7
51.6
f 12
.5
1 m
eal
2 da
ys
per
9:30
I
23.5
6
I m
eal
2 da
ys
per
9:30
2
23.5
6
II
6 13
.65
1.7
48.3
f
1.7
1 -
mea
l da
y ’
9:30
1
23.5
8
2 m
eals
da
y ’
9:30
an
d 15
:OO
0.
5 23
.5
6 2
mea
ls
day
_ ’
9:30
an
d IS
:00
1 23
.5
4
Tem
peru
ture
und
feed
ing
leve
l ef
Sect
II
I 2
15.1
rtr
o.5
56.8
f4.5
1
mea
l da
y-’
9:30
0.
74
16
8 1
mea
l da
y-
’ 9:
30
1.47
16
and
21
3
and
5 IV
3
11.9
kO.8
37
.OkO
.6
I m
eal
day
- ’
9:30
0.
74
16 a
nd
21
4 an
d 3
1 m
eal
day-
’ 9:
30
1.47
16
and
21
3
and
3 V
2
15.2
f0.4
66
.2 f
5.
2 1
mea
l da
y-’
9:30
0.
74
21 a
nd
26
5 an
d 2
1 m
eal
day-
’ 9:
30
I .47
21
5
VI
3 17
.5 +
0.4
99.8
f9.6
1
_ m
eal
day
’ 9:
30
0.74
an
d 1.
47
21
5 an
d 6
VII
2
15.1
f0.
5 69
.9k7
.1
1 m
eal
day
- ’
9:30
0.
74
and
I .47
26
4
and
5
130 J. Guinea, F. Fernandez/Aquacul!ure 148 (1997) 12.5-142
Respirometry was carried out without fish to assess the oxygen consumption of microorganisms. In these blank trials the difference in oxygen saturation between inlet and outlet water was less than l%, so rates of oxygen consumption by microorganisms were considered negligible.
2.4. Parameters calculated
Oxygen concentrations in the water entering and leaving the respirometer were monitored and the following parameters calculated.
Rhour (oxygen consumption kg -’ fish h-l): (0; - 0;) F/W, where Oi, and O,O are
the oxygen concentrations (mg 0, 1-i ), in water inlet and outlet, respectively, F is water flow in 1 h-’ and W is the weight of the fish in the respirometer in kg.
Rmean (mean oxygen consumption): mean value of Rhour computed over 24 h. It
represents the mean daily metabolic rate. Rrest (resting oxygen consumption): mean lowest values of Rhour over a 24-h cycle
in fasting fish, representing an estimate of the costs of maintaining bodily functions
(these values were always found during the night period of the cycle.) Rsa!a (oxygen consumption over resting): metabolic rate above Rrest (Rmean - Rrest).
Rsda X 24 would be the oxygen consumed as apparent SDA (feeding and random
activity) in a 24-h cycle. Rpeak (highest oxygen consumption): maximum value of Rhour during the apparent
SDA period. Rpref (oxygen consumption in light hours before feeding) (R prefeeding): mean value of Rhour in time between lights on (7.30 a.m.) and feeding time (9.30 a.m.). Ract (oxygen consumption associated with lights on) (R activity): Rpref minus the
value of Rhour recorded in the hour preceding lights on. Dsda: duration of apparent SDA period in h. Dpeak: time between feeding and Rpeak. Pmean: energy lost in metabolism as percentage of energy in the daily ration. It corresponds to the percentage of food energy directed toward metabolic expenditures. Energy dissipated was calculated from daily oxygen consumption using an oxycalorific coefficient of 13.84 J mg-’ of oxygen (Brafield and Llewellyn, 1982). Energy content of food was estimated using combustion heats of 17.2, 23.6 and 36.2
kJ g-* for carbohydrate, protein and fat, respectively (Brett and Groves, 1979). Prest: Rrest as percentage of Rmean, representing the proportion of energy dissipated in resting metabolism. Psda: Rsda as percentage of Rmean, corresponding to the proportion of metabolic expenditure as apparent SDA. ASDAC (apparent SDA coefficient): proportion of energy ingested expended as apparent SDA.
2.5. Statistics
In experiments involving meals on alternate days, means of metabolic parameters for fish fed at 1 and 2% BW were compared using an unpaired Student’s t-test. Significance was accepted at P < 0.05.
J. Guinea, F. Fernandez /Aquaculture 148 (1997) 125-142 131
In experiments involving 2 meals day -’ data obtained from different nutrition planes (1 meal of 1% BW, 2 meals of 0.5% BW and 2 meals of 1% BW day-‘) were treated together by one-way analysis of variance. Means were compared using Scheffe’s post-hoc comparison test and values were considered significantly different at P < 0.05.
The experiments on temperature and feeding level were carried out with several groups of fish that were of different mean size and collected in different seasons of the
year. In each group and for each parameter differences between temperatures or feeding levels were compared with an unpaired Student’s t-test and significance was determined at 0.05 probability.
The calculations were performed with statistics software (SuperANOVA and StatView
4.5, Abacus Concepts, Inc., CA).
3. Results
3.1. Meals on alternate days
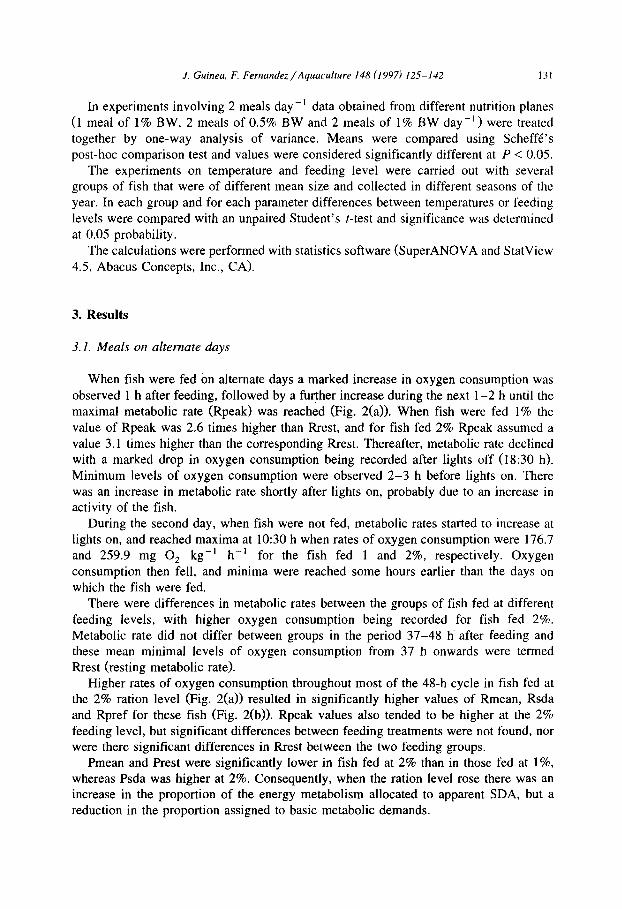
When fish were fed on alternate days a marked increase in oxygen consumption was observed 1 h after feeding, followed by a further increase during the next l-2 h until the
maximal metabolic rate (Rpeak) was reached (Fig. 2(a)). When fish were fed 1% the value of Rpeak was 2.6 times higher than Rrest, and for fish fed 2% Rpeak assumed a value 3.1 times higher than the corresponding Rrest. Thereafter, metabolic rate declined with a marked drop in oxygen consumption being recorded after lights off (18:30 h). Minimum levels of oxygen consumption were observed 2-3 h before lights on. There was an increase in metabolic rate shortly after lights on, probably due to an increase in activity of the fish.
During the second day, when fish were not fed, metabolic rates started to increase at lights on, and reached maxima at lo:30 h when rates of oxygen consumption were 176.7 and 259.9 mg 0, kg-’ h-i for the fish fed 1 and 2%, respectively. Oxygen
consumption then fell, and minima were reached some hours earlier than the days on which the fish were fed.
There were differences in metabolic rates between the groups of fish fed at different feeding levels, with higher oxygen consumption being recorded for fish fed 2%. Metabolic rate did not differ between groups in the period 37-48 h after feeding and these mean minimal levels of oxygen consumption from 37 h onwards were termed Rrest (resting metabolic rate).
Higher rates of oxygen consumption throughout most of the 48-h cycle in fish fed at the 2% ration level (Fig. 2(a)) resulted in significantly higher values of Rmean, Rsda and Rpref for these fish (Fig. 2(b)). Rpeak values also tended to be higher at the 2%
feeding level, but significant differences between feeding treatments were not found, nor were there significant differences in Rrest between the two feeding groups.
Pmean and Prest were significantly lower in fish fed at 2% than in those fed at l%, whereas Psda was higher at 2%. Consequently, when the ration level rose there was an increase in the proportion of the energy metabolism allocated to apparent SDA, but a reduction in the proportion assigned to basic metabolic demands.
132 J. Guinea, F. Fernandez/Aquaculture 148 (1997) 125-142
a 4ool
50 I,, , , , , , ,w,, , , , , , , , , , 0 3 6 9 12 15 18 21 24 27 30 33 36 39 42 45 48
Hours after feeding
100
80
60 *
40
20
0
Rmean Rrest Rsda Rpeak Rpref Ract Pmean Prest Psda
Fig. 2. (a) Metabolic rates during 48-h cycles in gilthead sea bream fed 1% body weight (BW) (A), or 2% BW (B), at 23S”C. Open and shaded horizontal bars indicate the light and dark period, respectively. Standard deviation is indicated by bars. (b) Comparison of metabolic parameters for the fish fed the different rations (see text for definition of parameters). Data presented as means f SD. Significant differences (P < 0.05) are indicated by an asterisk. Replicates for all the experiments were n = 3.
Apparent SDA duration was slightly lower for lower ration (37.3 f 2.5 h for 1% and 38.7 f 2.1 h for 2%) but differences were not significant. The time to reach maximal rate (Rpeak) was higher at lower ration (3 h for 1% and 2 h for 2%), but again differences were not significant.
3.2. One or two meals per day
Fish fed with 1 meal of 1% day-’ (C in Fig. 3(a)) showed a single peak of oxygen consumption which appeared after the meal. For fish fed 2 meals of 0.5% BW day-’ (D in Fig. 3(a)) there was only a small rise in oxygen consumption after the first meal (9:30 h), followed by a plateau, and then there was a further increase after the second meal (15:OO h) to reach a peak at about 1.5 h after the second meal.
When fish were fed 2 meals day- ’ of 1% BW each, (E in Fig. 3(a)), rates of oxygen consumption were higher than in fish fed a total of 1% BW day-’ (C and D in Fig. 3(a)). When two meals were fed a pattern of two peaks was clear, the first peak appearing 2 h after the first meal and the second (slightly higher than the first), 0.5 h after the second meal (E in Fig. 3(a)).

J. Guinea, F. Fernandez/Aquaculture 148 (1997) 125-142
450 -
400 -
$ 350 -
N 300 - %I E 250 -
200 -
150 -
100 1.
9:30 12:30 15:30 18:30 21:30 0:30 3:30 6:30
Hour
I 7 100 , 7 500 -I
* c I I
80 400
$J 300 60 #
< 200 40
E 100 20
0 0
133
Rmean Rrest Rsda Rpeak Rpref Ract Pmean Prest Psda
Fig. 3. (a) Effect of feeding frequency and ration level on the time course of the metabolic rates for 24-h
cycles in S. aurata of Group II. Fish were fed 1 meal of 1% BW day-’ CC), 2 meals of 0.5% BW day-’ (D)
and 2 meals of 1% BW day-’ (E) at 23.X. 0 pen and shaded horizontal bars indicate the light and dark period, respectively. Error bars represent standard deviation. (b) Effect of feeding frequency and ration level
on metabolic parameters. Legend as in (a). Data presented as means& SD. Asterisks denote significant
difference (P < 0.05). The number of replicates for the different trials were n = 8 for C, n = 6 for D and n = 4
for E.
The allocation of energy dissipated between different components of energy metabolism is shown in Fig. 3(b). When fish were fed with the same amount of food (C and D>, no significant differences were observed, except in the time required to reach maximal metabolic rates (Dpeak), which was delayed 3 h in D trials (Fig. 3(a)). This means that the distribution of a given amount of food in one or two meals had no influence either on the amount of energy dissipated during the day, or on how it was
distributed amongst the different components of metabolism (Pmean, Prest, Psda), but the time course of changes in the metabolic rate was affected.
On the other hand 2 meals day-’ of 1% each (2% daily ration) induced higher values for Rmean, Rsda, Rpeak, Rpref and Psda and lower for Pmean and Prest, than when fish were fed with a total of 1% BW day-’ (Fig. 3(b)).

134 J. Guinea, F. Fernandez/Aquaculture 148 (1997) 125-142
a
400
Rmean Rrest Rsda Rpeak Rpref Ract
b
400 n 0.74%WC
Pmean Prest Psda
SJ 300 % 60 O @ 8 200 40
100 20
0 0 Rmean Rrest Rsda Rpeak Rpref Ract Pmean Prest Psda
60 6Q
40
20
0 Rmean Rrest Rsda Rpeak Rpref Ract Pmean Prest Psda
d
400
60 Ei?
40
Rmean Rrest Rsda Rpeak Rpref Ract Pmean Prest Psda
J. Guinea, F. Fernandez /Aquaculture 148 (I 997) 125-142 135
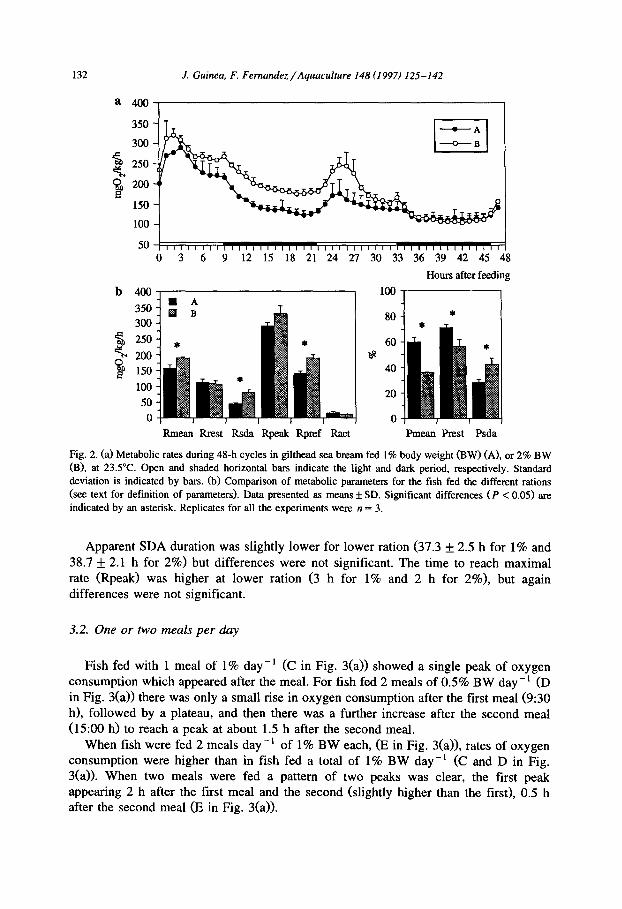
Table 3
Mean apparent SDA coefficients corresponding to the experiments related to temperature and feeding level
effect in S. aurata
Group n Temperature
tested (“Cl
Feeding level
(%BW)
SDAC F SD
III 8 16
3 16
5 21
IV 4 16
3 16
3 21
3 21
V 5 21
5 21
2 26
VI 5 21
6 21
VII 4 26
5 26
0.74 19.6+2.0
1.47 15.9+ 1.0
1.47 21.9k2.8
0.74 18.2k4.9
1.47 17.5+ 1.9
0.74 28.8 + 3.2
1.47 21.522.2
0.74 18.3+ 1.8
1.47 17.8 + I .9
0.74 30.0+ 1.8
0.74 21.6 + 3.0
1.47 17.5 f 2.4
0.74 21.91_ 1.3
I .47 18.6 + 0.5
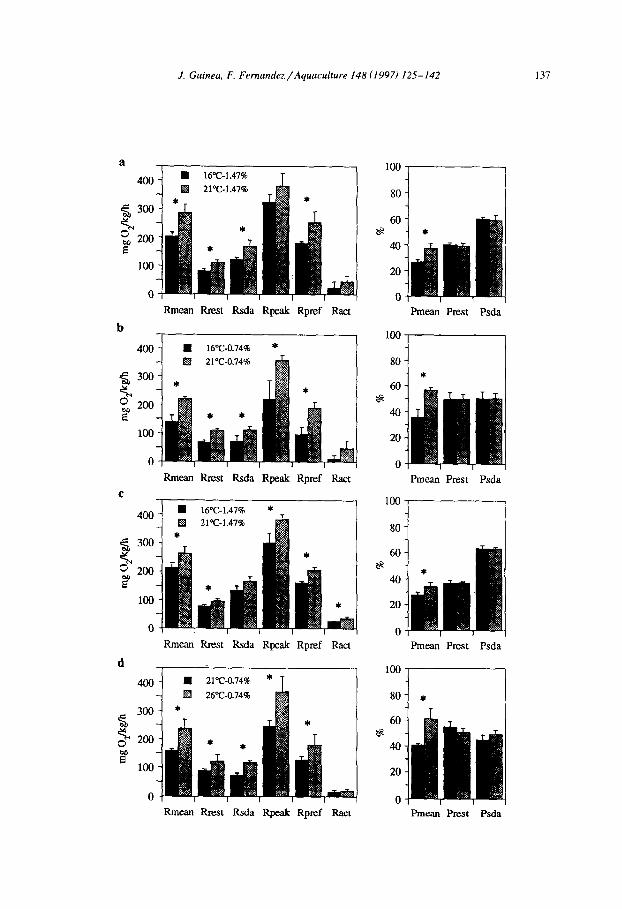
3.3. The effect of temperature
In all groups in which temperature effects were investigated (III, IV and V), oxygen
consumption rate @mean) was always higher at the higher temperature for a given daily ration, with a rank of 138.9 mg 0, kg-’ h-’ at 16°C and a feeding level of 0.74% BW
(Group IV), and 286.4 mg 0, kg-’ hh ’ at 21°C and a daily ration of 1.47% BW (Group III>. The same effect was observed in the parameters: Rrest, Rsda, Rpeak, Rpref and Pmean with higher values at the higher temperature (with P < 0.01 in most cases>. Ract also increased with temperature but the increase was only significant once. However Prest and Psda did not differ significantly between temperatures (Fig. 4). Apparent SDA coefficient increased significantly with temperature, except in one case (Group IV at a feeding level of 1.47%) (Table 3). Dpeak showed high variability without a defined pattern. Apparent SDA duration was always longer than 24 h.
3.4. The effect of feeding level at different temperatures
Fig. 5 shows the metabolic rates for the 24-h cycle for fish in Group IV, illustrating
the general trend of higher rates at higher ration levels.
Fig. 4. Effect of temperature on metabolic parameters in S. aurata of Groups III, IV and V. Experimental temperatures were 16, 21 and 26°C; feeding levels were 0.74 and/or 1.47% BW day-‘. An increase in
temperature produced an increase for the most part of parameters, but did not affect energy allocation. (a)
Group III, n = 3 at 16°C and n = 5 at 21°C; (b) Group IV at 0.74% feeding level, n = 4 at 16°C and n = 3 at
21°C; (c) Group IV at 1.47% feeding level, n = 3 for both temperatures; (d) Group V, n = 5 at 21°C and n = 2
at 26°C. Significant differences (P < 0.05) between temperatures are indicated by an asterisk. Error bars
correspond to SD.

136 J. Guinea, F. Fernandez/Aquaculture 148 (1997) 125-142
50-f, , 9:30 12:30 15:30 18:30 21:30 0:30 3:30 6:30
Hour
150
100
9:30 12:30 15:30 18% 21:30 0:30 3s 6s Hour
Fig. 5. Effect of feeding level on the time course of the metabolic rates during 24-h cycles in gilthead sea
bream of Group IV. Fish were fed 0.74 and 1.47% BW at 16°C (a) and at 21°C (b). An increase in the ration
level produced an increase in the metabolic rate during all cycle. Open and shaded horizontal bars indicate the
light and dark period, respectively. Error bars indicate standard deviation.
Fig. 6. Effect of feeding level on metabolic parameters in S. aurata of Groups III, IV and V. Feeding levels
were 0.74 and 1.47% BW day-’ and experimental temperatures were 16 and 21°C. An increase in ration size
produced an increase in most parameters, except in resting metabolism (Rrest), and in this case energy
allocation was affected. (a) Group III, n = 8 at 0.74% BW and II = 3 at 1.47% BW; (b) Group IV, at 16°C.
n = 4 at 0.74% BW and n = 3 at 1.47% BW; (c) Group IV, at 21°C. n = 3 for both feeding levels; (d) Group V, n = 5 also for both feeding levels. Significant differences (P < 0.05) between feeding levels are indicated
by an asterisk. Error bars correspond to SD. This figure can be compared with Fig. 4, which shows the effect
of temperature in the same fish groups.
J. Guinea, F. Fernandez/Aquaculture 148 (19971 125-142 137
a
400
s 300 % 0, 200 E
100
60 e
40
b ,
Rmean Rmt Rsda Rpeak Rpref Ract Pmean Prest Psda
400 _I n 16%0.74% * I
60 9
40
20
0 Rmean Rmt Rsda Rpeak Rpref Ract
C
400
% 5 300
0 z 200
100
0
20
0 Rmean Rmt Rsda Rpeak Rpref Ract Pmean Prest Psda
d
40 n Z~T-0.74% * T I
Pmean Prest Psda
80
60 8
40
60 I
40
20
0 Rmean Rnzt Rsda Rpeak Rpref Ract Pmean Prest Psda

138 J. Guinea, F. Fernandez/Aquaculture I48 (1997) 125-142
a
400
60 @
40
20
0
Rmean Rrest Rsda Rpeak Rpref Ract Pmean Prest Psda
b
400
Rmean Rrest Rsda Rpeak Rpref Ract Pmean Prest Psda
Fig. 7. Effect of feeding level on metabolic parameters in S. aurata of Groups VI and VII. Feeding levels were 0.74 and 1.47% BW day-’ and experimental temperatures were 21 and 26°C. Comments as in Fig. 6. (a) Group VI, n = 5 at 0.74% BW and n = 6 at 1.47% BW; (b) Group VII, n = 4 at 0.74% BW and n = 5 at 1.47% BW. Asterisks denote significant differences (P < 0.05) between feeding levels. Error bars correspond to SD.
Figs. 6 and 7 show the effects of feeding levels on metabolic rates of fish in all groups. Mean daily metabolic rate and apparent SDA showed significant increases in all cases. In contrast, resting rate @rest) never varied. The percentage of energy dissipated in relation to the energy ingested (Pmean) decreased significantly with the increase in the level of food. When the ration was augmented, the percentage of energy directed towards minimal metabolism in relation to energy dissipated @rest> decreased, whereas the percentage directed to apparent SDA (Psda) increased significantly in both cases. This effect was completely different from that caused by temperature. Apparent SDA coefficient fell significantly in all cases, except in Group IV at 16°C and in Group V (Table 3).
Despite the variability observed between groups, analysis of variance for all data together showed that there was a significant increase in Rmean, Rsda, Rpeak, Dpeak and Rpref at the higher feeding level, whereas no significant differences were found for Rrest or Ract. For the energy allocation parameters we found that Pmean and Prest decreased at higher ration levels, whereas Psda increased significantly. It can also be seen that apparent SDA coefficients consistently decreased at higher feeding levels.

J. Guinea, F. Fernandez /Aquuculture 148 (1997) 125-142 139
4. Discussion
For feeding levels of 1 and 2% apparent SDA effects persisted for about 37-39 h and appeared to be independent of the feeding level. Apparent SDA duration was slightly lower with lower ration, but differences were not significant. In support of these findings, LeGrow and Beamish (1986) found that duration of elevated metabolism
following feeding was independent of dietary energy intake in rainbow trout. However, other authors have found a dependence of SDA duration on ration level (Muir and Niimi, 1972; Beamish, 1974; Jobling and Davies, 1980). This disagreement with our
results can be explained by differences in species used, experimental conditions, and
particularly ration sizes, which were higher in those studies than in our experiments. There was an increase in metabolic rate on fasting days during the light hours (Fig.
2(a)). Direct observations of fish behaviour revealed that during the night S. aurata
remained close to the bottom, nearly motionless, whereas in the light the fish swam slowly with frequent stops. Therefore, this increase could be due to the higher activity during light hours. However, the magnitude of the increase was related to the amount of
food provided the day before, and there was a peak of activity which coincided with feeding time. Therefore ‘false SDA’ seems to be a consequence of learned behaviour, as it seems that fish were more active at the time when food was provided the day before.
The turning of lights on and off also led to rapid increases or decreases in Rhour, respectively (Fig. 2(a), Fig. 3(a) and Fig. 51, which can be attributed to changes in fish activity due to changes in illumination.
From experiments in which fish were fed twice a day, it seems clear that each meal generated a peak in metabolic rate, with the second peak being larger than the first. Such cumulative effects have been described by other authors for other species (Soofiani and
Hawkins, 1982; Hamada and Maeda, 1983; Lucas and Priede, 1992). No significant differences were found between fish fed once or twice a day with the
same daily ration for daily oxygen consumption rates or for the proportion of food energy allocated to apparent SDA or Rrest. Hamada and Maeda (1983) also found similar SDA values for Cyprinus carpio fed similar daily rations but distributed in different numbers of meals. Beamish and MacMahon (1988) did not find significant differences in apparent heat increment when the daily ration for juvenile walleyes was divided into one, two or three feedings.
Irrespective of the level of feeding, the rise in temperature produced an increase in several rates such as Rrest, Rsda and Rpeak. The increase in Rrest and apparent Rsda with temperature did not affect the Rrest/apparent Rsda ratio, indicating that tempera- ture did not affect the distribution of energy between maintenance and apparent SDA needs for a given level of energy intake. This is also reflected in the values of Prest and Psda, which remained unchanged with the increase in temperature, even when Pmean rose with temperature and showed values between 26.5 and 61.2%. It is well known that a rise in temperature increases standard metabolism, given the general effect of temperature on biochemical reactions (Edwards et al., 1969; Eccles, 1985), but the explanation for the increase in apparent SDA is not so simple. Apparent SDA includes energy used in SDA in a strict sense, like synthesis of proteins during growth or amino acid deamination (LeGrow and Beamish, 1986; Lyndon et al., 1992; Jobling, 1994) and

140 J. Guinea, F. Fernandez/Aquaculture I48 (1997) 125-142
mechanical and biochemical processing of the meal (Tandler and Beamish, 1979), all of which can be accelerated by temperature. We also consider those components of activity related to feeding as a part of apparent SDA and these components can also be accelerated by temperature.
Energy directed to apparent SDA can be expressed as a fraction of the energy intake, thus obtaining the apparent SDA coefficient (ASDAC), for which we found values
between 15.9 and 30.0% which was significantly dependent on temperature in most
cases. Review of Beamish and Trippel (1990) reveals that the SDA coefficient seems to be dependent on fish species, food type, feeding level, temperature and other factors, and cannot be considered as a fixed fraction of energy intake.
Comparison of oxygen consumption rates during the day shows that they are higher for the higher daily ration, but in contrast to the temperature effect, this increase affected only apparent SDA. Values of Rrest did not show significant differences between
rations. As a result, the ratio Rrest/apparent Rsda decreased with feeding level. These results are consistent with the assumption that Rrest represented an estimation of
‘minimal metabolism’ whereas Rsda represented feeding-dependent metabolism. We have found an increase in apparent SDA magnitude with feeding level, which
agrees with the trends reported in other papers (Vahl and Davenport, 1979; Jobling and
Davies, 1980; LeGrow and Beamish, 1986; Lucas and Priede, 1992; Chakraborty et al., 1992). We consider it probable that the increase in feeding does not affect maintenance needs and that this is the reason why Rrest remains unchanged. The rise in energy intake can then be used to increase protein and lipid synthesis for growth, a process that
requires the investment of energy derived from fat, carbohydrates or excess protein in the diet.
In our study, apparent SDA coefficient (ASDAC) decreases with feeding level. A
possible explanation could be a decrease in the assimilation coefficient with the rise in the feeding level, so the percentage of the extra energy directed towards apparent SDA is not directly proportional to the increase in the energy ingested. Studies conducted in our laboratory on 5. auratu showed a decrease of the assimilation coefficient with the rise of ration level (unpublished results) and the same has also been observed by other authors in other species (Solomon and Brafield, 1972; Elliott, 1976; Henken et al., 1985). In support of our findings, Muir and Niimi (1972) also found a decrease in SDAC with feeding level. However, Chakraborty et al. (1992) reported fixed values at different energy intakes, although they found a correlation between SDAC and protein content of the diet, with SDAC rising from 9.0% to 15.9% for diets with protein contents increasing from 20 to 50%. Also Beamish (1974) found that apparent SDA was independent of the meal size. Such differences in the relationship of SADC with energy intake could be due to methodological differences such as the level of activity of fish in the respirometers, and diet composition. Further work is probably needed to clarify these matters.
In our experiments the increase in daily ration also produced a rise in Rpeak (although not always significant), which is consistent with the data of other authors (Muir and Niimi, 1972; Lucas and Priede, 1992; Chakraborty et al., 1992).
We also measured a significant decrease in the percentage of the energy lost in metabolism in relation to energy ingested with the increase in daily ration, and similar
J. Guinea, F. Fernandez/Aquaculture 148 (1997) 125-142 141
results have been found by other authors (Flowerdew and Grove, 1980; Carter and Brafield, 1991, 1992). This effect contrasts with that produced by temperature, and can
be considered as a consequence of the increase in energy intake without a parallel increase in maintenance requirements @rest). We have also discussed the fact that ASDAC tends to decrease at higher feeding levels.
Acknowledgements
We wish to thank Dalgety EspaEa S.A. for the supply of fish food. We also acknowledge the “Instituto de Ciencias del Mar” of Barcelona for the provision of sea water, and thanks are given to Peter Harvey (Language Advice Service, Universidad de
Barcelona) for the correction of the manuscript. This work was supported by CICYT
grants no. PTR 91/0067 and PB 93/0757.
References
Beamish, F.W.H., 1964. Respiration of fishes with special emphasis on standard oxygen consumption. II.
Influence of weight and temperature on respiration of several species. Can. J. Zool., 42: 177-188.
Beamish, F.W.H., 1970. Oxygen consumption of largemouth bass, Micropterus salmoides, in relation to
swimming speed and temperature. Can. J. Zool., 48: 1221-1228.
Beamish, F.W.H., 1974. Apparent specific dynamic action of largemouth bass, Micropterus salmoides. J. Fish.
Res. Board Can., 31: 1763-1769.
Beamish, F.W.H. and MacMahon, P.D., 1988. Apparent heat increment and feeding strategy in walleye,
Stizostedion uitreum uitreum. Aquaculture, 68: 73-82.
Beamish, F.W.H. and Trippel, E.A., 1990. Heat increment: a static or dynamic dimension in bioenergetic
models? Trans. Am. Fish. Sot., 119: 649-661.
Brafield, A.E. and Llewellyn, M.J., 1982. Animal Energetics. Blackie, Glasgow.
Brett, J.R., 1964. The respiratory metabolism and swimming performance of young sockeye salmon. J. Fish.
Res. Board Can., 21: 1183-1226.
Brett, J.R., 1976. Feeding metabolic rates of young sockeye salmon, Oncorhynchus nerka, in relation to ration
level and temperature. Fish. Mar. Ser. Tech. Rep. No. 675, pp. l-43.
Brett, J.R. and Groves, T.D.D., 1979. Physiological energetics. in: W.S. Hoar, D.J. Randall and J.R. Brett
(Editors), Fish Physiology. Vol. VIII, Academic Press, New York, pp. 297-352.
Carter, C.G. and Brafield, A.E., 1991. The bioenergetics of grass carp, Ctenopharyngodon ideifa (Val.):
energy allocation at different planes of nutrition. J. Fish Biol., 39: 873-887.
Carter, C.G. and Brafield, A.E., 1992. The relationship between specific dynamic action and growth in grass
carp, Ctenophatyngodon idella &al.). J. Fish Biol., 40: 895-907.
Chakraborty, SC., Ross, L.G. and Ross, B., 1992. Specific dynamic action and feeding metabolism in
common carp, Cyprinus catpio. Comp. Biochem. Physiol. A, 103: 809-815.
Eccles, D.H., 1985. The effect of temperature and mass on routine oxygen consumption in the South African
cyprinid fish Barbus aeneus Burchell. J. Fish Biol., 27: 155- 165.
Edwards, R.R.C., Finlayson, D.M. and Steele, J.M., 1969. The ecology of O-group plaice and common dabs in
Loch Ewe. II. Experimental studies of metabolism. J. Exp. Mar. Biol. Ecol., 3: I-17.
Elliott, J.M., 1976. Energy losses in the waste products of brown trout (Salmo trutfa L.J. J. Anim. Ecol., 45:
561-580. Flowerdew, M.W. and Grove, D.J., 1980. An energy budget for juvenile thick-lipped mullet, Crenimugil
labrosus (Risso). J. Fish Biol., 17: 395-410. Fry, F.E.J. and Hart, J.S., 1948. The relation of temperature to oxygen consumption in goldfish. Biol. Bull.
Woods Hole, 94: 66-77.
142 J. Guinea, F. Fernandez/Aquaculture 148 (1997) 125-142
Guinea, J. and Femandez, F., 1991. The effect of SDA, temperature and daily rhythm on the energy
metabolism of the mullet Mugil saliens. Aquaculture, 97: 353-364.
Hamada, A. and Maeda, W., 1983. Oxygen uptake due to specific dynamic action of the carp, Cyprinus carpio. Jpn. J. Limnol., 44: 225-239.
Henken, A.M., Kleingeld, D.W. and Tijssen, P.A.T., 1985. The effect of feeding level on apparent digestibility
of dietary dry matter, crude protein and gross energy in the African catfish Clarias gariepinui (Burchell
1822). Aquaculture, 51: l-11.
Jobling, M., 1993. Bioenergetics: feed intake and energy partitioning. In: J.C. Rankin and F.B. Jensen
(Editors), Fish Ecophysiology. Chapman and Hall, London, pp. l-44.
Jobbing, M., 1994. Respiration and metabolism. In: M. Jobhng (Editor), Fish Bioenergetics. Chapman and
Hall, London, pp. 121-145.
Jobling, M. and Davies, P.S., 1980. Effect of feeding on metabolic rate, and the specific dynamic action in
plaice, Pleuronectes platessa L. J. Fish Biol., 16: 629-638.
Kanungo, M.S. and Prosser, CL., 1959. Physiological and biochemical adaptation of goldfish to cold and
warm temperatures. I. Standard and active oxygen consumptions of cold- and warm-acclimated goldfish at
various temperatures. J. Cell. Comp. Physiol., 54: 259-263.
Kaufmann, R. and Wieser, W., 1992. Influence of temperature and ambient oxygen on the swimming
energetics of cyprinid larvae and juveniles. Environ. Biol. Fish., 33: 87-95.
Kutty, M.N. and Mohamed, M.P., 1975. Metabolic adaptations of mullet Rhinomugil corsula (Hamilton) with
special reference to energy utilization. Aquaculture, 5: 253-270.
I_e-Breton, A.D., 1994. Marine fish breeding in the Mediterranean: Rearing techniques, actual situation and
prospects. Rec. Med. Vetet. de I’Ecole d’Alfort., 170: 121-128.
LeGrow, S.M. and Beamish, F.W.H., 1986. Influence of dietary protein and lipid on apparent heat increment
of rainbow trout, Salmo gairdneri. Can. J. Fish. Aquat. Sci., 43: 19-25.
Lemarie, G., Gasset, E., Cam, D. and De-La Fonchais, E., 1992. Models of oxygen consumption for seabass
Dicentrarchus labrax and seabream Sparus auratus. Ichtyophysiol. Acta, 15: 55-68.
Lucas, M.L. and Priede, I.G., 1992. Utihsation of metabolic scope in relation to feeding and activity by
individual and grouped zebrafish, Brachydanio rerio (Hamilton-Buchanan), J. Fish Biol., 41: 175-190.
Lyndon, A.R., Houlihan, D.F. and Hall, S.J., 1992. The effect of short-term fasting and a single meal on
protein synthesis and oxygen consumption in cod, Gadus morhua. J. Comp. Physiol. B, 162: 209-215.
Morris, D.J. and North, A.W., 1984. Oxygen consumption of five species of fish from South Georgia. J. Exp.
Mar. Biol. Ecol., 78: 75-86.
Muir, B.S. and Niimi, A.J., 1972. Oxygen consumption of the euryhahne fish aholehole (Khulia sandiuicen- sis) with reference to salinity, swimming and food consumption. J. Fish. Res. Board Can., 29: 67-77.
Quantz, G. and Tandler, A., 1984. The effect of weight and environmental temperature on the oxygen
consumption of gilthead seabream (Sparus aurata L.) larvae. In: H. Rosenthal and S. Sarig (Editors),
Research on Aquaculture. European Mariculture Society, Special Publication No. 8, pp. 229-239.
Solomon, D.J. and Brafield, A.E., 1972. The energetics of feeding metabolism and growth of perch (Perca fluuiatilis, L). J. Anim. Ecol., 41: 699-718.
Soofiani, N.M. and Hawkins, A.D., 1982. Energetic costs at different levels of feeding in juvenile cod, Gadus morhua L. J. Fish Biol., 21: 577-592.
Soofiani, N.M. and Priede, LG., 1985. Aerobic metabolic scope and swimming performance in juvenile cod,
Gadus morhua L. J. Fish Biol., 26: 127-138.
Tandler, A. and Beamish, F.W.H., 1979. Mechanical and biochemical components of apparent specific
dynamic action in largemouth bass, Micropterus salmoides La&p&de. J. Fish Biol., 14: 343-350.
Vahl, 0. and Davenport, J., 1979. Apparent specific dynamic action of food in the fish, Blennius phofis. Mar. Biol. Prog. Ser., 1: 109-113.