Electronically captured clinical observations, early warning ...
150
Electronically captured clinical observations, early warning scores and compliance: An integrative review. Lisa Campbell A dissertation submitted in partial fulfilment of the degree of Master of Health Sciences (Nursing – Clinical) At the University of Otago, Christchurch, New Zealand, December 2018
-
Upload
khangminh22 -
Category
Documents
-
view
3 -
download
0
Transcript of Electronically captured clinical observations, early warning ...

Electronically captured clinical observations, early
warning scores and compliance: An integrative review.
Lisa Campbell
A dissertation submitted in partial fulfilment of the degree of Master of Health Sciences
(Nursing – Clinical)
At the University of Otago, Christchurch, New Zealand, December 2018

i
Abstract
Background: Reducing the rates of serious adverse events associated with acute in-
patient deterioration is a worldwide health priority. To date systematic reviews have
failed to unequivocally demonstrate that early warning systems (EWSs) reduce the
incidence of in-patient cardiac arrests, unanticipated intensive care unit admissions or
mortality rates. Currently there are several hundred EWSs in use which vary in how
they facilitate the recognition, activation and response to acutely deteriorating
patients. With new innovations in health and computer technology, electronic EWSs
are increasingly being employed to address shortfalls and challenges associated with
both the detection and response arms of paper-based EWSs.
Aim: The primary aim of this integrative review was to determine if electronically
captured clinical observations with/without automated alert systems improve
compliance with physiological early warning system (EWS) protocols and improve
patient outcomes.
Methodology/Methods: An integrative review was chosen as the methodology of
choice as it allows one to combine diverse methodologies to fully understand a
phenomenon. The following electronic databases were searched: Medline,
Cumulative Index to Nursing and Allied Health Literature (CINAHL), Embase
(Ovid), Web of Science, The Cochrane Library, Joanna Briggs Institute (JBI) and
Scopus. Unpublished or grey literature was also sought to avoid publication bias.
Included studies were critically appraised using JBI’s 2014 critical appraisal tools
and data was extracted and synthesised using Braun and Clarke’s (2006) six phases
of thematic analysis which identified four main themes and eight subthemes which
were presented in a narrative format.
Results: This review identified that most electronic EWSs improve the detection of
deteriorating patients in hospital by improving the accuracy of vital signs and early
warning scores. This finding was prevalent with systems that allow documentation of
vital signs at the point of care and the automated transfer of vital signs to the
electronic health record. The frequency of vital sign measurement and escalation of
care for deteriorating patients remained variable. This review found that the

ii
technology and hardware used in electronic EWSs enhanced the accessibility and
visibility of vital signs and aggregate early warning scores. This enhanced
accessibility and visibility supports proactive and remote management and response
to deteriorating patients. The electronic systems included in this review utilised
numerous methods of escalating care for deteriorating patients such as automated
alerts, onscreen prompts and visible electronic dashboards. Improvements in patient
outcomes were not conclusively demonstrated by this review.
Conclusion: Electronic EWSs facilitated the detection of deteriorating patients by
improving the accuracy and accessibility of patient’s vital signs and early warning
scores. Future research is required to determine the optimal method of escalating care
in electronic EWSs. Once an alert of patient deterioration is raised, challenges
remain. There remains a need to ensure an appropriate, timely and adequately
resourced response to deteriorating in-patients in an attempt to demonstrate improved
patient outcomes.

iii
Preface
Acknowledgements
Firstly, I would wholeheartedly like to thank my academic supervisors, Virginia
Maskill and Dr Fiona Doolan-Noble for their encouragement, guidance and
support whilst undertaking this dissertation. I also wish to thank the Canterbury
District Health Board (CDHB) and Health Workforce New Zealand for
providing the funding and study leave for undertaking this dissertation.
Additionally, in my current position as a Nurse Educator I am thankful for the
opportunity to have been involved in the implementation and education of the
New Zealand Early Warning Score and electronic platform, Patientrack, in the
CDHB. To my friends and colleagues, thank-you for continuously enquiring as
to my study progress and for constantly encouraging me to keep my head down
and keep going. Finally, a huge thank-you to my family particularly my
husband, Ronnie and children Kelsey and Aidan for picking up the slack at
home and for forgiving my occasional grumpiness. Your unwavering love,
patience, encouragement and copious cups of coffee have meant the world to
me.

iv
Table of contents
Abstract ........................................................................................................................................ i
Preface ....................................................................................................................................... iii
Acknowledgements ................................................................................................................... iii
Table of contents………………………………………………………………………………iv
List of abbreviations ................................................................................................................ viii
Glossary of terms ....................................................................................................................... ix
List of tables .............................................................................................................................. xi
List of figures ........................................................................................................................... xii
List of appendices .................................................................................................................... xiii
Chapter One: Introduction and background ............................................................................... 1
1.1 Introduction ...................................................................................................................... 1
1.1.1 Overview ............................................................................................................... 1
1.1.2 Early warning systems ........................................................................................... 1
1.1.3 Personal statement ................................................................................................. 2
1.1.4 Focus of this integrative review............................................................................. 2
1.1.5 Research aim and objectives.................................................................................. 3
1.1.6 Integrative review structure ................................................................................... 3
1.2 Background ....................................................................................................................... 5
1.2.1 The composition and history of EWSs .................................................................. 5
1.2.2 EWSs in New Zealand ........................................................................................... 6
1.2.3 The composition of the NZEWS ........................................................................... 7
1.2.4 Efficacy of EWSs .................................................................................................. 8
1.2.5 The detection arm of EWSs ................................................................................... 9
1.2.6 The response arm of EWSs ............................................................................... 122
1.2.7 Electronic EWSs .................................................................................................. 14
1.2.8 Summary .............................................................................................................. 15

v
Chapter Two: Methodology and Research Method .................................................................. 16
2.1 Introduction .................................................................................................................... 16
2.2 Methodology ................................................................................................................... 16
2.2.1 Systematic review ................................................................................................ 16
2.2.2 Integrative review ................................................................................................ 17
2.3 Research method............................................................................................................. 18
2.3.1 Research aim........................................................................................................ 18
2.3.2 Inclusion and exclusion criteria ........................................................................... 19
2.3.3 Search strategy ..................................................................................................... 20
2.3.3.1 Databases searched ....................................................................................... 20
2.3.3.2 Keywords and literature search .................................................................... 20
2.3.4 Article review ...................................................................................................... 21
2.3.5 Critical appraisal .................................................................................................. 21
2.3.5.1. Assessment of quantitative studies .............................................................. 22
2.3.5.2. Assessment of qualitative studies ................................................................ 22
2.3.5.3. Assessment of text and opinion articles ...................................................... 23
2.3.6 Data extraction ..................................................................................................... 23
2.3.7 Data analysis ........................................................................................................ 23
2.4 Ethical considerations ..................................................................................................... 25
Chapter Three: Results ............................................................................................................. 26
3.1 Introduction .................................................................................................................... 26
3.2 Results of search strategy ............................................................................................... 26
3.3 Outcomes of critical appraisal of the literature .............................................................. 28
3.4 Themes and subthemes ................................................................................................... 36
3.4.1 Theme One: The detection arm of patient deterioration in electronic EWSs ...... 37
3.4.2. Theme two: Human factors associated with the use of electronic EWSs .......... 37
3.4.3 Theme three: Technology and its contribution to patient safety ......................... 38

vi
3.4.4. Theme four: The response arm in electronic EWSs and impact on patient
outcomes ....................................................................................................................... 38
3.5 Theme one: The detection arm of patient deterioration in electronic EWSs ................. 40
3.5.1 Subtheme one: Accuracy of vital signs in electronic EWSs ............................... 40
3.5.2 Subtheme two: Faster documentation of vital signs ............................................ 44
3.5.3 Subtheme three: Timeliness of rechecking vital signs ........................................ 46
3.5.4 Summary of theme one ........................................................................................ 47
3.6 Theme two: Human factors associated with the use of electronic EWS ........................ 47
3.6.1 Subtheme one: User acceptability of electronic EWSs ....................................... 48
3.6.2 Summary of theme two ....................................................................................... 49
3.7 Theme three: Technology and its contribution to patient safety .................................... 49
3.7.1 Subtheme one: Strengths and limitations of the technology and hardware used in
electronic EWSs ........................................................................................................... 50
3.7.2 Subtheme two: Visibility and accessibility of data in electronic EWSs. ............ 51
3.7.3 Summary of theme three ..................................................................................... 53
3.8 Theme four: The response arm in electronic EWSs and impact on patient outcomes ... 53
3.8.1 Subtheme one: Clinical response to deteriorating patients .................................. 53
3.8.2 Subtheme two: Patient outcomes in electronic EWSs ......................................... 56
3.8.3 Summary of theme four ....................................................................................... 59
3.9 Chapter summary ............................................................................................................ 59
Chapter four: Discussion .......................................................................................................... 60
4.1 The detection arm of patient deterioration in electronic EWSs...................................... 60
4.2 Human factors associated with the use of electronic EWSs ........................................... 63
4.3 Technology and its contribution to patient safety .......................................................... 64
4.4 The response arm in electronic EWSs and patient outcomes ......................................... 65
4.5 Strengths and limitations ................................................................................................ 69
4.5.1 Strengths .............................................................................................................. 69
4.5.2 Limitations ........................................................................................................... 70

vii
4.6 Implications for practice ................................................................................................. 70
4.7 Opportunities for future research .................................................................................... 71
4.8 Conclusion ...................................................................................................................... 72
Bibliography ............................................................................................................................. 74

viii
List of abbreviations
ACSQHC - Australian Commission on Safety and Quality in Healthcare
CDHB - Canterbury District Health Board
CINAHL - Cumulative Index to Nursing and Allied Health Literature
CNM - Charge Nurse Manager
DHBs - District Health Boards
EHR - Electronic Health Record
EWS/s - Early Warning System/s
HCAs - Health Care Assistants
HDC - Health and Disability Commissioner
HQSC - Health Quality and Safety Commission
ICU - Intensive Care Unit
IT - Information Technology
JBI - Joanna Briggs Institute
MAStARI - Meta-Analysis of Statistics Assessment and Review Instrument
MeSH - Medical Subject Headings
NEWS - National Early Warning Score
NHS - National Health Service
NICE - National Institute for Health and Clinical Excellence
NOTARI - Narrative, Opinion and Text Assessment and Review Instrument
NZ - New Zealand
NZEWS - New Zealand Early Warning Score
PDA - Personal Digital Assistant
QARI - Qualitative Assessment and Review Instrument
RRT/s - Rapid Response Team/s
SUMARI - System for Unified Management, Assessment and Review
of Information
UK - United Kingdom
USA - United States of America
ViEWS - Vitalpac Early Warning Scores

ix
Glossary of terms
Early warning systems: These are clinical prediction models using vital signs
measured during a patient’s hospital stay to monitor their health and identify
physiological signs of deterioration which could lead to death, an increased length of
hospital stay or unplanned admission to an intensive care unit.
New Zealand Early Warning Score: The New Zealand Early Warning Score
(NZEWS) is a physiological early warning system implemented in all New Zealand
hospitals. The score is calculated from routine vital sign measurements and increases
as vital signs become increasingly abnormal. The early warning score triggers a
clinical response which escalates according to the degree of deviation from normal,
so that clinicians with the right skills can intervene and manage the patient’s
deterioration.
Detection arm: Early warning systems traditionally consist of two arms: a detection
arm and a response arm. The detection arm uses vital signs and early warning scores
to identify and trigger a response to patients who are deteriorating clinically.
Response arm: The response arm specifies the appropriate and expected response to
patient deterioration, either from ward staff, or nurse-and/or doctor-led rapid
response teams.
District Health Board: Is an organisation established within a defined geographical
area of New Zealand by the New Zealand Public Health and Disability Act 2000 to
ensure the provision of primary, secondary and tertiary health and disability services
in that area.
Integrative literature review: A review method that allows one to combine diverse
methodologies to fully understand a phenomenon.
Intensive Care Unit: Is a separate, self-contained area of a hospital with specially
trained staff equipped to manage patients with life-threatening or potentially life-
threatening conditions.

x
Health Care Assistant: Is a non-regulated health professional who works under the
direction and delegation of a registered health professional.

xi
List of tables
Table 1 NZEWS vital sign parameters and scoring .......................................................... 8
Table 2 Phases of thematic analysis (Braun & Clarke, 2006)......................................... 24
Table 3 Table of included studies ................................................................................... 30

xii
List of figures
Figure 1 Flow diagram of literature research .................................................................. 27
Figure 2 Flow diagram of themes and subthemes ........................................................... 39

xiii
List of appendices
Appendix A Literature search of the CINAHL database ................................................ 87
Appendix B JBI critical appraisal tools .......................................................................... 89
Appendix C Data extraction table ................................................................................... 92
Appendix D Table of excluded literature ...................................................................... 136

1
Chapter One: Introduction and background
1.1 Introduction
1.1.1 Overview
In this chapter an overview of the concept, history and efficacy of early warning
systems (EWSs) is presented and the New Zealand Early Warning Score
(NZEWS) and its components are introduced. Other aspects included in this
chapter are a personal statement from the researcher, the research aim and
objectives and an overview of the focus and structure of the integrative review.
Challenges associated with the detection and response arms of paper-based EWSs
are highlighted and technological advancements associated with the use of EWSs
identified. The rationale for undertaking research on the efficacy of electronic
EWSs in facilitating the identification and activation of a timely response and
management for deteriorating in-patients is discussed.
1.1.2 Early warning systems
Nationally and internationally, the need to identify and treat patients who
deteriorate acutely when nursed on general hospital wards resulted in the
development of EWSs, also known as track or trigger systems or rapid response
systems (Moore & Poynton, 2015). These umbrella terms describe the entire
system; however, EWSs traditionally consist of two arms: a detection arm and a
response arm. The detection arm uses vital signs and early warning scores to
identify and trigger a response to patients who are deteriorating clinically. The
response arm specifies the appropriate and expected response to patient
deterioration, either from ward staff, or nurse-and/or doctor-led rapid response
teams (RRTs) (Moore & Poynton, 2015). Ideally, the response arm should be
resourced 24 hours a day, seven days a week, by appropriately trained personnel
external to the ward. These personnel should be resourced to respond to
deteriorating patients in a timely manner when their needs exceed ward based
resources (Health, Quality and Safety Commission, 2016b).
2
Theoretically, the use of EWSs should reduce the rates of serious adverse events
associated with in-patient deterioration; however, three systematic reviews have
failed to unequivocally show that EWSs reduce the incidence of in-patient cardiac
arrests, unanticipated intensive care unit (ICU) admissions or mortality rates
(Alam et al., 2014; McGaughey et al., 2007; National Institute for Health and
Clinical Excellence, 2007). This inability to demonstrate improved patient
outcomes may be associated with challenges encountered in both the detection and
response arms of paper-based EWSs (McGaughey, O’Halloran, Porter, Trinder, &
Blackwood, 2017b).
1.1.3 Personal statement
In New Zealand (NZ) the Canterbury District Health Board (CDHB) and the West
Coast District Health Board, formally implemented the NZEWS on the 19th
September 2017 after participating in a six-hospital trial. At the same time an
electronic observation chart, called Patientrack, was implemented with a view to
improve compliance with EWS protocols and optimise the outcomes of
deteriorating patients. As a nurse educator who was involved with the
implementation and education of the NZEWS and Patientrack in a small, rural
CDHB hospital, the researcher has a particular interest in electronic EWSs and
their potential to improve the clinical outcomes of deteriorating in-patients. The
researcher is also a member of the CDHB NZEWS Working Group implemented
to regularly monitor the utilisation, efficacy and ongoing development of the
NZEWS and its electronic platform, Patientrack, to improve the detection and
response to patients who deteriorate acutely in NZ hospitals.
1.1.4 Focus of this integrative review
This integrative review explores the presence of shortfalls in current paper-based
EWSs and investigates what the available literature says about the growing use of
electronic EWSs and their potential to address these issues. Studies which
investigate if the electronic documentation of vital signs improves the accuracy of
vital signs and early warning scores, reduces the time taken to document vital

3
signs and subsequent vital sign measurements, are included. The perceptions of
key stakeholders in electronic EWSs are considered and the strengths and
limitations of the hardware and technology used in these systems are addressed.
Studies exploring the use of electronic EWSs to escalate care for deteriorating
patients and the impact on patient outcomes are also included. This information
can then be used to inform future practice and development in this area.
1.1.5 Research aim and objectives
The primary aim of this integrative literature review was to determine if
electronically captured clinical observations with/without automated alert systems
improve compliance with physiological early warning system (EWS) protocols.
Research objectives were to identify:
the effect of electronically captured observations and early warning
scores with/without automated alert systems on clinical outcomes of
deteriorating adult in-patients;
if electronically captured clinical observations improved the reliability
and accessibility of patients’ vital signs and the accuracy of calculating
early warning score totals;
if electronically captured clinical observations reduced the time required
to measure and document patients’ vital signs and/or increased the
frequency of vital sign recordings in deteriorating patients;
the benefits and limitations of electronically captured clinical
observations with/without automated alert systems.
1.1.6 Integrative review structure
This integrative review consists of four chapters:
Chapter one introduces the concept, history and efficacy of EWSs. An explanation
of the NZEWS and its components is provided. Challenges associated with the
detection and response arms of paper-based EWSs are highlighted and
technological advancements associated with the use of EWSs discussed.
Chapter two describes the chosen methodology and the rationale for selecting an
integrative review as the methodology of choice. The literature review research

4
method is presented and includes the research aim and objectives, the search
strategy used, inclusion and exclusion criteria applied, critical appraisal of the
literature and strategies used to extract and analyse the data.
Chapter three presents the results of the literature search strategy and outcomes of
quality appraisal of the literature. A table of the included studies is provided and
themes and subthemes derived from the thematic analysis are presented.
Chapter four summarises and critically analyses and interprets the findings from the
included studies. The strengths and limitations of this integrative review are presented
and implications for practice and opportunities for future research are addressed.

5
1.2 Background
1.2.1 The composition and history of EWSs
Internationally there are now several hundred EWSs in use employing a variety of
vital sign parameters and thresholds to trigger an appropriate response to in-
patient deterioration. Some systems use single vital sign parameter abnormalities
to trigger a response, while others use aggregate scores of multiple vital sign
parameter abnormalities (Psirides, Hill, & Hurford, 2013). Combination systems
use both single and aggregate scoring systems to trigger an escalation of care. The
response to vital sign abnormalities is usually graded and specifies maximum
response times depending on the degree of deviation from the norm (Psirides et
el., 2013). A low-level response may only require increasing the frequency of
observations and alerting the nurse in charge. A medium-level response may
require review by the doctor/s assigned to the ward. A high-level response,
indicating severe physiological abnormality, may elicit a full emergency response
from a team with advanced life support training (McGaughey, O’Halloran, Porter,
& Blackwood, 2017a).
Morgan, Williams and Wright (1997) first developed the concept of an EWS
based on weighted scores assigned to key vital sign parameters to aid the early
detection of developing critical vital sign parameters. The use of EWSs became
more widespread after 2004 when the Institute for Healthcare Improvement
launched its 100,000 Lives Campaign (Berwick, Calkins, McCannon, &
Hackbarth, 2006). This campaign proposed that United States of America (USA)
hospitals implement six interventions, which they considered highly achievable, to
reduce hospital morbidity and mortality. One of the six interventions was the
institution of RRTs to ensure deteriorating patients have the best chance of
improved outcomes (Berwick at al., 2006).
Early warning systems have evolved since their inception two decades ago to the
point where standardisation of EWSs is being requested by governing bodies in
implementing countries in an attempt to improve clinical outcomes for
deteriorating in-patients. Consequently, numerous centralised bodies, such as the

6
National Institute for Health and Clinical Excellence (NICE) in the United
Kingdom (UK) and the Australian Commission on Safety and Quality in
Healthcare (ACSQHC) have called for standardisation of both recognition and
response systems in their respective countries (ACSQHC, 2012; NICE, 2007).
1.2.2 EWSs in New Zealand
In NZ in 2004 a Health and Disability Commissioner (HDC) inquiry investigating
a case of 1failure to rescue a deteriorating patient in a large urban hospital,
prompted a recommendation that District Health Boards (DHBs) implement
EWSs (Seddon, 2007). A NZ study by Quirke (2011) identified that factors
associated with suboptimal care of deteriorating patients included excessive
workloads and staff shortages, ineffective teamwork and use of the shift co-
ordinator role, poor communication and unclear implementation and evaluation
strategies for new service delivery changes. The healthcare organisations
attempted to reduce clinical risk by implementing service delivery changes such
as colour coded observation charts, EWSs and critical care outreach services
(Quirke, 2011). Over time all the DHBs responded to the HDC’s recommendation
and a variety of EWSs were implemented nationwide. The EWSs vary in how
they facilitate the process of recognition, activation and response to acutely
deteriorating in-patients. By December 2012, 21 different EWSs were being used
across NZ’s 20 DHBs (Psirides et al., 2013). In December 2014 the NZ Health,
Quality and Safety Commission (HQSC) began an exploration into the
implementation of a national programme for detecting and responding to clinical
deterioration in non-pregnant, acutely hospitalised adult patients (HQSC, 2016a).
The HQSC gave DHBs until the 30th
June 2018 to prepare for and implement the
national detection and response system (HQSC, 2017b). The aim of a standardised
approach was the minimisation of adverse patient outcomes from failure to
recognise and respond appropriately to patients who deteriorate acutely (HQSC,
2016a).
1 Unrecognised patient deterioration that is not acted upon may delay treatment, management and diagnosis of
acutely unwell patients with potentially catastrophic outcomes, including unplanned admission to an ICU,
cardiac arrest or unexpected death.

7
The Sapere Research Group, commissioned by the HQSC, predicted that
standardising and improving EWSs nationally would improve the early
recognition of deteriorating patients by at least five percent (Moore & Poynton,
2015). Benefits of a single standardised system include the ability to teach the
system at the undergraduate level, eliminate retraining when moving between
hospitals, simplify data collection and reporting and allow nationwide promotion
of the system and comparisons of outcomes (Psirides et al., 2013). The NZEWS is
based on the National Early Warning Score (NEWS) used by the National Health
Service (NHS) in the UK (HQSC, 2016a). The NEWS has been found superior to
other published EWSs tested in predicting patients at risk of unplanned ICU
admissions, cardiac arrest and death within 24 hours of an elevated NEWS value
(Smith, Prytherch, Meredith, Schmidt, & Featherstone, 2013).
The detection arm of the NZEWS has been standardised and nationally mandated.
The escalation pathway for each level of clinical risk has not. There is significant
variation in the response arm of EWSs in NZ. Moore and Poynton (2015) reported
that five of the 15 regional hospitals and four of the five tertiary hospitals had
formal RRTs dedicated to responding to deteriorating patients. The HQSC
(2017b) acknowledged that situational variety makes it very difficult to be too
directive when considering a response framework. Response teams were likely to
be unique to each hospital setting, depending on the hospital size, availability of
resources and staff (HQSC, 2017b; Moore & Poynton, 2015). Although the
response arm of the NZEWS may be unique to different hospitals, standardisation
of the detection arm will facilitate a nationwide understanding among health
professionals when communicating the components of the NZEWS (HQSC,
2017b).
1.2.3 The composition of the NZEWS
Seven core vital sign parameters form the basis for the NZEWS, with a score and
zone colour allocated to each abnormal parameter (table 1). The more abnormal
the vital sign, the higher the score allocated to that vital sign. The sum of the
individual scores for each parameter determines the aggregate early warning score

8
and the required clinical zone response as determined by an escalation pathway.
Single vital sign parameters can also trigger an escalation response if they fall in
the red or blue zones, regardless of the aggregate early warning score. The
NZEWS permits senior medical staff to appropriately modify single or multiple
vital sign parameters ensuring patients with chronic disease, or known abnormal
vital signs, do not inappropriately trigger a clinical response. Clinicians can also
escalate care, regardless of the NZEWS, based on their clinical judgment (HQSC,
2017a).
Table 1 NZEWS vital sign parameters and scoring
1.2.4 Efficacy of EWSs
The risk of preventable harm from failure to recognise and respond to clinical
deterioration may increase as procedures become increasingly complex and the
population ages (Moore & Poynton, 2015). Research suggests that clinical
deterioration frequently occurs up to 24 hours before a critical event (McGaughey
et al., 2007). If hospital staff are able to recognise the early signs associated with
clinical deterioration they have a window of opportunity to intervene in order to
optimise patient outcomes (McGaughey et al., 2007). Despite the lack of

9
quantitative evidence demonstrating that EWSs improved patient outcomes, a
scoping review by La Lagadec and Dwyer (2017) concluded that there was strong
anecdotal evidence that EWSs enhanced the ability of clinical staff to identify and
respond to patient deterioration. Early warning systems were shown to improve
identification of deteriorating patients and prompt earlier calls for help (Fox &
Elliot, 2015). Frost et al. (2015) found an increase in RRT call rates with the
implementation of standardised processes and procedures which specified the
level of physiological abnormality requiring a clinical review or RRT call.
Research has found EWSs improved communication by nurses enabling them to
relay objective, quantifiable evidence when making a call for help, allowing the
doctors to prioritise their workload (Andrews & Waterman, 2005). The use of
objective criteria to escalate care facilitates evidence based, clinical decision
making (McCaughey et al., 2017b). This is particularly useful for less experienced
staff, junior staff and staff who lack self-efficacy, as opposed to senior staff who
additionally use clinical judgment and intuition to recognise deterioration and
escalate care (Moore & Poynton, 2015). Despite the benefits associated with the
use of EWSs, challenges are encountered in both the detection and response arms
of EWSs.
1.2.5 The detection arm of EWSs
Deteriorating patients are not always identified and escalated as they should be
due to shortfalls in the implementation of the detection arm of EWSs. Although
the implementation of EWSs has resulted in improved monitoring of vital signs,
especially respiratory rate, (McBride, Knight, Piper, & Smith, 2005) the user
dependent nature of recording vital signs means they are frequently incomplete, or
not taken when due (Simmes, Schoonhoven, Mintjes, Fikkers, & van der Hoeven,
2012). Pressure to complete observations at certain times and competing ward
priorities may contribute to inaccurately completed early warning score charts
(McCaughey et al., 2017b). A complete set of vital signs is required to inform
most early warning scores, so incomplete observation sets may result in missed
alerts for physiologically unstable patients. In a study of paper-based early
warning scores by Clifton et al. (2015) only 65.5% of 16,795 observation sets
were fully completed and had an accurately calculated total score. Even when a

10
complete set of observations were recorded the weights assigned to vital signs and
the aggregate scores were frequently incorrect. Other research identified that when
aggregate scores were erroneously calculated they were 11 times more likely to be
underscored than over-scored (Austen et al., 2012). When an observation set was
incorrectly calculated it was often followed by another incorrectly calculated
observation set. It appears the preceding scores predicted the outcome of
subsequent observations sets (Clifton et al., 2015). The risk is that the first sign of
instability may be missed if vital signs indicative of early signs of deterioration
were preceded by a stable sequence of normal scores. Potentially, an electronic
system that only allows clinicians to see the prior vital signs after entering all the
vital signs, may address this issue (Clifton et al., 2015).
Close monitoring of physiologically unstable patients by increasing the frequency
of observations beyond routine monitoring was recommended to identify
advancing instability or improvement (DeVita et al., 2006). This vital requirement
of the detection arm of EWSs was often not adhered to. A possible explanation
may be that nursing staff had become desensitised to frequently occurring triggers,
especially in EWSs where single parameters can generate a trigger (Smith &
Aitken, 2015). Lack of education and knowledge regarding monitoring and
interpretation of vital signs amongst nursing staff may be another possible
explanation for failure to increase the frequency of observations when prompted
(Odell, Victor, & Oliver, 2009). Competing clinical priorities, inadequate staffing
and unavailability of monitoring equipment have been identified as factors
contributing in failure to follow up with timely repeat assessments (Hands et al.,
2013; McGaughey et al., 2017b). Ward factors such as strong, visible
management, adequate staffing and a commitment to education have the potential
to address this (Smith & Aitken, 2015).
The taking of routine observations can be viewed as a ritualistic task frequently
delegated to health care assistants (HCAs) or student nurses to alleviate the
workload of registered nurses (McGaughey et al., 2017b; Wheatley, 2006). This
practice was commonly driven by excessive workloads, increasing time pressures
and low levels of qualified staff (McGaughey et al., 2017b). Student nurses and

11
HCAs may not have the necessary qualifications and/or experience to recognise
deteriorating patients and if they do, they frequently failed to communicate
abnormal findings (Odell et al., 2009; Wheatley, 2006). McCaughey et al.
(2017b) found when registered nurses delegated the recording of routine
observations to less experienced or unqualified staff there was limited
interpretation of clinical observations and holistic patient assessment.
Intuition and experience were the most common method for detecting patient
deterioration and a descriptive exploratory study conducted by Cioffi (2000) over
12 months, found experienced nurses escalated care 18 percent of the time,
because “they were seriously worried about the patient” (p. 265). Yet, concern
was seldom included as a parameter in early warning scores (Gao et al., 2007).
Intuition was most effective when the patient was well known to the nurse
enabling him/her to detect changes in behaviour or physical signs. An
experienced, intuitive nurse may identify deterioration through pattern
recognition, where deviation from the expected clinical course occurs. This
prompts the nurse to further assess the patient by monitoring vital signs to confirm
his/her suspicions (Odell et al., 2009). Patients who are effectively compensating
may have vital signs within normal limits, or only marginally changed prior to a
severe and rapid deterioration associated with decompensation (Cioffi, 2000).
Experienced nurses are generally more confident to escalate care based on
subjective cues, (McGaughey et al., 2017) while junior nurses tend to be more
rigid in their application of EWS protocols and may not have the knowledge or
past experience to detect subtle signs of deterioration (Cioffi, 2000; Odell et al.,
2009).
The barriers cited above, which contribute to failures in the detection arm may be
why studies have failed to categorically prove the efficacy of RRT’s within the
response arm (Alam et al., 2014; Hillman et al., 2005; McGaughey et al., 2007).
The following section explores what works well within the response arm and the
issues and gaps present.

12
1.2.6 The response arm of EWSs
Standardised referral protocols form the basis of the response arm of EWSs. These
protocols empower nurses to utilise the trigger score to communicate concern and
mobilise an early, bedside response from staff with the appropriate skills
(McGaughey et al., 2017a). The composition of RRTs and the available levels of
response are determined by the type and size of the hospital. For example, a large
hospital may have more than one type of response team, available 24 hours a day,
responding to different levels of deterioration. In contrast, the response team of a
small rural hospital may consist of only one person, on-site during the day, with
virtual support from a larger hospital available after hours. The standard principle
of providing an appropriate and timely response, however, should apply
irrespectively (Moore & Poynton, 2015).
The success of EWSs largely depends on the timely escalation of care associated
with reporting abnormal scores. In a Danish cross-sectional study abnormal early
warning scores were escalated by nursing staff 38% of the time (Niegsch,
Fabritius, & Anhøj, 2013). Shearer et al. (2012) found that despite their
organisation having a well embedded EWS and associated educational support, on
42% of instances the RRT was not activated for patients who fulfilled activation
criteria. A number of sociocultural factors contribute to failure to activate the
RRT. In this study, interviews with staff who failed to activate the RRT revealed
that they chose to implement alternative actions to manage patients, although they
were concerned about the patients and knew they fulfilled activation criteria. It
was reported that 13% of nurses and 26% of doctors feared that activating the
RRT would elicit a negative or hostile reaction from colleagues (Shearer et al.,
2012).
Another reason identified for failing to activate the RRT was bedside clinical staff
feeling that they had the required skill and experience to manage the patient
themselves (McCaughey et al., 2017b; Shearer et al., 2012). Even when
deteriorating patients met the criteria for RRT activation, 62% of ward nurses
tended to call the doctor overseeing the ward, instead of the RRT (Azzopardi,

13
Kinney, Moulden, & Tibballs, 2011; Radeschi et al., 2015). Prior involvement of
the critical care team, but an unavailability of ICU beds resulted in a reluctance to
re-contact the RRT when required (Shearer et al., 2012). Poor interdisciplinary
communication and inconsistent use of a formal communication tool also
contributed to escalation failure (McCaughey et al., 2017b). There was also a
reluctance to activate the RRT when clinical investigations or reviews were
pending (Shearer et al., 2012). Experienced nurses viewed the referral protocol as
a guideline which could be superseded by clinical judgement, particularly at lower
trigger scores. A lack of confidence on the part of junior nurses, reluctance to
report a single deranged parameter and an inclination to recheck observations
were other factors associated with referral delays to the RRT (McCaughey et al.,
2017b). In some hospitals a traditional hierarchical referral culture meant junior
doctors felt they needed to assess, manage and re-evaluate deteriorating patients
before calling for senior help (Azzopardi et al., 2011; McCaughey et al., 2017b).
In most cases failure of junior doctors to call for senior support was an appropriate
and informed decision based on the practitioner’s clinical judgment. Occasionally,
failure to recognise an underlying problem or to re-evaluate a patient resulted in a
failure to rescue (McGaughey et al., 2017b; Shearer et al., 2012).
Both doctors and nurses displayed some degree of protocol deviation. In one large
survey study conducted by Fox and Elliot (2015), 85% of nurse respondents
reported doctors did not review patients within the recommended time guidelines.
Doctors’ workload, particularly when busy, out of hours, or at night was perceived
by nurses as one reason for the delayed response times (Fox & Elliot, 2015). Fox
and Elliot (2015) also found a lack of knowledge of the EWS among some doctors
was perceived by the nurses as contributing to a delayed response. Some doctors
failed to realise the significance of a trigger score, the required response times as
per the escalation procedure or when to contact senior medical staff (Fox & Elliot,
2015; Niegsch et al., 2013). Although doctors and nurses frequently receive the
same initial EWS training at the commencement of employment, the influence of
clinical nurse educators and senior nurses facilitated the integration of the system
into nursing practice. In contrast, the doctors’ role in the EWS was seldom subject
to evaluation and the absence of ongoing support and training may have

14
influenced adherence to EWS protocols (Rihari-Thomas, DiGiacomo, Phillips,
Newton, & Davidson, 2017).
Most EWSs have a modification section which allows specified clinicians to
modify one or more parameters for individual patients, when clinically appropriate
to do so. For example, a patient with chronic obstructive pulmonary disease may
have a chronically elevated respiratory rate, which is normal for that patient rather
than an indication of deterioration. If the respiratory parameter is not modified for
the patient the “abnormal” respiratory rate will repeatedly generate an alert. Focus
groups conducted by Elliot et al. (2015) reported that in practice doctors were
frequently reluctant to, or omitted to complete the modification section. Failure to
justifiably modify parameters resulted in inappropriate alerts being sent to
members of a RRT (Fox & Elliot, 2015). Failure to review the modification for
continued appropriateness, within the recommended time frame, was another issue
identified by nurses. Failure to appropriately modify parameters or review
modifications put pressure on nurses who felt responsible for ensuring the
modification section on observation charts was completed appropriately (Elliot et
al., 2015). Inappropriate RRT activations may be minimised through the early
identification of those patients for whom invasive procedures or resuscitation
attempts would reasonably expect to be futile. This should prompt a discussion
and decision about palliative care options (McGaughey et al., 2017b). This
ensures that audits reviewing missed or late observation sets are not picking up
appropriately missed observations for palliative patients.
1.2.7 Electronic EWSs
There is a growing trend towards the use of systems that automate the
measurement of vital signs, assign electronic weightings to individual vital signs
and automatically calculate the total early warning score (Clifton et al., 2015).
Technological innovations allow for the automatic activation of the RRT and
documentation of clinical events and management plans. The ability of systems to
allow integration of this information into various parts of the patient’s electronic
health record (EHR) supports improved documentation, quality and access
15
(Rihari-Thomas et al., 2017). The incorporation of EWSs into an institution’s
electronic system has the potential to make reports available that can be used for
shift handovers to enable rapid identification and prioritisation of high-risk
patients (Mapp, Davis, & Krowchuk, 2013; Rihari-Thomas et al., 2017). The
ability to retrieve data which is captured electronically will also make an
evaluation of adherence to EWS protocols more effective and allow data
extraction to test the sensitivity and specificity of an EWS (HQSC, 2016a).
1.2.8 Summary
This first chapter presented an overview of widely used EWSs to detect acute,
adult in-patient deterioration and the components of both the detection and
response arms of EWSs were discussed. The researcher’s personal statement, the
research aim and objectives and the focus and structure of the integrative review
were included. The history of NZ and international EWSs was provided to give
EWSs a context in time, but the efficacy of current EWSs remains unproven due
to factors contributing to failure in the detection and response arms. Finally, an
overview of innovations, such as the use of electronic EWSs to improve the
accuracy and accessibility of patient information and the escalation of care, was
provided.

16
Chapter Two: Methodology and Research Method
2.1 Introduction
This chapter presents the chosen methodology and the rationale for selecting an
integrative review as the methodology of choice. The process for the literature
research method is also presented.
2.2 Methodology
With the growing body of literature increasingly emphasising the need to use
evidence to inform a variety of practice decisions, there is a need to search and
evaluate available research when seeking to answer a clinical question (Aveyard,
2010). Systematic reviews, integrative reviews, meta-analysis and meta-synthesis
are all types of literature reviews used to locate and synthesise large volumes of
information related to a question of interest (Schneider & Elliot, 2003). An
integrative review using a systematic process was the methodological approach
applied to this study and therefor a discussion on systematic reviews is included.
2.2.1 Systematic review
A systematic review enables practitioners to comprehensively identify all
available literature on a topic and then critically appraise and synthesise carefully
selected studies, from a large body of evidence, to answer a well-defined clinical
question (Aveyard, 2010; Cook, Mulroy, & Haynes, 1997). Internationally, the
most well-known organisation for providing guidance on conducting systematic
reviews is the Cochrane Collaboration (Schneider & Whitehead, 2013), which
produces independent systematic reviews of high quality, evidence-based
resources on the effectiveness of healthcare interventions (Aveyard, 2010). Other
organisations which use the systematic review process are NICE and the Joanna
Briggs Institute (JBI). A systematic review requires adherence to a strict protocol
to limit bias and ensure the reproducibility of the review and rigor of the process.
After formulating a clear and unambiguous research question, inclusion and
exclusion criteria are developed and used to determine the relevance of literature

17
to the research question for incorporation into the review. Reviewers are required
to develop and conduct a comprehensive and exhaustive search strategy for
relevant primary studies. To avoid publication bias, published and unpublished
literature on the topic is searched for. Selected papers and their research
methodologies are then critically appraised according to predetermined criteria in
order to assess their quality and validity. Only high-quality papers that meet the
inclusion criteria are included in the review. Finally, selected studies are
synthesised and interpreted using a systematic approach (Aveyard, 2010; Cook et
al., 1997; Thomas & Hodges; 2010).
Many systematic reviews include only quantitative studies, particularly
randomised controlled trials. When the results of several primary studies are
quantitatively combined a meta-analysis is undertaken where several statistical
results are pooled to provide an overall summary (Thomas & Hodges, 2010). This
allows more “precise, powerful and convincing conclusions” to be drawn from the
collective body of papers (Cook et al., 1997, p.378). Meta-synthesis and meta-
ethnography are two methods that can be used to combine the results of qualitative
primary studies (Aveyard, 2010; Thomas & Hodges, 2010; Whittemore & Knafl,
2005). More recently mixed methods systematic reviews, combining both
quantitative and qualitative studies, are being used to provide a holistic overview
of the evidence and a coherent narrative that is more likely to produce informative
conclusions, relevant to policymakers and practitioners, than single method
reviews (JBI, 2014).
2.2.2 Integrative review
The only review method that allows one to combine diverse methodologies to
fully understand a phenomenon is an integrative review. It is the most
comprehensive review method as it allows the inclusion of both experimental and
non-experimental research. An integrative review also combines theoretical and
empirical literature to enhance evidence-based practice by including all types of
research (De Souza, Da Silva, & De Carvalho, 2010; Whittemore & Knafl, 2005).
Integrative reviews address multiple purposes including defining concepts,
reviewing theories and evidence and analysing methodological problems related to

18
a particular topic (Broome, as cited in Whittemore & Knafl, 2005). The purpose of
this integrative review was to review available literature on the topic to answer a
specific research question. A neutral perspective was taken to review and discuss
the literature (Torraco, 2016). In order to conduct a thorough and rigorous
integrative review the literature search needs to be broad and diverse to identify all
eligible primary studies, including unpublished material, if appropriate to the
review purpose (De Souza et al., 2010). Effectively combining diverse
methodologies is challenging and particular consideration needs to be given to the
method of analysing, synthesising and conclusion drawing in order to protect
against bias and inaccurate inferences (Whittemore & Knafl, 2005). In order to
address the challenges associated with combining diverse methodologies this
current review was guided by Braun and Clarke’s (2006) six step data analysis
framework to systematically interpret and synthesise the data.
2.3 Research method
2.3.1 Research aim
The primary aim of this integrative literature review was to determine if
electronically captured clinical observations with/without automated alert systems
improve compliance with physiological EWS protocols. Research objectives were
to identify:
the effect of electronically captured observations and early warning
scores with/without automated alert systems on clinical outcomes of
deteriorating adult in-patients;
if electronically captured clinical observations improve the reliability
and accessibility of patients’ vital signs and the accuracy of calculating
early warning score totals;
if electronically captured clinical observations reduces the time required
to measure and document patients’ vital signs and increases the
frequency of vital sign recordings in deteriorating patients;
the benefits and shortfalls of electronically captured clinical observations
with/without automated alert systems.

19
The Preferred Reporting Items for Systematic Reviews and Meta-Analysis
(PRISMA) checklist was used to demonstrate that a systematic approach was
applied to the identification, selection and critical appraisal of relevant research.
Furthermore, the PRISMA checklist recommends the use of the mnemonic PICO
(population, intervention, comparator and outcome) to formulate and refine the
research question (Moher, Liberati, Tetzlaff, Altman, & Prisma Group, 2009).
Population – acutely admitted adult in-patients
Interventions – use of electronically captured clinical observations with/without
automated alert systems
Comparator – use of traditional paper-based EWSs
Outcome – improved compliance with EWS protocols and clinical outcomes of
deteriorating adult in-patients.
2.3.2 Inclusion and exclusion criteria
The following inclusion criteria applied:
primary research related to the utilisation of electronic EWSs to identify
and escalate care for deteriorating adult in-patients (aged 18 years and
above);
English language only publications;
studies published from 2008 to 2018;
peer-reviewed articles
The following exclusion criteria applied:
disease-specific electronic alert systems, for example, sepsis alert systems;
automated electronic health records which predict clinical deterioration by
combining various factors in addition to clinical observations, for example,
laboratory results;
electronic EWSs for obstetric or paediatric patient groups;
non English language publications;
studies preceding 2008
The search was limited to the last decade as computer technology changes rapidly.
The findings related to recent electronic EWSs may not be comparable to a system
utilising older technology.

20
2.3.3 Search strategy
2.3.3.1 Databases searched
An initial, broad search for literature was undertaken in Google Scholar and other
electronic databases to determine if prior literature reviews had been conducted on
the chosen topic. With none identified the assistance of the University’s Librarian
was sought to undertake a comprehensive, computer-assisted search of the
following relevant electronic databases: Medline, Cumulative Index to Nursing
and Allied Health Literature (CINAHL), Embase (Ovid), Web of Science, The
Cochrane Library, JBI and Scopus. The search was conducted using keywords and
subject headings derived from the research question (Schneider & Whitehead,
2013). Unpublished or grey literature was also searched to avoid publication bias,
as journals tend to only publish research that demonstrates interventions of a
positive nature, as opposed to research that identifies a negative or ineffectual
result (Aveyard, 2010). Grey literature databases searched were ProQuest
Dissertations and Theses, Open Grey, TRIP Database and Google Scholar (Ebling
Library, 2017).
2.3.3.2 Keywords and literature search
The search terms used were: early warning score, track and trigger, rapid
response, EWS, e-trigger, electronic observation, automated, electronic, real-time
alert. The right keywords or terms were identified by using medical subject
headings (MeSH) and the “explode” feature where appropriate (Schneider &
Elliot, 2003). The appropriate truncation symbols were used when entering
keywords into each database to ensure that a single search retrieved all root word
variations. For instance automat* reveals the following literature title variants:
automatic, automatically, automated. Where required key search terms, consisting
of two or more words, were grouped together so that individual words did not
yield a result (Aveyard, 2010). For example, in CINAHL the search term track
and trigger was placed within inverted commas to avoid these words being
searched individually and irrelevant studies been identified. To further limit the
search to articles that met the predetermined inclusion criteria, database limits

21
were imposed by ticking the following check boxes: published date range 2008 –
2018, English language and peer-reviewed articles. A step-wise search of each
database was conducted using the identified keywords/terms. Boolean operators
(“AND”, “OR”) were used to combine and narrow the search results to potentially
relevant studies only (Schneider & Whitehead, 2013). In order to comply with the
PRISMA guidelines a full search strategy for at least one database, including any
limitations imposed, is included (Moher et al., 2009).
Appendix A. Literature search of the CINAHL database
2.3.4 Article review
The titles and abstracts of the articles retrieved from the various databases were
reviewed to determine if they met the study’s inclusion criteria. When the
relevance of the title and abstract was unclear the full article was accessed and
read. Preference was not given to one study over another, but the most robust form
of evidence that addressed the research question was sought (Aveyard, 2010).
Articles failing to meet the review’s inclusion criteria were eliminated. The
remaining articles underwent full-text review and the reference lists of all relevant
articles were hand searched to identify other potentially relevant studies that may
have been missed during the database searches (Schneider & Whitehead, 2013).
This resulted in 20 articles meeting the review’s inclusion criteria.
2.3.5 Critical appraisal
Each article was critically appraised to determine whether it should be included in
the literature review based on its methodological strengths and limitations and
overall quality (Aveyard, 2010; Whittemore & Knafl, 2005). The JBI’s 2014
standard critical appraisal instruments for specific study designs were used to
evaluate the literature. The rationale for choosing the JBI was that it is one of the
organisations devoted to evidence-based practice and it provides tools for the
evaluation of varied data sources, including qualitative, quantitative, economic
research, text and opinion based evidence (JBI, 2014; Schneider & Elliot, 2003).
The selected studies were grouped together according to study type. The

22
methodological quality, validity and applicability of each study considered for
inclusion were appraised using the JBI critical appraisal tools from the System for
Unified Management, Assessment and Review of Information (SUMARI). The
JBI SUMARI appraisal tools use a checklist approach for reviewing the literature
and a scoring system based on yes/no/unclear/not applicable. Each piece of
literature was initially appraised by the student researcher and a second appraisal
was independently conducted by the researcher’s two academic supervisors. The
JBI appraisal tools allow for the calculation of confidence intervals that can be
used to set parameters for inclusion. Individual studies were only included if a
confidence interval and cut off point of 70% was achieved (JBI, 2014). There was
no discrepancy regarding the appraisal tool scores; therefore, a third independent
reviewer was not required.
Appendix B. JBI critical appraisal tools
2.3.5.1. Assessment of quantitative studies
The JBI MAStARI (Meta-Analysis of Statistics Assessment and Review
Instrument) was used to assess the quantitative studies, which included only quasi-
experimental (non-randomised experimental) studies. Critical appraisal of
quantitative studies is related to determining the validity and quality of the chosen
methodology and possibility of bias in every stage of the review (JBI, 2014).
2.3.5.2. Assessment of qualitative studies
The JBI QARI (Qualitative Assessment and Review Instrument) was used to
assess the three included qualitative studies. The tool consists of ten questions
used to determine the nature and appropriateness of the utilised methodology and
methods, as well as the meanings ascribed to the words of study participants (JBI,
2014).

23
2.3.5.3. Assessment of text and opinion articles
The text and opinion article was assessed using the JBI NOTARI (Narrative,
Opinion and Text Assessment and Review Instrument) tool. This is a six-question
tool which focusses on the authenticity of the author’s opinion, the source,
possible factors motivating the opinion and how alternative opinions are dealt with
(JBI, 2014).
2.3.6 Data extraction
Key data was extracted from studies utilising the applicable JBI data extraction
tools as a guide for each study type: quantitative, qualitative, text and expert
opinion methodology, ensuring appropriate data related to the research question
was extracted from each study type (JBI, 2014). The extracted data for each study
type was collated into a data extraction table designed by the researcher. The
process of data extraction facilitated a thorough understanding of the data, which
is necessary before the data can be analysed and one study compared with another
(Aveyard, 2010).
Appendix C. Data extraction table
2.3.7 Data analysis
Thematic analysis was the method used to analyse the data. This involved
“identifying, analysing, interpreting and reporting patterns (themes) within data”
(Braun & Clarke, 2006, p. 79). Braun and Clarke’s (2006) six phases of thematic
analysis were used to analyse and synthesise data into themes and sub-themes,
which were then presented in a narrative format. Before analysing the data
selected studies were classified according to their methodologies.
Methodologically similar studies were then analysed chronologically from oldest
to latest (Whittemore & Knafl, 2005). The initial stage of data familiarisation
involved reading and re-reading the selected literature to determine its content and
systematically identify and extract initial codes of meaningful data of interest from
all the studies. Similar codes were then collated using different colours to start

24
identifying potential themes. Coded data extracts allocated to each potential theme
were reviewed to ensure the data was cohesive within each theme and that
individual themes worked across the entire data set. Thematic maps were useful
for reviewing, refining and ultimately naming and defining the themes (Braun &
Clarke, 2006). Although this method of data analysis is typically applied to
mixed-methods and qualitative designs, it is also applicable to the analysis of data
for integrative reviews as it supports the synthesis of varied data from diverse
methodologies (Whittemore & Knafl, 2005).
Table 2 Phases of thematic analysis (Braun & Clarke, 2006)
Phase Description of the process
1. Familiarising
yourself with the
data:
Transcribing data (if necessary), reading
and re-reading the data, noting down
initial ideas.
2. Generating
initial codes:
Coding interesting features of the data in
a systematic fashion across the entire
data set, collating data relevant to each
code
3. Searching for
themes:
Collating codes into potential themes,
gathering all data relevant to each
potential theme.
4. Reviewing
themes:
Checking if the themes work in relation
to the coded extracts (Level 1) and the
entire data set (level 2), generating a
thematic “map” of the analysis
5. Defining and
naming themes:
Ongoing analysis to refine the specifics
of each theme, and the overall story the
analysis tells, generating clear definitions
and names for each theme.
6. Producing the
report:
The final opportunity for analysis.
Selection of vivid, compelling extract
examples, final analysis of selected
extracts, relating back of the analysis to
the research question and literature,

25
producing a scholarly report of the
analysis
2.4 Ethical considerations
While undertaking an integrative review does not require ethical approval, there
are several ethical considerations that need to occur before undertaking one.
Firstly, it is ethical practice to determine if a literature review has already been
conducted that answers the research question, as it would be unethical to conduct
the research again. It is also important to ensure the findings of studies included in
the review are represented accurately and fairly and that only ethically sound
studies are included in the review. It would also be unethical to present
participants’ data from included studies in a way that they may not have agreed to
when consent was obtained for the primary study (Body et al., 2010). The
researcher believes that the research has merit in that it addresses a health
phenomenon, which with advances in technology will become increasingly
important in the future. The researcher made every attempt to apply a robust
methodology to the research to ensure an integrative review of high quality was
produced.

26
Chapter Three: Results
3.1 Introduction
The key elements presented in this chapter include the results of the literature
search strategy and outcomes of critical appraisal of the literature. A table of the
included studies is provided and themes and subthemes derived from the thematic
analysis are presented.
3.2 Results of search strategy
In order to locate literature relevant to the review a comprehensive, logical and
systematic search strategy was undertaken (Aveyard, 2010). In the first instance
primary literature was sought to answer the research question. The initial keyword
search in the seven identified databases yielded 190 potential articles. After
removing 53 duplicates 137 articles remained. After reviewing the articles’
associated abstracts against the research aims and objectives and criteria for
inclusion and exclusion, a further 108 articles were eliminated. The remaining 29
articles were retrieved for full text review. Scrutiny of the reference lists of these
articles identified a further eight potentially suitable papers for full text review.
The search of grey literature yielded one further article for review. From these 38
articles 18 were excluded as they did not meet the research aim/objectives and
inclusion criteria, leaving a total of 20 articles for critical appraisal.

27
Figure 1 Flow diagram of literature research
Cinahl
n = 84
Cochrane
n = 8
Embase
n = 9
Ovid Medline
n = 19
JBI
n = 67
Scopus
n = 3
Web of Science
n = 0
Total number of articles
n = 190
Duplicate articles removed
n = 53
Total number of articles
for abstract review
n = 137
Articles not relevant to the review
n = 108
Articles for full text review
n = 29
Addition of reference list articles
n = 8
Addition of grey literature article
n = 1
Articles obtained
n = 38
Articles not meeting the inclusion criteria or
research aims/objectives
n = 18
Articles to undergo critical
appraisal
n = 20
n = 37
Articles not meeting quality appraisal
threshold 70%
n = 1
Articles included in review
n =19

28
3.3 Outcomes of critical appraisal of the literature
The articles included in this integrative review were critically appraised using the JBI
critical appraisal tools. Of the 20 articles that were quality appraised, 16 were quasi-
experimental (non-randomised experimental) studies and were critically appraised using
the JBI MAStARI quasi-experimental study tool (JBI, 2014). Two of these studies
attempted to utilise some form of control group or blinding; however, they did not meet
the criteria to be classified as randomised-controlled trials, as they did not have an
independent, separate control group and the influence of potential confounders or bias
could not be ruled out (Fletcher, Aaronson, White, & Julka, 2018; Heal, Silvest-
Guerrero, & Kohtz, 2017).
Twelve studies used a single group pre-test post-test design (Bellomo et al., 2012;
Evans et al., 2014; Guay, Murphree, & Steele-Moses, 2011; Jones et al., 2011; Kollef et
al., 2017; Meccariello, Perkins, Quigley, Rock, & Qiu, 2010; Mwulu, Westwood,
Edwards, Kelliher, & Coleman, 2012; Pullinger et al., 2017; Schmidt et al., 2015;
Smith, Banner, Lozano, Olney, & Friedman, 2009; Wager et al., 2010; Wong et al.,
2017). Two studies were retrospective audits of electronic EWSs utilising large datasets
(Hands et al., 2013; Pederson et al., 2018). In one of the quasi-experimental studies
follow up was not complete due to concerns regarding the delay in getting vital signs
entered into the patient record (Wager et al., 2010). In six of the studies it was unclear if
participants included in any comparisons were exposed to other treatment or care other
than the intervention of interest (Guay et al., 2011; Kollef et al., 2017; Meccariello et
al., 2010; Pullinger et al., 2017; Schmidt et al., 2015; Smith et al., 2009). In two of the
studies it was unclear if the participants included in any comparisons were similar
(Guay et al., 2011; Jones et al., 2011). In one study multiple measurements of the
outcome both pre and post exposure were difficult with the repeated treatment design
used in the study (Fletcher et al., 2018). Except for the study by Guay et al. (2011) all
the quasi-experimental studies met the critical appraisal threshold of 70%. The study by
Guay et al. (2011) was excluded from the review after discussion with the secondary
researchers.

29
The three qualitative studies were assessed using the JBI QARI tool. Although the
articles met the appraisal threshold of 70%, none addressed the influence of the
researcher on the research, or visa versa. The relationship between the researcher and
the study participants was also not addressed (Lang, Pinchin, Brown, & Sharples, 2016;
Mackintosch, Rainey, & Sandall, 2011; Yeung, Lapinsky, Granton, Doran, & Cafazzo,
2012). Two of the studies did not declare the researchers’ values, beliefs or theoretical
orientation, so it was not possible to identify if these potentially influenced the study
(Lang et al., 2016; Yeung et al., 2012).
The one expert opinion piece was assessed using the JBI NOTARI assessment tool.
This study met all six the quality appraisal questions and was included in the review
(Wong et al., 2015). A total of 19 articles were included in the integrative review
consisting of 15 quasi-experimental studies, three qualitative studies and one expert
opinion piece. The studies included in this integrative review obtained consent from
participants’ when this was required for the study type.

30
Table 3 Table of included studies
Authors and Year Title Study Type Sample size/setting Key findings
Smith, L.B., Banner, L. Lozano, D.,
Olney, C.M. & Friedman, B.
(2009)
Connected Care – Reducing
Errors Through Automated Vital
Signs Upload
Post-
implementation
study
Step-down cardiac ward. 20
beds. Pepin Heart Hospital in
Tampa, Florida.
There was a reduction in omission , transcription and
transmission errors with an automated system which
automatically transfers vital signs from the observation
machine to a PDA and finally the EHR.
Wager, K.A., Schaffner, M.J., Foulois,
B., Kazley, A.B., Parker, C. & Walo,
H.
(2010)
Comparison of the Quality and
Timeliness of Vital Signs Data
Using Three Different Data-Entry
Devices
An observational
study
Four medical/surgical wards
at a South Carolina Hospital.
Transcription errors reduced and there was faster
documentation of vital signs when vital signs were
entered at the point of care, directly from the
observation machine into an electronic tablet attached
to the observation machine
Meccariello, M. Perkins, D., Quigley,
L.G., Rock, A. & Qiu, J.
(2010)
Vital Time Savings
Evaluating the Use of an
Automated Vital Signs
Documentation System on a
Medical/Surgical Unit
A quasi-
experimental
design
An acute care
medical/surgical ward at a
medium sized hospital in the
US.
The use of an automated documentation system as
opposed to a manual documentation system
(Observations entered into a bedside computer)
reduced documentation errors by 75%. An average
time saving of 96.19 second was achieved using the
vital sign acquisition/automated documentation method
compared to the vital sign acquisition/manual
documentation method.
Jones, S., Mullally, M., Ingleby, S.,
Buist, M., Bailey, M. & Eddleston,
J.M.
(2011)
Bedside electronic capture of clinical
observations and
automated clinical alerts to improve
compliance with an
Early Warning Score protocol
Historically
controlled study
This study was conducted on
a medical assessment unit
and a general medical ward
at the Manchester Royal
Infirmary.
Real-time clinical deterioration alerts to a doctor’s
pager resulted in a reduction in the patient’s length of
stay from 9.7 days to 6.9 days and the clinical response
to patient deterioration increased from 29% to 78%.
Critical care admissions and the length of stay in ICU
reduced after real-time clinical deterioration alerts
were implemented. Reductions in cardiac arrest
incidence and mortality did not reach clinical
significance.

31
Bellomo, R., Ackerman, M., Bailey,
M., Beale, R., Clancy, G., Danesh, V.,
Hvarfner, A., Jimenez, E., Konrad, D.,
Lecardo, M., Pattee, K.S., Ritchie, J.,
Sherman, K., & Tangkau, P.
(2012)
A controlled trial of electronic
automated advisory vital signs
monitoring in general hospital
wards
Before-and-after
controlled trial
18305 patients constituted the study
cohort. Patients included from ten
hospitals in the US, Europe and
Australia on 12 general wards and a
total of 349 beds.
In this study the time required to complete and record a set of
vital signs and automatically calculate the early warning
score reduced from an average of 4.1 minutes to 2.5 minutes
after an automated documentation system was introduced
(vital signs transferred automatically to advisory bedside
patient monitors). The advisory bedside monitors prompted
earlier calls for help and when a RRT call was made, in-
hospital and 90 day survival rates increased from 86%-92%
and cardiac arrest rates decreased.
Mwulu, U., Westwood, D., Edwards,
D., Kelliher, F. & Coleman, J.J.
(2012)
Adoption of an Electronic
Observation Chart with an
Integrated Early Warning Scoring
System on Pilot Wards
Early phase
review
Patients from about 1200
inpatient beds and six pilot
wards (a plastics/burns ward,
three neuroscience wards and
two medical wards) at a large
university hospital in
England were included.
In this study where vital signs were captured
electronically from an observation machine to the EHR
via a bedside computer, traditional gaps in vitals sign
recordings were still found for vital signs that needed
to be entered manually, for example respiratory rates.
80.5% of the observation sets were fully completed
and produced an early warning score.
Hands, C., Reid, E., Meredith, P.,
Smith, G.B., Prytherch, D. R., Schmidt,
P.E. & Featherstone, P.I.
(2013)
Patterns in the recording of vital
signs and early warning scores:
compliance with a clinical
escalation protocol
Evaluation Study A total of 950 043
observation sets were
included in the evaluation
study from a NHS District
General Hospital on the
South Coast of England.
On screen prompts, which included instructions on
when vital signs should be rechecked as determined by
the ViEWS value, did not improve the timeliness of
rechecking vital signs and compliance was poorer
overnight compared to the day. Sicker patients were
more likely to have their vital signs recorded
overnight. There were large peaks in vital sign
recordings between 06:00 – 06:59 and 21:00 and
21:59. For patients on continuous electronic
monitoring it was mandatory for staff to document the
vital signs on VitalPac as frequently as required
according to the hospital’s clinical escalation protocol.
Compliance with regards documentation of vital signs
was also poor.

32
Evans, R.S., Kuttler. K.G., Simpson,
K.J., Howe, S., Crossno, P.F., Johnson,
K.V., Schreiner, M.N., Lloyd, J.F.,
Tettelbach, W.H., Keddington, R.K.,
Tanner, A., Wilde, C. & Clemmer,
T.P.
(2014)
Automated detection of physiologic
deterioration in hospitalized patients
Prospective
Observational
Study
All patients admitted to a 33-
bed medical/oncology ward
and a 33-bed surgical trauma
ward at a hospital in Salt
Lake City, were monitored.
In this study patients were continuously monitored and
vital signs were transferred automatically to a bedside
computer and the EHR every five minutes. Real time
clinical alerts were then sent to the CNM’s pager. The
positive predictive value of the alerts as perceived by
nurses was 91%-100%. More RRT calls were made
(60 vs 29 pre-intervention) and significantly fewer
patients died (2.6% vs 3.7%) compared to the pre-
intervention year. In the one intervention ward where
patients were older with more co-morbidities there was
a reduction in mortality, the length of stay increased
and more patients were transferred to ICU compared to
the pre-intervention year.
Schmidt, P.E., Meredith, P., Prytherch,
D.R., Watson, D., Watson, V., Killen,
R.M., Greengross, P., Mohammed,
M.A., & Smith, G.B.
(2015)
Impact of introducing an electronic
physiological surveillance system on
hospital mortality
Retrospective,
observational
study
The electronic system was deployed
in three wards in two large (>1000
bed) acute general hospitals
approximately 240km apart in
England.
After introducing an electronic early warning system crude
mortality fell from 7.75% to 6.42% at one hospital and from
7.57% to 6.15% at a second hospital. Year on year statistics
at both hospitals showed abrupt and sustained reductions in
mortality, in all specialities, which coincided with the
implementation of the electronic EWS.
Kollef, M.H., Heard, K., Chen, Y., Lu,
C., Martin, N. & Bailey, T.
(2017)
Mortality and Length of Stay Trends
Following Implementation of a Rapid
Response System and Real-Time
Automated Clinical Deterioration Alerts
Retrospective
analysis
The retrospective analysis
utilised data obtained from
eight general medical wards
of a 1250-bed academic
medical centre in St Louis,
Missouri over 12 years.
Real time clinical deterioration alerts generated by the
electronic EWS were sent to a RRT nurse’s mobile
device. The RRT nurse responded to alerts within 10
minutes. There was a reduction in mortality rates,
cardio-pulmonary arrest rates and length of hospital
stay after the EWS with real time clinical deterioration
alerts were introduced. There was a statistically
significant year-to-year increase in RRT activations
that was inversely correlated with the occurrence of
cardio-pulmonary arrests.

33
Wong, D., Bonnici, T., Knight, J.,
Gerry, S., Turton, J. & Watkinson, P.
(2017)
A ward-based time study of paper and
electronic documentation for recording
vital sign observations
Before- and- after
observational study.
577 nurse observation taking events
were observed (281 paper and 296
electronic system) on three medical
wards in two university teaching
hospitals in the UK.
It took 215 seconds to record a complete set of vital signs and
calculate the early warning score on paper compared to 150
seconds on the electronic system.
Pullinger, R., Wilson, S., Way, R.,
Santos, M., Wong, D., Clifton, D.,
Birks, J. & Tarassenko, L.
(2017)
Implementing an electronic observation
and early warning score chart in the
emergency department: a feasibility
study.
Before and after study
The study enrolled approximately
3000 subjects before and 3000
subjects after implementation of the
automated system in a high acuity
area of an emergency department in
the UK.
Pre-implementation of the electronic EWS 52.7% of subjects
had an accurately calculated early warning score compared to
92.9% after implementation. In stage one (vital signs
captured directly onto paper) only 66% of the subjects had
full EWS documentation that was available for review. In
stage two 93% of subjects had full documentation available
for review. There were no statistically significant differences
between mortality rates, cardiac arrest rates, transfers to the
resuscitation room or ICU and length of stay.
Pedersen, N.E., Rasmussen,L.S.,
Petersen, J.S., Gerds,T.A., Østergaard,
D. & Lipppert, A.
(2018)
A critical assessment of early warning
score records in 168,000
Patients
Observational Study of
NZEWS data
A total of 2,835,331 NEWS records
were included in the study from
patients admitted to public hospitals
in Denmark.
Of 2,835,331 NEWS records reviewed 10% were incomplete
with one or more vital signs missing and 0.2% of the
captured vital signs were implausible values. Digit
preferences for even numbers were found and there was an
unusually high recording of heart rate records just below 91
beats per minute which could indicate bias towards a value
that does not generate a NEWS point.
Heal, M., Silvest-Guerrero, S., &
Kohtz, C.
(2018)
Design and Development of a Proactive
Rapid
Response System
Quasi-experimental The study was conducted on two
medical-surgical wards at a 600-bed
hospital located in the Midwest.
In this study on the intervention ward a dedicated crisis nurse
was required to check the early warning score on the EHR to
detect deteriorating patients. On 132 occasions the RRT was
activated on the intervention ward. On the control ward staff
activated the RRT 110 times. The use of an electronic alert
responded to by a crisis nurse reduced the reliance on the
bedside nurse to recognise subtle signs of patient
deterioration and activate the RRT.

34
Fletcher, G.S., Aaronson, B.A., White,
A.A. & Julka, R.
(2018)
Effect of a Real-Time Electronic
Dashboard on a Rapid Response System
Repeated treatment
design
The study took place on the general
medical-surgical wards at a
teaching hospital in Washington
with 413 beds and about 19000
admissions a year.
The use of a real-time electronic dashboard which increased
the visibility of early warning scores to the entire care team,
including the RRT, did not significantly reduce overall RRT
activations, Cardiopulmonary arrests, unexpected ICU
admissions and mortality. There was a 20% increase in first
RRT activations, but overall RRT activations did not
increase. The dashboard encouraged a proactive, rather than
reactive approach to monitoring and reviewing patients at
risk, mitigating the risk of the bedside nurse not calling for
help.
Mackintosh, N., Rainey, H. & Sandall,
J.
(2011)
Understanding how rapid response
systems may improve safety for the
acutely ill patient: learning from the
frontline
Ethnographic study
The study was conducted at two
tertiary UK NHS teaching
hospitals. The Acute medical wards
of each hospital admit
approximately 15000 – 20000
patients annually. Semi-structured,
individual interviews were
conducted with 35 clinicians in
person.
After the electronic early warning system was introduced the
percentage of vital signs recorded late still ranged from 30% -
70%. Nurses reported that the electronic dashboard of
patients and their early warning scores assisted them with
sharing information, planning and allocating workloads by
glancing at the dashboard. The ability to access the EWS
remotely allowed clinicians to keep an eye on deteriorating
patients without being physically present on the ward. Nurses
expressed concern regarding an over-reliance on the EWS
and the loss of experiential-intuitive knowledge due to the
prescriptive nature of the electronic EWS.
Yeung, M.S., Lapinsky, S.E., Granton,
J.T., Doran, D.M., Cafazzo, J.T.
(2012)
Examining nursing vital signs
documentation workflow: barriers and
opportunities in general internal
medicine units
Qualitative
ethnographic analyses
and quantitative time–
motion study were
conducted
The study was conducted in five
general medical wards at three
tertiary hospitals in Toronto,
Ontario.
If the electronic EWS does not support the documentation of
vital signs at the point of care it could take longer document
vital signs. In this study it took a nurse an average of 17.2
minutes to document vital signs using the paper-based
system. At the hospital using the electronic system it took an
average of 53.2 minutes before vital signs were documented.
Transcription was common at the hospital using the
electronic EWS which increased the risk of transcription
errors and delayed the documentation of critical patient
information.

35
Lang, A., Pinchin, J., Brown, M &
Sharples, S.
(2016)
Report: Handheld Technologies in the
Ward.
Evaluation using
observation and
interviews/focus groups
The study was carried out in 19
wards in two hospitals in the UK. It
included more than eighty five
hours of observing staff directly,
interviews with forty staff and four
focus groups.
After the electronic EWS was introduced clinicians spent
more time interacting with patients and colleagues. The time
doctors spent with patients more than doubled (2.9% - 7.3%).
Interview data revealed that the electronic system improved
accessibility to patient information and improved team,
patient and relative communication. The ability to easily and
remotely access patient data provided clinical reassurance.
The handheld mobile devices used to document vital signs on
were like personal tools which allowed nurses to manage
workloads and improved situational awareness. Some
negatives reported with the electronic system were alert
fatigue, disempowerment of nurses, restrictions in terms of
access and permission and lack of senior medical staff
engagement.
Wong, D., Bonnici, T., Knight, J.,
Morgan, L., Coombes, P. &
Watkinson, P.
(2015)
SEND: a system for electronic
notification
and documentation of vital sign
observations
Post-implementation
assessment
The SEND system was deployed on
a short-stay ward, an oncology
ward and a respiratory ward within
University Hospitals in Oxford.
These wards contained a total of 59
beds.
A patient overview screen was viewed as useful during
doctors’ ward rounds and nurses’ handovers and assisted with
the immediate recognition of patients with abnormal vital
signs. User acceptability of the system was high. The System
Usability Scale score was 77.8 (all scores above 68 are
considered above average). 95.2% of users said the training
received it was “just right.” The SEND system appears to be
well accepted by staff with system usability scores ranging
from 3.9/5 to 4.3/5.

36
Appendix D. Table of excluded studies
3.4 Themes and subthemes
Thirteen of the studies investigated either the accuracy of vital signs, time taken too
document vital signs and/or timeliness of rechecking vital signs. Accurately recorded
and documented vital signs and correctly calculated early warning scores forms the
basis of the detection arm of EWSs and facilitates the detection of 1deteriorating in-
patients. These studies used a variety of methods and tools to record and document the
vital signs to the EHR. An explanation of the different tools and methods; therefore,
needed to be provided when reporting the findings of collated data for the first theme to
give the results a context.
Four studies investigated the perceptions of doctors and nurses using electronic EWSs,
which meant a heavy reliance on coded data from a few studies for this theme. Human
factors are a major factor in evaluating health information systems and compliance with
EWSs (Andargoli, Scheepers, Rajendran, & Sohal, 2017). This knowledge strengthened
the decision to assign this collated data to a main theme.
Ten of the included studies addressed the benefits and shortfalls of the electronic EWS
technology, the hardware utilised in practice and the visibility and accessibility of data
in electronic EWSs. This information formed the third theme, which focused on
technology and its contribution to patient safety.
Thirteen of the studies focused on the response arm of electronic EWSs. The included
studies used various methods to escalate care once patient deterioration was identified
and a variety of individuals or teams were tasked with reviewing the deteriorating
patient. Once again, when reporting the results of collated data for this theme, variations
across studies required explanation to allow the reader to interpret the findings in
context. Numerous studies investigated the impact of electronic EWSs on patient
outcomes, but a number of different outcome measures were used across the various
studies.

37
After coding the data four potential themes and 12 potential subthemes were
identified. The researcher discussed the suggested themes and subthemes with the
secondary reviewers. After a constructive discussion the 12 subthemes were
condensed into eight subthemes and consensus was reached on the four main themes.
A brief description of each theme and their associated subthemes are presented below.
Overall findings from the 19 included studies are then reported and related to the four
main themes and eight subthemes.
3.4.1 Theme One: The detection arm of patient deterioration in electronic EWSs
The components of the detection arm of EWSs facilitate the detection of in-patient
deterioration and the following three subthemes were identified within this theme:
Accuracy of vital signs in electronic EWSs: Accurately recorded and
documented vital signs form the basis of the detection arm of EWSs. These
components are required to generate an accurately calculated early warning
score to facilitate the detection of deteriorating patients.
Faster documentation of vital signs: Delayed documentation of recorded
vital signs increases the potential for documentation errors and hinders access
to important information required to assess the patient’s condition.
Timeliness of rechecking vital signs: Physiologically unstable patients should
be closely monitored by increasing the frequency of observations beyond
routine monitoring.
3.4.2. Theme two: Human factors associated with the use of electronic EWSs
This theme addresses the perceptions of stakeholders in electronic EWSs and forms the
basis of the second theme. One subtheme was identified within this theme:
User acceptability of electronic EWSs: The needs, expectations and
perceptions of key stakeholders must be identified and addressed in electronic
EWSs.
38
3.4.3 Theme three: Technology and its contribution to patient safety
Electronic EWS technology, the hardware utilised in practice and the visibility and
accessibility of data in electronic EWSs were addressed in the third theme. The
following two subthemes were identified:
Strengths and limitations of the technology and hardware used in
electronic EWSs: The technology, hardware and clinical environment should
support the electronic EWS in use, or it could delay the documentation of vital
signs, potentially impacting patient safety.
Visibility and accessibility of data in electronic EWSs: When vital signs and
early warning scores were readily accessible and easily visible they facilitated
the recognition of patient deterioration.
3.4.4. Theme four: The response arm in electronic EWSs and impact on patient
outcomes
The response arm facilitated the escalation of care for deteriorating in-patients to
individuals or teams, within specified timeframes, to ensure the best clinical outcomes
for deteriorating patients. The following two subthemes were identified within this
theme:
Clinician response to patient deterioration: Electronic EWSs utilise various
methods to escalate care and/or activate the RRT to ensure appropriate and
timely care to the deteriorating patient.
Patient outcomes in electronic EWSs: Ultimately all physiological EWSs
were designed and implemented to positively impact the outcomes of
deteriorating patients.
A flow diagram delineating the four themes, eight subthemes and the number of
articles representing each subtheme follows (Figure 2).

39
Figure 2 Flow diagram of themes and subthemes
Main
Themes
Title and
description Subthemes
No. of
findings
Theme
One
The detection arm of patient deterioration in electronic EWSs
Accuracy of vital signs in electronic
EWSs
Faster documentation of vital signs
Timeliness of rechecking vital signs
n=10
n=4
n=7
Theme
Two
Human factors associated with the use of electronic EWSs
User acceptability of electronic EWSs n=4
Theme
Three
Technology and its contribution to patient safety
Strengths and limitations of the
technology and hardware used in
electronic EWSs
Visibility and accessibility of data in
electronic EWSs
n=8
n=5
Theme
Four
The response arm in electronic EWSs and impact on patient outcomes
Clinician response to patient
deterioration
Patient outcomes in electronic EWSs
n=8
n=8

40
3.5 Theme one: The detection arm of patient deterioration in electronic EWSs
This theme is comprised of the following three subthemes: Accuracy of vital signs in
electronic EWSs, faster documentation of vital signs and timeliness of rechecking vital
signs.
3.5.1 Subtheme one: Accuracy of vital signs in electronic EWSs
`
The first section of this subtheme refers to studies using automated vital sign
documentation systems and their contribution to the accuracy of vital signs in
electronic EWSs. One study used a system to automatically transfer vital signs from
the observation machine to the patient’s EHR. This system utilised infrared technology
to automatically transfer vital signs from an observation machine to a personal digital
assistant (PDA). The registered nurse or nurse technician then confirmed the display
of vital signs on the PDA by pushing a button which automatically transferred the vital
signs to the patient’s EHR and to a vital sign sheet. In this study the nurse was
required to review and validate the vital signs within the EHR before they became a
permanent part of the EHR. Respiratory rates needed to be entered manually as the
observation machine did not measure respiratory rates (Smith et al., 2009).
In the automated system utilised by Meccariello et al. (2010) vital signs were captured
automatically from the observation machine directly to the EHR after confirming the
vital signs on the observation machine. The use of this automated documentation
system, as opposed to a manual documentation system, reduced documentation errors
by 75%. Of the 92 sets of vital signs done utilising the automated documentation
system, there was a reported error rate of 3.3%. The three errors that occurred were
difficultly scanning the patient’s identification bar-code, one typographic error (typing
the manually entered respiratory rate or pain score into the computer incorrectly) and
one omission error for failing to enter a result that required manual entry (Meccariello
et al., 2010).
Within the automated system utilising infrared technology there were 60 errors in
total, representing an error rate of 0.66%. There were 53 errors of omission (non-entry
of a vital sign or non-validation of the EHR) accounting for 0.58% of the total

41
recorded vital signs. Twenty respiratory rates were missing which may have been due
to the requirement to enter the respiratory rate manually into the PDA or EHR. Three
complete sets of vital signs were missing because the nurse did not review and validate
the vital signs within the EHR. Sixteen oxygen saturation values and five pulse rate
values were missing. In 13 cases the nurse removed the saturation probe from the
patient’s finger before the data was transmitted from the observation machine to the
PDA. There were seven transcription errors (applying to manually entered values),
accounting for 0.08% of the total recorded vital signs. In one case the respiratory rate
was erroneously entered into the saturation parameter. In a second case the nurse
manually entered an entire set of six vital signs directly into the EHR for the wrong
patient, rather than reviewing and validating the vital signs from the PDA. There were
no transmission errors associated with the automated transfer of vital signs (Smith et
al., 2009). A limitation of these studies is that neither identified who made the errors,
registered nurses or nurse technicians, or if accuracy was influenced by other factors
such as the experience level of staff, patient load or patient acuity (Meccariello et al.,
2010; Smith et al., 2009).
A number of the studies included in this integrative review required the manual entry
of vital signs into the patient’s EHR (Hands et al., 2013; Jones et al., 2011;
Mackintosch et al., 2011; Meccariello et al., 2010; Mwulu et al., 2012; Pederson et al.,
2018; Pullinger et al., 2017; Schmidt et al., 2015; Wager et al., 2010; Wong et al.,
2017; Yeung et al., 2012). When vital signs were entered manually at the point of care,
documentation errors were reduced. In one study the manual transcription of vital
signs from a piece of paper to a computer-on-wheels or workstation kept outside the
patient’s room, resulted in a transcription error rate of 15.2%. When vital signs were
manually entered at the point of care, directly from the observation machine to an
electronic tablet attached to the machine, transcription errors reduced to 5.6% (Wager
et al., 2010). In this study vital signs were recorded by nurse technicians (nursing
assistants) rather than registered nurses. Accuracy results between studies using nurse
technicians to enter vital signs, rather than registered nurses, may not be directly
comparable.

42
Similar findings were reported by Yeung et al. (2012) where they found hospitals
using electronic EWSs did not accommodate vital sign documentation at the point of
care. Consequently, transcription from paper to computer was common and increased
the risk of transcription errors and contributed to gaps in the recorded data. In contrast,
fewer transcription errors were found at the paper-based hospitals in their study where
vital sign charts were conveniently located at the patient’s bedside (Yeung et al.,
2012). In the manual documentation period of their study, Meccariello et al. (2010)
reported a combined error rate of 13.5% from 52 sets of vital signs. In this study vital
signs were either captured from the observation machine into the EHR via a bedside
computer, or onto a piece of paper before entering into a computer outside the
patient’s room (Meccariello et al., 2010). Conversely, Jones et al. (2011) reported
100% accuracy with the manual entry of vital signs from the observation machine
directly to the EHR via a PDA.
Electronic EWSs automatically and accurately calculate an early warning score once
all the physiological variables are entered. Electronic EWSs that allow for the partial
entry of vital signs are more likely to have incomplete sets of vital signs (Mwulu et al.,
2012; Pederson et al., 2018). If all the required vital signs are not entered an early
warning score cannot be calculated as identified by Mwulu et al. (2012) where only
80.5% of the observation sets produced an early warning score. The wards included in
this study had levels of completeness of observation sets ranging from 69% to 92%
(Mwulu et al., 2012).
In a large observational study of 2,835,331 NEWS records the electronic system
automatically calculated the early warning score if all seven vital signs comprising the
NEWS were entered. In this study 271,103 (10%) of the NEWS records had one or
more missing vital signs and implausible values were found in 0.2% of the records.
Some of these erroneous or extreme values may have been eliminated if the system
was programmed to identify erroneous records at the point of entry. Due to the limited
knowledge the researchers had on the data collection practices in the different
hospitals, potential sources of error or extraneous variables could not be identified
(Pederson et al., 2018). The EWS in the study by Mackintosh et al. (2011) had inbuilt
safety prompts advising when an incomplete set or “unlikely” vital signs were entered.

43
These prompts, together with a record of who entered the vital signs, improved the
completeness of vital signs (Mackintosh et al., 2011).
Schmidt et al. (2015) found that in both study sites where the EWS required users to
enter a full set of vital signs on each occasion of taking routine observations, a
complete set of vital signs was completed 98% of the time. Pullinger et al. (2017) had
similar findings where 92.9% of their subjects had an accurately calculated early
warning score after implementation of the electronic EWS. Pre-implementation vital
signs were captured on paper and the early warning score was calculated manually
with an accuracy rate of 52.7% (Pullinger et al., 2017).
Mwulu et al. (2012) found traditional gaps in vital sign recordings, like the recording
of respiratory rate. The researchers acknowledge that expecting a complete set of
observations to be recorded on every occasion of vital sign monitoring is unrealistic
(Mwulu et al., 2012). An incomplete set of vital signs may be entered due to protocol
non-adherence (Pederson et al., 2018), but occasionally if there is clinical concern
around only one or two vital signs some researchers suggest it is appropriate to only
monitor the pertinent vital signs more frequently (Mwulu et al., 2012; Pederson et al.,
2018). Pederson et al. (2018) found that a large percentage of partially entered vital
signs were followed by complete records shortly after.
When reporting on the accuracy of vital signs it is worth noting that staff practice may
have an influence on recorded vital sign values. In a study by Pederson et al. (2018),
which had access to NEWS data from a public hospital system covering 1.7 million
people and the ability to merge data from multiple hospitals, digit preferences for even
numbers were found for respiratory rates, oxygen flow rates, heart rate and systolic
blood pressure. In addition, the authors postulated that distribution anomalies like
scoring heart rate records just below 91 beats per minutes could indicate bias towards
a value that does not generate a NEWS point. This finding suggests that manually
entered data may not always be a true and accurate representation of recorded vital
signs (Pederson et al., 2018). The accurate capture of a complete set of vital signs is
important, as is the timely documentation of the captured vital signs.

44
3.5.2 Subtheme two: Faster documentation of vital signs
Timely documentation of vital signs is important so that early warning scores can be
determined and provided to clinicians. The literature highlights the need for the
clinical environment to support the documentation method utilised. Vital sign
documentation into the medical record occurs more promptly when the patient’s chart
or documentation tool is located in a convenient location for the nurse (Yeung et al.,
2012). Wager et al. (2010) found that it took an average of nine minutes 15 seconds to
input vital signs from paper into computers outside the patient’s room as computers
were often occupied by other clinicians. This delay in inputting the vital signs into the
patient’s medical record caused such grave concerns among medical staff that this
stage of the study was cut short. When vital signs were entered directly into an
electronic tablet affixed to the observation machine, imputation took 35 seconds
(Wager et al., 2010).
Nurses in a study by Wong et al. (2017) also entered vital signs directly into a tablet
mounted alongside the observation machine. Introduction of their electronic
observation system resulted in a statistically significant reduction in the time taken to
record and document vital signs compared to paper. The geometric mean time to
record and document a set of vital signs was 215 seconds on paper, compared to 150
seconds on the electronic system. This reduction was significant even after allowing
for differences between wards, nursing levels, individual nursing behaviour and
encountered interruptions. The time reduction; however, was only clinically
significant in one of the three wards studied and the sample size was smallest for this
ward (Wong et al., 2017). The reason for the large time saving in one ward, compared
to less significant time savings in the other two, was not addressed by the researchers.
Yeung et al. (2012) found that in their study’s electronic-based hospital it took an
average of 53.2 minutes before vital signs were documented, as their electronic
documentation system was not conducive to vital sign documentation at the point of
care. At the hospital using an electronic documentation system vital signs were always
transcribed onto interim paper notes before being documented electronically. In
comparison in their paper-based hospitals, where vital signs were documented onto
paper charts, it took an average of 17.2 minutes to document vital signs. In this study it

45
was also found that 53% of the patients’ vital signs were memorised for more than one
minute before documenting on any medium, namely a paper chart, electronic record or
interim paper notes. Vital signs were memorised for the longest period before
documentation in the hospital where vital signs were documented electronically. This
delayed the communication of potentially critical patient information and contributed
to additional errors and compromised data (Yeung et al., 2012).
Automated documentation systems automatically transfer the vital signs to the
patient’s EHR thus eliminating manual documentation (Bellamo et al., 2012;
Meccariello et al., 2010; Smith et al., 2009). In the study by Meccariello et al. (2010) it
took an average of 107.5 seconds to acquire and document the vital signs using an
automated documentation system. The acquisition and documentation of vital signs
took 203.69 seconds where vital signs were recorded on paper and then entered into a
computer in the hallway and 131.63 seconds when vital signs were acquired and
manually documented to a bedside computer. An average time saving of 96.19
seconds was achieved when using the vital sign acquisition/automated documentation
method compared to the vital sign acquisition/manual documentation method to a
remote computer. This equated to almost 120 hours a month for a 36 bed unit where
vital signs were recorded on average four times a day. This study did not measure the
time lag between acquiring and documenting the vital signs into a computer outside
the patient’s room, so it may have taken even longer before the vital signs were
available to clinicians in the EHR (Meccariello et al., 2010).
The automated documentation system utilised by Bellamo et al. (2012) decreased the
average time required to acquire, document and calculate the early warning score from
4.1 minutes to 2.5 minutes. This resulted in a time saving of about 1750 nursing hours
per ward per year (Bellamo et al., 2012). In this study the documentation method used
pre-implementation of the automated documentation system was unclear, as was the
explanation of how this time difference was measured.
In the paper phase of the study by Pullinger et al. (2017) the full EWS documentation
was only available for review in 66% of the subjects. The principle reason for lack of
available EWS chart was that 24% of subjects had vital signs written in their notes, but
not on the EWS chart. In contrast, when the electronic EWS was implemented 93% of

46
the subjects had full documentation available for review. In this before and after
design other variables may have contributed to this improvement in documentation
between the two study stages, as quality initiatives were implemented and
improvements were made in staff training and workflow (Pullinger et al., 2017). In
addition to ensuring recorded vital signs are documented in a timely manner they must
also be rechecked at regular, protocol-driven intervals to facilitate the detection of
trends towards physiological deterioration.
3.5.3 Subtheme three: Timeliness of rechecking vital signs
Although many of the EWSs included in this review provided prompts regarding the
frequency of subsequent vital signs based on the early warning score and the EWS
protocol, (Bellamo et al., 2012; Jones et al., 2011; Meccariello et al., 2010; Pederson
et al., 2018; Pullinger et al., 2017; Schmidt et al., 2015) these prompts were not always
responded to. Electronic systems did not improve the timeliness of rechecking
observations in a study by Jones et al. (2011). Compliance with rechecking
observations according to the recommended timeframe for deteriorating patients did
not change significantly between the baseline phase when vital signs were captured on
paper and the alert phase with electronic capture. The percentage of vital signs
recorded late still ranged from 30% to 70% (Jones et al., 2011). A similar finding was
reported by Mackintosh et al. (2011) who found compliance to protocol in terms of
rechecking observations remained variable after implementation of the electronic
system. In contrast, a retrospective analysis of vital signs by Pullinger et al. (2017)
revealed that with the electronic system vital signs were recorded more frequently for
patients with a high early warning score, than with the paper-based system. This was
attributed to an increased awareness of patient deterioration over time and to the
automated prompts given by the electronic system to increase the frequency of vital
sign monitoring in deteriorating patients (Pullinger et al., 2017).
In the study of 950 043 observation sets it was found that irrespective of the Vitalpac
Early Warning Score (ViEWS) value, adherence to protocol was always greater in the
day than at night. During the day-time for patients with a ViEWS of 3-6, it took 5.64
hours to document their next set of observations, 4.91 hours for patients with a ViEWS
of 7–8 and 4.22 hours for patients with a ViEWS ≥ 9. At night-time it took 7.88 hours

47
(ViEWS: 3–6), 6.59 hours (ViEWS: 7–8) and 5.17 hours (ViEWS: ≥9), respectively.
These vital signs should have been documented at four hours (ViEWS: 3–6), one hour
(ViEWS: 7–8) and 30 minutes (ViEWS: ≥9). Only 12.81% of the daily vital signs
were recorded between the hours of 23:00 and 05:59. This increased to 23.84% for
patients with a ViEWS score ≥ 9, indicating that deteriorating patients were monitored
more frequently during these hours. Despite the finding that there was less variability
in the frequency of vital sign recording among sicker patients, 47.42% of patients with
a recorded ViEWS of 7-8 and 31.22% of patients with a recorded ViEWS value ≥ 9,
between 20:00 – 23:59, did not have their vital signs rechecked in the next six hour
period. There were also two large peaks in vital sign recording between 06:00-06:59
and 21:00-21:59 and the RRT was more frequently activated during peak times of vital
sign recording than at night. Failure to check observations may miss early patient
deterioration and undermine the effectiveness of any EWS (Hands et al., 2013).
3.5.4 Summary of theme one
This theme reported on the accuracy of vital signs and aggregate early warning scores,
documentation of vital signs and timeliness of rechecking vital signs in electronic
EWSs. These components form the basis of the detection arm of EWSs. The evidence
in this theme demonstrated that electronic EWSs improve the accuracy of vital signs
and aggregate early warning scores, providing the available technology and clinical
environment supports the documentation of a complete set of vital signs at the point of
care. Compliance to a pre-determined protocol with regards the timeliness of
subsequent vital signs measurements did not generally improve in electronic EWSs.
The second theme considers human factors associated with the use of electronic EWSs
described by four of the included studies.
3.6 Theme two: Human factors associated with the use of electronic EWSs
This theme is comprised of the following subtheme: User acceptability of electronic
EWSs.
48
3.6.1 Subtheme one: User acceptability of electronic EWSs
Nurses were noted as being anxious initially when it came to using electronic charts
(Lang et al., 2016; Mwulu et al., 2012). They feared the use of new technology and
that increased monitoring would increase their workload. After a period of adjustment,
nurses engagement with the electronic chart was, however, generally positive (Mwulu
et al., 2012). Lang et al. (2016) found nurses reported the technology increased their
workload and stress. The stress was reported as sustained due to staff feeling
unsupported by the information technology (IT) help service and the absence of a
sustainable procedure to provide feedback to IT.
In the post-implementation assessment of one electronic EWS, Wong et al. (2015)
reported that qualitative acceptance of the electronic EWS was high as indicated by
the system usability scale score of 77.8 (all scores above 68 were considered above
average). Clinical users’ perception of the training received prior to the
implementation of the EWS application was high with 95.3% (62 of 65 users)
indicating that they had been taught how to use the system. Four point eight percent
of those said the training was “not enough”, 95.2% said it was “just right” and no-one
said it was “too much”. This particular EWS appeared to be well accepted by staff
with system usability scores ranging from 3.9/5 to 4.3/5 (Wong et al., 2015).
Senior nurses expressed concern that nurses may become over reliant on the electronic
EWS and lose the ability to detect patient deterioration through clinical assessment
(Lang et al., 2011; Mackintosh et al., 2011). Intuitive-experiential knowledge was
acknowledged by a number of senior nursing and medical staff to be a valid element in
detecting early deterioration (Mackintosh et al., 2011). Mackintosh et al. (2011) found
that the PDA used to record vital signs directed the users to follow a routine with
every instance of vital sign recording. On some occasions junior staff and HCA’s in
particular were so focused on adhering to the routine that they lost sight of other subtle
or significant signs of deterioration, such as increased restlessness (Mackintosh et al.,
2011).
Two of the included qualitative studies sought the doctors’ perspectives on electronic
EWS (Lang et al., 2011; Mackintosh et al., 2011). Doctors expressed frustrations

49
about policies which restricted their access and permissions in the electronic EWS
causing disruptions to working practices. For example, some electronic EWSs only
allow consultant physicians to modify parameters, although registrars work
independently within the system and only access advice from consultants when
required. Both nursing and medical staff expressed frustration about the lack of senior
medical staff engagement with the new electronic system and this was perceived as
hindering team communication round the use of the system. This lack of buy in was
perceived as limiting the system in terms of realising its potential benefits in practice.
Both doctors and nurses spent more time with patients after the electronic system was
introduced and in the case of doctors this time more than doubled (2.9% to 7.3%).
These findings were confirmed by interview data where medical staff expressed that it
appeared the electronic system and handheld devices assisted with task and time
management and reduced the time spent searching for people and information (Lang et
al., 2011).
3.6.2 Summary of theme two
This theme focused on the views and experiences of users and stakeholders in
electronic EWSs. After a period of adjustment and engagement system usability scores
were high. The following factors were identified as contributors to users’ acceptance
of electronic EWSs: adequate initial training, on-going IT support, recognition of the
value of intuitive-experiential knowledge apart from the electronic EWSs and time
savings. Access restrictions and disengagement of senior medical staff were
frustrations associated with the use of electronic EWSs. The third theme focusses on
the technology used in electronic EWSs and its contribution to patient safety.
3.7 Theme three: Technology and its contribution to patient safety
This theme is comprised of the following two subthemes: Strengths and limitations of
the technology and hardware used in electronic EWSs and visibility and accessibility
of data in electronic EWSs.

50
3.7.1 Subtheme one: Strengths and limitations of the technology and hardware
used in electronic EWSs
To ensure recorded vital signs were assigned to the correct patient a number of the
electronic EWSs required nurses to scan the bar-code on the patient’s wristband to
determine the patient’s identification (Meccariello et al., 2010; Smith et al., 2009;
Wong et al., 2015; Wong et al., 2017). Two systems also required the clinician’s
identification badge barcode to be scanned in order to access the vital signs screen
(Meccariello et al., 2010; Wong et al., 2015).
In the study conducted by Wager et al. (2010) the size of the computer on wheels
meant that technicians could not enter the vital signs at the point of care as it was too
difficult to manoeuvre the computer and observation machine into the patient’s room.
The resulting delay in documenting vital signs had implications for patient safety,
especially in the acute ward setting. The electronic EWS utilised by Yeung et al.
(2012) required an extensive amount of additional mandatory data to be entered. The
time required to do so deterred nurses from documenting directly into the bedside or
hallway computers where the ergonomics were unfavourable. For security purposes
the computers were locked in cabinets, which needed to be unlocked before nurses
could access them and launch the vital sign application. Computers at the central
nursing stations were also frequently occupied. As a result of these challenges, nurses
in this study frequently deferred the documentation of vital signs in favour of more
imminent clinical tasks, or until the end of their shifts. This documentation delay
meant that patient information was frequently not available for clinical decision
support and there was an increased risk of transcription errors, potentially impacting
patient safety (Yeung et al., 2012). In the qualitative study by Lang et al. (2016) the
nurses expressed concern about the reliance on the electronic EWS, which may be
problematic if the technology infrastructure fails, or if there are insufficient devices to
accommodate casual nurses and student nurses.
None of the included studies using handheld PDA’s to document vital signs at the
point of care reported any significant issues related to the technology or the PDA’s
themselves (Hands et al., 2013; Jones et al., 2011; Lang et al., 2016; Mackintosh et al.,
2011; Pullinger et al., 2017; Schmidt et al., 2015). In one phase of the study by

51
Meccariello et al. (2010) PDA’s were also available to record vital signs, but were not
preferred by technicians, so only one set of vital signs was completed with this device.
The reason for preferring to use alternative options available, namely bedside
computers or remote computers was not mentioned by the researchers in this study.
Very few technical problems were encountered when electronic EWSs automatically
transferred vital signs to the patient’s EHR (Bellamo et al., 2012; Evans et al., 2014;
Meccariello et al., 2010; Smith et al., 2009). In the study by Smith et al. (2009) the
requirement for the nurse to confirm the display of vital signs on two occasions before
they became a permanent part of the EHR resulted in three missing sets of vital signs,
because the nurse failed to do so. The study did not identify if this requirement added
any value, or if it was an additional step which could have affected outcomes. No
errors occurred with the automated transmission of vital signs form the observation
machine to the PDA, or from the PDA to the EHR (Smith et al., 2009). There was one
instance of inability to scan the patient’s identification bar-code in the automated
documentation system utilised in the study by Meccariello et al. (2010). The strengths
and limitations of the different hardware and technology in electronic EWSs
contribute to their success or failure, as does the visibility and accessibility of vital
signs and early warning scores.
3.7.2 Subtheme two: Visibility and accessibility of data in electronic EWSs.
All the electronic devices in the included studies automatically and wirelessly
transferred the recorded vital sign data to the patient’s EHR. This enabled vital signs
to be viewed from any device linked to the hospital’s intranet with required access
rights (Evans et al., 2014; Hand et al., 2013; Jones et al., 2011; Lang et al., 2016;
Mackintosh et al., 2011; Pullinger et al., 2017; Schmidt et al., 2015). The ability to
access the observation data from the EHR remotely, along with other clinical data such
as blood results, enabled doctors to better understand the deteriorating patient picture
and “keep an eye” on patients at risk, without being physically present on the ward
(Lang et al., 2016; Mackintosh et al., 2011). In the study by Lang et al. (2016) medical
staff reported regularly accessing the system to monitor the progress of patients they
had treated. While this was done for personal and clinical reassurance it may be
problematic if this practice interferes with work life balance (Lang et al., 2016). Some

52
nurses reported that the ability to view a patient’s status was compromised by the fact
that during busy periods, computers on wheels were not readily available to log in and
view the electronic vital signs (Mackintosh et al., 2011).
In contrast, interview data with staff in the study by Lang et al. (2016) revealed
various benefits associated with the accessibility of data in the electronic system. Staff
reported that the electronic system and the ability to view patient observations on
handheld mobile devices improved accessibility to patient observations and improved
team communication by fast tracking discussions about the care of deteriorating
patients. The nurses also reported the accessibility of information provided them with
reassurance concerning the patient’s state of health and facilitated communication with
patients and their relatives, as requests for information could be responded to without
having to locate colleagues or paper charts (Lang et al., 2016). Finally, the ability to
access data from an electronic EWS facilitated the collection of data for analysis and
benchmarking performance, such as completeness and timeliness of observations and
adherence to escalation protocol (Mackintosh et al., 2011).
When vital signs and or early warning scores were readily visible to clinicians the
ability to identify trends and quickly evaluate the patient’s condition was supported
(Evans et al., 2014; Fletcher et al., 2018). In the study by Evans et al. (2014) patients
were continuously monitored and vital signs were transferred automatically to a
bedside computer and the EHR every five minutes. The vital signs were graphically
displayed on the bedside computer which helped overcome the barrier of insufficient
patient visualization and failure to recognise physiologic deterioration (Evans et al.,
2014). Real time electronic dashboards or patient overview screens, ranking all
patients according to their early warning score, facilitated rapid assessment of the
status of all acute patients and deterioration trends over time (Fletcher et al., 2018;
Mackintosh et al., 2011; Wong et al., 2015). Additional benefits associated with
patient overview screens or dashboards included assisting clinicians with information
sharing, planning and allocating workloads by glancing at the dashboard (Mackintosh
et al., 2011; Wong et al., 2015).
53
3.7.3 Summary of theme three
This theme highlighted the importance of technology and hardware to be fit for
purpose in the implemented clinical environment and for vital signs to be visible and
accessible. Technology is constantly changing and developments in technology should
always be evaluated to ensure they support, rather than hinder health care quality and
patient safety. The final theme considers the response arm of electronic EWS and
impact on patient outcomes.
3.8 Theme four: The response arm in electronic EWSs and impact on patient
outcomes
This theme is comprised of the following two subthemes: Clinical response to
deteriorating patients and patient outcomes in electronic EWSs.
3.8.1 Subtheme one: Clinical response to deteriorating patients
During the automated alert phase of the study by Jones et al. (2011) when real-time
clinical alerts were sent to doctors’ pagers the clinical response to patient deterioration
increased from 29% to 78%. Patients with the highest early warning score (> 5) were
responded to on 67% of deterioration instances in the baseline, paper-based EWS
phase; compared to 96% during the electronic EWS with automated alert phase. In this
study the EWS used not only issued alerts, but reissued reminders if clinicians did not
attend the patient within the EWS protocol time. If the reminders failed an alert was
sent to more senior doctors, for example, a registrar or consultant, until the alert was
attended to and acknowledged. Compliance with the EWS protocol in terms of
response times during the baseline phase was not reported on due to poor
documentation of attendance times in the paper record. Although the electronic EWS
automatically documented the time of clinical response after acknowledging the alert,
the opportunity to report on response times with the electronic EWS was missed in this
study (Jones et al., 2011).
When an automated alert signalling clinical patient deterioration was sent to the
CNM’s pager the nurses on both study units called the physician on 51% (unit A) and

54
44% (unit B) of occasions following review and discussion with the CNM (Evans et
al., 2014). The positive predictive value of the alerts as perceived by the nurses was
91%-100%. The nurses’ acceptance and approval of the system meant that their
evaluations may have been biased and swayed towards a higher positive predictive
value (Evans et al., 2014).
In the study by Kollef et al. (2017) when real time clinical deterioration alerts were
sent to the RRT nurse’s mobile device, internal audits showed that in 95% of cases the
RRT nurse responded to alerts within 10 minutes. The study found that the use of an
electronic EWS and real-time clinical deterioration alerts, in addition to nursing
assessments, ensured rapid activations of the RRT and minimised delays often
associated with a non-automated system. There was a statistically significant year-to-
year increase in the number of RRT activations that was inversely correlated with the
occurrence of cardiac arrests. The correlation between increased numbers of RRT
activations and decreased cardio-pulmonary arrests gives merit to the clinical findings
of this study as outlined above (Kollef et al., 2017).
Only two of the studies displaying onscreen prompts with actions required to be taken
by the nurse according to the hospital’s escalation protocol, reported on how the
prompts contributed to protocol adherence in terms of response to patient deterioration
(Bellamo et al., 2012; Mackintosh et al., 2012). In the study by Bellamo et al. (2012) a
similar number of RRT calls were made during the intervention and control periods.
However, RRT calls made for abnormal respiratory rates increased by 52% during the
intervention period, as the bedside advisory monitors forced the nurses to manually
enter the respiratory rates to calculate the early warning score. It was also found that
patients had fewer physiological abnormalities at the time of the RRT call, indicating
that the advisory monitors encouraged and prompted earlier calls for help (Bellamo et
al., 2012). Mackintosh et al. (2011) reported that compliance to protocol greatly
increased with prompts for escalating care provided by the electronic system. There
were some disadvantages reported with the use of onscreen alerts like reducing
potentially beneficial dialogue between staff regarding patient deterioration
(Mackintosh et al., 2012). Another disadvantage associated with onscreen alerts was
reported in the qualitative study by Lang et al. (2016) where the nurses reported that

55
onscreen alerts created alarm fatigue and cognitive overload, resulting in work arounds
to turn alarms off.
Two of the included studies looked at the benefit of not having to rely only on the
bedside nurse to activate the RRT for deteriorating patients (Fletcher et al., 2018; Heal
et al., 2018). In the study by Fletcher et al. (2018) an electronic dashboard ranking all
patients according to their aggregate early warning score enabled the entire care team,
including the RRT, to rapidly identify patients with abnormal vital signs who could
trigger the RRT. The study used a repeated treatment design where the dashboard was
turned on for a week and then off for a week. On weeks where the dashboard was
turned on it could be used to activate the RRT, in addition to the traditional method of
the RRT being activated by the bedside nurse. With the use of the dashboard there was
a 20% increase in first RRT activations, which was statistically significant, but overall
RRT activations did not increase. It was reported that the dashboard may have alerted
the RRT to patients who met activation criteria, but were not escalated. The dashboard
also displayed patients from high to low early warning scores and the RRT may have
responded to deteriorating patients with raised early warning scores below the usual
level for activation. The activation threshold may have been lowered for the initial
RRT review, but the subsequent RRT thresholds were maintained. A strength
associated with the repeated treatment design is that it enabled the examination of the
effect of the dashboard on RRT activation in a real life setting with a comparable
control group. This type of study has greater internal validity than a pre-post study
design as the influence of cofounders is less likely. To compensate for spill-over
effects with this randomisation approach the analysis was based on the first alert. A
limitation of this study is that it did not specify if the RRT was activated as a result of
viewing the dashboard, or if bedside nurses activated the RRT independently of the
dashboard. Staff were not blinded to the use of the dashboard and knowing that they
were been observed may have prompted them to activate the RRT without viewing the
dashboard scores (Fletcher et al., 2018).
Bedside nurses on both the intervention and control wards in a study by Heal et al.
(2018) were unaware of the vital sign parameters and aggregate early warning scores
that would trigger a response, as a new EWS was implemented on both wards without
education. On the intervention ward a dedicated crisis nurse was required to check the

56
EHR and respond to any early warning score of three or more, every four hours. This
reduced the reliance on the bedside nurse to recognise subtle signs of patient
deterioration and activate the RRT. On the control ward the bedside nurses activated
the RRT 110 times based on their perception of a patient’s need. In comparison, the
crisis nurse on the intervention ward activated the RRT 132 times. A limitation of this
study is that the crisis nurse only reviewed the EHR for trigger activation every four
hours, so further deterioration may have been missed during this period (Heal et al.,
2018). In addition, had the bedside nurses been made aware of the EWS parameters
that should trigger a response, they may have activated the RRT more frequently. Both
these studies encouraged a proactive approach to the timely identification of patient
deterioration and did not rely solely on the bedside nurse to activate the RRT (Fletcher
et al., 2018; Heal et al., 2018). The various methods used in electronic EWSs to trigger
a protocoled response to patient deterioration from staff with the appropriate skills
may have an impact on patient outcomes in electronic EWSs.
3.8.2 Subtheme two: Patient outcomes in electronic EWSs
Four of the studies included in this integrative review automatically generated real-
time clinical alerts if the early warning score triggered signs of physiologic patient
deterioration. These automated alerts were sent to doctors’ pagers (Jones et al., 2011),
the CNM’s pagers (Evans et al., 2014), a dedicated RRT nurse’s mobile phone (Kollef
et al., 2017) and email alerts via a mobile device to the critical care outreach team
(Mwulu et al., 2012).
In a study by Jones et al. (2011) patient bedside vital signs were taken manually and
the results were entered into a PDA. Real-time clinical deterioration alerts were then
sent to a duty doctor’s pager. During the baseline phase traditional systems were used
to alert doctors to deteriorating patients. These included calls from nurses, pagers sent
by switchboard or personal notifications. Following the introduction of real-time
clinical deterioration alerts a significant reduction in the patient’s length of stay from
9.7 days to 6.9 days was reported. During the baseline phase 14 patients were admitted
to ICU and their combined length of stay in ICU was 51 bed-days. When automated
alerts were sent five patients were admitted to ICU and their combined length of stay

57
in ICU was 26 bed-days. Reductions in cardiac arrest incidence and mortality did not
reach clinical significance (Jones et al, 2011).
The opposite was found in a study by Evans et al. (2014) where during the
intervention year automated clinical deterioration alerts were sent to the CNM’s pager.
The alerted patients on one of their study units had a significantly longer hospital stay
during the intervention year compared to the pre-intervention year. This may be
because the alerted patients generated more RRT calls, had more interventions or were
transferred to ICU early enough to increase their chances of survival to discharge.
During the intervention year in one of their two study units more patients were
transferred to ICU (5.1% vs 4.1%), but fewer patients died (2.6% vs 3.7%) compared
to the pre-intervention year. In their second study unit no significant differences were
found in length of stay, ICU admissions or mortality after implementing automated
alerts to the CNM’s pager. The patients in the study unit where differences were
observed were much older and had many more co-morbidities compared to the
patients on the unit that did not demonstrate these findings. Consequently, they were
more prone to physiologic deterioration as evidenced by the higher number of
deterioration alerts generated (17% vs 9%). Based on these results it appears that the
benefits associated with an EWS may be higher for older patients with multiple co-
morbidities (Evans et al., 2014).
Starting in 2009 in the study by Kollef et al. (2017) real time clinical deterioration
alerts were sent to the mobile phone of a RRT nurse. Statistically significant year-to-
year decreases in mortality, cardio-pulmonary arrests and median lengths of stay were
observed for the study years 2003 to 2014. In the study by Mwulu et al. (2012) for
patients with the highest early warning scores email alerts were sent via a mobile
device to the critical care outreach team. On average only two early warning scores
produced a red alert (indicating severe deterioration) per day resulting in an email
been sent to the outreach team (Mwulu et al., 2012). Unfortunately, this study did not
evaluate the impact of an electronic EWS and automated alerts on patient outcomes, so
it did not add much to the other studies reviewed.
A number of the included studies did not send automated real-time deterioration alerts,
but displayed onscreen prompts with actions required to be taken by the nurse

58
according to the hospital’s escalation protocol (Bellamo et al., 2012; Hands et al.,
2013; Lang et al., 2016; Mackintosh et al., 2011; Mwulu et al., 2012; Schmidt et al.,
2015; Wong et al., 2015). Bellamo et al. (2012) reported that the electronic EWS in
their study resulted in increased calls for abnormal respiratory parameters and an
earlier response to patient deterioration resulting in less need for mechanical
ventilation, reduced arterial line insertion and vasopressor use. Rather, general medical
interventions to address deterioration more than tripled, with more deteriorating
patients transferred to high acuity areas with increased monitoring. This finding was
only significant in the US hospitals involved in the study. Deteriorating patients for
whom RRT activations were made also had improved in-hospital and 90 day survival
rates (86%-92%). It was calculated that approximately 12 lives were saved by
implementing the advisory monitors. Cardiac arrest rates also decreased from 34
during the control period to 24 during the intervention periods. The use of the advisory
monitors was also associated with an overall decreased length of hospital stay (3.4-3.0
days). Once again this finding only reached significance in US hospitals.
Schmidt et al. (2015) also reported that year on year statistics at both their study
hospitals showed abrupt and sustained reductions in mortality after the electronic EWS
with onscreen advisory warnings was implemented. Crude mortality fell from 7.75%
to 6.42%, equating to 397 fewer deaths in one hospital and from 7.57% to 6.15%,
equating to 372 fewer deaths at the second hospital (Schmidt et al., 2015). Mwulu et
al. (2012) reported that a daily average of 74 early warning scores, from 419 fully
completed observation sets, produced onscreen alerts to clinical staff. Unfortunately,
this study did not identify how many of these onscreen alerts resulted in an escalation
of care or what the subsequent clinical outcomes of patients were.
The use of an electronic dashboard which enabled the entire care team, including the
RRT, to rapidly identify patients with abnormal vital signs who could trigger a RRT
did not significantly reduce cardiopulmonary arrests, unexpected ICU admissions or
mortality. However, due to the infrequent nature of these events the study was not
powered sufficiently to determine these outcomes. Length or cost of hospital stay may
have been a better outcome measure (Fletcher et al., 2018). In a study where only a
dedicated crisis nurse was made aware of the aggregate early warning score and
response protocol, the difference in cardiac arrest rates between the intervention and

59
control wards did not reach clinical significance. This study missed the opportunity to
determine how proactive rounding by a dedicated crisis nurse affects the length of stay
after the RRT is activated (Heal et al., 2018).
3.8.3 Summary of theme four
This final theme showed that automated alerts, onscreen prompts and visible electronic
dashboards generally improved medical attendance to the deteriorating patient,
although onscreen prompts were associated with alert fatigue and a reduction in
meaningful dialogue between staff. The included studies were not able to
unequivocally demonstrate improved patient outcomes.
3.9 Chapter summary
Compared to paper-based EWSs, electronic EWSs reduced documentation errors and
accurately calculated the aggregate early warning score. Systems which automatically
transferred vital signs to the EHR or allowed manual entry of vital signs at the point of
care were associated with greater accuracy and faster documentation of vital signs.
The timeliness of repeating vital signs for deteriorating patients did not generally
improve with electronic EWSs. User acceptability of electronic EWSs was high
provided nurses were adequately trained and had ongoing support if problems were
encountered. Concerns were expressed that the prescriptive nature of some electronic
EWSs may dissuade the use of clinical assessment, experiential knowledge and
intuition. Both doctors and nurses reported that electronic EWSs allowed them to
spend more time with patients. The ability to identify patient deterioration was
facilitated in electronic EWSs when the available technology and clinical environment
supported point of care documentation and subsequent accessibility and visibility of
vital signs. The use of automated real-time clinical deterioration alerts and widely
visible electronic dashboards reduced the total reliance on bedside nurses to escalate
care and minimised delays in care for deteriorating patients. Whether onscreen
prompts improved compliance to protocol in terms of escalation of care was
inconclusive and may have contributed to alert fatigue. Some of the studies included in
this integrative review demonstrated improved patient outcomes with the use of
electronic EWSs, others did not.

60
Chapter four: Discussion
This final chapter discusses the findings from the literature included in the review. A
critical analysis and interpretation of the findings is presented and related to each
theme. The strengths and limitations of this integrative review are presented and
implications for practice and opportunities for future research are addressed.
4.1 The detection arm of patient deterioration in electronic EWSs
Previous studies of paper-based EWSs proposed that EWSs may have been
ineffective because vital signs were omitted, weightings were incorrectly assigned to
vital sign parameters, early warning scores were incorrectly calculated and care was
not escalated according to protocol (Clifton et al., 2014; Prytherch et al., 2006). In
response to these deficits electronic EWSs have been implemented world-wide to
support the accurate identification of deteriorating patients on general hospital wards
and to aid timely interventions to improve their outcomes (Kollef et al., 2014).
Accuracy of vital signs and aggregate early warning scores, documentation of vital
signs and timeliness of rechecking vital signs forms the basis of the detection arm in
both paper-based and electronic EWSs. Strategies to improve the documentation
process of vital signs in electronic systems included the integration of monitors or
observation machines that automatically and wirelessly transmitted recorded vital
signs to the EHR, significantly reducing the risk of documentation errors (Meccariello
et al., 2010; Smith et al., 2009). The requirement to manually enter some vital signs,
such as respiratory rates and pain scores, meant some transcription and omission errors
persisted in automated systems (Smith et al., 2009). The continuous recording and
graphical display of vital signs, with intermittent measurements such as blood pressure
triggered according to pre-set intervals, was an alternative strategy to improve the
detection of deteriorating patients (Bonnici, Tarassenko, Clifton, & Watkinson, 2013;
Evans et al., 2014). In theory, continuous monitoring should allow for the immediate
detection of abnormal physiology and ensure vital signs are repeated in a timely
manner (Bonnici et al., 2013). In practice, however, ambulant patients frequently fail
to remain connected to conventional bedside monitors, questioning the place of these
systems outside of high dependency areas (Watkinson et al., 2006).

61
Most of the included studies required the manual entry of vital signs into the patient’s
EHR (Hands et al., 2013; Jones et al., 2011; Mackintosch et al., 2011; Meccariello et
al., 2010; Mwulu et al., 2012; Pederson et al., 2018; Pullinger et al., 2017; Schmidt et
al., 2015; Wager et al., 2010; Wong et al., 2017; Yeung et al., 2012). Vital signs
entered directly into the EHR at the point of care, without transcribing from one
medium to another, were associated with greater accuracy and faster documentation of
vital signs (Meccariello et al., 2010; Wager et al., 2010; Yeung et al., 2012).
Integrating a tablet computer with an observation machine, (Bonnici, Gerry, Wong,
Knight, & Watkinson, 2015; Wager et al., 2010) or the use of PDA’s, facilitated the
manual entry of vital signs at the point of care, reducing transcription errors and
documentation delays (Hands et al., 2013; Jones et al., 2011; Lang et al., 2016;
Mackintosh et al., 2011; Pullinger et al., 2017; Schmidt et al., 2015).
Electronic EWSs accurately calculated the early warning score provided all the
required vital signs were entered. Electronic EWSs that required users to enter a full
set of vital signs, or issued warnings if improbably values were entered, were more
likely to have complete sets of vital signs and accurate early warning scores
(Mackintosh et al., 2011; Mwulu et al., 2012; Pederson et al., 2018; Pullinger et al.,
2017; Smith et al., 2015). Occasionally it may be clinically appropriate to allow the
partial entry of vital signs (Mwulu et al., 2012; Pederson et al., 2018). To ensure all
clinically required vital signs are entered the electronic EWS platform, Patientrack,
used in the CDHB allows users to select between doing a full or partial set of vital
signs. If the full set tab is selected the system will “force” users to enter a full set of
vital signs, so that the early warning score can be calculated and displayed. Patientrack
is also designed not to show the preceding set of vital signs when entering a new set.
Only after entering the vital signs is a full observation chart with all the entries
displayed allowing clinicians to identify trends towards deterioration or improvement.
This prevents the occurrence of preceding scores predicting the outcome of subsequent
observations (Clifton et al., 2015).
The need for the clinical environment to support the documentation method used was
evident in the literature. Prior to implementing a clinical information system it is
important to understand the workflow associated with patient care and to involve
clinicians in the early stage of design (Stevenson, Israelsson, Nilsson, Petersson, &

62
Bath, 2016). If the technology is too cumbersome, or interferes with the delivery of
care, workarounds need to be developed. Ideally recorded vital signs should be
documented at the point of care, as delays in entering vital signs into the patient’s
EHR increased the risks of errors and delayed the access to potentially critical patient
information (Wager et al., 2010; Wong et al., 2017; Yeung et al., 2012). Transcription
still occurred in electronic systems when vital signs were documented to remote
computers, rather than at the point of care (Yeung et al., 2012).The transcription of
vital signs from paper to the EHR was a driver of errors, omissions and data delays in
the EHR. Documentation delays also occurred if clinicians did not ensure electronic
equipment was charged and ready for use, or if problems were not immediately
reported for repair (Wager et al., 2010). Automated documentation systems, which
automatically transferred vital signs to the patient’s EHR, eliminated potential delays
associated with manual documentation. As a consequence the accuracy of documented
vital signs improved and clinician access to vital signs was not delayed (Bellamo et al.,
2012; Meccariello et al., 2010; Smith et al., 2009).
The early detection of patient deterioration is facilitated by close monitoring of easily
measured physiological variables like blood pressure, pulse, respiratory rate,
temperature, oxygen saturations and level of consciousness (Smith et al., 2008). When
an early warning score deviates from normal, EWSs require ward staff to increase the
frequency of observations according to the degree of deviation from normal and a
predefined protocol (McGaughey et al., 2017b; Odell et al., 2014). Despite electronic
systems displaying prompts regarding the frequency of required vital signs,
compliance with rechecking vital signs according to a pre-determined protocol did not
generally improve in electronic EWSs (Jones et al., 2011; Mackintosh et al., 2011).
The timeliness of rechecking vital signs was better for patients with a high early
warning score (Pullinger et al., 2017), but remained poor overnight for all patients
(Hands et al., 2013). Factors influencing the lack of compliance with regards the
timeliness of subsequent vital signs were not addressed in the included studies, but it is
probable that the reasons for non-compliance in paper-based and electronic systems
are similar. Explanations offered for non-compliance in paper-based systems include
nursing staff becoming desensitised to frequently occurring triggers (Smith & Aitken,
2015), competing clinical priorities, inadequate staffing, lack of available equipment
(Hands et al., 2013; McGaughey et al., 2017b) and lack of knowledge regarding the

63
monitoring and interpretation of vital signs (Odell et al., 2009). The clinical impact of
improving the components of the detection arm in electronic EWSs is yet to be
determined.
4.2 Human factors associated with the use of electronic EWSs
An electronic EWS may fail to realise its potential in the clinical setting if the needs,
training requirements, expectations and perceptions of key stakeholders are not
considered (Andargoli et al., 2017). Studies showed that user acceptance of electronic
EWSs largely depended on the quality of their implementation and the organisational
and cultural factors supporting their use (Bonnici et al., 2013; Lang et al., 2016; Wong
et al., 2015). Nurses were initially anxious about using an electronic chart (Mwulu et
al., 2012; Lang et al., 2016), but after a period of adjustment and engagement system
usability scores were high (Mwulu et al., 2016, Wong et al., 2015). Pre-
implementation training (Wong et al., 2015) and ongoing IT support contributed to
acceptance of electronic EWSs (Lang et al., 2016).
Ideally, electronic EWSs ought to support and improve clinical decision making. This
improvement included facilitating standardisation of care, thereby reducing disparities
in care (Black et al., 2011). There is a risk that prescriptive algorithms associated with
electronic EWSs may discourage critical thinking and decision making, integral
components of effective nursing assessments (Ansell, Meyer, & Thompson, 2015).
Senior nurses expressed concern that electronic EWSs may discourage the detection of
patient deterioration through clinical assessment, clinical expertise and intuition (Lang
et al., 2011; Mackintosh et al., 2011). Intuitive-experiential knowledge was
occasionally used by senior nursing staff to detect early patient deterioration
(Mackintosh et al., 2011), yet many of the widely used EWSs did not assign a weight
to clinician concern. Escalating care for a patient with a physiologically “normal”
early warning score can be challenging; therefore, there may be merit in considering
the incorporation of a weighted parameter associated with clinician concern (Clifton et
al., 2018). Nurses need to be empowered to escalate care when there is a discrepancy
between the early warning score and staff concern based on clinical expertise and
judgement (Lang et al., 2016). In the paper-based systems the recording of routine
vital signs was frequently allocated to HCA’s and student nurses (McGaughey et al.,

64
2017b; Wheatley, 2006) and they may not have the intuitive-experiential knowledge to
recognise subtle signs of patient deterioration (Odell et al., 2009, McGaughey et al.,
2017b). In some of the electronic EWSs vital signs were also recorded by HCA’s, but
the studies did not specify if documentation errors were more likely to be made by
HCA’s, or if signs of deterioration were missed with this practice (Meccariello et al.,
2010; Smith et al., 2009).
In the electronic systems junior doctors expressed frustration about not having the
access or permission to modify patient parameters when appropriate. A previous study
of a paper-based system, however, identified that in practice doctors were frequently
reluctant to, or omitted to complete the modification section (Elliot et al., 2015)
resulting in the generation of inappropriate alerts (Fox & Elliot, 2015). In the CDHB
Patientrack also restricts the modification of vital sign parameters to senior medical
staff and depending on their workload and availability, appropriate modifications may
be delayed. Lack of senior medical staff engagement with the electronic EWSs created
frustration amongst doctors and nurses, but both groups appreciated that electronic
EWSs allowed more time to spend with patients (Lang et al., 2011).
4.3 Technology and its contribution to patient safety
There were strengths and limitations associated with the hardware and technology
used in the included studies. Documentation delays occurred when computers on
wheels were too large to manoeuvre into rooms (Wager et al., 2010), when remote
computers were unavailable (Yeung et al., 2012) or when there were insufficient
devices for clinical staff (Lang et al., 2016). No significant issues were encountered
with the use of handheld PDA’s or systems which automatically transferred vital signs
to the EHR (Bellamo et al., 2012; Evans et al., 2014; Hands et al., 2013; Jones et al.,
2011; Lang et al., 2016; Mackintosh et al., 2011; Meccariello et al., 2010; Pullinger et
al., 2017; Schmidt et al., 2015; Smith et al., 2009). Technology that required clinicians
to scan their identification badge barcode and the bar-code on the patient’s wristband
ensured vital signs were assigned to the correct patient (Meccariello et al., 2010; Smith
et al., 2009; Wong et al., 2015; Wong et al., 2017) and produced a record of who
entered the vital signs (Mackintosh et al., 2011).

65
Vital signs and early warning scores need to be readily accessible and easily visible to
facilitate recognition of patient deterioration. The automatic and wireless transfer of
documented vital sign data to the patient’s EHR allowed this data to be accessed
remotely. Provided electronic devices were readily available for clinicians to access
vital sign data (Mackintosh et al., 2011), this accessibility facilitated communication
with colleagues, patients and relatives (Lang et al., 2016) and allowed doctors to
monitor deteriorating patients without being physically present on the ward (Lang et
al., 2016; Mackintosh et al., 2011). When vital signs were readily visible and easily
accessible the ability to identify trends and quickly evaluate the patient’s condition
was supported (Evans et al., 2014; Fletcher et al., 2018). Real time electronic
dashboards and patient overview screens allowed rapid assessment of patients’ status
and assisted with allocation of workloads (Fletcher et al., 2018; Mackintosh et al.,
2011; Wong et al., 2015). Central dashboards displaying the most recent early warning
scores enabled clinicians to rapidly assess the status of patients and encouraged the
ward care team and RRT to take a proactive approach to prioritising patient care. The
ability to monitor the electronic dashboard remotely could also be used by a person or
team dedicated to identify patients who are deteriorating, reducing the total reliance on
the bedside nurse to escalate care (Bonnici et al., 2013; Fletcher et al., 2018).
4.4 The response arm in electronic EWSs and patient outcomes
Previous reviews have failed to establish the ability of EWSs to improve outcomes for
patients whose clinical condition deteriorates as an inpatient (Alam et al., 2007; Gao et
al., 2007; McGaughey et al., 2007; Nice, 2007). Anecdotal evidence, however,
suggested that EWSs enhanced the ability of clinical staff to identify and respond to
patient deterioration in a timely manner (La Lagadec & Dwyer, 2017). Bonnici et al.
(2016) suggested that how nurses and doctors responded to patient deterioration, the
presence of resourced escalation pathways and organisational facilities to care for
deteriorating patients may contribute to improved outcomes. Electronic EWSs with
automated, real-time clinical deterioration alerts to a doctor, CNM or RRT nurse
minimised delays often associated with a non-automated system and improved
medical attendance to the deteriorating patient (Evans et al., 2014; Jones et al., 2011;
Kollef et al., 2017). If an abnormal score was not responded to within a specified
timeframe a system may be programmed to generate sequential alerts to various

66
clinical team members until the alert is acknowledged (Jones et al., 2011). Automated
alerts may mitigate the risk of the bedside nurse not calling for help due to
sociocultural factors, such as fear that activating the RRT would elicit a negative or
hostile reaction from colleagues (Shearer et al., 2012). None of the included studies
reported on the timeframe to medical review after an alert or call for help was
generated. This was a missed opportunity as previous studies demonstrated that
doctors did not always review patients within the recommended time guidelines (Fox
& Elliot, 2015).
The electronic system used by the CDHB currently does not generate any alerts and
relies on the bedside nurse to know the escalation pathway that applies to the degree of
deviation from normal and respond appropriately. In one study onscreen prompts with
actions required to be taken by the nurse according to a hospital’s escalation protocol
found that a similar number of RRT calls were made during the intervention and
control periods, but calls for help were made earlier and calls made for abnormal
respiratory parameters increased (Bellamo et al., 2012). Another study reported that
compliance to protocol, in terms of escalating care, greatly increased with onscreen
prompts (Mackintosh et al., 2012). Disadvantages associated with onscreen prompts
were alert fatigue (Lang et al., 2016) and a reduction in potentially beneficial dialogue
between staff regarding patient deterioration (Mackintosh et al., 2012). The EWS in
use needed to be sufficiently sensitive and specific to accurately detect patients who
were deteriorating, but not too sensitive that staff experienced alert fatigue (Bonnici et
al., 2013). The use of an electronic dashboard visible to the entire care team
encouraged a proactive approach to the timely identification of patient deterioration
and reduced the total reliance on the bedside nurse for RRT activation (Fletcher et al.,
2018).
In terms of patient outcomes associated with the use of electronic EWSs the results
were variable. Only eight of the included studies investigated whether electronic
EWSs improve patient outcomes. In addition, these eight studies did not all use the
same outcome measures or endpoints, further limiting the ability to draw conclusions.
Outcome measures examined such as length of stay, unplanned ICU admissions and
mortality were also influenced by a number of external factors that could lead to
erroneous inferences about the effectiveness of electronic EWSs. An increased

67
admission rate to ICU may be due to an increased incidence of deteriorating patients
or lower thresholds for ICU admission. Factors such as insufficient ICU beds may
inhibit admission resulting in lower ICU admission rates (Bonnici et al., 2016).
The studies included in this review demonstrated that the implementation of real-time
clinical deterioration alerts resulted in a reduction in length of stay and ICU
admissions in one study (Jones et al., 2011) and an increased length of stay and ICU
admissions in another, but fewer patient deaths (Evans et al., 2014). The conflicting
results between these two studies using automated alert systems may have been
influenced by significant design limitations associated with the study undertaken by
Jones et al. (2011). Firstly, external factors may have had an influence on length of
stay, particularly the influence of seasonal illness, as the study phases were conducted
in different seasons with the automated alert phase occurring during summer.
Secondly, the median age in the baseline phase was 70, compared to 65 in the alert
phase and the difference in patient acuity was not determined. The inability to
guarantee a homogenous patient group was a significant limitation, especially when
length of stay was the focus. Thirdly, when the hospital introduced the electronic
system they conducted additional deteriorating patient education with the nurses in the
implementation wards, which may have resulted in improved clinical outcomes during
the alert phase (Jones et al., 2011). Finally, there may have been a commercial conflict
as one of the researchers was a founding director and shareholder of the Patientrack
system used in this study.
A retrospective study by Kollef et al. (2014) over a number of years (2003 to 2014)
reported that real-time clinical deterioration alerts sent to the mobile phone of a RRT
nurse resulted in statistically significant year-to-year decreases in mortality, cardio-
pulmonary arrest and median lengths of stay. Given the retrospective nature of this
study over a number of years the reductions in mortality, cardio-pulmonary arrests and
hospital stay could not be definitively attributed to the introduction of the electronic
EWS and real-time clinical deterioration alerts. In addition, the study results may have
been influenced by the implementation of a dedicated RRT nurse position during the
study allowing dedicated time to assess and pre-emptively identify deteriorating
patients (Kollef et al., 2014).
68
The use of onscreen advisory warnings in the study by Bellamo et al. (2012) resulted
in improved survival rates, reduced cardiac arrest rates and decreased length of stay
for patients for whom RRT activations were made. The before-and-after study design
meant that the three month intervention period occurred during a different season to
the three month control period and this could potentially have affected patient cohort
characteristics and outcomes. Another limitation of this study was that during the
intervention period more RRT calls were made for less acutely unwell patients,
possibly over-triaging, which may have been responsible for improved patient
outcomes during the intervention period (Bellamo et al., 2012).
Another study also found that crude mortality fell after the implementation of the
electronic EWS with onscreen advisory warnings (Schmidt et al., 2015). These
findings were credible as these consistent results followed the electronic EWS
implementation at different hospitals, across different specialities, at different times,
suggesting the findings were generalisable and reproducible based on a plausible cause
and effect relationship. Prior studies were smaller implementation studies limited to
specific patient groups or focusing on process measures (Schmidt et al., 2015). The
use of a visible electronic dashboard allowing activation of the RRT by the entire care
team had no effect on cardiopulmonary arrests, unexpected ICU admissions or
mortality (Fletcher et al., 2018).
The introduction of any EWS without ensuring there was an adequate clinical response
specified by a predetermined, realistic and resourced escalation pathway was
associated with the risk of alerts being ignored (Bonnici et al., 2013). As previously
mentioned the NZEWS is based on the NEWS used by the NHS in the UK (HQSC,
2016a). The NZEWS is yet to be fully validated in the NZ setting with local
population groups. Until the impact of implementing a standardized national EWS on
staff and patients in NZ is determined, it is unlikely that electronic systems will be
programmed to issue automated alerts.
Electronic EWSs offer theoretical benefits compared to paper-based EWSs, but
existing literature has shown inconsistent results. Currently there is no conclusive
evidence that EWSs (electronic or paper-based) improve patient outcomes (Alam et
al., 2014; Gao et al., 2007; McGaughey et al., 2007; Nice, 2007). With the growing

69
use of electronic EWSs the potential to improve patient care, and potentially patient
outcomes, may be in the ability to process and analyse large volumes of readily
accessible electronic vital sign data. This data can be used to drive improvements by
addressing identified flaws like delays in calling for help. In the future computerised
algorithms using additional components of the EHR such as demographic data,
laboratory results and medication usage may be used to enhance existing early
warning scores (Bonnici et al., 2013).
4.5 Strengths and limitations
This integrative review has several important strengths and limitations that need
consideration when interpreting the results of this review.
4.5.1 Strengths
To ensure the reproducibility of the review and rigour of the process a systematic
approach was applied to this integrative review. A clear and unambiguous research
question was formulated and inclusion and exclusion criteria were developed to guide
a search for appropriate literature. The assistance of the University’s Librarian was
sought to conduct a comprehensive and exhaustive search strategy of relevant
databases. To avoid publication bias, published and unpublished literature was sought.
Selected studies and their research methodologies were critically appraised using JBI’s
2014 critical appraisal tools and only studies meeting the 70% appraisal threshold and
inclusion criteria were included in the review. Data from selected studies was analysed
and synthesised into themes and subthemes using Braun and Clarke’s (2006) six
phases of thematic analysis and presented in a narrative format.
Most of the studies included in this review originated from the US and the UK.
Although the findings cannot be directly extrapolated to the NZ context these
countries do share similarities in terms of their EWSs components and availability of
resources to respond to deteriorating patients. Although the results of individual
studies may not be generalisable to other locations, this review allows organisations
wanting to implement an electronic EWS to consider the strengths and limitations

70
associated with the different systems before investing valuable resources in designing
or purchasing a system.
The electronic data in the included studies allowed the researchers to manipulate,
analyse and synthesise large sets of data, which would not be possible with paper-
based systems. This ability contributed to the credibility and reliability of reported
results in the studies included in this review.
4.5.2 Limitations
The heterogeneity of the studies included in the review made drawing conclusions
challenging. While many of the studies focused on one or more of the research
objectives, no study answered all the research objectives. The fact that the search was
limited to English-language databases meant that some relevant literature may have
been missed.
Twelve of the included studies used a quasi-experimental study design. This before-
and-after study design cannot eliminate potential confounders such as seasonal
influences or changes implemented in the clinical environment during the course of
the study. The various studies used different ward settings and patient groups, so it is
unknown if the results would be generalisable to, or reproducible in other locations
with other patient groups, or in different clinical settings. Electronic EWSs are still in
their infancy stage in NZ and the absence of NZ research impacts on the
generalisability of this review to the NZ setting.
4.6 Implications for practice
A number of implications for practice were identified from the findings of this
integrative review. Firstly, it is essential that the NZEWS is fully validated in the NZ
setting with local population groups to determine if it is sufficiently sensitive and
specific to accurately detect deteriorating in-patients. Until this is done it may be
challenging to evaluate the true impact of electronic EWSs in NZ. For example, in the
CDHB where the NZEWS was implemented a year ago there has been an increased

71
incidence of single parameter triggers. This has led to an increase in referrals for
deteriorating patients which risks overloading clinical services.
It is important for organisations considering the implementation of an electronic EWS
to evaluate not only the technology itself, but the usability of the system for clinicians
and how well the system would integrate into the organisation (Andargoli et al., 2017).
Organisations need to ensure that the clinical environment supports the documentation
of vital signs at the point of care, that users are adequately trained and that there are
enough devices for clinicians to use without delay. The electronic EWS needs to
integrate seamlessly with the rest of the EHR, so that vital signs and early warning
scores are remotely and widely accessible. Finally, organisations need to ensure that
electronic EWSs are effectively and regularly evaluated using a multidisciplinary
approach, with results clearly communicated to staff and used to inform continuous
quality improvement of the system (Black et al., 2011).
4.7 Opportunities for future research
There were only three qualitative studies investigating the training requirements,
expectations and perceptions of key stakeholders using electronic EWSs; therefore,
there is an opportunity for further research in this area. Qualitative studies help to
understand the socio-cultural factors that affect compliance with protocols (Shearer et
al., 2012). Qualitative studies may help to determine why the timeliness of subsequent
vital signs measurements did not improve with electronic systems, or why bedside
nurses failed to escalate care despite the electronic system prompting them to do so.
The inability of the available literature to conclusively demonstrate the effect of
electronically captured clinical observations with/without automated alerts on clinical
outcomes of deteriorating adult in-patients highlights the need for further research in
this area. Ideally RCTs are needed to establish the impact of electronic EWSs, but as
EWSs are already widely implemented the ability to do so is potentially limited. Given
the complexities associated with conducting RCTs and eliminating extraneous
variables that could affect patient outcomes, perhaps the focus of future research needs
to change. Instead of attempting to demonstrate improved patient outcomes with
EWSs, studies should focus on determining the optimal use of technology and EWSs

72
to identify and respond appropriately to deteriorating patients, as these factors may
positively influence patient outcomes. As technology in healthcare continues to
develop there may be opportunities to implement systems which use both real-time
EWS data and additional data from the EHR to predict clinical deterioration and
potentially intervene to improve patient outcomes.
4.8 Conclusion
Electronic EWSs have the potential to facilitate the recognition, activation and
response to acutely deteriorating hospital in-patients. The review clearly identified
improvements in the detection arm of EWSs with the use of electronic EWSs.
Electronically captured clinical observations improved the reliability and accessibility
of patients’ vital signs and the accuracy of aggregate early warning scores. Numerous
technological developments and hardware options were identified to ensure point of
care documentation and the automated, wireless transfer of vital signs to the EHR.
Compliance to protocol in terms of frequency of vital sign measurement and escalation
of care (if not using automated alerts) remained variable.
The limited available qualitative data showed that after a period of adjustment and
engagement system usability scores were high, although challenges and frustrations
identified in paper-based systems, such as lack of senior medical staff engagement and
feared loss of intuitive experiential knowledge remained. The improved accessibility
and visibility of vital signs supported a proactive and remote response to patient
deterioration.
Improvements in the detection arm of EWSs were important, but not sufficient to
affect patient outcomes. The potential to improve patient outcomes sits with the
response arm of EWSs: the improved escalation, response and management of
deteriorating patients that may translate to improved patient outcomes. Numerous
methods of escalating care such as the use of automated alerts, onscreen prompts and
visible electronic dashboards reduced the total reliance on the bedside nurse to escalate
care. Any escalation, however, irrespective of the source requires an adequately
resourced individual or team who can provide a timely and appropriate response to
deteriorating patients according to a pre-determined, realistic escalation pathway. With

73
the continued development and implementation of electronic EWSs worldwide, it will
be interesting to see if they will be able to conclusively demonstrate improved patient
outcomes associated with their use.

74
Bibliography
Alam, N., Hobbelink, E. L., Van Tienhoven, A. J., Van de Ven, P. M., Jansma,
E. P., & Nanayakkara, P. W. B. (2014). The impact of the use of the Early
Warning Score (EWS) on patient outcomes: a systematic
review. Resuscitation, 85(5), 587-594. doi:
org/10.1016/j.resuscitation.2014.01.013
Andargoli, A. E., Scheepers, H., Rajendran, D., & Sohal, A. (2017). Health
information systems evaluation frameworks: A systematic
review. International Journal of Medical Informatics, 97, 195-209.
doi.org/10.1016/j.ijmedinf.2016.10.008
Andrews, T., & Waterman, H. (2005). Packaging: a grounded theory of how to
report physiological deterioration effectively. Journal of Advanced
Nursing, 52(5), 473-481. doi.org/10.1111/j.1365-2648.2005.03615.x
Ansell, H., Meyer, A., & Thompson, S. (2015). Technology and the issues
facing nursing assessment. British Journal of Nursing, 24(17), 886-889.
doi.org/10.12968/bjon.2015.24.17.886
Austen, C., Patterson, C., Poots, A., Green, S., Weldring, T., & Bell, D. (2012).
Using a local early warning scoring system as a model for the introduction
of a national system. Acute Medicine, 11(2), 66-73.
Australian Commission on Safety and Quality in Healthcare. (2012). National
safety and quality health service standards. Sydney, Australia: ACSQHC.
Retrieved from https://www.safetyandquality.gov.au/wp-
content/uploads/2011/09/NSQHS-Standards-Sept-2012.pdf
Aveyard, H. (2014). Doing a literature review in health and social care: A
practical guide. (2nd ed.). Berkshire, England: McGraw-Hill Education.
75
Azzopardi, P., Kinney, S., Moulden, A., & Tibballs, J. (2011). Attitudes and
barriers to a Medical Emergency Team system at a tertiary paediatric
hospital. Resuscitation, 82(2), 167-174.
doi.org/10.1016/j.resuscitation.2010.10.013
Bellomo, R., Ackerman, M., Bailey, M., Beale, R., Clancy, G., Danesh, V., ... &
Pattee, K. S. (2012). A controlled trial of electronic automated advisory
vital signs monitoring in general hospital wards. Critical Care
Medicine, 40(8), 2349-2361. doi:10.1097/CCM.0b013e318255d9a0
Berwick, D. M., Calkins, D. R., McCannon, C. J., & Hackbarth, A. D. (2006). The
100 000 lives campaign: setting a goal and a deadline for improving health
care quality. Jama, 295(3), 324-327. doi:10.1001/jama.295.3.324
Black, A. D., Car, J., Pagliari, C., Anandan, C., Cresswell, K., Bokun, T., ... &
Sheikh, A. (2011). The impact of eHealth on the quality and safety of health
care: a systematic overview. PLoS Medicine, 8(1), e1000387.
doi.org/10.1371/journal.pmed.1000387
Body, J., Neumann, T., Jennings, S., Morrow, V., Alderson, P., Rees, R., &
Gibson, W. (2010). The research ethics handbook: a resource for social
scientists. Retrieved from http://www.ethicsguidebook.ac.uk/Literature-
reviews-and-systematic-reviews-99
Bonnici, T., Tarassenko, L., Clifton, D.A., & Watkinson, P. (2013). The digital
patient. Clinical Medicine, 13(3), 252-257. Retrieved from
http://www.clinmed.rcpjournal.org/content/13/3/252.full
Bonnici, T., Gerry, S., Wong, D., Knight, J., & Watkinson, P. (2015). Evaluation of
the effects of implementing an electronic early warning score system:
protocol for a stepped wedge study. BMC Medical Informatics and Decision
Making, 16(19), 1-8. doi.org/10.1186/s12911-016-0257-8

76
Braun, V., & Clarke, V. (2006). Using thematic analysis in psychology. Qualitative
Research in Psychology, 3(2), 77-101. doi: 10.1191/1478088706qp063oa
Cioffi, J. (2000). Recognition of patients who require emergency assistance: a
descriptive study. Heart & Lung: The Journal of Acute and Critical
Care, 29(4), 262-268. doi: 10.1067/mhl.2000.108327
Clifton, D. A., Clifton, L., Sandu, D. M., Smith, G. B., Tarassenko, L., Vollam, S.
A., & Watkinson, P. J. (2015). ‘Errors’ and omissions in paper-based early
warning scores: the association with changes in vital signs—a database
analysis. BMJ Open, 5(7), e007376. doi:10.1136/bmjopen-2014-007376
Cook, D. J., Mulrow, C. D., & Haynes, R. B. (1997). Systematic reviews: synthesis
of best evidence for clinical decisions. Annals of Internal Medicine, 126(5),
376-380. doi: 10.7326/0003-4819-126-5-199703010-00006
DeVita, M. A., Bellomo, R., Hillman, K., Kellum, J., Rotondi, A., Teres, D., ... &
Bell, M. (2006). Findings of the first consensus conference on medical
emergency teams. Critical Care Medicine, 34(9), 2463-2478. doi:
10.1097/01.CCM.0000235743.38172.6E
De Souza, M. T. D., Da Silva, M. D. D., & De Carvalho, R. D. (2010). Integrative
review: what is it? How to do it? Einstein (São Paulo), 8(1), 102-106.
doi.org/10.1590/s1679-45082010rw1134
Ebling Library. (2017). Grey literature. Madison, Wisconsin: University of
Wisconsin. Retrieved from
http://researchguides.ebling.library.wisc.edu/tutorials/greylit
Elliott, D., Allen, E., Perry, L., Fry, M., Duffield, C., Gallagher, R., ... & Roche, M.
(2015). Clinical user experiences of observation and response charts: focus
group findings of using a new format chart incorporating a track and trigger
system. BMJ Quality and Safety, 24(1), 65-75. doi: 10.1136/bmjqs-2013-
002777

77
Evans, R. S., Kuttler, K. G., Simpson, K. J., Howe, S., Crossno, P. F., Johnson, K.
V., ... & Tanner, A. (2014). Automated detection of physiologic deterioration
in hospitalized patients. Journal of the American Medical Informatics
Association, 22(2), 350-360. doi.org/10.1136/amiajnl-2014-002816
Fletcher, G. S., Aaronson, B. A., White, A. A., & Julka, R. (2018). Effect of a real-
time electronic dashboard on a rapid response system. Journal of Medical
Systems, 42(1), 1-10. doi.org/10.1007/s10916-017-0858-5
Fox, A., & Elliott, N. (2015). Early warning scores: a sign of deterioration in
patients and systems. Nursing Management, 22(1), 26-31.
doi.org/10.7748/nm.22.1.26.e1337
Frost, S. A., Chapman, A., Aneman, A., Chen, J., Parr, M. J., & Hillman, K. (2015).
Hospital outcomes associated with the introduction of a two-tiered response to
the deteriorating patient. Critical Care and Resuscitation, 17(2), 77-82.
Gao, H., McDonnell, A., Harrison, D. A., Moore, T., Adam, S., Daly, K., ... &
Subbe, C. P. (2007). Systematic review and evaluation of physiological track
and trigger warning systems for identifying at-risk patients on the
ward. Intensive Care Medicine, 33(4), 667-679. doi:10.1007/s00134-007-
0532-3
Guay, C., Murphree, P., & Steele-Moses, S. (2011). Developing an automated RRT
trigger. Nursing Management, 42(2), 50-52.
doi:10.1097/01.NUMA.0000393009.26504.fd
Hands, C., Reid, E., Meredith, P., Smith, G. B., Prytherch, D. R., Schmidt, P. E., &
Featherstone, P. I. (2013). Patterns in the recording of vital signs and early

78
warning scores: compliance with a clinical escalation protocol. BMJ Quality
and Safety, 22, 719-726. doi.org/10.1136/bmjqs-2013-001954
Heal, M., Silvest-Guerrero, S., & Kohtz, C. (2017). Design and development of a
proactive rapid response system. CIN: Computers, Informatics, Nursing, 35(2),
77-83. doi: 10.1097/CIN.0000000000000292
Health Quality & Safety Commission. (2016a). The deteriorating adult patient.
Current practice and emerging themes. Wellington, New Zealand: HQSC.
Retrieved from https://www.hqsc.govt.nz/assets/Deteriorating-
Patient/PR/Discussion-document-Jun-2016.pdf
Health Quality & Safety Commission. (2016b). Deteriorating adult patient evidence
summary. What we need to know. Wellington, New Zealand: HQSC. Retrieved
from https://www.hqsc.govt.nz/assets/Deteriorating-Patient/PR/Evidence-
summary-FINAL-Jun-2016.pdf
Health Quality & Safety Commission. (2017a). New Zealand early warning score
vital sign chart user guide 2017. Wellington, New Zealand: HQSC. Retrieved
from https://www.hqsc.govt.nz/assets/Deteriorating-
Patient/PR/Vital_sign_chart_user_guide_July_2017_.pdf
Health Quality & Safety Commission. (2017b). Recognition and response systems.
Wellington, New Zealand: HQSC. Retrieved from
https://www.hqsc.govt.nz/our-programmes/patient-deterioration/recognition-
and-response-systems/
Hillman, K., Chen, J., Cretikos, M., Bellomo, R., Brown, D., Doig, G., ... & MERIT
Study Investigators. (2005). Introduction of the medical emergency team
(MET) system: a cluster-randomised controlled trial. Lancet, 365(9477), 2091-
2097. doi: 101186/cc4865

79
Joanna Briggs Institute (2014). Joanna Briggs Institute Reviewers’ manual: 2014
edition. Adelaide, South Australia: Joanna Briggs Institute. Retrieved from
http://joannabriggs.org/assets/docs/sumari/reviewersmanual-2014.pdf
Jones, S., Mullally, M., Ingleby, S., Buist, M., Bailey, M., & Eddleston, J. M.
(2011). Bedside electronic capture of clinical observations and automated
clinical alerts to improve compliance with an Early Warning Score
protocol. Critical Care and Resuscitation, 13(2), 83-88.
Kollef, M. H., Chen, Y., Heard, K., LaRossa, G. N., Lu, C., Martin, N. R., ... &
Bailey, T. (2014). A randomized trial of real‐time automated clinical
deterioration alerts sent to a rapid response team. Journal of Hospital
Medicine, 9(7), 424-429. doi: 10.1002/jhm.2193
Kollef, M. H., Heard, K., Chen, Y., Lu, C., Martin, N., & Bailey, T. (2017).
Mortality and length of stay trends following implementation of a rapid
response system and real-time automated clinical deterioration
alerts. American Journal of Medical Quality, 32(1), 12-18.
doi.org/10.1177/1062860615613841
Lang, A., Pinchin, J., Brown, M., & Sharples, S. (2016). Report: Handheld
technologies in the ward. Nottingham, United Kingdom: University of
Nottingham. Retrieved from https://studylib.net/doc/18163783/university-of-
nottingham-report--handheld-technologies-in...#
Le Lagadec, M. D., & Dwyer, T. (2017). Scoping review: The use of early warning
systems for the identification of in-hospital patients at risk of
deterioration. Australian Critical Care, 30(4), 211-218. doi:
10.1016/j.aucc.2016.10.003

80
Mapp, I. D., Davis, L. L., & Krowchuk, H. (2013). Prevention of unplanned
intensive care unit admissions and hospital mortality by early warning
systems. Dimensions of Critical Care Nursing, 32(6), 300-309. doi:
10.1097/DCC.0000000000000004
Mackintosh, N., Rainey, H., & Sandall, J. (2011). Understanding how rapid response
systems may improve safety for the acutely ill patient: learning from the
frontline. BMJ Quality & Safety, 21(2), 135-144. doi: 10.1136/bmjqs-2011-
000147.
McBride, J., Knight, D., Piper, J., & Smith, G. B. (2005). Long-term effect of
introducing an early warning score on respiratory rate charting on general
wards. Resuscitation, 65(1), 41-44. doi: 10.1016/j.resuscitation.2004.10.015
McGaughey, J., Alderdice, F., Fowler, R., Kapila, A., Mayhew, A., & Moutray, M.
(2007). Outreach and Early Warning Systems (EWS) for the prevention of
intensive care admission and death of critically ill adult patients on general
hospital wards. The Cochrane Library, (3). doi:
10.1002/14651858.CD005529.pub2.
McGaughey, J., O'Halloran, P., Porter, S., & Blackwood, B. (2017a). Early warning
systems and rapid response to the deteriorating patient in hospital: A
systematic realist review. Journal of Advanced Nursing. 73(12), 2877-2891.
doi.org/10.1111/jan.13398
McGaughey, J., O'Halloran, P., Porter, S., Trinder, J., & Blackwood, B. (2017b).
Early warning systems and rapid response to the deteriorating patient in
hospital: A realist evaluation. Journal of Advanced Nursing, 73, 3119-3132.
doi.org/10.1111/jan.13367

81
Meccariello, M., Perkins, D., Quigley, L. G., Rock, A., & Qiu, J. (2010). Vital time
savings: evaluating the use of an automated vital signs documentation system
on a medical/surgical unit. Journal of Healthcare Information
Management, 24(4), 46-51.
Moher, D., Liberati, A., Tetzlaff, J., Altman, D. G., & Prisma Group. (2009).
Preferred reporting items for systematic reviews and meta-analyses: the
PRISMA statement. PLoS Medicine, 6(7), e1000097. doi:
10.1371/journal.pmed.1000097
Moore, D., & Poynton, M. (2015). Business Case for investing in a quality
improvement programme to reduce harm caused by clinical deterioration.
Wellington, New Zealand: Sapere Research Group. Retrieved from
https://www.hqsc.govt.nz/our-programmes/other-topics/publications-and-
resources/publication/2335/
Morgan, R. J. M., Williams, F., & Wright, M. M. (1997). An early warning scoring
system for detecting developing critical illness. Clinical Intensive Care, 8(2),
100.
Mwulu, U., Westwood, D., Edwards, D., Kelliher, F., & Coleman, J. J. (2012).
Adoption of an electronic observation chart with an integrated early warning
scoring system on pilot wards: a descriptive report. CIN: Computers,
Informatics, Nursing, 30(7), 371-379. doi: 10.1097/NXN.0b013e318251074a
National Institute for Health & Clinical Excellence. (2007). Acutely ill patients in
hospital. Recognition of and response to acute illness in adults in hospital.
London, United Kingdom: NICE. Retrieved from
https://www.nice.org.uk/guidance/cg50

82
Niegsch, M., Fabritius, M. L., & Anhøj, J. (2013). Imperfect implementation of an
early warning scoring system in a Danish teaching hospital: a cross-sectional
study. PloS One, 8(7), e70068. doi.org/10.1371/journal.pone.0070068.s001
Odell, M., Victor, C., & Oliver, D. (2009). Nurses’ role in detecting deterioration in
ward patients: systematic literature review. Journal of Advanced
Nursing, 65(10), 1992-2006. doi: 10.1111/j.1365-2648.2009.05109.x
Pedersen, N. E., Rasmussen, L. S., Petersen, J. A., Gerds, T. A., Østergaard, D., &
Lippert, A. (2018). A critical assessment of early warning score records in
168,000 patients. Journal of Clinical Monitoring and Computing, 32(1), 109-
116. doi: 10.1007/s10877-017-0003-5
Quirke, S. J. M. (2011). Factors affecting the care of acutely unwell ward patients: A
multiple case study.
Prytherch, D. R., Smith, G. B., Schmidt, P., Featherstone, P. I., Stewart, K., Knight,
D., & Higgins, B. (2006). Calculating early warning scores—a classroom
comparison of pen and paper and hand-held computer
methods. Resuscitation, 70(2), 173-178.
doi.org/10.1016/j.resuscitation.2005.12.002
Psirides, A., Hill, J., & Hurford, S. (2013). A review of rapid response team
activation parameters in New Zealand hospitals. Resuscitation, 84(8), 1040-
1044. doi: 10.1016/j.resuscitation.2013.01.022
Pullinger, R., Wilson, S., Way, R., Santos, M., Wong, D., Clifton, D., ... &
Tarassenko, L. (2017). Implementing an electronic observation and early
warning score chart in the emergency department: a feasibility
study. European Journal of Emergency Medicine, 24(6), e11-e16. doi:
10.1097/MEJ.0000000000000371

83
Radeschi, G., Urso, F., Campagna, S., Berchialla, P., Borga, S., Mina, A., ... &
Sandroni, C. (2015). Factors affecting attitudes and barriers to a medical
emergency team among nurses and medical doctors: a multi-centre
survey. Resuscitation, 88, 92-98. doi: 10.1016/j.resuscitation.2014.12.027
Rihari-Thomas, J., DiGiacomo, M., Phillips, J., Newton, P., & Davidson, P. M.
(2017). Clinician perspectives of barriers to effective implementation of a
Rapid Response System in an academic health centre: a focus group
study. International Journal of Health Policy and Management, 6(8), 447-456.
doi: 10.15171/ijhpm.2016.156
Schmidt, P. E., Meredith, P., Prytherch, D. R., Watson, D., Watson, V., Killen, R.
M., ... & Smith, G. B. (2015). Impact of introducing an electronic
physiological surveillance system on hospital mortality. BMJ Quality and
Safety, 24(1), 10-20. doi.org/10.1136/bmjqs-2014-003073
Schneider, Z., & Elliot, D. (2003). (2nd ed.). Nursing research: methods, critical
appraisal and utilisation. Marrickville, Australia: Elsevier.
Schneider, Z., & Whitehead, D. (2013). (4th ed.). Nursing and midwifery research:
methods and appraisal for evidence-based practice. Chatswood, Australia:
Elsevier.
Seddon, M. (2007). Safety of Patients in New Zealand Hospitals: a progress
report. Wellington, New Zealand: Health and Disability Commissioner.
Shearer, B., Marshall, S., Buist, M. D., Finnigan, M., Kitto, S., Hore, T., ... &
Ramsay, W. (2012). What stops hospital clinical staff from following
protocols? An analysis of the incidence and factors behind the failure of
bedside clinical staff to activate the rapid response system in a multi-campus

84
Australian metropolitan healthcare service. BMJ Quality and Safety, 21, 569-
575. doi: 10.1136/bmjqs-2011-000692
Simmes, F. M., Schoonhoven, L., Mintjes, J., Fikkers, B. G., & van der Hoeven, J.
G. (2012). Incidence of cardiac arrests and unexpected deaths in surgical
patients before and after implementation of a rapid response system. Annals
of Intensive Care, 2(20), 2-6. doi: 10.1186/2110-5820-2-20
Smith, L. B., Banner, L., Lozano, D., Olney, C. M., & Friedman, B. (2009).
Connected care: reducing errors through automated vital signs data
upload. CIN: Computers, Informatics, Nursing, 27(5), 318-323. doi:
10.1097/NCN.0b013e3181b21d65
Smith, G. B., Prytherch, D. R., Meredith, P., Schmidt, P. E., & Featherstone, P. I.
(2013). The ability of the National Early Warning Score (NEWS) to
discriminate patients at risk of early cardiac arrest, unanticipated intensive care
unit admission, and death. Resuscitation, 84(4), 465-470.
doi.org/10.1016/j.resuscitation.2012.12.016
Smith, D. J., & Aitken, L. M. (2016). Use of a single parameter track and trigger
chart and the perceived barriers and facilitators to escalation of a deteriorating
ward patient: a mixed methods study. Journal of Clinical Nursing, 25(1-2),
175-185. doi.org/10.1111/jocn.13104
Stevenson, J. E., Israelsson, J., Nilsson, G. C., Petersson, G. I., & Bath, P. A. (2016).
Recording signs of deterioration in acute patients: the documentation of vital
signs within electronic health records in patients who suffered in-hospital
cardiac arrest. Health Informatics Journal, 22(1), 21-33.
doi.org/10.1177/1460458214530136

85
Thomas, D. R., & Hodges, I. D. (2010). Designing and managing your research
project: core skills for social and health research. London, United Kingdom:
Sage Publications.
Torraco, R. J. (2016). Writing integrative literature reviews: Using the past and
present to explore the future. Human Resource Development Review, 15(4),
404-428.
Wager, K. A., Schaffner, M. J., Foulois, B., Kazley, A. S., Parker, C., & Walo, H.
(2010). Comparison of the quality and timeliness of vital signs data using three
different data-entry devices. CIN: Computers, Informatics, Nursing, 28(4),
205-212. doi: 10.1097/NCN.0b013e3181e1df19
Watkinson, P. J., Barber, V. S., Price, J. D., Hann, A., Tarassenko, L., & Young, J.
D. (2006). A randomised controlled trial of the effect of continuous electronic
physiological monitoring on the adverse event rate in high risk medical and
surgical patients. Anaesthesia, 61(11), 1031-1039. doi.org/10.1111/j.1365-
2044.2006.04818.x
Wheatley, I. (2006). The nursing practice of taking level 1 patient
observations. Intensive and Critical Care Nursing, 22(2), 115-121. doi:
10.1016/j.iccn.2005.08.003
Whittemore, R., & Knafl, K. (2005). The integrative review: updated
methodology. Journal of Advanced Nursing, 52(5), 546-553.
doi.org/10.1111/j.1365-2648.2005.03621.x
Wong, D., Bonnici, T., Knight, J., Morgan, L., Coombes, P., & Watkinson, P.
(2015). SEND: a system for electronic notification and documentation of vital
sign observations. BMC Medical Informatics and Decision Making, 15(68), 1-
12. doi.org/10.1186/s12911-015-0186-y

86
Wong, D., Bonnici, T., Knight, J., Gerry, S., Turton, J., & Watkinson, P. (2017). A
ward-based time study of paper and electronic documentation for recording
vital sign observations. Journal of the American Medical Informatics
Association, 24(4), 717-721. doi.org/10.1093/jamia/ocw186
Yeung, M. S., Lapinsky, S. E., Granton, J. T., Doran, D. M., & Cafazzo, J. A.
(2012). Examining nursing vital signs documentation workflow: barriers and
opportunities in general internal medicine units. Journal of Clinical
Nursing, 21(7‐8), 975-982. doi: 10.1111/j.1365-2702.2011.03937.x

87
Appendix A Literature search of the CINAHL database
EBSCOhost Monday, March 15, 2018 7:10:39 AM
# Query Limiters/Expanders Last Run Via Results
S13 s6 AND s11
Limiters - Published Date: 20080101-20180531;
English Language; Peer Reviewed
Search modes - Boolean/Phrase
Interface - EBSCOhost Research Databases
Search Screen - Advanced Search
Database - CINAHL 84
S12 s6 AND s11
Limiters - Published Date: 20080101-20180531;
English Language
Search modes - Boolean/Phrase
Interface - EBSCOhost Research Databases
Search Screen - Advanced Search
Database - CINAHL 130
S11 s7 OR s8 OR s9 OR s10
Limiters - Published Date: 20080101-20180531;
English Language
Search modes - Boolean/Phrase
Interface - EBSCOhost Research Databases
Search Screen - Advanced Search
Database - CINAHL 79,369
S10 TX electronic
Limiters - Published Date: 20080101-20180531;
English Language
Search modes - Boolean/Phrase
Interface - EBSCOhost Research Databases
Search Screen - Advanced Search
Database - CINAHL 68,475
S9 TX real time alert*
Limiters - Published Date: 20080101-20180531;
English Language
Search modes - Boolean/Phrase
Interface - EBSCOhost Research Databases
Search Screen - Advanced Search
Database - CINAHL 17
S8 TX automat*
Limiters - Published Date: 20080101-20180531;
English Language
Search modes - Boolean/Phrase
Interface - EBSCOhost Research Databases
Search Screen - Advanced Search
Database – CINAHL 12,674

88
S7 TX electronic observation*
Limiters - Published Date: 20080101-20180531;
English Language
Search modes - Boolean/Phrase
Interface - EBSCOhost Research Databases
Search Screen - Advanced Search
Database – CINAHL 3
S6 S1 OR S2 OR S3 OR S4 OR S5
Limiters - Published Date: 20080101-20180531;
English Language
Search modes - Boolean/Phrase
Interface - EBSCOhost Research Databases
Search Screen - Advanced Search
Database – CINAHL 1,392
S5 TX e-trigger
Limiters - Published Date: 20080101-20180531;
English Language
Search modes - Boolean/Phrase
Interface - EBSCOhost Research Databases
Search Screen - Advanced Search
Database – CINAHL 1
S4 TX EWS
Limiters - Published Date: 20080101-20180531;
English Language
Search modes - Boolean/Phrase
Interface - EBSCOhost Research Databases
Search Screen - Advanced Search
Database – CINAHL 145
S3 TX rapid response*
Limiters - Published Date: 20080101-20180531;
English Language
Search modes - Boolean/Phrase
Interface - EBSCOhost Research Databases
Search Screen - Advanced Search
Database – CINAHL 1,049
S2 TX "track and trigger"
Limiters - Published Date: 20080101-20180531;
English Language
Search modes - Boolean/Phrase
Interface - EBSCOhost Research Databases
Search Screen - Advanced Search
Database – CINAHL 30
S1 TX early warning score*
Limiters - Published Date: 20080101-20180531;
English Language
Search modes - Boolean/Phrase
Interface - EBSCOhost Research Databases
Search Screen - Advanced Search
Database – CINAHL 234

89
Appendix B JBI critical appraisal tools
JBI Critical Appraisal Checklist for Quasi-Experimental Studies
(non-randomized experimental studies)
Reviewer Date
Author Year Record Number
Yes No Unclear Not
applicable
1. Is it clear in the study what is the ‘cause’ and what is
the ‘effect’ (i.e. there is no confusion about which
variable comes first)?
□ □ □ □
2. Were the participants included in any comparisons
similar? □ □ □ □
3. Were the participants included in any comparisons
receiving similar treatment/care, other than the
exposure or intervention of interest?
□ □ □ □
4. Was there a control group? □ □ □ □
5. Were there multiple measurements of the outcome
both pre and post the intervention/exposure? □ □ □ □
6. Was follow up complete and if not, were differences
between groups in terms of their follow up
adequately described and analyzed?
□ □ □ □
7. Were the outcomes of participants included in any
comparisons measured in the same way? □ □ □ □
8. Were outcomes measured in a reliable way? □ □ □ □
9. Was appropriate statistical analysis used? □ □ □ □
Overall appraisal: Include □ Exclude □ Seek further info □
Comments (Including reason for exclusion)

90
JBI Critical Appraisal Checklist for Text and Opinion Papers
Reviewer Date
Author Year Record Number
Yes No Unclear Not
applicable
1. Is the source of the opinion clearly identified? □ □ □ □
2. Does the source of opinion have standing in the
field of expertise? □ □ □ □
3. Are the interests of the relevant population the
central focus of the opinion? □ □ □ □
4. Is the stated position the result of an analytical
process, and is there logic in the opinion
expressed?
□ □ □ □
5. Is there reference to the extant literature? □ □ □ □
6. Is any incongruence with the literature/sources
logically defended? □ □ □ □
Overall appraisal: Include □ Exclude □ Seek further info □
Comments (Including reason for exclusion)

91
JBI Critical Appraisal Checklist for Qualitative Research
Reviewer Date
Author Year Record Number
Yes No Unclear Not
applicable
1. Is there congruity between the stated
philosophical perspective and the research
methodology?
□ □ □ □
2. Is there congruity between the research
methodology and the research question or
objectives?
□ □ □ □
3. Is there congruity between the research
methodology and the methods used to collect
data?
□ □ □ □
4. Is there congruity between the research
methodology and the representation and analysis
of data?
□ □ □ □
5. Is there congruity between the research
methodology and the interpretation of results? □ □ □ □
6. Is there a statement locating the researcher
culturally or theoretically? □ □ □ □
7. Is the influence of the researcher on the
research, and vice- versa, addressed? □ □ □ □
8. Are participants, and their voices, adequately
represented? □ □ □ □
9. Is the research ethical according to current
criteria or, for recent studies, and is there
evidence of ethical approval by an appropriate
body?
□ □ □ □
10. Do the conclusions drawn in the research
report flow from the analysis, or interpretation,
of the data?
□ □ □ □
Overall appraisal: Include □ Exclude □ Seek further info □
Comments (Including reason for exclusion)

92
Appendix C Data extraction table
Author/date
Study title Type of study Key findings Strengths Weaknesses JBI tool and score
Smith, L.B., Banner,
L. Lozano, D.,
Olney, C.M. &
Friedman, B.
(2009)
Florida
Connected Care –
Reducing Errors
Through Automated
Vital Signs Upload
Post-
implementation
study
Positive patient identification
In this study a bar-code on a patient’s wristband was
scanned to determine a patient’s identification.
Automated transfer of observations via infrared
technology to a PDA and after confirmation to
electronic medical record
Vital signs were then captured with an observation
machine and then transmitted automatically via infrared
technology to a personal digital assistant (PDA). The
registered nurse or nurse technician then confirmed the
display of vital signs on the PDA by pushing a button
which automatically transferred the vital signs to the
patient’s EMR and to a vital sign sheet. Finally, in this
study the nurse was required to review and validate the
vital signs within the EMR before they became a
permanent part of the EMR. This had to be done within 6
hours.
Manual recording of respiratory rates
Respiratory rates were entered manually as the observation
machine does not measure respiratory rates.
Omission errors (Non-entry of a vital sign or non-
validation of the EMR).
There were 53 errors of omission which accounted for
0.58% of the total recorded vital signs.
Twenty respiratory rates were missing due to the
requirement to enter the respiratory rate manually into the
PDA or EMR.
Three complete sets of vital signs were missing because
The units nursing staff were
blinded to the study, although
there was a requirement to
printout a strip displaying the
vital signs from the
observation machine with the
patient’s room number
documented on it. This
requirement may have alerted
the nursing staff that some
form of measurement was
occurring.
There was a baseline study
conducted seven months prior
to this study which showed a
10% error rate for vital signs
captured on paper and then
written onto a paper chart and
4.4% error rate for vital signs
captured on paper and then
typed manually into the
patient’s EMR (ref). This
demonstrated the significance
of the reduction in error rates
from 10% and 4.4%
respectively to 0.66% for a
system which automatically
uploads the vital signs.
This study was conducted
in only one inpatient
nursing unit over a short
time period of 3 weeks.
The study did not identify
whether the errors were
made by registered nurses
of nurse technicians or if
accuracy was influenced by
other factors such as
experience level of staff,
patient load or patient
acuity. Not clear if nurse
technicians are more likely
to make transcription errors
and nurse technicians are
not used in New Zealand.
This EMR system required
the user to review and
validate the vital signs
within the EMR before
they became a permanent
part of the EMR. The study
did not identify if this
requirement added any
value or if it was an
additional step which could
have affected outcomes.
JBI MAStARI
Score 78%
No control group
It was unclear if
participants included in
any comparisons were
exposed to other
treatment or care other
than the intervention of
interest
Concern regarding the
use of nurse technicians
in this study, Are they
more likely to make
transcription errors.
Unsure because we have
no comparisons between
NTs and RNs. This type
of health professional is
not used in New
Zealand.

93
the nurse did review and validate the vital signs within the
EMR, which was a requirement to make the vital signs a
permanent part of the EMR. Sixteen oxygen saturation
values and five pulse rate values were missing. In 13 cases
the nurse removed the saturation probe from the patient’s
finger before the data was transmitted from the
observation machine to the PDA.
Transcription errors (applies to manually entered
values)
There were seven transcription errors, which accounted for
0.08% of the total recorded vital signs. In one case, the
respiratory was erroneously entered into the saturation
parameter. In a second case, the nurse manually entered an
entire set of six the vital signs directly into the EMR for
the wrong patient, rather than reviewing and validating the
vital signs from the PDA.
Transmission errors (vital sign printout does not match
a value in the PDA or EMR)
There were no transmission errors
Total errors/ Automated transfer of observations via
infrared technology to a PDA and after confirmation to
electronic medical record
There were 60 errors in total which represented an error
rate of 0.66% for this electronic, automated vital sign
documentation.
Wager, K.A.,
Schaffner, M.J.,
Foulois, B., Kazley,
A.B., Parker, C. &
Walo, H.
Comparison of the
Quality and
Timeliness of Vital
Signs Data Using
Three Different Data-
An observational
study
The purpose of this study was to measure the accuracy and
timeliness of vital signs data before and after the
implementation of a clinical documentation system using
four different data-entry devices: a paper medical record
system, a computer-on-wheels workstation kept outside
Observation studies can
have a Hawthorne effect.
Using observers who were
familiar to staff recording
the vital signs was an
JBI MAStARI
Score 78%
No control group

94
(2010)
South Carolina,
USA
Entry Devices the patient’s room requiring the transcription of vital signs
from a piece of paper to the computer and a system
whereby vital signs were entered directly from the
observation machine to an electronic tablet affixed to the
observation machine.
The fourth system with a direct feed of vital signs from the
observation machine to the electronic tablet was not tested.
Vital signs captured directly onto paper
In phase one the technicians generally handwrote the vital
signs directly into the patient’s paper medical record at the
point of care.
Capturing vital signs on paper before writing into
EMR via computer on wheels (bedside computer) or
workstation away from patient’s room
In phase two the technicians typically handwrote the vital
signs on pieces of paper and then transcribed them into the
electronic medical record via a computer on wheels or
workstation outside the patient’s room.
Capturing vital signs directly from observation
machine to EMR via laptop attached to observation
machine
The documentation quality of vital signs improved when
vital signs were entered at the point of care, directly from
the observation machine, into an electronic tablet attached
to the observation machine.
Transcription errors
Documentation errors (predominantly transcription errors
which accounted for 90.3% of the documentation errors)
in patients’ clinical records decreased from 16.8% for the
paper-based system, and 15.2% for vital signs transcribed
attempt to minimise this
effect.
The nurse observers could
also have made
documentation errors when
transcribing the vital signs
from the observation
machine to the
documentation form.
Although they were
advised to carefully check
their work observer
documentation errors could
have occurred and remains
a limitation of this study.
There were fewer
observations made in stage
two: paper to computer, as
medical staff expressed
grave concern about the
delay in inputting vital
signs into the patients’
clinical record. The smaller
sample size in stage two is
a further limitation of this
study. There were 113
observation sets recorded
in stage one , 33
observation sets recorded
Follow up not complete

95
from paper to computer, to 5.6% when vital signs were
entered directly from the observation machine into a
tablet.
Faster documentation of vital signs
It took an average of 9 minutes 15 seconds to input vital
signs from paper into computers outside the patient’s room
as the computers were often occupied by other clinicians.
It took an average of 1 minute 14 seconds to input the vital
signs onto the paper observation chart after taking them
and 35 seconds when entering vital signs directly into an
electronic tablet. An electronic tablet affixed to the
observation machine reduced the time required to record
and document vital signs and improved the quality of the
vital signs.
Equipment/hardware issues
The size of the computer on wheels meant that technicians
could not enter the vital signs at the point of care as it was
too difficult to manoeuvre the computer and observation
machine into the patient’s room. This delay could have
implications for patient safety, especially in an acute ward.
in stage two and 124 in
stage three, resulting in a
total of 270 observation
sets.
Vital signs were recorded
by nurse technicians
(nursing assistants) rather
than registered nurses, so
results between studies
may not be directly
comparable.
The observers in this study
checked the accuracy of 4
vital sign rec0ordings: BP,
pulse, temperature and
oxygen saturation. These
are the four vital signs
displayed on the
observation machine. They
did not check the
documentation accuracy of
the respiratory rate, or
comment on whether this
frequently omitted vital
sign was recorded.
This study appeared to
focus only on capturing
vital signs and not on

96
determining an early
warning score and
observers in this study
noted that the nurse
technicians were not
notifying the nurse if the
vital signs were outside the
reference range.
Meccariello, M.
Perkins, D.,
Quigley, L.G.,
Rock, A. & Qiu, J.
(2010)
USA
Vital Time Savings
Evaluating the Use of
an Automated Vital
Signs Documentation
System on a
Medical/Surgical Unit
A quasi-
experimental
design
The study compared the accuracy and time efficiency of
documenting vital signs manually into the patient’s EMR
to using a data management system that automatically
documents vital signs into the EMR. In both periods an
observation machine was used to obtain BP, temperature,
pulse and oxygen saturations. Respiratory rate and pain
score were obtained manually in both periods, but in the
study phase they were entered into the observation
machine. In the pre-implementation period the vital signs
were written on paper and then transferred manually via
computers in the hallway to the EMR or entered directly
from the observation machine to the EMR via a bedside
computer.
Capturing vital signs directly from observation
machine to EMR via a handheld Devices (PDA)
Handheld devices were also available but were not
preferred by technicians so only one set of vital signs was
completed with this device.
Vital signs captured automatically from observation
machine directly to EMR after vital signs on
observation machine confirmed.
With the study’s automated vital sign documentation
system the clinician verified the accuracy of the vital signs
The clinicians only had a
one hour training session
and one day to familiarise
themselves with the new
method of acquiring and
documenting vital signs
after implementing the
automated documentation
system. Despite this a
significant time saving still
occurred with the study
vital sign machine and
automated documentation
system.
The time lag between
acquiring and documenting
the vital signs into a
computer outside the
patient’s room was not
recorded when this method
was used. This delay in
entering vital sings can
JBI MAStARI
Score 78%
No control group
Not sure if participants
included in any
comparisons were
receiving similar
treatment/care other than
exposure to intervention

97
on the observation machine before pressing a confirmation
button to automatically transfer the vital signs to the
patient’s EMR thus eliminating manual documentation.
Positive patient/clinician identification
The study observation machine had a bar-code scanner
used to identify the patient and clinician.
Documentation errors/accuracy
The use of an automated documentation system as
opposed to manual documentation system reduced
documentation errors by 75%. Out of 52 sets of vital sign
there was an error rate of 13.5% (7 errors) in the manual
documentation period.
Capturing vital signs directly from observation
machine to EMR via a bedside computer
Documentation errors/Typographic
errors/Transcription errors/forgetting vital sign
Four of these errors occurred when documenting from the
observation machine to the bedside computer as follows:
two typographical errors (typing into the computer
incorrectly), one transcription error (transposed digits) and
once having to repeat observations due to forgetting a vital
sign.
Capturing vital signs onto a piece of paper to document
into a computer outside patient’s room
Documentation errors/typographical
error/transcription error/forgetting vital sign
Three errors occurred when the technician wrote the vital
signs on paper and then manually documented the vital
signs into a computer in the hallway. Of these three errors
one was a typographical error, one was a transcription
error and one was forgetting a vital sign.
negatively affect patient
care as others will not be
able to access and evaluate
the vital signs until they are
entered.

98
Vital signs captured automatically from observation
machine directly to EMR after vital signs on
observation machine confirmed.
Documentation errors/difficulty scanning identification
barcode/typographical error/omission error
Of the 92 sets of vital signs done utilising the automated
documentation system an error rate of 3.3% occurred. The
three errors that occurred were difficult scanning the
patient’s identification bar-code, one typographic error
(for the manually entered result) and one omission error
(failure to enter a result that required manual entry i.e. pain
or respiratory rate.
Faster documentation of vital signs
An average time saving of 96.19 seconds was achieved
using the vital sign acquisition/automated documentation
method compared to the vital sign acquisition/manual
documentation method. This equated to almost 120 hours
a month for a 36 bed unit where vital signs were recorded
on average four times a day.
Faster documentation of vital signs
Vital signs captured automatically from observation
machine directly to EMR after vital signs on
observation machine confir6+med
It took an average of 107.5 seconds to acquire and
document the vital signs using the automated
documentation system.
Capturing vital signs onto a piece of paper to document
into a computer outside patient’s room
The acquisition and manual documentation method where
vital signs were recorded on paper and then entered into a
computer in the hallway took the most time, namely

99
203.69 seconds.
Capturing vital signs directly from observation
machine to EMR via a bedside computer
The acquisition and manual documentation to a bedside
computer took an average of 131.63 seconds.
Jones, S., Mullally,
M., Ingleby, S.,
Buist, M., Bailey,
M. & Eddleston,
J.M.
(2011)
United Kingdom
Bedside electronic
capture of clinical
observations and
automated clinical
alerts to improve
compliance with an
Early Warning Score
protocol
Historically
controlled study
Capturing vital signs directly from observation
machine to EMR via a handheld Devices (PDA)
Real time clinical alerts to doctor’s pager
Reduction in length of stay
In this study when automated alerts were sent to doctors
there was a significant reduction in the patient’s length of
stay from 9.7 days to 6.9 days.
Vital signs captured directly onto paper
Documentation errors/accuracy
During the baseline data capture phase (on paper) the early
warning score was calculated accurately on 81% of
occasions. Calculation errors produced both overestimates
and underestimates of the early warning score.
Capturing vital signs directly from observation
machine to EMR via a handheld Devices (PDA)
Documentation errors/accuracy
This increased to 100% with the electronic system.
Timeliness of rechecking observations
The electronic system did not improve the timeliness of
rechecking observations. Compliance with rechecking
observations according to the recommended timeframe for
deteriorating patients did not change significantly between
the baseline and alert phase.
Real time clinical alerts to doctor’s pager
Response to patient deterioration
During the automated alert phase the clinical response to
This was a large study of
many observation sets – 13668
In this study there are
external factors which may
have had an influence on
the length of stay. The
study was conducted in
three consecutive phases
which spanned seasons (the
baseline phase was
conducted in northern
hemisphere winter and the
alert phase was in the
summer) and therefore the
influence of seasonal
illness may have been a
factor influencing los.
There was a five year
median age range between
the baseline and the alert
phase. The median age in
the baseline phase was 70
compared to 65 in the alert
phase. Difference in patient
acuity was not determined.
One cannot guarantee a
homogenous patient group.
This is a significant
JBI MAStARI
Score: 78%
No control group
Not sure if participants
included in any
comparisons were
similar
It is unclear if there was
a difference in the acuity
of the patients in the two
phases. This is a
significant omission
especially when LOS is a
focus. In addition there
is a strong commercial
link to this paper – they
are trying to sell their
system.

100
patient deterioration increased from 29% at baseline to
78%.
Vital signs captured directly onto paper
Response time to patient deterioration
It was not possible to determine compliance with the EWS
protocol in terms of response times in the baseline group
due to poor documentation of attendance times in the
paper record.
Capturing vital signs directly from observation
machine to EMR via a handheld Devices (PDA)
Real time clinical alerts directly to doctors
Response time to patient deterioration
In contrast, the electronic system documented the time of
data entry, automatically calculated the early warning
score and recorded the clinical response times to the
patient. Overall, at baseline patients with an early warning
score of 3, 4, or 5 were responded to on 29% of instances.
This increased to 78% during the automated alert phase.
Patients with a high early warning score (> 5) were
responded to on 67% of deterioration instances in the
baseline phase, compared to 96% during the alert phase.
Vital signs captured directly onto paper
Critical care admissions
At baseline 14 patients were admitted to critical care and
their length of stay was 51 bed-days.
Capturing vital signs directly from observation
machine to EMR via a handheld Devices (PDA)
Real time clinical alerts to doctor’s pager
Critical care admissions
In comparison, when automated alerts were sent five
patients were admitted to critical care and their length of
omission especially when
los is the focus. In addition
there may be a strong
commercial link to this
paper as one of the
researchers is a founding
director and shareholder of
the Patientrack system used
in this study.
When the hospital
introduced the electronic
system they conducted
additional deteriorating
patient education to the
nurses in the
implementation wards.
This training was not
conducted at the baseline
phase and may have had a
resulted in improved
clinical outcomes during
the alert phase.

101
stay was 26 bed-days.
Cardiac arrest rates
Reductions in cardiac arrest incidence and mortality did
not reach statistical significance.
Real time clinical alerts to doctor’s pager
Response to patient deterioration
This study demonstrated significant improvement in
clinician response to deteriorating patients. The
Patientrack system used in this study not only issues alerts,
but reissues reminders if clinicians do not attend the
patient of respond within the EWS protocol time. If the
reminders fail, an alert is sent to more senior doctors, for
example a registrar or consultant until the alert is attended
to and acknowledged. In this study on 96% of occasions
senior medical doctors attended the most unwell patients
(early warning score > 6) compared to 67% in the baseline
period.
Bellomo, R.,
Ackerman, M.,
Bailey, M., Beale,
R., Clancy, G.,
Danesh, V.,
Hvarfner, A.,
Jimenez, E.,
Konrad, D.,
Lecardo, M., Pattee,
K.S., Ritchie, J.,
Sherman, K., &
Tangkau, P.
A controlled trial of
electronic automated
advisory vital signs
monitoring in general
hospital wards
Before-and-after
controlled trial
To determine if
electronic
automated advisory
vital signs monitors
may help identify
such patients and
improve the
outcomes of
deteriorating ward
Automated documentation system (Vital signs
transferred automatically to advisory bedside patient
monitors).
In this study the following vital signs obtained from
patient monitoring equipment were automatically
transferred and displayed to bedside patient monitors: BP,
heart rate, pulse oximetry and temperature. The nurse was
then prompted to enter the patient’s respiratory rate, level
of consciousness and ward specific parameters such a
nurse’s concern and urine output. The early warning score
was then calculated automatically and displayed on the
monitor together with any actions required to be taken by
This was a large international
study with a patient cohort of
18305. The RRT was blinded
to the fact that a new
monitoring protocol had been
introduced so their response
was not altered by the
implementation of the
monitors.
No other modifications were
made to nursing care or
medical care in the study
The same group of nurses
were exposed to both
interventions, so there was
no independent separate
group used as a control
group.
The before-and-after study
design meant that the 3
month intervention period
occurred during a different
season to the 3 month
JBI MAStARI
Score: 89%
No control group

102
(2012)
Multicentre,
multinational trial –
12 general wards in
ten hospitals in the
United States,
Europe and
Australia
patients.
the nurse according to the hospital’s escalation protocol.
The monitor also advised the nurse when the next vital
signs were due as per the patients Early Warning Score
and hospital’s EWS protocol. The monitor kept a record of
all vital signs for review and could display vital sign trends
on request.
Automated documentation system (Vital signs
transferred automatically to advisory bedside patient
monitors).
Faster acquisition of vital signs.
A system that assists one to obtain, complete and display
vital signs and automatically calculates the early warning
score may decrease the time required to complete a set of
observations and may result in improved identification of
patient deterioration.
Benefits associated with the implementation of automated
advisory vital sign monitors:
In this study the time required to complete and record a set
of vital signs and automatically calculate an Early
Warning Score resulted in a time saving of about 1750
nursing hours per ward per year. The time decreased from
an average of 4.1 min to 2.5min.
Automated documentation system (Vital signs
transferred automatically to advisory bedside patient
monitors).
Increased RRT calls
There were a similar number of RRT calls made during the
control (205 calls) and intervention period (209 calls).
However, RRT calls made for abnormal respiratory rates
increased by 52% as the monitors forced nurses to enter
wards during the study period
and no additional interventions
were applied. The short period
between interventions also
minimised the effect of
extraneous factors on
outcomes and thousands of
patients were studied.
Hospital administrators coding
outcome measures were
blinded to the interventions of
the study.
The demographic data,
admission status and
diagnostic categories of
patients (ICD-10 codes) were
compared for patients in the
control and intervention period
so that one could determine if
participants included in
comparisons were similar.
Robust and adjusted outcome
measures were used to account
for differences between
patients, hospitals and seasons.
.
control period and this
could potentially have
affected patient outcomes.
During the intervention
period more RRT calls
were made for less acutely
unwell patients (possibly
over triaging), which may
have been responsible for
improved patient outcomes
during the intervention
period.
The price of one monitor
was $5275 and unless one
could demonstrate a
significant cost saving in
terms of decreased length
of stay this cost may be
prohibitive.

103
the respiratory rates in order to calculate the Early
Warning Score (RR known to be a sensitive and early
predictor of patient deterioration). RRT calls made for
respiratory criteria increased from 21% to 31%.
Automated documentation system (Vital signs
transferred automatically to advisory bedside patient
monitors).
Response time to patient deterioration
Patients had fewer physiological abnormalities at the time
of the RRT call indicating that the advisory monitors
encouraged and prompted earlier calls for help.
General medical interventions
Benefits associated with the earlier and improved response
to patient deterioration included less need for mechanical
ventilation, reduced arterial line insertion and vasopressor
use. Rather, general medical interventions to address the
deterioration more than tripled. This finding and the
subsequent transfer of more deteriorating patients to
higher acuity areas (only found in US hospitals) with
additional monitoring, suggest that improved monitoring
improves patient outcomes, not increased medical
interventions.
Survival rates/decreased mortality
Deteriorating patients for whom a RRT activation was
made also had improved in-hospital and 90 day survival
rates (86% - 92%). It was calculated that approximately 12
lives were saved by implementing the monitors.
Cardiac arrests
34 patients had cardiac arrests during the control period
compared to 24 cardiac arrests during the intervention
periods.

104
Reduction in length of stay
The use of the monitors was also associated with an
overall decreased length of hospital stay (3.4 – 3.0 days)
and a subsequent cost saving. This finding only reached
significance in United States hospitals.
Mwulu, U.,
Westwood, D.,
Edwards, D.,
Kelliher, F. &
Coleman, J.J.
(2012)
United Kingdom
Adoption of an
Electronic Observation
Chart with an
Integrated Early
Warning Scoring
System on Pilot Wards
Early phase review Capturing vital signs directly from observation
machine to EMR via a bedside computer
In this study vital signs were captured electronically via a
bedside computer to the patient’s EMR.
On screen (advisory) warnings
If the system calculated an abnormal SEWS based on the
entered vital signs onscreen warnings and instructions as
per the Standardised early warning score (SEWS) protocol
appeared on the screen.
Real time clinical alerts to email of critical care
outreach team
For patients with the highest SEWS email alerts were also
sent via a mobile device to the critical care outreach team.
Fully completed observation sets producing a EWS
score
In this study in 80.5% of the observation sets a full set of
vital signs was completed and produced a SEWS. During
the 4-month audit period an average of 419 observation
sets produced a SEWs score every day. 82.5% of these
SEWs did not produce an alert or alarm.
On screen (advisory) warnings
A daily average of 74 SEWS (from 419 fully completed
observation sets) produced onscreen alerts to clinical staff.
Real time clinical alerts to email of critical care
outreach team
This study did not evaluate
the impact of electronic
vital sign recording on
patient outcomes.
A multi method evaluation
to fully explore the
implementation of an
electronic EWS is required.
This is an implementation
study and the authors
should have used
implementation theory, for
example, Consolidated
Framework for Improving
Implementation Science
Research (CFIR) or other
to provide useful
information to the reader.
Does not add much to
papers already reviewed.
JBI MAStARI
Score 75%
No control group
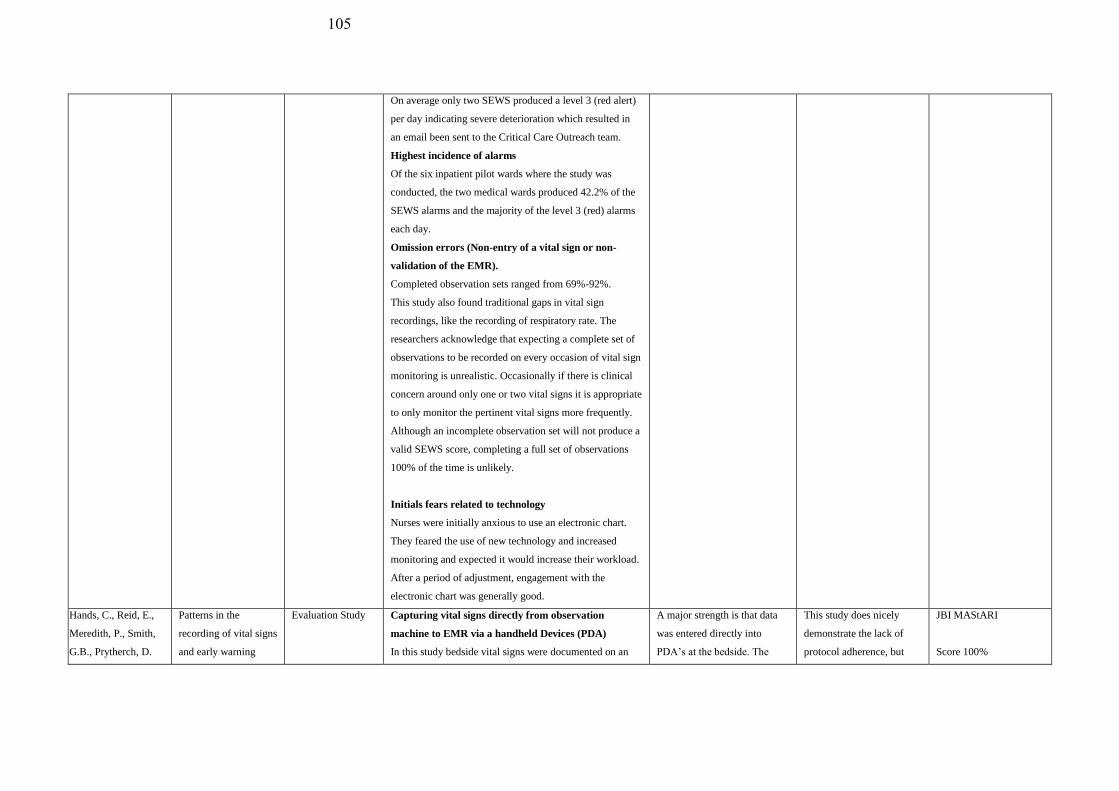
105
On average only two SEWS produced a level 3 (red alert)
per day indicating severe deterioration which resulted in
an email been sent to the Critical Care Outreach team.
Highest incidence of alarms
Of the six inpatient pilot wards where the study was
conducted, the two medical wards produced 42.2% of the
SEWS alarms and the majority of the level 3 (red) alarms
each day.
Omission errors (Non-entry of a vital sign or non-
validation of the EMR).
Completed observation sets ranged from 69%-92%.
This study also found traditional gaps in vital sign
recordings, like the recording of respiratory rate. The
researchers acknowledge that expecting a complete set of
observations to be recorded on every occasion of vital sign
monitoring is unrealistic. Occasionally if there is clinical
concern around only one or two vital signs it is appropriate
to only monitor the pertinent vital signs more frequently.
Although an incomplete observation set will not produce a
valid SEWS score, completing a full set of observations
100% of the time is unlikely.
Initials fears related to technology
Nurses were initially anxious to use an electronic chart.
They feared the use of new technology and increased
monitoring and expected it would increase their workload.
After a period of adjustment, engagement with the
electronic chart was generally good.
Hands, C., Reid, E.,
Meredith, P., Smith,
G.B., Prytherch, D.
Patterns in the
recording of vital signs
and early warning
Evaluation Study Capturing vital signs directly from observation
machine to EMR via a handheld Devices (PDA)
In this study bedside vital signs were documented on an
A major strength is that data
was entered directly into
PDA’s at the bedside. The
This study does nicely
demonstrate the lack of
protocol adherence, but
JBI MAStARI
Score 100%

106
R., Schmidt, P.E. &
Featherstone, P.I.
(2013)
United Kingdom
scores: compliance
with a clinical
escalation protocol
electronic system called VitalPAC, using handheld devices
(PDA’s).
On screen (advisory) warnings
VitalPAC assigned a date and time stamp to documented
observations and issued a warning if vital signs were
entered in error, or if they were out of range. VitalPAC
then automatically calculated the patient’s ViEWS score
and for patients with an elevated ViEWS score instantly
displayed on the PDA the action to be taken by the nurse
as per the hopsital’s clinical escalation protocol. This
onscreen prompt included instructions on when the vital
signs should be rechecked as determined by the ViEWS
value. This time frame varied from 12 hours for patients
with a low ViEWS score to 30 minutes for the severely ill
patients.
Timeliness of rechecking observations – factors
influencing compliance – night vs day, times allocated
to the recording of vital signs and ViEWS score.
During the study period 950 043 observation sets were
recorded. It was found that vital signs were measured
infrequently between the hours of 23:00 and 05:59.
Despite this time period comprising 29.2% of a 24 hour
day, only 12.81% of the daily vital signs were recorded
during this period. The percentage of vital signs recorded
hourly between 10:00 and 17:59 ranged from 3.35–6.08%
with two definite peaks in hourly vital sign recordings
between 06:00–06:59 and 21:00–21:59. During these
times 13.58% and 8.58% of the total vital signs were
recorded, respectively. The study found that the
percentage of hourly vital signs recorded between 23:00
and 05:59 increased to 23.84% for patients with a ViEWS
database consisted of
950 043 sets of vital signs
each with an accurate date and
time stamp. No retrospective
review of pen and paper charts
would be able to replicate the
collection, extraction, analysis
or audit of data on this scale.
does not investigate the
reason as to why this is
This was a retrospective
audit of electronic EWS
utilising large datasets.
In this study only the last
three questions of the
quasi-experimental tool
relating to the way
outcomes are measured
and the statistical
analysis used, were
applicable

107
score of 9 or greater, indicating that deteriorating patients
were monitored more frequently during these hours.
However, irrespective of the ViEWS value, adherence to
protocol in terms of frequency of required vital signs was
always greater during the day than at night.
This study demonstrates that there were large variations in
the frequency of vital sign recording across a 24 hour
period with two large peaks between 06:00–06:59 and
21:00–21:59 and lower frequency of vital sign recording at
night-time. This was a common finding for every day of
the week. There was less variability in the frequency of
vital sign recording among patients with a high ViEWs
value, indicating that sicker patients were more frequently
monitored and more likely to have vital signs recorded
overnight. However, even though sicker patients were
more likely to have their vital signs rechecked before
06:00, the study found that 47.42% of patients with a
recorded ViEWS of 7-8 between 20:00 and 23:59 and
31.22% of patients with a recorded ViEWS value ≥9
between 20:00–23:59 did not have their vital signs
rechecked in the next 6 hour period. In contrast, only
18.81% of patients with a recorded ViEWS value of 7-8
between 08:00 and 11:59 and 13.35% of patients with a
recorded ViEWS value ≥9 between 08:00–11:59 did not
have their vital signs rechecked in the next 6 hour period.
Continuous electronic monitoring and mandatory
documentation times
For patients on continuous electronic monitoring it was
mandatory for staff to document the vital signs on
VitalPac as frequently as required according to the
hospital’s clinical escalation protocol for the ViEWs score.
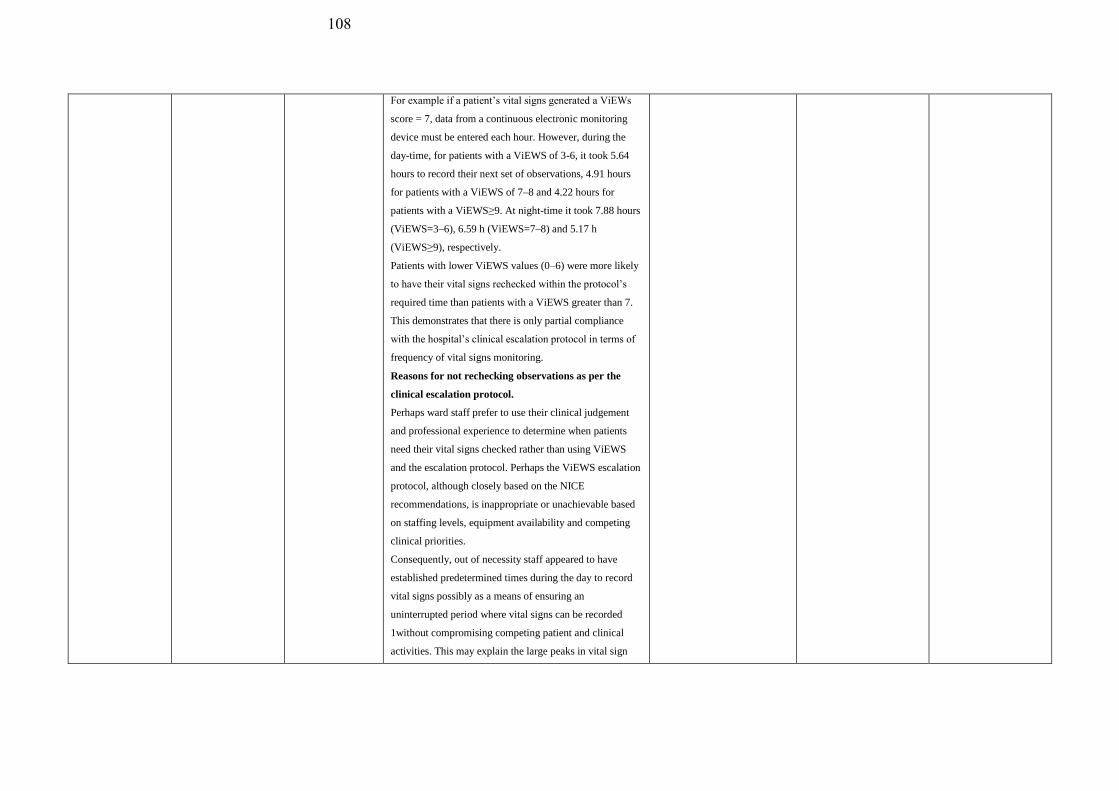
108
For example if a patient’s vital signs generated a ViEWs
score = 7, data from a continuous electronic monitoring
device must be entered each hour. However, during the
day-time, for patients with a ViEWS of 3-6, it took 5.64
hours to record their next set of observations, 4.91 hours
for patients with a ViEWS of 7–8 and 4.22 hours for
patients with a ViEWS≥9. At night-time it took 7.88 hours
(ViEWS=3–6), 6.59 h (ViEWS=7–8) and 5.17 h
(ViEWS≥9), respectively.
Patients with lower ViEWS values (0–6) were more likely
to have their vital signs rechecked within the protocol’s
required time than patients with a ViEWS greater than 7.
This demonstrates that there is only partial compliance
with the hospital’s clinical escalation protocol in terms of
frequency of vital signs monitoring.
Reasons for not rechecking observations as per the
clinical escalation protocol.
Perhaps ward staff prefer to use their clinical judgement
and professional experience to determine when patients
need their vital signs checked rather than using ViEWS
and the escalation protocol. Perhaps the ViEWS escalation
protocol, although closely based on the NICE
recommendations, is inappropriate or unachievable based
on staffing levels, equipment availability and competing
clinical priorities.
Consequently, out of necessity staff appeared to have
established predetermined times during the day to record
vital signs possibly as a means of ensuring an
uninterrupted period where vital signs can be recorded
1without compromising competing patient and clinical
activities. This may explain the large peaks in vital sign

109
recording in this study at 06:00 and 21:00.
Consequences of not rechecking observations as per
the clinical escalation protocol. This study found that the
RRT was more frequently activated during the peak times
of vital sign recording than at night, so failure to check
observations may miss early patient deterioration and
undermine the effectiveness of any EWS.
Evans, R.S., Kuttler.
K.G., Simpson, K.J.,
Howe, S., Crossno,
P.F., Johnson, K.V.,
Schreiner, M.N.,
Lloyd, J.F.,
Tettelbach, W.H.,
Keddington, R.K.,
Tanner, A., Wilde,
C. & Clemmer, T.P.
(2014)
Salt Lake City, Utah
Automated detection
of physiologic
deterioration in
hospitalized patients
Prospective
Observational
Study
Continuous patient monitoring
Automated documentation system (Vital signs
transferred automatically to a bedside computer and
the EMR every 5 minutes).
All patients admitted to a 33-bed medical and oncology
ward (A) and a 33-bed surgical trauma ward (B) were
continuously monitored. Vital signs were then transferred
automatically to a bedside computer and the EMR every 5
minutes to detect early sign of physiological deterioration
Real time clinical alerts to CNM’s pager
Automated documentation system (Vital signs
transferred automatically to a bedside computer and
the EMR every 5 minutes).
During the trial period charge nurses received a pager alert
generated by the system if the early warning score
triggered signs of physiologic patient deterioration. The
charge nurse manager then reviewed the patient and their
vital signs, discussed that patient with their nurse and then
made a decision to notify a physician or make RRT call.
To allow time to resolve the deterioration the system only
sent one alert per patient during a four hour period. Nurses
caring for patients who had triggered an alert were asked
The patients in both units had
similar characteristics in the
intervention and pre-
intervention periods.
The same group of nurses
were exposed to both
interventions so there was
no independent separate
group used as a control
group.
When bedside nurses failed
to complete the evaluations
after an alert was generated
the evaluation was
completed by RRT leads
and ICU nurses who
retrospectively examined
the patient. Due to the
nurses’ acceptance and
approval of the system
their evaluations may have
been biased and swayed
towards a higher positive
predictive value (over 95%
on both wards).
JBI MAStARI
Score: 89%
No control group

110
to fill out an evaluation form to evaluate the alerts.
Automated documentation system (Vital signs
transferred automatically to a bedside computer and
the EMR every 5 minutes).
In this study the use of continuous patient monitoring
which graphically displayed the vital signs helped
overcome the barrier of insufficient patient visualisation
and failure to recognise physiologic deterioration. This
study found that by continuously monitoring vital signs,
automatically calculating the modified early warning score
(MEWS) and generating an alert according to a predefined
pathway, patients were consistently monitored and
identifying early signs of deterioration impacted
favourably on patient care.
Nurses’ perceptions of continuous monitoring,
automated documentation and automated clinical
alerts.
Positive predictive value
Trending of vital signs
The positive predictive value of the alerts as perceived by
the nurses was 91-100%, depending on the presence of
incorrectly captured vital signs.
Nurses reported that the systems graphical display of vital
signs enabled them to identify trends to quickly evaluate
the patient’s condition. The system also gave them more
confidence in their assessment of the patient and in
requesting additional help. The nurses and the RRT
reported that information provided by the system meant
care was expedited to deteriorating patients and in some
cases a RRT call was averted.
Real time clinical alerts to CNM’s pager
In this study the high PPV
and timing of the alerts has
resulted in physicians and
advance practice clinician
demonstrating an increased
interest in being included
in follow up of the alerts.
The researcher cannot rule
out that there may have
been other interventions or
changes in the ward in
either the intervention or
pre-intervention period
which may have affected
the outcomes.
Another limitation of the
study is that physiologic
deterioration alerts were
generated by the system
during the entire
intervention period, the
requirement for bedside
nurses, the RRT and
intensive care nurses to
evaluate the alerts was
terminated early due to the
added workload required to
do so. The shortened
period of collecting the

111
Response to patient deterioration
On both study units the nurses called the physician on
51% (unit A) and 44% (unit B) of occasions when the
system generated an alert and interventions were initiated
for 59% (unit A) and 52% (unit B) of these alerts.
RRT Calls/Mortality rates
more RRT calls were made (60 vs 29 pre-intervention) and
significantly fewer patients died (2.6% vs 3.7%) compared
to the pre-intervention year. On unit B there was an
insignificant increase in RRT calls made during the
intervention year (21 vs 11), but unlike unit A there was
no significant decrease in mortality. The patients on unit A
were much older and had many more co-morbidities than
the patients on unit B. Therefore, they were more prone to
physiologic deterioration as evidenced by higher number
of alerts generated (17% vs 9%) and triple the number of
RRT activations during the intervention period compared
to the pre-intervention period. Based on these results it
appears that the benefits associated with an EWS may be
higher for older patients with multiple co-morbidities.
Length of stay
The patients in unit A had a significantly longer hospital
stay compared to the patients on unit B during the
intervention year compared to the pre-intervention year.
This may be because the alerted patients generated more
RRT calls, had more interventions or were transferred to
ICU early enough to increase their chances of survival to
discharge. This resulted in a longer length of stay and
increased hospital cost.
ICU Admissions
During the intervention year on unit A, more patients were
evaluation results was
however not perceived to
have altered the study
outcome.
No impact of the
simulation training on unit
A was detected or of other
secular trends at the unit
level. Other unit changes
cannot be totally ruled out.
Although this before-after
study found a significant
increase in RRT calls and
reduction in mortality
during the intervention
years, this was found only
in the one unit with older
patients with multiple co-
morbidities. Therefore
further study is required to
eliminate potential
confounding.

112
transferred to an ICU 163 (5.1%) of 3189 compared to 146
(4.1%) in the pre-intervention year
Schmidt, P.E.,
Meredith, P.,
Prytherch, D.R.,
Watson, D., Watson,
V., Killen, R.M.,
Greengross, P.,
Mohammed, M.A.,
& Smith, G.B.
(2015)
Impact of introducing
an electronic
physiological
surveillance system on
hospital mortality
Retrospective,
observational study
Capturing vital signs directly from observation
machine to EMR via a handheld Devices (PDA)
The EPSS—VitalPAC—allows nurses to use a handheld
electronic device at the patient’s bedside to record a
complete set of vital signs within an appropriate
timeframe.
On screen (advisory) warnings
The system automatically calculates the patient’s early
warning score and displays a required escalation response
based on the score, including when to repeat the vital sign
recordings, who to escalate care to and the required
timeframe of the response. These messages are displayed
on the screen of the handheld device, but do not
automatically generate the alert.
Capturing vital signs directly from observation
machine to EMR via a handheld Devices (PDA)
These devices automatically and wirelessly transfer the
recorded data to the patient’s electronic medical record
which can be viewed from any device linked to the
hospital’s intranet with the required access rights.
Capturing vital signs directly from observation
machine to EMR via a handheld Devices (PDA)
Documentation errors/accuracy
The EPSS required users to enter a full set of vital signs on
each occasion of taking routine observations. Both of the
study sites showed that a complete set of vital signs was
completed 98% of the time.
Mortality rate
It is improbable that the
Hawthorne effect could have
caused or contributed the
reduction in mortality as the
project teams’ involvement
following implementation did
not extend beyond two weeks
and the reduction in mortality
was sustained over two years.
The reductions in mortality in
each speciality, in two
different hospitals,
consistently coincided with the
implementation of the
Electronic EWS suggesting
that the electronic EWS was
responsible for this. Although
it is impossible to prove a
direct cause-and-effect
relationship between the
electronic EWS
implementation and mortality
reduction, the almost identical
results at two hospitals, 240
kilometres apart was viewed
as a significant finding. The
consistent results following the
implementation of the
It is possible that other
changes in practice may
have been introduced other
than the electronic EWS
(eg, introducing care
bundles or altering nurse-
patient ratios) which could
have caused or contributed
to the sustained reduction
in mortality, but the
mortality reductions did
not necessarily coincide
with their implementation.
There was no independent
separate control group in
the wards at the same time.
JBI MAStARI
78%
No control group
Unclear if participants
included in any
comparisons receiving
similar treatment/care
other than exposure to
the intervention

113
During EPSS implementation, crude mortality fell from
7.75% to 6.42% which equated to 397 fewer deaths in one
hospital. At the second hospital crude mortality fell from
7.57% to 6.15% and equated to 372 fewer deaths. Year on
year statistics at both hospitals showed abrupt and
sustained reductions in mortality, in all specialities,
coincided with the implementation of the system.
In both hospitals, mortality was highest amongst elderly,
medically admitted, unscheduled admissions and ensuring
monitoring in this patient group, for their entire admission,
was found to be important in reducing mortality.
electronic EWS at different
hospitals, across different
specialities, at different times
suggests the implementation of
the electronic EWS is
generalisable and reproducible
based on a plausible cause and
effect relationship.
There were no major changes
in patient types admitted
during the study accounting
for the reductions in mortality.
In fact, the age and number of
emergency admissions in one
hospital increased during the
study period and at the other
hospital there was no notable
change in either.
This was a very large study
conducted across and
throughout two-centres to
measure mortality in all adult
specialities, as opposed to
prior smaller implementation
studies limited to specific
patient groups or focussing on
process measures.
Kollef, M.H., Mortality and Length Retrospective Real time clinical alerts to dedicated RRT nurse’s Given the retrospective JBI MAStARI

114
Heard, K., Chen, Y.,
Lu, C., Martin, N. &
Bailey, T.
(2017)
Missouri, USA
of Stay Trends
Following
Implementation of a
Rapid
Response System and
Real-Time
Automated Clinical
Deterioration Alerts
analysis mobile device
Patients identified with signs of clinical deterioration from
predominantly manually obtained vital signs had a real
time automated alert sent to a nursing member of the RRT.
These alerts were generated 24 hours per day 7 days per
week. Starting in 2009 the RRT could be activated by
either nursing staff or the RTCDA. After 2012 the
RTCDA were sent to a hospital issued mobile phone held
by a dedicated RRT nurse with no other clinical
responsibilities.
Response to patient deterioration
The RRT nurse had to attend to all alerts within 20
minutes. Internal audits showed that in 95% of cases the
RRT nurse responded to alerts within 10 minutes. Initially
the RRT nurse would assess the alerted patient using the
Modified Early Warning Score and then determine the
most appropriate response based on the MEWS score
escalation criteria and discussions with the patient’s
treating physician or the RRT physician. The study used
RTCDA and nursing assessments to trigger the RRT.
Mortality rates
This study demonstrated that a EWS using RTCDAs
on general medicine units reduced mortality, Cardiac
Arrests
decreased the occurrence of cardio-pulmonary arrests and
Length of stay reduced hospital stay. The hospital
introduced their EWS in 2006 and added RTCDAs in 2009
in a staged process. Statistically significant year-to-year
decreases in mortality, cardio-pulmonary arrests and
median lengths of stay were observed through 2014.
nature of this study over a
number of years the
reductions in mortality,
CPAs, and hospital stay
could not be definitively
attributed to the
introduction of the
EWS/RTCDAs. Other
variables during that time
may also have affected the
findings making it difficult
to determine the relative
contribution of the
EWS/RTCDA on observed
outcome improvements.
However, the correlation
between increased number
of RRT activations and
decreased CPAs gives
merit to the clinical
findings of this study.
A major limitation of this
study is that no physiologic
severity of illness record
was kept for the duration of
the study to determine if
less ill patients were
perhaps admitted when
patient outcomes showed
improvement. Although
this may have introduced a
78%
No control group
Cannot guarantee that
participants included in
any comparisons were
receiving similar
treatment care other than
exposure to the
intervention of interest

115
RRT Activations correlated to cardiac arrests
There was a statistically significant year-to-year
increase in the number of RRT activations that was
inversely correlated with the occurrence of cardio-
pulmonary arrests. The study also found reductions in
CPAs were significantly correlated with increasing RRT
activations.
Real time clinical alerts to dedicated RRT nurse’s
mobile device
Response to patient deterioration
The study found that the use of an EWS and RTCDA, in
addition to nursing assessments, ensured rapid activations
of the RRT and minimised delays often associated with a
non-automated system.
Response to patient deterioration
The study found that there was a daily average of one RRT
activation, which was lower than expected. An explanation
offered was that the EWS/RTCDA system was designed to
avoid false negative alerts.
potential bias, the Charlson
comorbidity scores in the
study units increased over
the study’s duration, so the
study team felt a bias was
unlikely.
As this was a single centre
study using a locally
developed EWS and
RTCDA system in medical
wards only, it is unknown
if the study’s results would
be generalisable and
reproducible in another
hospital environment. The
study results may have
been influenced by the
implementation of a
dedicated, permanent RRT
nurse position during the
study. This would have
allowed dedicated time to
assess and pre-emptively
identify deteriorating
patients.
Wong, D., Bonnici,
T., Knight, J.,
Gerry, S., Turton, J.
& Watkinson, P.
A ward-based time
study of paper and
electronic
documentation for
Before- and- after
observational
study.
Capturing vital signs to EMR via tablet mounted
alongside observation machine
On screen advisory warnings
In 3 medical inpatient wards in two hospitals existing
The participants knew they
were being observed so the
Hawthorne effect could
have stimulated an
JBI MAStARI
87.5%

116
(2017)
United Kingdom
recording vital sign
observations
The primary
objective of this
study was to
determine whether
introduction of an
e-Obs system alters
the time required to
record a complete
set of vital sign
observations.
paper observation charts were replaced with an electronic
observation system, called SEND.
Positive patient identification
In this study positive patient identification occurred by
scanning the barcode on the patient’s wristband.
Vital signs captured directly onto paper.
Capturing vital signs to EMR via tablet mounted
alongside observation machine
Faster documentation of vital signs
The pre- and post-implementation period on each ward
was 5-weeks respectively. The primary outcome measure
was the difference in time taken to record a complete set
of vital signs and calculate an early warning score between
the paper and electronic EWS.
153–280 complete sets of vital signs were recorded per
ward for each period. The majority nurses observed were
at the same level.
Introduction of an electronic observation system resulted
in a statistically significant reduction in the time taken to
record and document vital signs compared to paper. The
reduction was significant, even after allowing for
differences between wards, nursing levels, individual
nursing behaviour and encountered interruptions. The time
reductions varied between wards and was only clinically
significant in 1 of the 3 wards studied. The geometric
mean time was 215 seconds to complete a set of vital signs
on paper compared to 150 seconds on the electronic
system.
Capturing vital signs to EMR via tablet mounted
alongside observation machine. Improved
standardisation with the electronic system
improvement in
performance, but this
would have been
applicable in the pre- and
post-implementation
period.
No control group

117
It appears that an electronic system improved
standardisation with regards the recording and
documentation of vital signs. Standardisation of processes
contributes to improved quality of care. Manual
recording of respiratory rates
The majority time saved occurred in the taking of vital
signs subtask, despite the electronic system including a 6o
second timer for the recording of respiratory rate. Sixty
seconds is the gold standard for counting respiratory rate
which is known to be an important indicator of clinical
deterioration.
Pullinger, R.,
Wilson, S., Way,
R., Santos, M.,
Wong, D., Clifton,
D., Birks, J. &
Tarassenko, L.
(2017)
United Kingdom
Implementing an
electronic observation
and early warning
score
chart in the emergency
department: a
feasibility study.
Before and after
study
In this study approximately 3,000 subjects were enrolled
pre-implementation of the electronic EWS and 3000 were
enrolled post-implementation.
Vital signs captured directly onto paper
In stage one vital signs were captured on paper, the early
warning score was manually calculated and actions taken
based on the early warning score were documented on the
chart.
Capturing vital signs directly from observation
machine to EMR via a handheld Devices (PDA)
In Stage 2, vital signs were captured on handheld
electronic devices (iPods) which automatically populated
the electronic observation chart (Vitalpac) and
automatically calculated the early warning score. The
electronic system also prompted the frequency of
subsequent vital signs based on the early warning score
and EWS protocol.
The primary outcome measure was to determine how
The influence of
extraneous variables
cannot be ruled out.
JBI MAStARI
78%
No Control group
It was unclear if
participants included in
any comparisons were
exposed to other
treatment or care other
than the intervention of
interest
Improvements in staff
training, workflow, and
quality assurance may
also have contributed to
such an improvement .
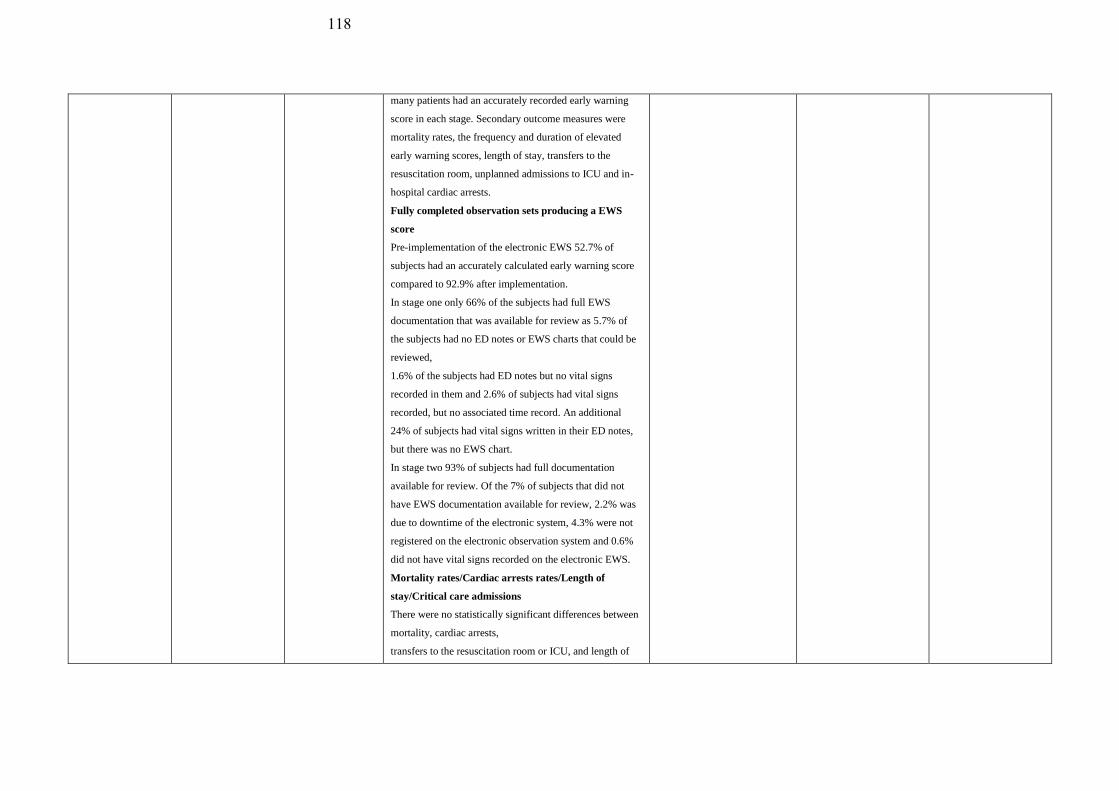
118
many patients had an accurately recorded early warning
score in each stage. Secondary outcome measures were
mortality rates, the frequency and duration of elevated
early warning scores, length of stay, transfers to the
resuscitation room, unplanned admissions to ICU and in-
hospital cardiac arrests.
Fully completed observation sets producing a EWS
score
Pre-implementation of the electronic EWS 52.7% of
subjects had an accurately calculated early warning score
compared to 92.9% after implementation.
In stage one only 66% of the subjects had full EWS
documentation that was available for review as 5.7% of
the subjects had no ED notes or EWS charts that could be
reviewed,
1.6% of the subjects had ED notes but no vital signs
recorded in them and 2.6% of subjects had vital signs
recorded, but no associated time record. An additional
24% of subjects had vital signs written in their ED notes,
but there was no EWS chart.
In stage two 93% of subjects had full documentation
available for review. Of the 7% of subjects that did not
have EWS documentation available for review, 2.2% was
due to downtime of the electronic system, 4.3% were not
registered on the electronic observation system and 0.6%
did not have vital signs recorded on the electronic EWS.
Mortality rates/Cardiac arrests rates/Length of
stay/Critical care admissions
There were no statistically significant differences between
mortality, cardiac arrests,
transfers to the resuscitation room or ICU, and length of

119
stay. Stage two subjects were slightly more likely to be
admitted as in-patients (66.4%) than stage one subjects
(61.6%). A clinical process change was implemented
between the two stages and therefore it was not possible to
equate this difference in admission rates to improved
completeness and accuracy of early warning scores with
the electronic system.
Timeliness of rechecking observations
A retrospective analysis of the vital signs revealed that
with the electronic system vital signs were recorded more
frequently for patients with a high early warning score
than with the paper-based system. This may have been due
to increased awareness of patient deterioration over time
or to the automated prompts given by the electronic
system to increase the frequency of vital signs in
deteriorating patients.
Pedersen, N.E.,
Rasmussen,L.S.,
Petersen, J.S.,
Gerds,T.A.,
Østergaard, D. &
Lipppert, A.
(2017)
Denmark
A critical assessment
of early warning score
records in 168,000
patients
Observational
Study of NZEWS
data
Capturing vital signs and manually entering them into
the EMR
Vital signs were recorded by ward staff and entered
manually into the EMR. The system allows for the partial
entry of vital signs. If all seven vital signs making up the
NEWS were entered the system automatically calculated
the early warning score. The required frequency of vital
sign measurement is dependent on the preceding NEWS
score and the escalation protocol.
Omission errors (Non-entry of a vital sign)
Of 2,835,331 NEWS records, 271,103 (10%) were
incomplete and 0.2% of the records had values that were
implausible. An incomplete set of vital signs may be
entered due to protocol non-adherence, but in certain
A strength of this study is
access to NEWS data from a
public hospital system
covering 1.7 million people
and the ability to reliably
merge data from multiple
hospitals.
Weaknesses of the study
include having limited
knowledge on the quality
of data collection practices
in the different hospitals.
The time stamps of vital
signs entered on the EMR
may not represent the true
time that vital signs were
measured. This is a
recognised problem with
data that is manually
entered into the EMR.
JBI MAStARI
100%
This was a retrospective
audit of electronic EWS
utilising large datasets.
In this study only the last
three questions of the
quasi-experimental tool
relating to the way
outcomes are measured
and the statistical
analysis used, were

120
clinical situations it may be appropriate to focus on
specific vital signs.
A large percentage of these partially entered records were
followed by complete records shortly after.
Transcription errors (applies to manually entered
values)
0.2% of the records had erroneous or extreme values
entered indicating that wrong values were entered, or
values were entered in the wrong fields. Some of these
errors may have been eliminated If the system was
programmed to identify erroneous records at the point of
entry.
Digit preferences for even numbers were found for
respiratory rate, oxygen flow rates, heart rate, and systolic
blood pressure. An unusually high recording of heart rate
records just below 91 beats per minute could indicate bias
towards a value that does not generate a NEWS point, as
this is the cut-off point between a NEWS value of 0 and 1.
Capturing vital signs and manually entering them into
the EMR
Fully automated systems.
The findings in this study demonstrate that data quality in
systems where NEWS values are entered manually may be
problematic.
Fully automated systems.
This issue could be addressed by replacing systems
requiring the manual entry of vital signs with fully
automated systems where recorded vital signs are captured
automatically. However, most EWS have been developed
and validated in systems where vital signs are entered
manually, so EWS performance in fully automated
applicable

121
systems would need to be assessed. This study
acknowledges that human factors and clinical staff
perceptions of the patient’s condition may have an
influence on the data recorded. Thus, the replacement of a
manually entered parameter, such as respiratory rate, with
a parameter which is entered automatically may result in a
loss of information. The inclusion of staff concern, as a
parameter in an automated system, may help overcome
this shortfall.
Heal, M., Silvest-
Guerrero, S., &
Kohtz, C.
(2018)
United States
Design and
Development of a
Proactive Rapid
Response System
Quasi-experimental Capturing vital signs and manually entering into EMR
(method not described). (Only dedicated crisis nurse
aware of aggregate early warning score and response
protocol)
The wards involved in the study were similar and the
nursing staff worked across both units. At baseline, the
two wards had an equivalent patient population, staff to
patient ratio, patient numbers and RRT call rates.
Capturing vital signs and manually entering into EMR
(method not described). (Only dedicated crisis nurse
aware of aggregate early warning score and response
protocol)
In the intervention and control wards vital signs were
entered into the EMR of patients. Nurses working on both
wards were not aware of the vital sign parameters and
aggregate scores that would trigger a response.
Routine checking of early warning score on EMR to
detect deteriorating patients
On the intervention ward the EMR automatically
calculated the early warning score and a dedicated crisis
nurse was required to check and respond to any early
The study missed an
opportunity to determine
how proactive rounding vs
reactive rounding affects
length of stay after the
RRT is activated.
A new early warning
system was developed and
implemented on both the
intervention and control
ward. Nurses working on
both wards were not aware
of the vital sign parameters
and aggregate scores that
would trigger a response.
Only the crisis nurse knew
the vital sign parameters
and aggregate score that
would trigger a response.
The bedside nurses
escalated care based on
JBI MAStARI
100%
122
warning score of 3 or more every 4 hours. The EMR could
be viewed at any time from any location.
Response to patient deterioration
RRT calls
On the control ward the EMRs of those patients did not
automatically calculate the early warning score to report
triggers. Instead the bedside nurse was required to place a
call to the crisis nurse or RRT when they perceived a need.
Data was collected on both wards over 6 months.
Routine checking of early warning score on EMR to
detect deteriorating patients
RRT calls
On the intervention unit, the crisis nurse encountered 794
early warning scores that generated a trigger when
reviewing the EMR every 4 hours. The crisis nurse
assessed and/or sought further intervention in 412 of these
triggers to prevent further potential deterioration. On 132
occasions the RRT was activated on the intervention ward.
On the control unit staff activated the RRT 110 times.
Capturing vital signs and manually entering into EMR
(method not described). (Only dedicated crisis nurse
aware of aggregate early warning score and response
protocol)
Cardiac arrests
The difference in cardiopulmonary arrest rates between the
intervention and control wards did not reach clinical
significance, at one versus three respectively.
Capturing vital signs and manually entering into EMR
(method not described). (Only dedicated crisis nurse
aware of aggregate early warning score and response
protocol)
perceived need. Had the
bedside nurses in both
units been familiar with the
new EWS and escalation
protocol they may have
activated the RRT more
frequently.

123
The study identifies the potential role of nurses in EWSs.
The electronic alert on the EMR responded to by the crisis
nurse did not rely on the bedside nurse to recognise subtle
signs of patient deterioration and activate the RRT.
However, the response to patient deterioration in the
intervention ward was still dependent of the crisis nurse
reviewing the EMR every four hours. Real time clinical
alerts to dedicated RRT nurse’s mobile device
An automated alert sent to a crisis nurse’s mobile phone
could eliminate the potential of the crisis nurse missing
triggers on the EMR.
Fletcher, G.S.,
Aaronson, B.A.,
White, A.A. & Julka,
R.
(2018)
USA
Effect of a Real-Time
Electronic Dashboard
on a Rapid Response
System
Repeated treatment
design
Overview Screen (Real-time electronic dashboard)
The dashboard was updated as soon as vital signs were
entered which enabled the entire care team, including the
RRT, to rapidly identify patients with abnormal vital signs
who could trigger the RRT. The study evaluated the effect
of the dashboard on RRT activations, cardiopulmonary
arrests and unexpected ICU admissions and mortality. The
study used a repeated treatment design where the
dashboard was turned on for a week and then off for a
week and so on. This alternating exposure continued for
20weeks. On weeks where the dashboard was on it could
be used to activate the RRT, in addition to the traditional
method of the RRT being activated by the bedside nurse.
The intervention and control patients were similar in terms
of patient demographics, acute diagnosis and co-
morbidities.
Overview Screen (Real-time electronic dashboard)
RRT calls
Cardiac arrests
A strength associated with the
repeated treatment design is
that it enabled the examination
of the effect of the dashboard
on RRT activations in a real
life setting with a comparable
control group [20]. This type
of study has greater internal
validity than a pre-post study
designs as the influence of
confounders is less likely. The
limitations of this
randomization approach are
offset by basing the analysis
on the first alert to compensate
for spillover effects.
Although the study showed
that there was an increase
in initial RRT activations
the clinical benefit
associated with this was
not proved. There was no
significant reduction in
cardiopulmonary arrests
and unexpected ICU
admissions and mortality.
However due to the
infrequent nature of these
events the study was not
powered sufficiently to
determine these outcomes
and length or cost of
hospital stay may have
been better outcome
measures.
JBI MAStARI
Score 89%
Multiple measurement of
the outcome both pre and
post exposure difficult
with repeated treatment
design.
124
Mortality
The dashboard did not significantly reduce overall RRT
activations, cardiopulmonary arrests and unexpected ICU
admissions and mortality. There was a 20% increase in
first RRT activations, which was statistically significant,
but overall RRT activations did not increase. First RRT
activations were measured since it was hypothesised the
dashboard would draw attention to a deteriorating patient,
but after an initial RRT call the staff may likely be vigilant
to subsequent deterioration without relying on the
dashboard. The reason for this may have been that the
dashboard alerted the RRT to patients who met activation
criteria, but were not escalated. Alternatively, the
dashboard displayed patients from high to low early
earning scores and the RRT may have responded to
deteriorating patients with raised early warning scores
below the usual level for activation. The activation
threshold may have been lowered for the initial RRT
review, but subsequent RRT thresholds were maintained.
Real-time electronic dashboard
RRT Calls
The dashboard utilises real-time, population based data
displayed in the EMR to support clinical decision making
without the reliance on the bedside nurse to activate the
RRT.
Real-time electronic dashboard
Proactive vs reactive approach to deteriorating
patients
Situational awareness
Reduction in alert fatigue
The dashboard display which could be viewed
This was a single centre
study so the findings may
not be generalisable.
The study did not directly
measure if the RRT was
activated or if bedside
interventions were
instituted as a result of a
notification from the
dashboard. The time from
notification to activation of
the RRT was also not
measured.
Staff were not blinded to
the use of the dashboard
and knowing that they
were been observed may
have prompted them to
activate the RRT without
viewing the dashboard
scores.
A disadvantage associated
with the repeated treatment
design where the time
between crossover is short,
is spillover effects.
Measuring the first RRT
activation for a patient may
have compensated for this,
but it is possible that staff
awareness of a high

125
simultaneously by all members of the health care team,
including the RRT, encouraged a proactive, rather than
reactive approach to monitoring and reviewing patients at
risk. This mitigates the risk of bedside nurses not calling
the RRT for deteriorating patients. Additional benefits
associated with the dashboard was an increase in
situational awareness amongst all team members and a
reduction in alert fatigue, as the dashboard was designed to
be non-interruptive. When an elevated early warning score
generated an alert it was displayed on the dashboard, but
did not sound an alarm. The allows users to review the
information associated with the alert and respond without
interrupting their workflow. However non-interruptive
alerts can be ignored more easily, but since there was an
increase in first RRT activations in this study, it appears
this was not the case.
Overview Screen (real time electronic dashboard)
Trending of vital signs
Dedicated RRT nurse
The dashboard, ranking all acute patients in order of
severity, facilitated rapid assessment of the status of all
acute patients and identification of deteriorating trends
over time.
In this study, a full-time, dedicated RRT nurse was tasked
with monitoring the dashboard and managing deteriorating
patients. This may have reduced the chance of users
developing alert fatigue.
dashboard score during the
on period may have led to
them activating the RRT
during the following off
periods.
.
Mackintosh, N.,
Rainey, H. & Sandall,
J.
(2011)
Understanding how
rapid response systems
may improve safety
for the acutely ill
Ethnographic study
Capturing vital signs directly from observation
machine to EMR via a handheld Devices (PDA)
Vital signs were captured from observation machines to
the electronic medical record via a handheld personal
JBI QARI
Score 90%

126
United Kingdon
patient: learning from
the frontline
digital assistant.
On screen (advisory) warnings
The system calculated the early earning score
automatically displaying it on the PDA screen, together
with prompts advising when the next set of observations
are due and actions to take for high EWS scores according
to the hospital’s escalation protocol. All hospital staff
could view the electronic observation chart from any
location on the hospital’s intranet.
Documentation errors/accuracy
The electronic system had inbuilt safety prompts advising
when an incomplete set or “unlikely vital signs” were
entered. These prompts together with a record of who
entered the vital signs and flags assigned to overdue vital
signs improved the completeness of vital signs and
compliance with the EWS protocol. The electronic system
provided access to real-time vital signs and information
about the quality of recorded data and adherence to
protocol.
Timeliness of rechecking observations
The study found that although there was an overall
improvement in compliance to protocol, it remained
variable after implementation of the electronic system. The
percentage of vital signs recorded late still ranged from
30% to 70%. Managers, nursing staff and doctors
perceived that the electronic EWS made clinical practice
more reliable by automatically calculating the early
warning score and reducing the variations in the time
taken to repeat vital sign recordings.
Overview Screen (real time electronic dashboard)
The nurses and HCA’s reported that the electronic
Influence of the
researcher on the
research and via versa
not addressed

127
dashboard display of patients and their early
warning scores assisted them with sharing information,
planning and allocating workloads by glancing at the
dashboard.
Remote access to EWS
The ability to access the observation data from the EMR
remotely, along with other clinical data such as blood
results, enabled doctors to better understand the
deteriorating patient picture and “keep an eye” on patients
at risk without being physically present on the ward.
However, the study found that medical staff working in
wards not utilising the electronic system did not routinely
utilise the early warning scores as part of their assessment
or when handing over patient information. Interviews
conducted with the doctors substantiated this finding.
However, the fact that the hospital utilised more than one
EWS and did not have a clear escalation protocol may
have contributed to this.
Improved standardisation with the electronic system
Intuitive-experiential knowledge was acknowledged by a
number of senior nursing and medical staff to be a valid
element in detecting early deterioration. However, the
study found that the PDA used to record vital signs on
directed the users to follow a routine with every instance
of vital sign recording. On some occasions junior staff and
HCA’s in particular were so focussed on adhering to the
routine that they lost sight of other subtle or significant
signs of deterioration, such as increased restlessness or
chest tightness. On screen (advisory) warnings
Compliance to protocol
The study found that although compliance to protocol

128
greatly increased with prompts for escalating care
provided by the electronic system, fears of over reliance
on the EWS were expressed. The prompts provided by the
electronic system reduced the potentially beneficial
dialogue between staff regarding patient deterioration.
Equipment/hardware issues
With the electronic record, vital signs, early warning
scores and flags were “disconnected” from patients and
only accessible when staff logged in to retrieve the charts
and during busy times computers were not readily
available to do so.
Facilitation of data collection
The electronic system also facilitated the collection of data
for analysis and benchmarking performance, such as
completeness and timeliness of observations and
adherence to escalation protocol.
Yeung, M.S.,
Lapinsky, S.E.,
Granton, J.T., Doran,
D.M., Cafazzo, J.T.
(2012)
Toronto, Ontario
Examining nursing
vital signs
documentation
workflow: barriers and
opportunities in
general internal
medicine units
Qualitative
ethnographic
analyses and
quantitative time–
motion study were
conducted
Capturing vital signs on paper before writing into
EMR via bedside computer or workstation away from
patient’s room
Faster acquisition/documentation of vital signs
This study found that on average a nurse spent 12 minutes
recording vital signs. However, at the hospital using an
electronic system in which to document vital signs, it took
an average of 53.2 minutes before vital signs were
documented
Vital signs captured directly onto paper
compared to 17.2 minutes at the paper-based hospitals.
Capturing vital signs on paper before writing into the
EMR via bedside computers or remote computers
Faster acquisition/documentation of vital signs
In this study 66% of the recorded vital signs were
JBI QARI
Score: 80%
Influence of the
researcher on the
research and via versa
not addressed
There is no statement
locating the researcher
culturally and ethically

129
transcribed from one documentation medium to another.
The majority transcription instances occurred at the
hospital using the electronic documentation system where
vital signs were always transcribed onto interim paper
notes before being documented electronically. Only 47%
of the recorded vital signs were documented within one
minute of acquiring them. The remaining 53% of the vital
sign measurements were memorised for more than one
minute before they were documented. Vital signs were
memorised for the longest period before documentation in
the hospital where vital signs were documented
electronically leading to a delay in the communication of
critical patient information. This study found that the
clinical environment needs to support the documentation
system utilised. Vital sign documentation into the medical
record occurred more promptly when the patient’s chart or
documentation tool was located in a convenient location
for the nurse.
Vital signs captured directly onto paper
In this study fewer transcription instances occurred at the
paper-based hospitals where vital sign charts were
conveniently located at the patient’s bedside.
Capturing vital signs on paper before writing into the
EMR via bedside computers or remote computers
In the electronic-based hospital the documentation was not
conducive to vital sign documentation at the point of care
because the system required an extensive amount of
additional mandatory data to be entered. The time required
to do so deterred nurses from documenting directly into
the bedside or hallway computers were the ergonomics
were unfavourable. For security purposes the computers

130
were also locked in cabinets which needed to be unlocked
before nurses could access them and launch the vital sign
application. Nurses also chose not to use the bedside
computers due to perceived privacy concerns and
distractions like interruptions from patients and/or visitors,
noise or environmental odours. Computers at the central
nursing stations were also frequently occupied. These
challenges associated with vital sign documentation in this
study meant that nurses frequently wrote vital signs on
interim pieces of paper at the point-of-care and deferred
the documentation of vital signs in favour of more
imminent clinical tasks or until the end of their shifts.
Capturing vital signs on paper before writing into the
EMR via bedside computers or remote computers
Transcription errors
Transcription was common at the hospital using the
electronic documentation system. This increased the risk
of transcription errors, delayed the documentation of
critical patient information, duplicated the task of
documentation and may have contributed to gaps in the
recorded data.
Lang, A., Pinchin, J.,
Brown, M &
Sharples, S.
(2016)
United Kingdon
Report: Handheld
Technologies in the
Ward.
Evaluation using
observation and
interviews/focus
groups
Capturing vital signs directly from observation
machine to EMR via a handheld Devices (PDA)
On screen (advisory) warnings
More time spent interacting with patients and
colleagues
Less time interacting with paper charts etc.
After the electronic system was introduced medical and
nursing staff were observed spending more time visible to
patients, colleagues and visitors and less time in office
JBI QARI
Score 80%
Influence of the
researcher on the
research and via versa
not addressed

131
spaces. For nurses the time spent in the office decreased
from 40.8% to 16.2% and for doctors the time decreased
from 68.7% to 25.6%. Both doctors and nurses spent more
time with patients after the electronic system was
introduced. The time doctors spent with patients more than
doubled (2.9% to 7.3%). Collectively doctors and nurses
spent more time interacting with the handheld devices
(3.7% to 8.3% and 2.2% to 6.4% respectively). This time
increase was small compared to the time saved searching
for, looking in or writing in paper charts, using desktop
PC’s and talking on the phone. After the electronic system
was introduced the time nurses spent looking at and
writing in patient notes decreased from 36.2% to 22.3%
and 26.3% to 16.0% respectively.
The time spent searching for paperwork dropped from
4.9% to 3.1%.
These findings were reinforced by interview data where
the medical staff expressed that it appeared the electronic
system and handheld devices assisted with task and time
management and reduced the time spent searching for
people or information.
Accessibility of data.
Interview data revealed the following benefits associated
with the electronic system: Staff reported that the
electronic system and the ability to view patent
observations on handheld mobile devices improved
accessibility to patient observations and improved team
communication by fast tracking discussions about the care
of deteriorating patients.
The nurses also reported the accessibility of information
provided them with reassurance concerning the patient’s
There is no statement
locating the researcher
culturally and ethically

132
state of health.
Nursing staff also reported that the handheld devices
facilitated communication with patients and their relatives
as requests for information could be responded to without
having to locate colleagues or paper charts.
Medical staff also reported regularly accessing the system
to monitor the progress of patients they had treated. While
this was done for personal and clinical reassurance it may
be problematic if this practice interferes with work life
balance.
Allocation of workloads
Once use of the electronic system was established nurses
reported that the mobile devices were like personal tools
which allowed them to manage workloads and improved
situation awareness of patients’ status and team capacity.
Initials fears related to technology
When the electronic system was first introduced staff
reported that the technology increased their workload and
stress. This stress persisted when staff felt unsupported by
the Information technology (IT) help service and by the
lack of a sustainable procedure to provide feedback to IT.
In the initial stages of implementation nursing staff
reported that they felt the technology disempowered
nursing staff and allowed a “Big Brother” culture.
Remote access to EWS
The ability to access real time vital signs on handheld
mobile devices facilitated the ability for doctors to make
decisions and implement actions remotely.
On screen (advisory) warnings
Alarm fatigue
Nurses reported that onscreen alerts created alarm fatigue

133
and cognitive overload resulting in work arounds to turn
alarms off.
Disempowerment of nurses
Senior nurses expressed concern that nurses may become
over reliant on the electronic EWS and lose the ability to
detected patient deterioration through clinical assessment.
They also felt that the ability of staff to interpret electronic
early warning score parameters may be hampered by the
systems automated scoring. Nurses would also need to be
empowered to escalate care when there is a discrepancy
between the early warning score and staff concern based
on clinical expertise and judgement.
Technology/Hardware issues
A reliance on the electronic EWS may be problematic if
the technology infrastructure fails or if there are
insufficient personal devices to accommodate casual
nurses or student nurses. Access and permissions
Doctors expressed frustrations about policies which
restricted their access and permissions in the electronic
EWS causing disruptions to working practices. For
example, some electronic EWSs only allow consultants to
modify parameters although registrars work independently
within the system and only access advice from consultants
when required.
Lack of senior medical staff engagement
Both nursing and medical staff expressed frustration about
the lack of senior medical staff engagement with the new
electronic system and this was perceived as hindering team
communication around the use of the system. This lack of
buy in was also perceived as limiting the system in terms
of realising its potential benefits in practice.

134
Wong, D., Bonnici,
T., Knight, J.,
Morgan, L.,
Coombes, P. &
Watkinson, P.
(2015)
United Kingdom
SEND: a system for
electronic notification
and documentation of
vital sign observations
Post-
implementation
assessment
Capturing vital signs directly from observation
machine to EMR via a tablet computer and monitor
mounted to an observation machine
The SEND system was implemented on three pilot wards,
containing 59 beds in total, within a UK hospital. At the
time of the study the system had been in use for nine
months.
This study assessed the ability of the electronic system to
allow the documentation of vital signs as expected. The
acceptability of the system to users was also assessed
using a ten question Likert scale, 2 weeks after the
implementation of the system in the clinical area.
Positive patient identification (and staff)
In order to positively identify the user and the patient the
user had to scan their identification badge barcode to
access the vital signs screen. The user is then asked to scan
the patient’s identification wristband in order to eliminate
the possibility of vital signs being recorded against the
wrong patient.
Capturing vital signs directly from observation
machine to EMR via a tablet computer and monitor
mounted to an observation machine
After entering the vital signs into a PDA the early warning
score is calculated automatically and the observation data
is simultaneously exported the patient’s EMR.
On screen (advisory) warnings
Once the vital signs have been saved, onscreen advice
relevant to the current early warning score is provided.
Overview Screen
The system also provides for a patient overview screen
which allows nurses to easily see a list of all the patients
Only 65 of the 111
identified users completed
the feedback forms.
Feedback forms which
were sent out electronically
and via paper. An email
reminder was sent to
complete the forms but the
paper version was not
resent. Staff averse to
technology may have been
more inclined to complete
the paper feedback form
and they were not sent a
reminder. The addition of
further feedback may have
altered the results.
This study showed
qualitative acceptance of
the system, but it’s
quantitative effect on
clinical care was not
evaluated.
JBI Notari
100%

135
on the ward and their current early warning score in a
descending order from highest to lowest early warning
score. This will facilitate switching between multiple
patients’ observation charts which will be useful during
doctors’ ward rounds and nurses’ handovers and will also
assist with the immediate recognition of patients with
abnormal vital signs. Secondary sorting is also supported
if a user wants to use different parameters to sort patients,
for example time since last observations.
Usability/ acceptability of electronic EWS
Over 9 months 21,316 sets of vital signs were recorded
and the system had 111 users indicating that the system
was being used to record routine vital signs.
User acceptability of the system was high as indicated by
the System Usability Scale score of 77.8 (all scores above
68 are considered above average). Of the 111 users, 65
returned completed feedback forms which were sent out
electronically and via paper. Clinical users’ perception of
the training received prior to the send application being
implemented was also assessed. 95.3% (62 of 65 users)
indicated that they had been taught how to use the system.
4.8% of those said the training was “not enough”, 95.2%
said it was “just right” and no-one said it was too much.
The SEND system appears to be well accepted by staff
with system usability scores ranging from 3.9/5 to 4.3/5.

136
Appendix D Table of excluded literature
Author Year Country Title Reasons for exclusion
Guay, C.,
Murphree, P. &
Steele-Moses, S.
2011 Los Angeles Developing an
automated RRT trigger
The study did not meet the quality
appraisal cut off of 70%. JBI MAStARI
Score 66.6%.
No control group.
Not sure if participants included in any
comparisons were similar
Not sure if participants included in any
comparisons received similar
treatment/care other than exposure or
intervention of interest
Kollef, H.K.,
Chen, Y., Heard,
K., LaRossa,
G.N., Lu, C.L.,
Martin, N.R.,
Martin, N.,
Micek, S.T. &
Bailey, T.
2014 Missouri Randomized Trial of
Real-Time Automated
Clinical Deterioration
Alerts
Sent to a Rapid
Response Team
This study did not meet the
inclusion criteria because in
addition to manually obtained vital
signs a number of other variables,
such as laboratory and pharmacy
data, were required to determine the
early warning score.