Early warning system
13
Design and implementation of a landslide early warning system Emanuele Intrieri ⁎, Giovanni Gigli, Francesco Mugnai, Riccardo Fanti, Nicola Casagli University of Firenze, Firenze, Italy abstract article info Article history: Received 7 April 2011 Received in revised form 28 May 2012 Accepted 24 July 2012 Available online 3 August 2012 Keywords: Landslide Early warning system Risk management Wireless sensor network Ground-based interferometric radar Monitoring In this paper all the phases for the realization of the early warning system for the rockslide of Torgiovannetto in Central Italy are described. The landslide consists in a 182,000 m 3 rock wedge threatening two roads which are important for local transportation. The present work encompasses all the components of an early warning system, including the geological knowledge, the risk scenarios, the kinematic characterization of the landslide, the choice and installation of the monitoring system, the setting of appropriate alarm levels and the definition of plans of civil protection. The focus is on practical and logistical issues met in all these phases and the counter-measures adopted. At present the system consists in 13 wire extensometers, 1 thermometer, 1 rain gauge and 3 cameras. Should a velocity threshold be exceeded by two or more sensors, the attention level would be entered, causing improved monitoring and surveillance. In case the behavior of the landslide changes and, by using expert judgment and forecasting methods, an imminent failure is hinted, then an alarm is issued and the upper road is closed. This paper can provide ideas and solutions for a landslide early warning system that aims to be simple, flexible, versatile and with a low probability of giving false alarms. © 2012 Elsevier B.V. All rights reserved. 1. Introduction In landslide prone areas, risk mitigation must often face problems related to economical resources, environmental impact and logistic issues. This is particularly true for structural counter-measures, which aim at mitigating the risk by reducing the probability of failure (bolts, anchors, piles etc.), by preventing the landslide from reaching the elements at risk (barriers, ditches, retaining walls etc.) or by reinforcing existing buildings. On the other hand, early warning systems (EWSs) are an alternative cost-effective means to reduce the risk with a low environmental and economical impact. In some cases, for instance when a landslide is so large that it cannot possibly be stabilized, they can even be the only solution. Several definitions of EWS can be found in the literature. Medina-Cetina and Nadim (2008) define them as “monitoring devices designed to avoid, or at least to minimize the impact imposed by a threat on humans, damage to property, the environment, or/and to more basic elements like livelihoods.” According to United Nations In- ternational Strategy for Disaster Reduction (UNISDR, 2009) they are “the set of capacities needed to generate and disseminate timely and meaningful warning information to enable individuals, communities and organizations threatened by a hazard to prepare and to act appro- priately and in sufficient time to reduce the possibility of harm or loss.” Whatever the definition, EWSs always work as risk mitigation tools by acting on the exposure of the elements at risk, especially people, by keeping them away from the dangerous area in case of expectation of an imminent collapse. However it must be clear that an EWS is not just a cluster of monitoring systems or the forecast of failure, but it also involves other aspects such as the identification of risk scenarios, emergency plans, societal considerations, public awareness, etc. Each one of these components is necessary; if any element fails, the whole chain would collapse and would render the system useless. For example, a lack in the monitoring or forecasting can cause a missing event or conversely a false alarm and the consequent loss of confidence in the system. On the other hand, a bad planned evacuation can produce damages and economic losses; this explains why redundancy is so important, so that a single rupture of a chain's ring should not com- promise the whole chain. Indeed an efficient EWS should comprise the following activities (DiBiagio and Kjekstad, 2007): • monitoring, including data acquisition, transmission and mainte- nance of the instruments; • analysis and forecasting, which can be done by using thresholds, expert judgment, forecasting methods and so on; • warning, i.e. the dissemination of understandable messages alerting for the impending threat; • response, concerning if people are able to understand and how they react to the warning. Engineering Geology 147–148 (2012) 124–136 ⁎ Corresponding author. E-mail address: [email protected] (E. Intrieri). 0013-7952/$ – see front matter © 2012 Elsevier B.V. All rights reserved. http://dx.doi.org/10.1016/j.enggeo.2012.07.017 Contents lists available at SciVerse ScienceDirect Engineering Geology journal homepage: www.elsevier.com/locate/enggeo
Transcript of Early warning system
Engineering Geology 147–148 (2012) 124–136
Contents lists available at SciVerse ScienceDirect
Engineering Geology
j ourna l homepage: www.e lsev ie r .com/ locate /enggeo
Design and implementation of a landslide early warning system
Emanuele Intrieri ⁎, Giovanni Gigli, Francesco Mugnai, Riccardo Fanti, Nicola CasagliUniversity of Firenze, Firenze, Italy
⁎ Corresponding author.E-mail address: [email protected] (E. Int
0013-7952/$ – see front matter © 2012 Elsevier B.V. Allhttp://dx.doi.org/10.1016/j.enggeo.2012.07.017
a b s t r a c t
a r t i c l e i n f oArticle history:Received 7 April 2011Received in revised form 28 May 2012Accepted 24 July 2012Available online 3 August 2012
Keywords:LandslideEarly warning systemRisk managementWireless sensor networkGround-based interferometric radarMonitoring
In this paper all the phases for the realization of the early warning system for the rockslide of Torgiovannettoin Central Italy are described. The landslide consists in a 182,000 m3 rock wedge threatening two roadswhich are important for local transportation. The present work encompasses all the components of anearly warning system, including the geological knowledge, the risk scenarios, the kinematic characterizationof the landslide, the choice and installation of the monitoring system, the setting of appropriate alarm levelsand the definition of plans of civil protection. The focus is on practical and logistical issues met in all thesephases and the counter-measures adopted.At present the system consists in 13 wire extensometers, 1 thermometer, 1 rain gauge and 3 cameras. Shoulda velocity threshold be exceeded by two or more sensors, the attention level would be entered, causingimproved monitoring and surveillance. In case the behavior of the landslide changes and, by using expertjudgment and forecasting methods, an imminent failure is hinted, then an alarm is issued and the upperroad is closed.This paper can provide ideas and solutions for a landslide early warning system that aims to be simple, flexible,versatile and with a low probability of giving false alarms.
© 2012 Elsevier B.V. All rights reserved.
1. Introduction
In landslide prone areas, risk mitigation must often face problemsrelated to economical resources, environmental impact and logisticissues. This is particularly true for structural counter-measures, whichaim at mitigating the risk by reducing the probability of failure (bolts,anchors, piles etc.), by preventing the landslide from reaching theelements at risk (barriers, ditches, retainingwalls etc.) or by reinforcingexisting buildings. On the other hand, early warning systems (EWSs)are an alternative cost-effective means to reduce the risk with a lowenvironmental and economical impact. In some cases, for instancewhen a landslide is so large that it cannot possibly be stabilized, theycan even be the only solution.
Several definitions of EWS can be found in the literature.Medina-Cetina and Nadim (2008) define them as “monitoring devicesdesigned to avoid, or at least to minimize the impact imposed by athreat on humans, damage to property, the environment, or/and tomore basic elements like livelihoods.” According to United Nations In-ternational Strategy for Disaster Reduction (UNISDR, 2009) they are“the set of capacities needed to generate and disseminate timely andmeaningful warning information to enable individuals, communitiesand organizations threatened by a hazard to prepare and to act appro-priately and in sufficient time to reduce the possibility of harm or loss.”
rieri).
rights reserved.
Whatever the definition, EWSs always work as risk mitigationtools by acting on the exposure of the elements at risk, especiallypeople, by keeping them away from the dangerous area in case ofexpectation of an imminent collapse.
However it must be clear that an EWS is not just a cluster ofmonitoring systems or the forecast of failure, but it also involvesother aspects such as the identification of risk scenarios, emergencyplans, societal considerations, public awareness, etc. Each one ofthese components is necessary; if any element fails, the whole chainwould collapse and would render the system useless. For example, alack in the monitoring or forecasting can cause a missing event orconversely a false alarm and the consequent loss of confidence inthe system. On the other hand, a bad planned evacuation can producedamages and economic losses; this explains why redundancy is soimportant, so that a single rupture of a chain's ring should not com-promise the whole chain.
Indeed an efficient EWS should comprise the following activities(DiBiagio and Kjekstad, 2007):
• monitoring, including data acquisition, transmission and mainte-nance of the instruments;
• analysis and forecasting, which can be done by using thresholds,expert judgment, forecasting methods and so on;
• warning, i.e. the dissemination of understandable messages alertingfor the impending threat;
• response, concerning if people are able to understand and how theyreact to the warning.

125E. Intrieri et al. / Engineering Geology 147–148 (2012) 124–136
Beside these activities, the International Early Warning Programme(IEWP, 2008) also includes the risk knowledge. This probably repre-sents the first fundamental step for the design of every EWS, since athorough geological and geomechanical knowledge is necessary inorder to identify the most critical parameters to be monitored. In addi-tion, an EWSmust take into account factors such as the elements at risk,the hazards, the vulnerabilities, the lead time, the residual risk andmany other precious information that can only come from in depthstudies and risk assessments.
By joining the two previous definitions, the scheme of activitiespresented in Fig. 1 can be obtained.
Of all these components the one representing the major constraintfor the effectiveness of an EWS is probably the response of people,i.e. how they will react to the alarm. In order to answer this question,preparedness training of the public must be considered within anEWS, otherwise even the most sophisticated monitoring system canfail, as happened for instance for the EWS at San Francisco Bay(Keefer et al., 1987; Wilson, 2004).
An excellent example of how to face this social issue is reportedin Mak et al. (2007) where a detailed description of the awarenesscampaigns adopted for the EWS in use in Hong Kong (Pang et al.,2000; Yu et al., 2004) is given. Moreover a correct education of thepopulation is by far the most cost-effective means of reducing therisk.
Finally it is worth remembering that at present there is no EWSvalid for all cases; in fact every EWS must be designed purposely fora specific site. For instance the precursors and monitored parametersmay largely vary depending on the type of landslide (Lacasse andNadim, 2009).
Beside the cases presented above,many other examples of this hugevariability can be found in the literature from all over the world (Froeseet al., 2006; Stucky, 2007; Blikra, 2008; Badoux et al., 2009).
In this paper the detailed design and implementation of an EWSinstalled at the Torgiovannetto landslide is described. Consideringthat the early warning approach is more and more used and often ref-erences and detailed methodologies are lacking, this work can giveuseful suggestions for other similar cases.
EmergeEmergen
Geological risk sc
Installatimonitorin
Data ac
Are daspecified
Are anomto instrum
Issue an alarm
Emergenc
YES
NO
NO
RISK KNOWLEDGE
MONITORING
ANALYSIS ANDFORECASTING
WARNING
RESPONSE
Fig. 1. Flow chart of the activities ofModified from DiBiagio and Kjekstad
2. The Torgiovannetto landslide
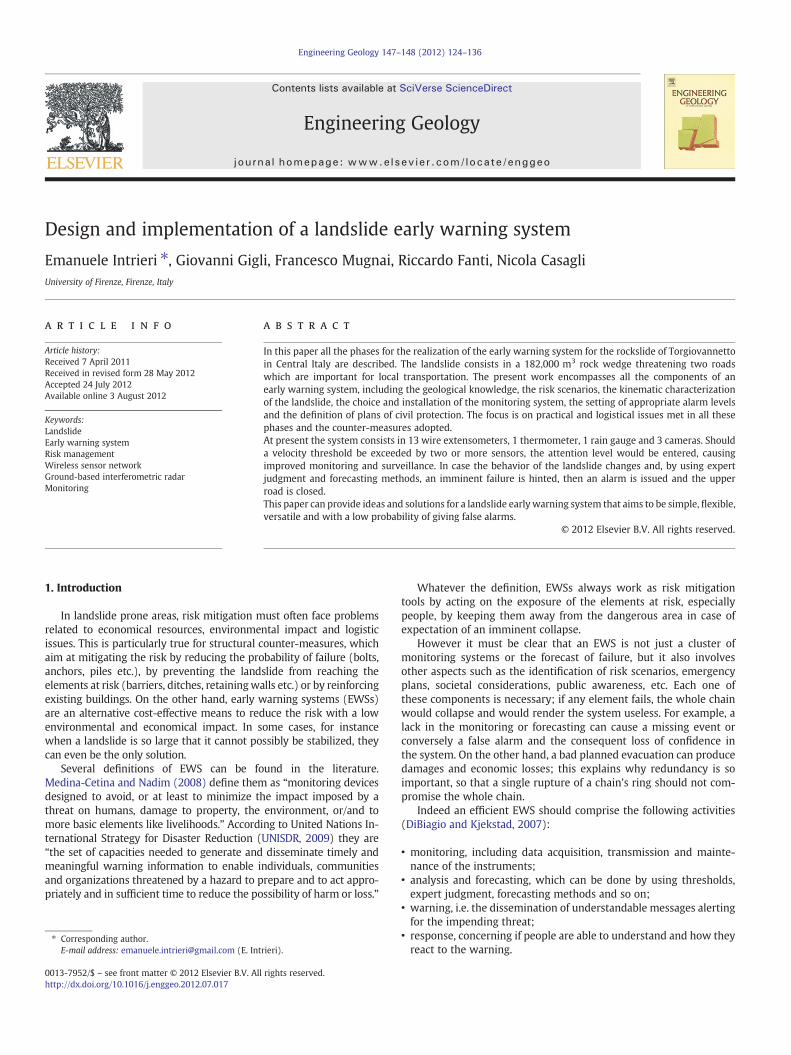
The landslide is located in a former quarry on the southwardfacing slope of Mount Subasio, 2 km NE from the city of Assisi (Perugia,Umbria Region, Central Italy, Figure 2). It was first observed on May2003 and it is assured that themain predisposing factor of the instabilitywas the quarrying activity.
Mount Subasio is part of the Umbria-Marche Apennines, whosegeological formations represent the progressive sinking of a marineenvironment. It consists in a SSE-NNW trending anticline (Lavecchiaet al., 1988; Tavarnelli, 1997; Mirabella and Pucci, 2002) with layersdipping almost vertically in the NE side of the mountain and with sev-eral NW-SE striking normal faults on the eastern and western flanks.
In the quarry area only the micritic limestone belonging to theMaiolica formation (Upper Jurassic–Lower Cretaceous) outcrops.The average thickness of the layers ranges between 10 cm and 1 mand, sporadically, thin clay interlayers may occur. The dip directionand the dip may vary respectively from 350° to 5° and from 25° to35°, which means that, in general, the layers dip in the same directionof the slope but with a gentler angle (Figure 3).
The landslide, classified as a rockslide (Cruden and Varnes, 1996),has a rough trapezoidal shape. The sub-vertical back fracture is a tensioncrack with an E-W strike, which in some places displays a width up to2 m (Figure 4). The downhill boundary, associated to a major clayinterbed, is represented by a stratigraphic layer (355°/24°) that acts assliding surface and cuts obliquely the quarry front. which is associatedto a major clay interbed. The western side of the landslide isun-continuously delimited by persistent fractures belonging to asub-vertical set having an N–S strike (Figure 5A).
The whole moving mass has an estimated volume of 182,000 m3
(Canuti et al., 2006), and is represented in 3D in Fig. 6, where theorientations of the main delimiting planes are also reported in stereo-graphic projection.
Two main elements at risk are individuated: the Provincial Road249/1 and the Regional Road 444 (Figure 2). These roads are very im-portant, since they are the only connection between the city of Assisiand the surrounding towns.
ncy planscy plans
knowledge,enarios
on of theg system
quisition
ta within bounds?
alies dueental error?
or pre-alarm
y plans
Troubleshootingand maintenance
YES
a generic early warning system.(2007).
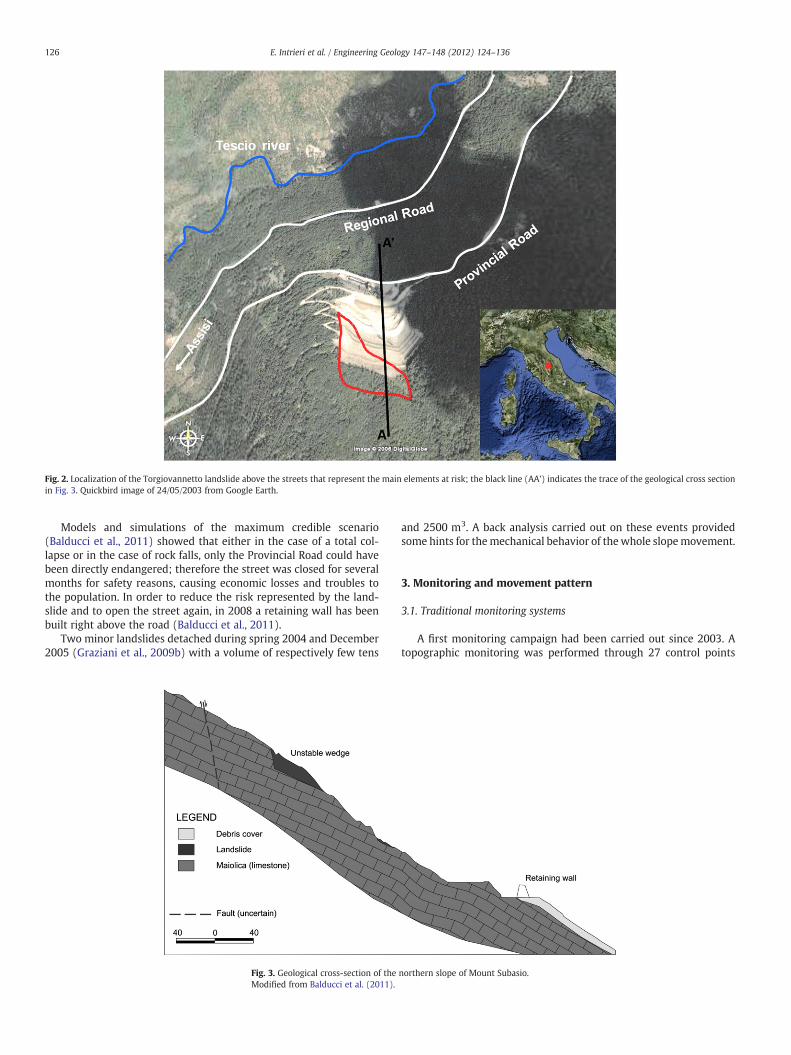
Fig. 2. Localization of the Torgiovannetto landslide above the streets that represent the main elements at risk; the black line (AA’) indicates the trace of the geological cross sectionin Fig. 3. Quickbird image of 24/05/2003 from Google Earth.
126 E. Intrieri et al. / Engineering Geology 147–148 (2012) 124–136
Models and simulations of the maximum credible scenario(Balducci et al., 2011) showed that either in the case of a total col-lapse or in the case of rock falls, only the Provincial Road could havebeen directly endangered; therefore the street was closed for severalmonths for safety reasons, causing economic losses and troubles tothe population. In order to reduce the risk represented by the land-slide and to open the street again, in 2008 a retaining wall has beenbuilt right above the road (Balducci et al., 2011).
Two minor landslides detached during spring 2004 and December2005 (Graziani et al., 2009b) with a volume of respectively few tens
Fig. 3. Geological cross-section of theModified from Balducci et al. (2011).
and 2500 m3. A back analysis carried out on these events providedsome hints for themechanical behavior of the whole slopemovement.
3. Monitoring and movement pattern
3.1. Traditional monitoring systems
A first monitoring campaign had been carried out since 2003. Atopographic monitoring was performed through 27 control points
northern slope of Mount Subasio.

Fig. 4. Photograph of the Torgiovannetto landslide and details of the sliding surface and of the tension crack on the rear side.
Fig. 5. A: Location of the extensometers installed at the Torgiovannetto landslide. The main fractures are also shown. B: Schematic view of the monitoring system.
127E. Intrieri et al. / Engineering Geology 147–148 (2012) 124–136
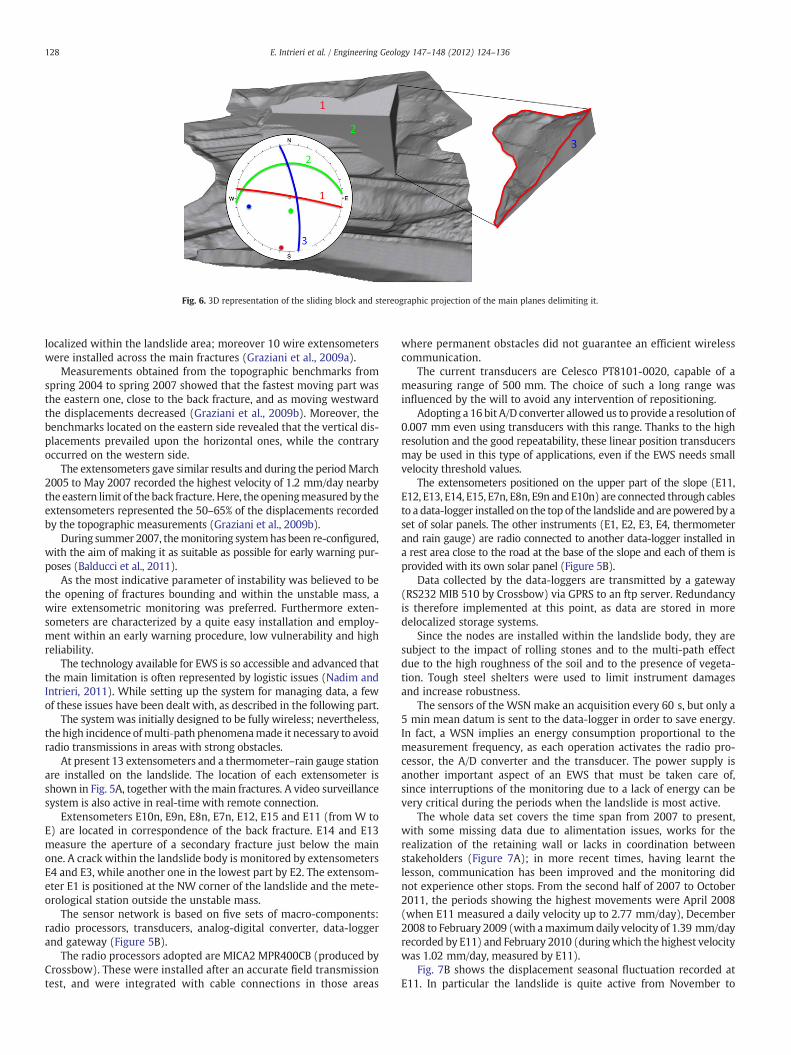
Fig. 6. 3D representation of the sliding block and stereographic projection of the main planes delimiting it.
128 E. Intrieri et al. / Engineering Geology 147–148 (2012) 124–136
localized within the landslide area; moreover 10 wire extensometerswere installed across the main fractures (Graziani et al., 2009a).
Measurements obtained from the topographic benchmarks fromspring 2004 to spring 2007 showed that the fastest moving part wasthe eastern one, close to the back fracture, and as moving westwardthe displacements decreased (Graziani et al., 2009b). Moreover, thebenchmarks located on the eastern side revealed that the vertical dis-placements prevailed upon the horizontal ones, while the contraryoccurred on the western side.
The extensometers gave similar results and during the periodMarch2005 to May 2007 recorded the highest velocity of 1.2 mm/day nearbythe eastern limit of the back fracture. Here, the openingmeasured by theextensometers represented the 50–65% of the displacements recordedby the topographic measurements (Graziani et al., 2009b).
During summer 2007, themonitoring systemhas been re-configured,with the aim of making it as suitable as possible for early warning pur-poses (Balducci et al., 2011).
As the most indicative parameter of instability was believed to bethe opening of fractures bounding and within the unstable mass, awire extensometric monitoring was preferred. Furthermore exten-someters are characterized by a quite easy installation and employ-ment within an early warning procedure, low vulnerability and highreliability.
The technology available for EWS is so accessible and advanced thatthe main limitation is often represented by logistic issues (Nadim andIntrieri, 2011). While setting up the system for managing data, a fewof these issues have been dealt with, as described in the following part.
The system was initially designed to be fully wireless; nevertheless,the high incidence ofmulti‐path phenomenamade it necessary to avoidradio transmissions in areas with strong obstacles.
At present 13 extensometers and a thermometer–rain gauge stationare installed on the landslide. The location of each extensometer isshown in Fig. 5A, together with themain fractures. A video surveillancesystem is also active in real-time with remote connection.
Extensometers E10n, E9n, E8n, E7n, E12, E15 and E11 (from W toE) are located in correspondence of the back fracture. E14 and E13measure the aperture of a secondary fracture just below the mainone. A crack within the landslide body is monitored by extensometersE4 and E3, while another one in the lowest part by E2. The extensom-eter E1 is positioned at the NW corner of the landslide and the mete-orological station outside the unstable mass.
The sensor network is based on five sets of macro-components:radio processors, transducers, analog-digital converter, data-loggerand gateway (Figure 5B).
The radio processors adopted are MICA2 MPR400CB (produced byCrossbow). These were installed after an accurate field transmissiontest, and were integrated with cable connections in those areas
where permanent obstacles did not guarantee an efficient wirelesscommunication.
The current transducers are Celesco PT8101-0020, capable of ameasuring range of 500 mm. The choice of such a long range wasinfluenced by the will to avoid any intervention of repositioning.
Adopting a 16 bit A/D converter allowed us to provide a resolution of0.007 mm even using transducers with this range. Thanks to the highresolution and the good repeatability, these linear position transducersmay be used in this type of applications, even if the EWS needs smallvelocity threshold values.
The extensometers positioned on the upper part of the slope (E11,E12, E13, E14, E15, E7n, E8n, E9n and E10n) are connected through cablesto a data-logger installed on the top of the landslide and are powered by aset of solar panels. The other instruments (E1, E2, E3, E4, thermometerand rain gauge) are radio connected to another data-logger installed ina rest area close to the road at the base of the slope and each of them isprovided with its own solar panel (Figure 5B).
Data collected by the data-loggers are transmitted by a gateway(RS232 MIB 510 by Crossbow) via GPRS to an ftp server. Redundancyis therefore implemented at this point, as data are stored in moredelocalized storage systems.
Since the nodes are installed within the landslide body, they aresubject to the impact of rolling stones and to the multi-path effectdue to the high roughness of the soil and to the presence of vegeta-tion. Tough steel shelters were used to limit instrument damagesand increase robustness.
The sensors of the WSN make an acquisition every 60 s, but only a5 min mean datum is sent to the data-logger in order to save energy.In fact, a WSN implies an energy consumption proportional to themeasurement frequency, as each operation activates the radio pro-cessor, the A/D converter and the transducer. The power supply isanother important aspect of an EWS that must be taken care of,since interruptions of the monitoring due to a lack of energy can bevery critical during the periods when the landslide is most active.
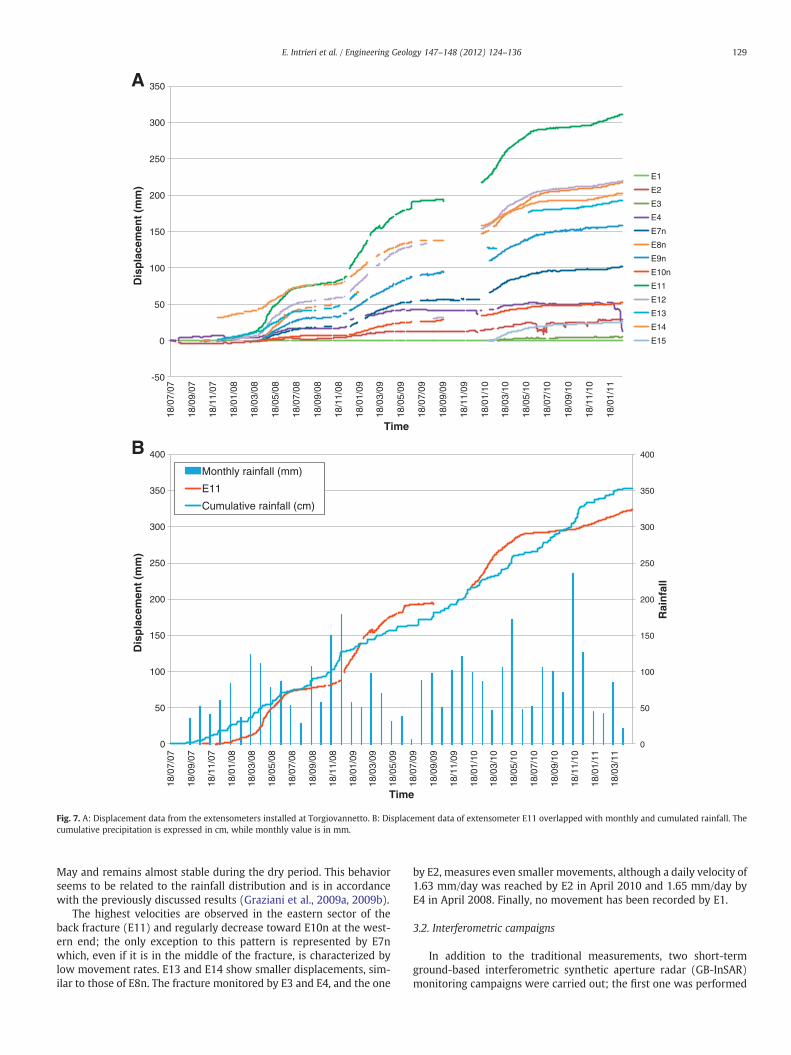
The whole data set covers the time span from 2007 to present,with some missing data due to alimentation issues, works for therealization of the retaining wall or lacks in coordination betweenstakeholders (Figure 7A); in more recent times, having learnt thelesson, communication has been improved and the monitoring didnot experience other stops. From the second half of 2007 to October2011, the periods showing the highest movements were April 2008(when E11 measured a daily velocity up to 2.77 mm/day), December2008 to February 2009 (with amaximumdaily velocity of 1.39 mm/dayrecorded by E11) and February 2010 (duringwhich the highest velocitywas 1.02 mm/day, measured by E11).
Fig. 7B shows the displacement seasonal fluctuation recorded atE11. In particular the landslide is quite active from November to
-50
0
50
100
150
200
250
300
350
18/0
7/07
18/0
9/07
18/1
1/07
18/0
1/08
18/0
3/08
18/0
5/08
18/0
7/08
18/0
9/08
18/1
1/08
18/0
1/09
18/0
3/09
18/0
5/09
18/0
7/09
18/0
9/09
18/1
1/09
18/0
1/10
18/0
3/10
18/0
5/10
18/0
7/10
18/0
9/10
18/1
1/10
18/0
1/11
Dis
pla
cem
ent
(mm
)
Time
E1
E2
E3
E4
E7n
E8n
E9n
E10n
E11
E12
E13
E14
E15
0
50
100
150
200
250
300
350
400
0
50
100
150
200
250
300
350
400
18/0
7/07
18/0
9/07
18/1
1/07
18/0
1/08
18/0
3/08
18/0
5/08
18/0
7/08
18/0
9/08
18/1
1/08
18/0
1/09
18/0
3/09
18/0
5/09
18/0
7/09
18/0
9/09
18/1
1/09
18/0
1/10
18/0
3/10
18/0
5/10
18/0
7/10
18/0
9/10
18/1
1/10
18/0
1/11
18/0
3/11
Rai
nfa
ll
Dis
pla
cem
ent
(mm
)
Time
Monthly rainfall (mm)
E11
Cumulative rainfall (cm)
B
A
Fig. 7. A: Displacement data from the extensometers installed at Torgiovannetto. B: Displacement data of extensometer E11 overlapped with monthly and cumulated rainfall. Thecumulative precipitation is expressed in cm, while monthly value is in mm.
129E. Intrieri et al. / Engineering Geology 147–148 (2012) 124–136
May and remains almost stable during the dry period. This behaviorseems to be related to the rainfall distribution and is in accordancewith the previously discussed results (Graziani et al., 2009a, 2009b).
The highest velocities are observed in the eastern sector of theback fracture (E11) and regularly decrease toward E10n at the west-ern end; the only exception to this pattern is represented by E7nwhich, even if it is in the middle of the fracture, is characterized bylow movement rates. E13 and E14 show smaller displacements, sim-ilar to those of E8n. The fracture monitored by E3 and E4, and the one
by E2, measures even smaller movements, although a daily velocity of1.63 mm/day was reached by E2 in April 2010 and 1.65 mm/day byE4 in April 2008. Finally, no movement has been recorded by E1.
3.2. Interferometric campaigns
In addition to the traditional measurements, two short-termground-based interferometric synthetic aperture radar (GB-InSAR)monitoring campaigns were carried out; the first one was performed

130 E. Intrieri et al. / Engineering Geology 147–148 (2012) 124–136
in collaboration with LiSALab-Ellegi from March 29th to April 14th2006. In 2008 Ingegneria Dei Sistemi (IDS) society wanted to testsome features of their new-born system (called IBIS-L) on a landslideand asked the authors for a suitable test-site. In authors’ opinion thisrepresented a good chance to verify the conditions of the landslideafter the last campaign; moreover the use of these two differentsystems (which are the first and probably the most used GB-InSARapparatuses in the world) is by itself an added value since this isthe only documented case study (to the best of author's knowledge)where both radar have been employed. Therefore a second interfero-metric campaign was carried out from April 11th to April 18th 2008.
It should be noted that the aim of these campaigns was to definethe deformation field of the landslide and to assess its precise bound-aries, in order to calculate its volume, fundamental for building areliable kinematic model and risk scenarios (Balducci et al., 2011).Hence the role of the GB-InSAR within the EWS was restricted togaining a deeper insight of the landslide behavior and of the associatedrisk.
The radar systems adopted are different but share the same basicprinciples (Rudolf et al., 1999; Luzi et al., 2004): two microwave sig-nals are emitted in two different times; the waves reach the target(e.g. the landslide) and are backscattered to the radar, where theiramplitude and phase are measured. Should any movement occur be-tween the two acquisitions, a phase difference is measured. Thenfrom the phase difference it is possible to calculate the actual superfi-cial displacement along the line of sight with millimeter accuracy. Ifthe radar acquires data while moving along a rail (Synthetic ApertureRadar) displacement maps can be computed. Many applications ofthis technique to monitoring of unstable slopes can be found in theliterature (Atzeni et al., 2001; Barla et al., 2010; Casagli et al., 2010).
The only true difference between the two apparatuses adopted atTorgiovannetto lies in the microwave signal generation (IBIS-L usesan industrialized method derived from a prototype developed incollaboration with the Department of Electronics of the Universityof Firenze, while the LiSA device is based on a Network Analyzer),in the length of the rail (which resulted in a slightly higher azimuthresolution for the first campaign), in the gain of the antennas (resultingin a slightly different field of view) and in the software adopted for dataelaboration. However, in the end, both systems operate in Kuband,withthe same bandwidth and polarization. Moreover they were installedexactly in the same position, above a concrete block that was purposelybuilt, in order to share the same scenery and line of sight. All of thismeans that the two datasets are perfectly comparable.
The traditional monitoring showed that April generally was themonth during which the highest velocities were reached. For this rea-son both interferometric campaigns were carried out in this period, inorder to assess the landslide behavior during the most active month.This was also done in an EWS perspective to evaluate the maximumrisk scenario and to define reliable velocity thresholds.
A comparison with an optical image (Figure 4) is useful to correctlyinterpret the velocity maps presented in Figs. 8 and 9.
The whole moving area is clearly detectable, with the exception ofthe vegetated sector above the anthropic cut; in fact, the surroundingzones (in blue) are completely stable. The fastest moving portion isthe one at the left (eastern) side, corresponding to the red region,where the average velocity, calculated by analyzing radar data fromMarch 29th to April 14th 2006, is around 1.5 mm/day (Figure 8).This value is underestimated by 5% in consideration of the drift be-tween radar line of sight and the maximum movement vector de-tected by ground instruments. The velocity decreases while movingtoward the up-right corner (SE) and reaches the minimum nearbythe green-blue area (0.4 mm/day). Downhill, all along the basal dis-continuity, the velocity ranges from almost 1.3 mm/day in the orangezone to almost 0.8 mm/day in the middle, while in the right-downcorner it reaches 0.9 mm/day. Along the downhill boundary, a thingreen line (0.4 mm/day) bordering the landslide can also be noted
(Figure 8). It corresponds to a sector which marks a transition be-tween the stable area (below the sliding surface) and the movingwedge and is mainly composed of the clay interbed (Figure 4) alongwhich the movement occurs.
The velocity of each sector remained almost the same along thewhole duration of the campaign, witnessing a linear deformationwith time.
A comparison with the 2008 campaign (Figure 9) shows that thegeometry and kinematics of the landslide remained almost the sameduring 2 years, with some minor differences. The trapezoidal shapeis unchanged, meaning that the mass movement did not extend toconcern other areas of the rock mass. It is still evident that the fastestmoving part is the eastern corner, with decreasing velocities as movingtoward W.
With respect to 2006, the values have slightly changed but donot modify the general movement pattern: the slowest sector is stillthe SW corner which, during the campaign, displayed on average0.3 mm/day; as in the previous campaign, the E corner recorded thehighest displacement and reached an average velocity of 1.4 mm/day,while the downhill part of the landslide, close to the lower boundary,was still characterized by intermediate values.
The occurrence of rain events during this campaign did not seem-ingly affect the landslide behavior, at least in a short term.
The results from the interferometric campaigns confirm and com-plete the general picture and pattern deformation furnished by thetraditional instrumentation. Even the average velocity values ofeach zone are confirmed, and minor differences are due to the ab-sence of interferometric data exactly on the points where extensom-eters are installed and to the fact that the radar measures absolutedisplacements of each pixel area (comprehending the contributionof many fractures) while the extensometers determine the relativeaperture of a single fracture. Finally it is also caused by the differentdirections of measure (along the line of sight and along the wire di-rection for the GB-InSAR and the extensometers, respectively).
3.3. Rockslide kinematics
All the monitoring systems employed and the field surveys sug-gest a rock slide mechanism with a planar surface along a beddingplane associated to a major clay interbed that cuts the quarry face(Figure 3).
However, the inhomogeneous deformational field suggests acounter-clockwise rotation of the wedge (in plan), with the highestdisplacements recorded along the eastern side of the moving mass.The displacement variation along a longitudinal profile for bothcampaigns shows a generally linear behavior (Figures 8 and 9),suggesting that a single movement affects the individuated blockas a whole; the differential behavior can be explained by the shearstrength caused by the western lateral crack, not fully developed yet(Figure 5A), as confirmed by the stability analysis (Graziani et al.,2009a; Balducci et al., 2011).
These evidences are supported by the asymmetric development ofsecondary fractures within the unstable wedge (Figure 5A), wherethe presence, in the eastern portion, of major internal cracks parallelto the rear one can explain the different behavior between the easternand western sectors.
Fig. 9 also compares the velocity map obtained from the2008 GB-InSAR campaign with the results from the extensometricmeasurements acquired during the same period. The circles indicatethe extensometers, represented on the basis of the recorded opening,using the same color bar as the velocity map. Furthermore, theirvalues have been projected along the radar line of sight, by consider-ing the local wire direction of each instrument.
It can be assessed that, in general, there is a good correlation be-tween the readings, although the extensometers appear to give smallervalues than the radar. This is due to several factors; themain one is that
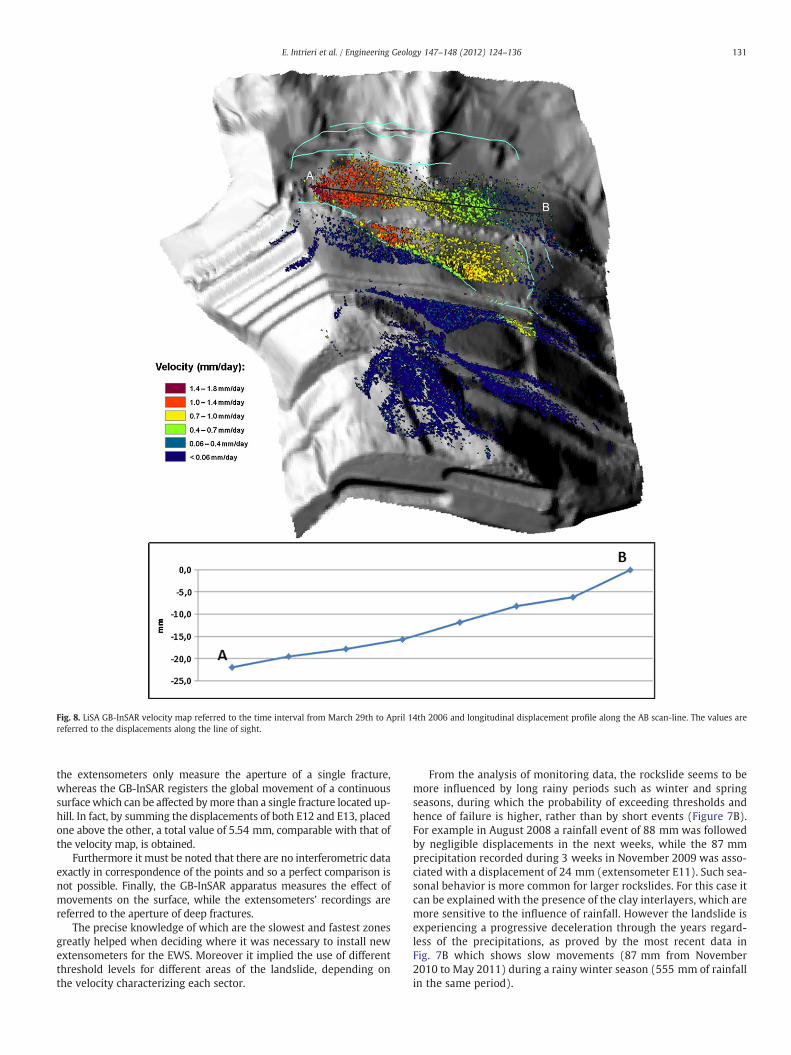
Fig. 8. LiSA GB-InSAR velocity map referred to the time interval from March 29th to April 14th 2006 and longitudinal displacement profile along the AB scan-line. The values arereferred to the displacements along the line of sight.
131E. Intrieri et al. / Engineering Geology 147–148 (2012) 124–136
the extensometers only measure the aperture of a single fracture,whereas the GB-InSAR registers the global movement of a continuoussurfacewhich can be affected bymore than a single fracture located up-hill. In fact, by summing the displacements of both E12 and E13, placedone above the other, a total value of 5.54 mm, comparable with that ofthe velocity map, is obtained.
Furthermore it must be noted that there are no interferometric dataexactly in correspondence of the points and so a perfect comparison isnot possible. Finally, the GB-InSAR apparatus measures the effect ofmovements on the surface, while the extensometers’ recordings arereferred to the aperture of deep fractures.
The precise knowledge of which are the slowest and fastest zonesgreatly helped when deciding where it was necessary to install newextensometers for the EWS. Moreover it implied the use of differentthreshold levels for different areas of the landslide, depending onthe velocity characterizing each sector.
From the analysis of monitoring data, the rockslide seems to bemore influenced by long rainy periods such as winter and springseasons, during which the probability of exceeding thresholds andhence of failure is higher, rather than by short events (Figure 7B).For example in August 2008 a rainfall event of 88 mm was followedby negligible displacements in the next weeks, while the 87 mmprecipitation recorded during 3 weeks in November 2009 was asso-ciated with a displacement of 24 mm (extensometer E11). Such sea-sonal behavior is more common for larger rockslides. For this case itcan be explained with the presence of the clay interlayers, which aremore sensitive to the influence of rainfall. However the landslide isexperiencing a progressive deceleration through the years regard-less of the precipitations, as proved by the most recent data inFig. 7B which shows slow movements (87 mm from November2010 to May 2011) during a rainy winter season (555 mm of rainfallin the same period).

Fig. 9. IBIS-L GB-InSAR velocity map referred to the time interval spanning from 11th to 17th April 2008 and longitudinal displacements along the AB scan-line. The circles representthe extensometers whose velocities are shown using the same color bar as the map (E15 and E3 are colored in white because they were not installed at the time).
132 E. Intrieri et al. / Engineering Geology 147–148 (2012) 124–136
This general slowdown can be assessed also by comparing data since2007 with the ones obtained from previous works (Graziani et al., 2009a,2009b). For example E11 measured around 300 mm from December2007 to February 2011, while the corresponding instrument during theprevious campaign (E5) recorded up to 250 mm from March 2005 toApril 2006; this can be only in a minimal part explained by comparingdata from the rain gauge, which recorded a total of 1125 mm from April2005 to March 2006, and a mean yearly value of 1017 mm from April2008 to March 2011. The main exception to this behavior is representedby E10n, which maintained a similar velocity throughout the years.
4. The early warning system
In order to guarantee safety conditions to the personnel involvedin the retaining wall construction and to keep a low residual risk
after its completion, an EWS has been specifically designed for theTorgiovannetto rockslide.
Before starting with the actual design of the EWS, a few designcriteria will be pointed out.
Simplicity was adopted as a criterion here. In fact, in emergencyconditions everything must be simple and straight-forward; theaction to be taken must be clear and fast, and misunderstandingsor human errors are not tolerable. Furthermore, trying to forecastthe imminent failure of a landslide and to alert people is a very com-plicated task; for this reason some simplifications must be done.Creating an EWS that reflects all the possible features of a landslidecan bring very little improvements and even compromise the wholesystem. Simplicity can be implemented in many different wayswithin an EWS, as in the choice of few warning levels or of schematicthresholds.

Table 1Sketch of warning levels and activities adopted for the early warning system ofTorgiovannetto.
Default level
When 2 or more
extensometers
exceed their own
velocity
thresholds
Increased activity
seasonal variations
some degree,
encompassing, to
Normal activity
Definition Response
Data are checked
daily. Monthly
monitoring bulletin
Data are checked
more frequently.
Daily monitoring
bulletin. H24
personnel from each
stakeholder are
alerted. Preparing for
alarm
Data are checked
even more frequently
Two monitoring
bulletins per day. The
Provincial Street is
closed
possibility due to
prolonged rainfalls.
Potentially
dangerous
Accelerating trend
far beyond any
Collapse is expected
seasonal fluctuation.
Based on expert
judgement and on
the use of
forecasting
methods
TriggerWarning level
Ordinary level
Attention level
Alarm level
133E. Intrieri et al. / Engineering Geology 147–148 (2012) 124–136
Another criterion, more site-specific, was the avoidance of falsealarms. Adopting counter-measures against false alarms can makethe EWS less conservative. However, in this case the presence ofthe retaining wall and the absence of houses among the elementsat risk made this solution possible. Moreover, as stated by Lacasseand Nadim (2009), an automatic EWS generating a false alarm maycause more severe consequences than the landslide itself, inducingadditionally a loss of credibility in the population.
A key issue considered during the design phase was that the land-slide is expected to show an accelerating trend a few days before thefailure, allowing some time for the emergency procedures. The EWShas been designed accordingly; in fact some adopted solutions, likeexpert judgment and the manual closure of the street, would not besuitable for landslides that leave a short forewarning. This piece ofinformation demonstrates once more the importance of the geologi-cal knowledge of the slope movement.
Fig. 10. Velocity vs. time for extensometers E11 and E10n. T
Since there were not any houses among the elements at risk, butonly a road, drills and training were not necessary; furthermore thepeople driving the street often do not live in the area. Neverthelesspublic events (such as for the construction of the wall) have beenorganized to increase the public awareness.
The system has three warning levels (Table 1):
• Ordinary level: no emergency. Data collected by extensometers arechecked daily and a monthly monitoring bulletin is released. Otheractivities imply the collaboration of every institution involved andinclude: constant communication between stakeholders, mainte-nance and daily weather forecasting.
• Attention level: when entering the attention level after the exceed-ing of velocity thresholds by at least two extensometers, all thestakeholders are immediately notified as well as their h24 person-nel on duty. Data are checked more frequently and a daily bulletinis released. In this level each stakeholder prepares for a possiblealarm and personnel are activated. No public communication ismade yet.
• Alarm level: through expert judgment it is decided whether to enteror not the alarm level. In case of alarm all the other stakeholders areimmediately notified. Data checking frequency is further increasedand two monitoring bulletins are emitted every day. The ProvincialStreet 249/1 is manually closed through the prompt lowering of twogate bars. Municipal emergency plan is activated.
For each extensometer a velocity (mm/day) threshold has beenassigned; for the lower extensometers (E1, E2, E3, E4) and E10n avalue of 0.50 mm/day has been assigned and 1.00 mm/day for theremnants. The velocity is obtained by averaging the values of theprevious 24 h, in order to reduce the noise of measurements and soto improve the reliability of the system. These thresholds have beendefined by analyzing the most critical periods of the whole monitor-ing dataset.
The chart in Fig. 10 shows the velocity trend of extensometersE11 and E10n from October 2007 to May 2011. The two differentthreshold values were chosen by taking into account the respec-tive displacements recorded by those instruments. Data fromonly two wire extensometers were reported for reasons of clarity,but they are representative of the values recorded by the otherinstruments.
he dashed lines indicate the adopted threshold values.
134 E. Intrieri et al. / Engineering Geology 147–148 (2012) 124–136
E11 exceeded 9 times its threshold value of 1.00 mm/day duringthe whole period, whereas E10 exceeded 7 times its threshold valueof 0.50 mm/day.
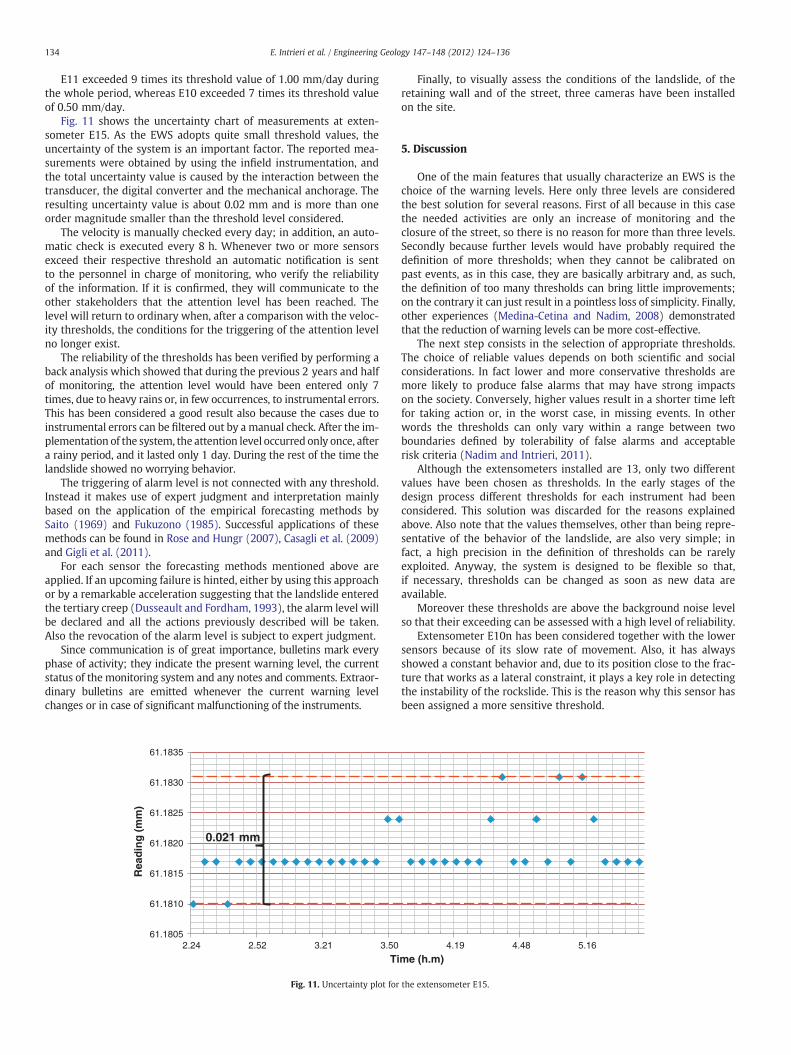
Fig. 11 shows the uncertainty chart of measurements at exten-someter E15. As the EWS adopts quite small threshold values, theuncertainty of the system is an important factor. The reported mea-surements were obtained by using the infield instrumentation, andthe total uncertainty value is caused by the interaction between thetransducer, the digital converter and the mechanical anchorage. Theresulting uncertainty value is about 0.02 mm and is more than oneorder magnitude smaller than the threshold level considered.
The velocity is manually checked every day; in addition, an auto-matic check is executed every 8 h. Whenever two or more sensorsexceed their respective threshold an automatic notification is sentto the personnel in charge of monitoring, who verify the reliabilityof the information. If it is confirmed, they will communicate to theother stakeholders that the attention level has been reached. Thelevel will return to ordinary when, after a comparison with the veloc-ity thresholds, the conditions for the triggering of the attention levelno longer exist.
The reliability of the thresholds has been verified by performing aback analysis which showed that during the previous 2 years and halfof monitoring, the attention level would have been entered only 7times, due to heavy rains or, in few occurrences, to instrumental errors.This has been considered a good result also because the cases due toinstrumental errors can be filtered out by a manual check. After the im-plementation of the system, the attention level occurred only once, aftera rainy period, and it lasted only 1 day. During the rest of the time thelandslide showed no worrying behavior.
The triggering of alarm level is not connected with any threshold.Instead it makes use of expert judgment and interpretation mainlybased on the application of the empirical forecasting methods bySaito (1969) and Fukuzono (1985). Successful applications of thesemethods can be found in Rose and Hungr (2007), Casagli et al. (2009)and Gigli et al. (2011).
For each sensor the forecasting methods mentioned above areapplied. If an upcoming failure is hinted, either by using this approachor by a remarkable acceleration suggesting that the landslide enteredthe tertiary creep (Dusseault and Fordham, 1993), the alarm level willbe declared and all the actions previously described will be taken.Also the revocation of the alarm level is subject to expert judgment.
Since communication is of great importance, bulletins mark everyphase of activity; they indicate the present warning level, the currentstatus of the monitoring system and any notes and comments. Extraor-dinary bulletins are emitted whenever the current warning levelchanges or in case of significant malfunctioning of the instruments.
61.1805
61.1810
61.1815
61.1820
61.1825
61.1830
61.1835
2.24 2.52 3.21 3.50
Rea
din
g (
mm
)
Ti
0.021 mm
Fig. 11. Uncertainty plot for
Finally, to visually assess the conditions of the landslide, of theretaining wall and of the street, three cameras have been installedon the site.
5. Discussion
One of the main features that usually characterize an EWS is thechoice of the warning levels. Here only three levels are consideredthe best solution for several reasons. First of all because in this casethe needed activities are only an increase of monitoring and theclosure of the street, so there is no reason for more than three levels.Secondly because further levels would have probably required thedefinition of more thresholds; when they cannot be calibrated onpast events, as in this case, they are basically arbitrary and, as such,the definition of too many thresholds can bring little improvements;on the contrary it can just result in a pointless loss of simplicity. Finally,other experiences (Medina-Cetina and Nadim, 2008) demonstratedthat the reduction of warning levels can be more cost-effective.
The next step consists in the selection of appropriate thresholds.The choice of reliable values depends on both scientific and socialconsiderations. In fact lower and more conservative thresholds aremore likely to produce false alarms that may have strong impactson the society. Conversely, higher values result in a shorter time leftfor taking action or, in the worst case, in missing events. In otherwords the thresholds can only vary within a range between twoboundaries defined by tolerability of false alarms and acceptablerisk criteria (Nadim and Intrieri, 2011).
Although the extensometers installed are 13, only two differentvalues have been chosen as thresholds. In the early stages of thedesign process different thresholds for each instrument had beenconsidered. This solution was discarded for the reasons explainedabove. Also note that the values themselves, other than being repre-sentative of the behavior of the landslide, are also very simple; infact, a high precision in the definition of thresholds can be rarelyexploited. Anyway, the system is designed to be flexible so that,if necessary, thresholds can be changed as soon as new data areavailable.
Moreover these thresholds are above the background noise levelso that their exceeding can be assessed with a high level of reliability.
Extensometer E10n has been considered together with the lowersensors because of its slow rate of movement. Also, it has alwaysshowed a constant behavior and, due to its position close to the frac-ture that works as a lateral constraint, it plays a key role in detectingthe instability of the rockslide. This is the reason why this sensor hasbeen assigned a more sensitive threshold.
4.19 4.48 5.16
me (h.m)
the extensometer E15.

135E. Intrieri et al. / Engineering Geology 147–148 (2012) 124–136
As stated before, in more than 1 year of activity, the attention levelwas reached only once, after a period of prolonged rainfall, whereasno alarms occurred. This is the result of the simple procedures thatwere applied, such as data averaging to prevent spikes and the intro-duction of redundancy (two or more extensometers must exceedtheir threshold in order to enter the attention level, since we areonly interested in the detection of the collapse of the wedge as awhole). For the same reason expert judgment has been chosen as ameans to assess the alarm level. In fact even if a particular behaviorof the landslide is expected in the last phases before failure, itwould be difficult if not impossible to establish precise thresholdsable to represent that behavior, due to some degree of uncertainty.Furthermore expert judgment is a flexible tool capable of handlingunforeseen situations such as a malfunctioning of the instrumentsduring a crisis or in case the proposed forecasting methods fail to con-verge toward a coherent result.
Bulletins are another very simple and versatile tool to avoid falsealarms (since any anomalous data will be interpreted and commentedinside the bulletin) and also to keep a constant communication be-tween stakeholders, which is a critical need for a good EWS (Lacasseand Nadim, 2009). During particular events (severe malfunctioning,passage from a level to another, crises, unexpected events etc.) commu-nication is real-time and interaction between all stakeholders is alwaysgranted by the Umbria Region.
A manual road block with gate bars and traffic lights was preferredto an automatic one in order to guarantee a last visual check of trafficconditions by the operator. This is possible in this site, since thegeomechanical context of the landslide suggests that the failure willbe foreseeable a few days in advance, making an automatic closurenot necessary.
Since the early stages, an operator has been appointed to rebootthe monitoring system in case of black out. The assignment of simpletasks like this, which may be beyond the duties of ordinary instru-mental maintenance, is very important to keep the EWS functioningand should be considered since the beginning.
At present rainfall data are not being used as thresholds because aclear correlation between precipitations and displacements has notbeen found yet. Moreover displacement (and its derivatives) givesa much more direct indication of potential instability rather thanrainfall (Lacasse and Nadim, 2009). However, ground water contentsimulations and weather forecasts, provided by Umbria Region, areconsidered during expert judgment before entering the alarm level.
6. Conclusions
In order to reduce the residual risk imposed to the Provincial Road249/1 by the Torgiovannetto landslide, an EWS has been implemented.The Torgiovannetto landslide is a 182,000 m3 rockslide which has beenstudied since 2004. During these years many data have been collectedand there is now a good knowledge of the threat and associated risks,which are necessary in order to design the most suitable EWS.
The EWS currently in use adopts 13 wire extensometers, 1 ther-mometer, 1 rain gauge, and 3 cameras. The system automaticallyacquires data every minute and uploads them on an ftp.
Aiming at simplicity, only 3 warning levels have been defined(ordinary level, attention level and alarm level). Velocity thresholdshave been defined just for the attention level, while the alarm levelcan be reached only following expert judgment mainly based on em-pirical forecasting methods (Saito, 1969; Fukuzono, 1985). Besideexpert judgment, redundancy and data averaging have been addedin order to reduce the possibility of false alarms. For the same reasonrainfall data are not included as thresholds, due to a loose correlationbetween them and potential failure. However ground water contentsimulations and weather forecasts are considered before enteringthe alarm level.
Although site-specific, the detailed description of this EWS can beuseful for facing similar situations. Furthermore some solutions canbe widely applicable, even in completely different contexts.
Acknowledgements
The authors wish to thank the National Civil Protection, UmbriaRegion, Perugia Province and Assisi Municipality for their collabora-tion in the realization of the early warning system described in thispaper. Special thanks to Mauro Reguzzoni from Hortus s.r.l. for hisprecious work with the monitoring system. The authors are gratefulto Paolo Farina and Lorenzo Mayer from IDS for the 2008 GB-InSARcampaign. The results from the 2006 interferometric campaign havebeen collected through a GB-InSAR apparatus designed and producedby the Ellegi s.r.l. and based on the proprietary technology GB-InSARLiSALAB derived from the evolution and improvement of LiSA tech-nology licensed by the Ispra Joint Research Centre of the EuropeanCommission.
References
Atzeni, C., Basso, M., Canuti, P., Casagli, N., Leva, D., Luzi, G., Moretti, S., Pieraccini, M.,Sieber, A.J., Tarchi, D., 2001. Ground-based SAR interferometry for landslide moni-toring and control. ISSMGE Field Workshop on Landslides and Natural/CulturalHeritage, Trabzon (Turkey), 23–24 August 2001, pp. 195–209 (CNR GNDCI Pub.No.2375).
Badoux, A., Graf, C., Rhyner, J., Kuntner, R., McArdell, B.W., 2009. A debris-flow alarmsystem for the Alpine Illgraben catchment: design and performance. Natural Hazards49, 517–539.
Balducci, M., Regni, R., Buttiglia, S., Piccioni, R., Venanti, L.D., Casagli, N., Gigli, G., 2011.Design and built of a ground reinforced embankment for the protection of a provincialroad (Assisi, Italy) against rockslide. Proc. XXIV Conv. Naz. Geotecnica, AGI, Napoli,22th-24th June 2011.
Barla, G.B., Antolini, F., Barla, M., Mensi, E., Piovano, G., 2010. Monitoring of the Beauregardlandslide (Aosta Valley, Italy) using advanced and conventional techniques. EngineeringGeology 116, 218–235.
Blikra, L.H., 2008. The Åknes rockslide: monitoring, threshold values and early-warning. 10th International Symposium on Landslides and Engineered Slopes,30th Jun - 4th Jul, Xian, China, pp. 1089–1094.
Canuti, P., Casagli, N., Gigli, G., 2006. Il modello geologico nelle interazioni framovimenti di massa, infrastrutture e centri abitati. In: Barla, G., Barla, M. (Eds.),Instabilità di versante, interazioni con le infrastrutture i centri abitati e l'ambiente,XI ciclo di conferenze di meccanica e ingegneria delle rocce, Torino, 28th-29thNovember 2006, pp. 41–61. In Italian.
Casagli, N., Tibaldi, A., Merri, A., Del Ventisette, C., Apuani, T., Guerri, L., Fortuny-Guasch,J., Tarchi, D., 2009. Deformation of Stromboli Volcano (Italy) during the 2007 erup-tion revealed by radar interferometry, numerical modeling and structural geolog-ical field data. Journal of Volcanology and Geothermal Research 182, 182–200.
Casagli, N., Catani, F., Del Ventisette, C., Luzi, G., 2010. Monitoring, prediction, and earlywarning using ground-based radar interferometry. Landslides 7, 291–301 http://dx.doi.org/10.1007/s10346-010-0215-y.
Cruden, D.M., Varnes, D.J., 1996. Landslides Types and Processes. In: Turner, A.K.,Schuster, R.L. (Eds.), Landslides: Investigation and Mitigation. TransportationResearch Board Special Report 247. National Academy Press, WA, pp. 36–75.
DiBiagio, E., Kjekstad, O., 2007. EarlyWarning, Instrumentation andMonitoring Landslides.2nd Regional Training Course, RECLAIM II, 29th January - 3rd February 2007.
Dusseault, M.B., Fordham, C.J., 1993. Time-dependant behavior of rocks. In: Hudson, J.A.(Ed.), Comprehensive rock engineering, 3. Pergamon Press, Oxford, pp. 119–149.
Froese, C.R., Carter, G., Langenberg, W., Moreno, F., 2006. Emergency response planningfor a second catastrophic rock slide at Turtle Mountain, Alberta. First SpecialtyConference on Disaster Mitigation, Calgary, Alberta, Canada, 23th-26th May 2006.
Fukuzono, T., 1985. A newmethod for predicting the failure time of a slope. Proceedings of4th International Conference and Field Workshop on Landslide, Tokyo, pp. 145–150.
Gigli, G., Fanti, R., Canuti, P., Casagli, N., 2011. Integration of advanced monitoring andnumerical modeling techniques for the complete risk scenario analysis of rockslides:the case of Mt. Beni (Florence Italy). Engineering Geology 120, 48–59.
Graziani, A., Rotonda, T., Tommasi, P., 2009a. Stability and deformation mode of a rockslide along interbeds reactivated by rainfall. Proc. of the 1st Italian Workshop onLandslides, Napoli, 8th-10th June 2009, 1, pp. 62–71.
Graziani, A., Marsella, M., Rotonda, T., Tommasi, P., Soccodato, C., 2009b. Study of a rockslide in a limestone formation with clay interbeds. Proc. Int. Conf. on Rock Jointsand Jointed Rock Masses, Tucson, Arizona, USA 7th-8th January 2009.
IEWP, International Early Warning Programme, 2008. The four elements of effectiveearly warning systems UN/ISDR [Accessed: 19th November 2009]. Available at:http://www.unisdr.org/ppew/iewp/IEWP-brochure.pdf.
Keefer, D., Wilson, R., Mark, R., Brabb, E., Brown III, W., Ellen, S., Harp, E., Wieczorek, G.,Alger, C., Zatkin, R., 1987. Real-time landslide warning during heavy rainfall.Science 238, 921–925.
136 E. Intrieri et al. / Engineering Geology 147–148 (2012) 124–136
Lacasse, S., Nadim, F., 2009. Landslide risk assessment and mitigation strategy. In: Sassa, K.,Canuti, P. (Eds.), Landslides—Disaster RiskReduction. Springer -Verlag, BerlinHeidelberg,pp. 31–61.
Lavecchia, G., Minelli, G., Pialli, G., 1988. The Umbria-Marche arcuate fold belt (Italy).Tectonophysics 18, 108–118.
Luzi, G., Pieraccini, M., Mecatti, D., Noferini, L., Guidi, G., Moia, F., Atzeni, C., 2004.Ground-based radar interferometry for landslides monitoring: atmospheric andinstrumental decorrelation sources on experimental data. IEEE Transactions onGeoscience and Remote Sensing 42, 2454–2466.
Mak, S.H., Yeung, Y.S.A., Chung, P.W.K., 2007. Public education and warnings in LandslideRisks Reduction. Proc. 40th Anniversary Vol. SEAGS, pp. 367–375.
Medina-Cetina, Z., Nadim, F., 2008. Stochastic design of an early warning system. Georisk:Assessment and Management of Risk for Engineered Systems and Geohazards 2,223–236.
Mirabella, F., Pucci, S., 2002. Integration of geological and geophysical data along a sectioncrossing the region of the 1997–98 Umbria-Marche earthquakes (Italy). Bollettinodella Societa Geologica Italiana 1, 891–900 (Special).
Nadim, F., Intrieri, E., 2011. Early warning systems for landslides: challenges and newmonitoring technologies. 5th Canadian Conference on Geotechnique and NaturalHazards. Kelowna, BC, Canada. 15th - 17th May, 2011.
Pang, P.L.R., Pun,W.K., Yu, Y.F., 2000. Estimation of failure frequency of soil cut slopes usingrainfall and slope information. Proc. of GeoEng2000 – International Conference onGeotechnical and Geological Engineering, Melbourne, Australia, 19th-24th Nov. 2000.
Rose, N.D., Hungr, O., 2007. Forecasting potential rock slope failure in open pit minesusing the inverse-velocity method. International Journal of Rock Mechanics andMining Science 44, 308–320.
Rudolf, H., Leva, D., Tarchi, D., Sieber, A.J., 1999. A mobile and versatile SAR system.Proceedings of Geoscience and Remote Sensing Symposium, IGARSS 1999, Hamburg,pp. 592–594.
Saito, M., 1969. Forecasting time of slope failure by tertiary creep. Proc. of 7th Int. Conf.on Soil Mechanics and Foundation Engineering, Mexico City, 2, pp. 677–683.
Stucky, 2007. Lake Sarez Mitigation Project -Component A. Final Report to Ministry ofEmergencies and Civil Defence of the Republic of Tajikistan. Renens, Switzerland.109 pp.
Tavarnelli, E., 1997. Structural evolution of a foreland fold-and-thrust belt: the Umbria-Marche Apennines, Italy. Journal of Structural Geology 7, 751–754.
UNISDR (United Nations International Strategy for Disaster Reduction), 2009. Terminologyon Disaster Risk Reduction. Available at http://www.unisdr.org.
Wilson, R., 2004. The rise and fall of a debris-flow warning system in the San Franciscobay region, California. In: Glade, T., Anderson, M., Crozier, M. (Eds.), Landslidehazard and risk. John Wiley and Sons, pp. 493–516.
Yu, Y.F., Lam, J.S., Siu, C.K., Pun, W.K., 2004. Recent advance in landslip warning system.Proceedings of the 1 day Seminar on Recent Advances in Geotechnical Engineering, or-ganized by the Hong Kong Institution of Engineers Geotechnical Division, pp. 139–147.