Holtzman (1978) Inteaction of perceptually monitored and ...
Upload
independentCategory
view
1download
0
© 2012 Knafl et al, publisher and licensee Dove Medical Press Ltd. This is an Open Access article which permits unrestricted noncommercial use, provided the original work is properly cited.
Patient Preference and Adherence 2012:6 207–219
Patient Preference and Adherence
Secondary analysis of electronically monitored medication adherence data for a cohort of hypertensive African-Americans
George J Knafl1
Antoinette Schoenthaler2
Gbenga Ogedegbe2
1School of Nursing, University of North Carolina at Chapel Hill, Chapel Hill, NC, USA; 2Center for Healthful Behavior Change, New York University School of Medicine, New York, NY, USA
Correspondence: George J Knafl School of Nursing, University of North Carolina at Chapel Hill, Campus Box 7460, Chapel Hill, NC, 27599-7460, USA Tel +1 919 843 9686 Fax +1 919 843 9969 Email [email protected]
Background: Electronic monitoring devices (EMDs) are regarded as the “gold standard” for
assessing medication adherence in research. Although EMD data provide rich longitudinal
information, they are typically not used to their maximum potential. Instead, EMD data are
usually combined into summary measures, which lack sufficient detail for describing complex
medication-taking patterns. This paper uses recently developed methods for analyzing EMD
data that capitalize more fully on their richness.
Methods: Recently developed adaptive statistical modeling methods were used to analyze
EMD data collected with medication event monitoring system (MEMS™) caps in a clinical
trial testing the effects of motivational interviewing on adherence to antihypertensive medica-
tions in a cohort of hypertensive African-Americans followed for 12 months in primary care
practices. This was a secondary analysis of EMD data for 141 of the 190 patients from this
study for whom MEMS data were available.
Results: Nonlinear adherence patterns for 141 patients were generated, clustered into seven
adherence types, categorized into acceptable (for example, high or improving) versus unac-
ceptable (for example, low or deteriorating) adherence, and related to adherence self-efficacy
and blood pressure. Mean adherence self-efficacy was higher across all time points for patients
with acceptable adherence in the intervention group than for other patients. By 12 months, there
was a greater drop in mean post-baseline blood pressure for patients in the intervention group,
with higher baseline blood pressure values than those in the usual care group.
Conclusion: Adaptive statistical modeling methods can provide novel insights into patients’
medication-taking behavior, which can inform development of innovative approaches for tailored
interventions to improve medication adherence.
Keywords: adaptive statistical modeling, hypertension, medication adherence, Medication
Event Monitoring System
IntroductionAn increasingly common approach for measuring medication adherence is the elec-
tronic monitoring device (EMD), often the Medication Event Monitoring System
(MEMS™) cap (AARDEX Group Ltd, Sion, Switzerland). EMDs have been used to
monitor adherence with antihypertensive medications1–7 and with a variety of other
medications. They provide rich information on the timing of events, but most analyses
of EMD data focus on simple summary adherence measures, such as percent prescribed
doses taken and percent prescribed doses taken at the correct time interval.8 These
summary adherence measures do not use EMD data to their maximum potential, in
part because they are based on an implicit assumption of constant adherence over time,
Dovepress
submit your manuscript | www.dovepress.com
Dovepress 207
O r i G i N A L r E S E A r C H
open access to scientific and medical research
Open Access Full Text Article
http://dx.doi.org/10.2147/PPA.S30582

Patient Preference and Adherence 2012:6
which often does not hold. In addition, summary adherence
measures do not provide sufficient detail to describe the
complex patterns of medication-taking behavior. In contrast,
Düsing et al and Vrijens et al modeled daily adherence with
logistic regression methods adjusted for correlation using
generalized estimating equations.2,7
The adaptive statistical modeling (ASM) approach is
intermediate between the summary measure approach and
modeling of daily adherence.9 ASM analyses are based on
counts and rates of EMD events (for example, MEMS cap
openings) within distinct time periods during a patient’s
participation in a study. These counts/rates are modeled
using Poisson regression models based on multiple power
transforms of time with arbitrary real-valued powers. The
transforms and their powers are generated through an
adaptive (ie, adapted to the data) process based on a heuristic,
rule-based search, and these models provide curves represent-
ing individual patient adherence patterns that are clustered
into adherence types. Aloia et al used a similar approach,
analyzing EMD adherence to continuous positive airway
pressure treatment for patients with obstructive sleep apnea
using time series models and classification of patient adher-
ence based on parameter estimates for those models.10 ASM
methods have been used to provide a variety of insights into
adherence using EMD data, for example, establishing the
efficacy of interventions, identifying signature adherence
types, and matching patients to interventions.11 However,
ASM methods have currently only been applied to EMD
adherence data for antiretroviral medications.12,13
This paper reports on the use of ASM methods to analyze
EMD data on adherence to antihypertensive medications in
a cohort of African-American patients with hypertension.
Findings from reported analyses provide novel insights into
adherence for these patients. These findings are of impor-
tance with regard to medication adherence in the particular
case of hypertensive African-American patients, and sug-
gest the need for similar analyses in general electronically
monitored adherence settings.
Materials and methodsMotivational interviewing studyThe motivational interviewing (MINT) study was a
r andomized, controlled trial designed to compare the effects of
MINT and usual care on medication adherence in h ypertensive
African-Americans followed in two primary care practices
in New York City.4,14 The study methods have been reported
elsewhere.4 Briefly, patients were approached to participate
in the study during regular clinic visits. All patients were
provided with written informed consent forms approved by the
institutional review board of Weill Cornell Medical College
and Columbia University Medical Center. After the patients
consented to participate in the study, research assistants
conducted baseline interviews, gave the patients a pill bottle
with a MEMS cap to record openings, and instructed them
on how to use it. When patients were prescribed multiple
antihypertensive medications, their providers were asked to
choose a medication taken once daily to be placed in the bottle.
Following the baseline assessment, patients were randomly
assigned to either the MINT or usual care group. Follow-up
assessments were carried out at 3-month intervals for a period
of one year (a total of four post-baseline visits), during which
patient medication adherence data were downloaded from
their MEMS caps.
Outcomes of MiNT studyThe primary outcome was the percent prescribed doses taken,
as assessed by MEMS caps. Poor adherence was defined as
taking less than 80% of the prescribed doses. Secondary
outcomes included within-patient changes in adherence
self-efficacy, systolic blood pressure, and diastolic blood
pressure from baseline to 12 months. Patient electronic medi-
cal records were reviewed for systolic and diastolic blood
pressure readings at each study visit. The within-patient
change in systolic/diastolic blood pressure was computed
as the difference in systolic/diastolic blood pressure between
the baseline and 12-month readings. Adherence self-efficacy
was measured using a 25-item Medication Adherence Self-
Efficacy Scale developed to assess patients’ confidence in
taking their antihypertensive medications under a variety
of situations that might pose difficulties for them.15 This
scale used a four-point Likert-type response format from
1 (not at all sure) to 4 (extremely sure). Scores for each
item were summed and averaged so that the range of pos-
sible scores was 1 to 4, with higher scores reflecting greater
self-efficacy. Cronbach’s alphas ranged from 0.88 to 0.91
over 0 to 12 months. Within-patient changes in adherence
self-efficacy from baseline to 12 months were computed as
differences in adherence self-efficacy scores between these
two time points. Adherence self-efficacy, and systolic and
diastolic blood pressure data were collected at baseline and
at months 3, 6, 9, and 12. Using an intent-to-treat analysis,
it was found that the MINT group had better medication
adherence than the usual care group.14
This paper reports on secondary analyses of EMD
data and longitudinal outcomes from the MINT study
using ASM methods. The analyses serve as examples of
submit your manuscript | www.dovepress.com
Dovepress
Dovepress
208
Knafl et al
Patient Preference and Adherence 2012:6
the application of ASM methods and their usefulness for
modeling medication adherence and assessing their impact
on patient outcomes.
Description of ASM methodsASM methods were originally formulated for Poisson regres-
sion modeling of mean adherence.9 They were then extended
to identify adherence types using adaptive clustering,12 to
model repeated-measures data adaptively, accounting for
within-patient correlation,16 and to model adherence vari-
ability adaptively, along with mean adherence over time.13
An overview of these ASM methods used is provided below.
Reported ASM analyses were conducted in SAS software
(version 9.2; SAS Institute Inc, Cary, NC) using SAS macros
available from the corresponding author.
In ASM, each patient’s EMD data are grouped into
distinct, nonoverlapping time intervals. One hundred equal-
sized intervals are used as long as the length of these inter-
vals is at least 3 days. Otherwise, the number of intervals is
reduced so that the interval length is at least 3 days. Counts
of numbers of EMD events are computed for each of the
intervals, as well as associated EMD rates per unit time.
The counts are modeled using Poisson regression with the
canonical log link function and the appropriate offset vari-
able to convert from a model for the counts to a model for
associated rates. Models are generated for mean adherence
in terms of expected values for rates as nonlinear functions
of time using one or more power transforms of time with
real-valued powers; thus, these are called fractional poly-
nomial models.17
For standard Poisson regression models, variances equal
the means. An extended quasi-likelihood approach18 is used
with ASM methods to include dispersions that generalize the
variances of linear regression models, thereby providing a
measure of adherence variability. Dispersions are also mod-
eled with fractional polynomials as nonlinear functions of
time based on power transforms of time, not necessarily the
same as those used for modeling mean adherence.
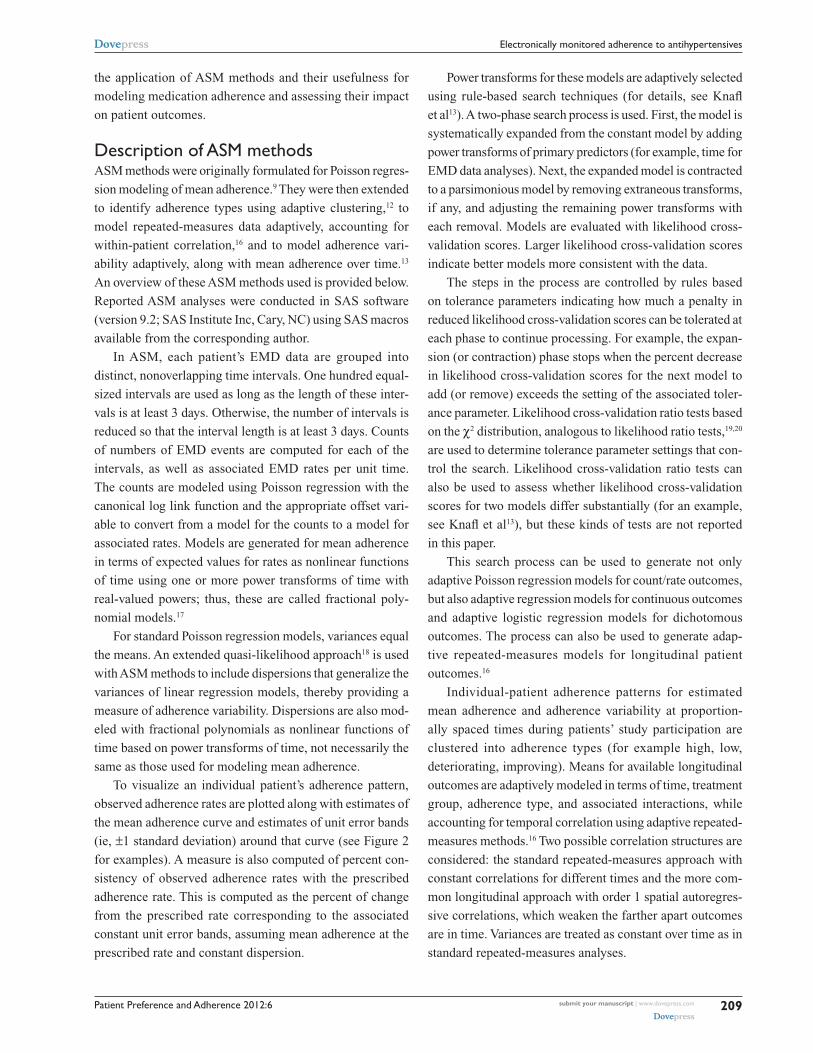
To visualize an individual patient’s adherence pattern,
observed adherence rates are plotted along with estimates of
the mean adherence curve and estimates of unit error bands
(ie, ±1 standard deviation) around that curve (see Figure 2
for examples). A measure is also computed of percent con-
sistency of observed adherence rates with the prescribed
adherence rate. This is computed as the percent of change
from the prescribed rate corresponding to the associated
constant unit error bands, assuming mean adherence at the
prescribed rate and constant dispersion.
Power transforms for these models are adaptively selected
using rule-based search techniques (for details, see Knafl
et al13). A two-phase search process is used. First, the model is
systematically expanded from the constant model by adding
power transforms of primary predictors (for example, time for
EMD data analyses). Next, the expanded model is contracted
to a parsimonious model by removing extraneous transforms,
if any, and adjusting the remaining power transforms with
each removal. Models are evaluated with likelihood cross-
validation scores. Larger likelihood cross-validation scores
indicate better models more consistent with the data.
The steps in the process are controlled by rules based
on tolerance parameters indicating how much a penalty in
reduced likelihood cross-validation scores can be tolerated at
each phase to continue processing. For example, the expan-
sion (or contraction) phase stops when the percent decrease
in likelihood cross-validation scores for the next model to
add (or remove) exceeds the setting of the associated toler-
ance parameter. Likelihood cross-validation ratio tests based
on the χ2 distribution, analogous to likelihood ratio tests,19,20
are used to determine tolerance parameter settings that con-
trol the search. Likelihood cross-validation ratio tests can
also be used to assess whether likelihood cross-validation
scores for two models differ substantially (for an example,
see Knafl et al13), but these kinds of tests are not reported
in this paper.
This search process can be used to generate not only
adaptive Poisson regression models for count/rate outcomes,
but also adaptive regression models for continuous outcomes
and adaptive logistic regression models for dichotomous
outcomes. The process can also be used to generate adap-
tive repeated-measures models for longitudinal patient
outcomes.16
Individual-patient adherence patterns for estimated
mean adherence and adherence variability at proportion-
ally spaced times during patients’ study participation are
clustered into adherence types (for example high, low,
deteriorating, improving). Means for available longitudinal
outcomes are adaptively modeled in terms of time, treatment
group, adherence type, and associated interactions, while
accounting for temporal correlation using adaptive repeated-
measures methods.16 Two possible correlation structures are
considered: the standard repeated-measures approach with
constant correlations for different times and the more com-
mon longitudinal approach with order 1 spatial autoregres-
sive correlations, which weaken the farther apart outcomes
are in time. Variances are treated as constant over time as in
standard repeated-measures analyses.
submit your manuscript | www.dovepress.com
Dovepress
Dovepress
209
Electronically monitored adherence to antihypertensives

Patient Preference and Adherence 2012:6
ResultsBaseline characteristics of MiNT study patientsA total of 190 patients (equally randomized to each group)
participated in the MINT study (Table 1). The majority of the
patients were women (88.4%), were 40–69 years old (77.9%),
had a high school degree or less (67.9%), were unmarried
(82.6%), were unemployed (77.9%), had a reported annual
income below $20,000 (64.2%), were on Medicaid (73.7%),
had uncontrolled baseline blood pressure (68.9%), and/or
had high baseline adherence self-efficacy of at least 3.5 out
of 4 (55.3%).
MEMS data were available for 141 (74.2%) of the
participants, with 70 (49.6%) from the MINT group
(Figure 1). Missing MEMS data was a consequence of a
variety of factors, including lost or malfunctioning caps
as well as patients not returning their MEMS caps for
downloading at follow-up assessments. Patients with and
without MEMS data did not differ significantly on any of
the baseline characteristics (using χ2 or Fisher’s exact test
as appropriate). Hence, results for patients with MEMS
data can be reasonably considered to be representative of
results for the total sample.
individual-patient adherence patternsObserved adherence rates were modeled for each of the
141 patients with available MEMS data in terms of mean
adherence and adherence variability over the 12-month
study period. Results are plotted in Figure 2. These plots are
similar to the chronology plots of Vrijens et al7 in depicting
observed adherence rates (plotted as circles) over time and
their variability, but they also provide fitted mean adherence
curves (the middle curve of the plots) and adherence vari-
ability curves (the outer two curves of the plots) not addressed
in chronology plots.
For patient 1, mean adherence was very high, at almost
exactly the prescribed rate of one dose per day throughout
the patient’s participation period, and adherence variability
was reasonably low although somewhat higher early in study
participation. The observed adherence was 90.9% consistent
with adherence at the prescribed rate. Patient 2 had high mean
adherence, below but not too much below the prescribed rate
and moderate adherence variability, being 48.1% consistent
with adherence at the prescribed rate. Patient 3 had a convex
mean adherence pattern, deteriorating somewhat early on but
then improving to high by the end of study participation along
with moderate to low adherence variability, for a percent
consistency of 15.2%.
Table 1 Baseline characteristics of patients in the MiNT study
Characteristic n %
Treatment group Usual care 95 50
MiNT 95 50
Gender
Female 168 88.4
Male 22 11.6
Age
,40 22 11.6
40–69 148 77.9
$70 20 10.5
Education
Elementary school 44 23.2
High school 85 44.7
Some college or better 61 32.1
Marital status
Single 84 44.2
Married 33 17.4
Separated or divorced 58 30.5
Widowed 15 7.9
Employment status
Full time 29 15.3
Part time 13 6.8
retired 20 10.5
Not working 103 54.2
On disability 25 13.2
Annual income level
Under $20,000 122 64.2
$20,000 or more 39 15.3
Unknown 29 20.5
insurance status
insurance plan or HMO 13 6.8
Medicare 22 11.6
Medicaid 140 73.7
Self insurance 15 7.9
Baseline SBP
Controlled (SBP , 140) 80 42.1
Uncontrolled (SBP $ 140) 110 57.9
Baseline DBP
Controlled (DBP , 90) 94 52.1
Uncontrolled (DBP $ 90) 91 47.9
Baseline BP
Controlled (SBP , 130 and DBP , 90) 59 31.1
Uncontrolled (SBP $ 140 or DBP $ 90) 131 68.9
Baseline adherence self-efficacy
,3.5 85 44.7
$3.5 105 55.3
MEMS data
None available 49 25.8
Some available 141 74.2
Note: Out of 190 African-American patients. Abbreviations: BP, blood pressure; DBP, diastolic BP; SBP, systolic BP; HMO, Health Maintenance Organization; MEMS, Medication Event Monitoring System; MiNT, motivational interviewing.
submit your manuscript | www.dovepress.com
Dovepress
Dovepress
210
Knafl et al

Patient Preference and Adherence 2012:6
Motivational interviewing study
190 patients randomized
Motivational interviewing intervention95 patients
Usual care 95 patients
MEMS data 70 patients
MEMS data 71 patients
Current study 141 patients
with MEMS data
Figure 1 Patients from the parent motivational interviewing study and the current study.
Patients 1, 2, and 3 had either very high, high, or
improving and thus acceptable adherence patterns, respec-
tively. Other patients had deteriorating or very low and
thus unacceptable adherence patterns. Patient 4 had mean
adherence that deteriorated from very high to low over time,
along with high to moderate adherence variability, for a
percent consistency of 0.1%. Patient 5 had mean adherence
that gradually deteriorated from moderate to low over time
and adherence variability that decreased from moderate to
low, for a percent consistency of 0.1%. Patient 6 had mean
adherence that deteriorated from high to zero early on and
adherence variability that decreased from low to zero, for a
percent consistency of 0.1%. Patient 7 had very low mean
adherence over time and also very low adherence variability,
for a percent consistency of 0.1%.
Categorization of adherence patterns into typesPatients with MEMS data were clustered into groups based on
their individual adherence patterns. The clusters were based
on estimated mean adherence and adherence variability,
computed at 5%, 10%, …, and 95% of time during study
participation, for each of the 141 patients. For example, the
study participation by patient 1 was 267 days, and so mean
adherence and adherence variability estimates for this patient
were computed at 13.4 (5% of 267) days, 26.7 (10% of 267)
days, …, and 253.7 (95% of 267) days.
Likelihood cross-validation scores were computed for
multivariate normal mixture models,21 with means and vari-
ances treated as different across clusters, and with a common
unstructured correlation matrix for all clusters to limit the
number of parameters. Clusters were restricted to include at
least 5% of the patients to avoid sparse clusters. The cluster-
ing approach with the best likelihood cross-validation score
generated seven clusters using Ward’s method based on
standard Euclidean distance.22 Adherence types correspond-
ing to these clusters are described in Table 2. Patients 1 to 7
were chosen as representative of clusters 1 to 7. Averages of
mean adherence and of adherence variability for patients in
each cluster, as plotted in Figure 3, were used to determine
Table 2 adherence type descriptions. These were similar to,
but not always exactly the same as, mean adherence and
adherence variability for patients 1 to 7.
Cluster 1 corresponded to very high adherence, cluster
2 to high adherence, and cluster 3 to improving adherence.
Thus, these three clusters represented acceptable adher-
ence (ie, relatively high or improving). Clusters 4 to 6
corresponded to deteriorating adherence, while Cluster 7
corresponded to very low adherence. Thus, clusters 4 to 7
represented unacceptable adherence. These categorizations
submit your manuscript | www.dovepress.com
Dovepress
Dovepress
211
Electronically monitored adherence to antihypertensives
Patient Preference and Adherence 2012:6
0
0.5
1
1.5
2
0 60 120 180 240 300
Op
enin
gs
per
day
Cumulative days within study participation
Patient 1 – 90.9% consistency
0
0.5
1
1.5
2
0 60 120 180 240
Op
enin
gs
per
day
Cumulative days within study participation
Patient 2 – 48.1% consistency
0
0.5
1
1.5
2
0 60 120 180 240 300Op
enin
gs
per
day
Cumulative days within study participation
Patient 3 – 15.2% consistency
0
0.5
1
1.5
2
0 60 120 180 240 300 360 420 480 540Op
enin
gs
per
day
Cumulative days within study participation
Patient 4 – 0.1% consistency
0
0.5
1
1.5
2
0 60 120 180 240 300 360
Op
enin
gs
per
day
Cumulative days within study participation
Patient 5 – 0.1% consistency
0
0.5
1
1.5
2
0 60 120 180 240 300 360 420 480
Op
enin
gs
per
day
Cumulative days within study participation
Patient 6 – 0.1% consistency
0
0.5
1
1.5
2
0 60 120 180 240 300 360 420op
enin
gs
per
day
Cumulative days within study participation
Patient 7 – 0.1% consistency
Figure 2 Example individual-patient adherence patterns.
of adherence were supported by decreasing average percent
consistency and percent prescribed doses taken with
increasing cluster indexes (Table 2). Note that cluster 5
corresponded to what Vrijens et al7 refer to as poor quality
of execution, while clusters 4, 6, and 7 represented what
they describe as short persistence (ie, disengagement from
the dosing regimen). Note also that adherence was measured
over the whole study period, including during periods of
nonpersistence.
Patients with acceptable adherence were significantly
[(χ2(1) = 76.05; P , 0.001] more likely to have a high
percentage of prescribed doses taken (defined as at least
80% prescribed doses taken as in the parent study). However,
only 70.8% of the patients with acceptable adherence as
submit your manuscript | www.dovepress.com
Dovepress
Dovepress
212
Knafl et al

Patient Preference and Adherence 2012:6
0
0.2
0.4
0.6
0.8
1
1.2
1.4
0.0% 20.0% 40.0% 60.0% 80.0% 100.0%
Op
enin
gs
per
day
Percent time within study participation
Means for acceptable adherence
1. very highmean + lowvariabilty
2. high mean + moderatevariabilty
3. improvingmean + low tomoderate variabilty
0
0.2
0.4
0.6
0.8
1
1.2
1.4
0.0% 20.0% 40.0% 60.0% 80.0% 100.0%
Op
enin
gs
per
Day
Percent time within study participation
Variability for acceptable adherence
1. very highmean + lowvariabilty
2. very highmean + moderatevariabilty 4. improvingmean + low tomoderatevariabilty
0
0.2
0.4
0.6
0.8
1
1.2
1.4
0.0% 20.0% 40.0% 60.0% 80.0% 100.0%
Op
enin
gs
per
Day
Percent time within study participation
Means for unacceptable adherence
4. deteriorating from very high
5. deterioratingfrom moderategradually 6. deterioratingfrom moderateearly on 7. very low
0
0.2
0.4
0.6
0.8
1
1.2
1.4
0.0% 20.0% 40.0% 60.0% 80.0% 100.0%
Op
enin
gs
per
day
Percent time within study participation
Variability for unacceptable adherence
4. deterioratingfrom very high
5. deterioratingfrom moderategradually
6. deterioratingfrom moderateearly on
7. very low
Figure 3 Average adherence patterns for adherence clusters.
Table 2 Adherence clusters
Cluster n % Adherence types Average % consistency
Average % prescribed doses takenMean adherence Adherence variability
1 19 13.5 Very high Low 80.8 97.22 37 26.2 High Moderate 50.6 84.93 9 6.4 improving Low to moderate 14.1 55.14 10 7.1 Deteriorating from
very highDeteriorating from very high
1.1 51.0
5 18 12.8 Deteriorating from moderate gradually
Deteriorating from moderate gradually
7.7 42.3
6 26 18.4 Deteriorating from moderate early on
Deteriorating from moderate early on
0.1 14.5
7 22 15.6 Very low Very low 0.1 5.8Total 141 100
determined by ASM also had high percent prescribed
doses taken. This suggests that the categorization into
acceptable and unacceptable adherence based on ASM d iffers
distinctly from the commonly used categorization based
on percent prescribed doses taken scores, underscoring the
potential problems with assuming constant adherence over
time.
The important study outcome of having uncontrolled blood
pressure (ie, either systolic blood pressure $ 140 mmHg or
diastolic blood pressure $ 90 mmHg) at 12 months did not
depend on having a high percentage of prescribed doses
taken $80% [χ2(1) = 0.24; P = 0.627]. However, the chance
of having uncontrolled blood pressure at 12 months was
significantly higher for patients with deteriorating adherence
than for other patients [χ2(1) = 7.59; P = 0.006].
Adherence type effects on means for patient outcomes
can be assessed using all seven adherence types or other
categorizations of adherence, including very high versus not,
either very high or high versus not, and acceptable (ie, very
high, high, or improving) versus unacceptable. However,
computing times can be quite long. For that reason, analyses
of mean patient outcomes (adherence self-efficacy, systolic
and diastolic blood pressure) were restricted to adherence
categorized as acceptable or unacceptable.
Adaptive analysis of adherence self-efficacyThere were 687 adherence self-efficacy measurements for the
141 patients with available MEMS data over five possible
time points, for an average of 4.9 measurements per patient.
submit your manuscript | www.dovepress.com
Dovepress
Dovepress
213
Electronically monitored adherence to antihypertensives

Patient Preference and Adherence 2012:6
An adaptive analysis was conducted to determine the effects
of adherence (acceptable versus unacceptable), treatment
group (MINT versus usual care), time, and their interactions
on mean adherence self-efficacy. Autoregressive correlations
were used because these generated better likelihood cross-
validation scores than constant correlations.
The model generated for adherence self-efficacy depended
on time, treatment group, and adherence type (Figure 4).
There were two mean adherence self-efficacy patterns, one
for patients in the MINT group with acceptable adherence
and one for all other patients. Mean adherence self-efficacy
started at the same baseline level and tended to increase over
time, but post-baseline mean adherence self-efficacy was
higher at all times for patients in the MINT group with more
acceptable adherence than for other patients. These results
suggest that there were MINT group improvements in mean
adherence self-efficacy, but only for MINT patients with
acceptable adherence, not for all patients in the MINT group.
The estimated standard deviation for adherence self-efficacy
was 0.41, while estimated correlations decreased from 0.57
at 3 months apart to 0.11 at 12 months apart.
Adaptive analyses of systolic blood pressureThere were 568 systolic blood pressure measurements for
141 patients with available MEMS data over five possible
time points, for an average of 4.0 measurements per patient.
An ASM model was first generated for systolic blood pressure
over these five time points. The results indicated that mean
systolic blood pressure did not change significantly according
to treatment group (MINT versus usual care) or adherence
type (acceptable versus unacceptable). However, this could
have been a consequence of not adjusting post-baseline
systolic blood pressure values for baseline values, and so ASM
analyses were also conducted to address this issue.
There were 427 post-baseline systolic blood pressure
measurements for 137 patients with available MEMS data
(four patients had only baseline systolic blood pressure
measurements) over four possible post-baseline time points,
for an average of 3.3 measurements per patient. ASM
analyses used constant correlations because these generated
better likelihood cross-validation scores than autoregressive
correlations.
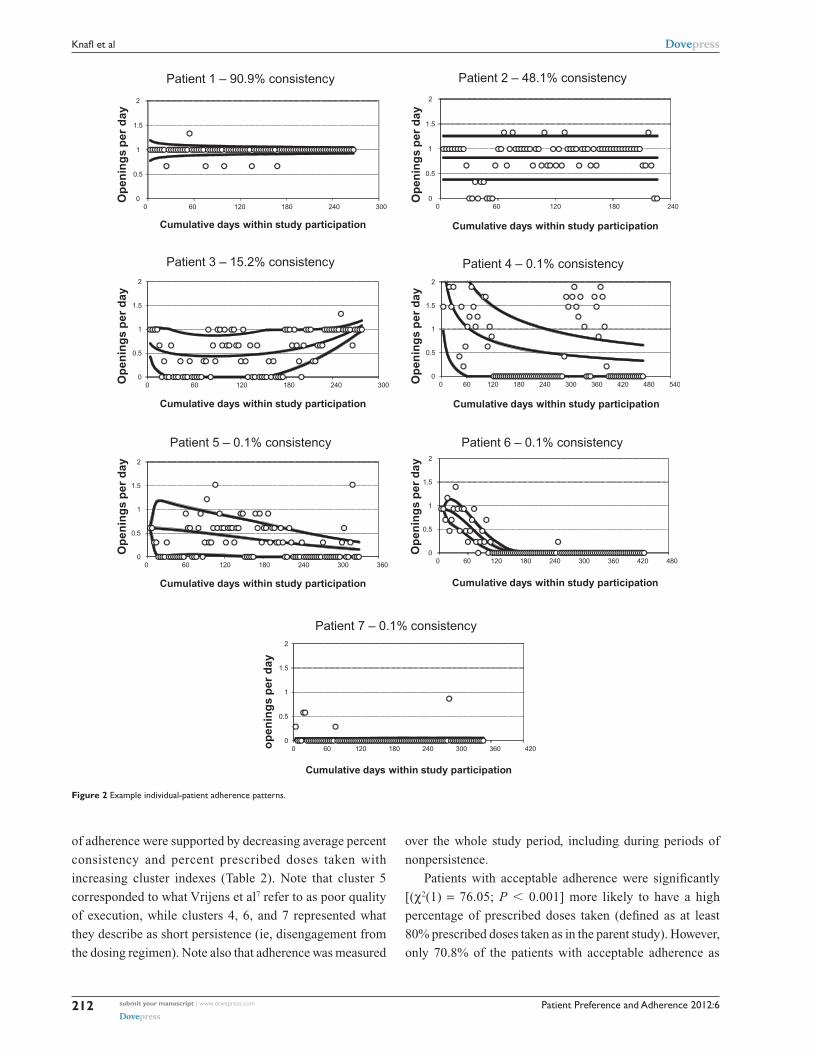
The ASM-generated model was based on baseline systolic
blood pressure, time, and treatment group, but not on adher-
ence type (Figure 5). For patients with low baseline systolic
blood pressure, mean systolic blood pressure was essentially
the same for both treatment groups and at all times. For
patients with high baseline systolic blood pressure, mean
post-baseline systolic blood pressure was lower for partici-
pants in the MINT group than those in the usual care group,
with larger differences for increased baseline systolic blood
pressures and at later times. The estimated constant standard
deviation for post-baseline systolic blood pressure was 15.6.
The estimated constant correlation was 0.29.
Adaptive analyses of diastolic blood pressureThere were 568 diastolic blood pressure measurements for
141 patients with available MEMS data over five possible
time points, for an average of 4.0 measurements per patient.
As for diastolic blood pressure, analyses over all five time
points identified no treatment group or adherence type
effects, and thus post-baseline diastolic blood pressure was
3.4
3.45
3.5
3.55
3.6
3.65
3.7
3.75
3.8
0 3 6 9 12
Ad
her
ence
sel
f-ef
fica
cy
Months
MINT +acceptable
UC orunacceptable
Figure 4 Mean adherence self-efficacy over time and by combinations of adherence type and treatment group. Abbreviations: MiNT, motivational interviewing; UC, usual care.
submit your manuscript | www.dovepress.com
Dovepress
Dovepress
214
Knafl et al
Patient Preference and Adherence 2012:6
110100 120 140 160 180
120
130
140
150
160
Po
st-b
asel
ine
syst
olic
blo
od
pre
ssu
re
Baseline systolic blood pressure
UC at 3−12 months
MINT at 3 months
MINT at 6 months
MINT at 9 months
MINT at 12 months
Figure 5 Mean post-baseline systolic blood pressure versus baseline systolic blood pressure over time and by treatment group. Abbreviations: MiNT, motivational interviewing; UC, usual care.
analyzed controlling for baseline values. There were 427
post-baseline diastolic blood pressure measurements for
137 patients with available MEMS data (four patients had
only baseline systolic blood pressure measurements) over
the four possible post-baseline time points, for an average
of 3.3 measurements per patient. Post-baseline diastolic
blood pressure analyses used constant correlations because
these generated better likelihood cross-validation scores than
autoregressive correlations.
The ASM-generated model included time, treatment
group, and adherence type effects (Figure 6). For patients
with high baseline diastolic blood pressure values, mean
post-baseline diastolic blood pressure was lower for partici-
pants in the MINT group than in the usual care group; the
values decreased over time for patients in the MINT group
and more so for those with very high baseline diastolic blood
pressure when they had acceptable adherence than if they had
unacceptable adherence. The estimated constant standard
deviation for post-baseline diastolic blood pressure was 9.8.
The estimated constant correlation was 0.23.
Comparison with standard repeated-measures modelingASM results for mean adherence self-efficacy over all five
time points were compared with results for the full facto-
rial repeated-measures analysis of variance model in time,
treatment group, adherence type, and all possible interactions.
ASM results for mean systolic/diastolic blood pressure over
the four post-baseline time points were compared with results
for the full factorial repeated-measures analysis of covariance
model in time, treatment group, adherence type, and all
possible interactions, controlling for baseline systolic/diastolic
blood pressure. All models assumed constant correlations and
variances as is standard for repeated-measures modeling.
The model for mean adherence self-efficacy had three
significant terms, ie, time [F(4,530) = 16.29; P , 0.001],
interaction of time with treatment group [F(4,530) = 4.64;
P = 0.001], and the interaction of time with adherence type
[F(4,530) = 3.18; P = 0.014]. The model for post-baseline
systolic blood pressure had only one significant term, ie, base-
line systolic blood pressure [F(1,132) = 30.73; P , 0.001].
The model for mean diastolic blood pressure also had only
one significant term, ie, baseline diastolic blood pressure
[F(1,132) = 34.44; P , 0.001].
DiscussionThe goal of this paper was to elucidate the usefulness of
ASM methods for providing novel insights into patterns of
medication-taking and a better understanding of how that
behavior affects patient outcomes. Analyses of data from
a completed randomized controlled trial demonstrated that
ASM methods revealed new information about individual
patient adherence behaviors as well as about the dependence
of changes in study outcomes over time on patient group
assignment ie, MINT versus usual care. More importantly, the
adherence behaviors that were identified using ASM methods
in this paper were not apparent from the original analyses
based on the conventional summary measure percent pre-
scribed doses taken.14 Specifically, ASM methods were able
to characterize patients as having several distinct a dherence
submit your manuscript | www.dovepress.com
Dovepress
Dovepress
215
Electronically monitored adherence to antihypertensives

Patient Preference and Adherence 2012:6
behaviors (very high, high, improving, deteriorating, or
very low adherence) that were in contrast with the usual
dichotomy of high adherence with percent prescribed doses
taken represented as an adherence level of $80% or not. Very
high, high, and improving adherence could be combined to
produce the dichotomy of acceptable versus unacceptable
adherence, but this was much different from high percent
prescribed doses taken or not (ie, only 70.8% of patients
with acceptable adherence also had high percent prescribed
doses taken). The significance of the divergent findings that
results from these contrasting methods is best exemplified by
analysis of the blood pressure data from this trial, including
systolic and diastolic blood pressure. Using conventional
summary methods, high percent prescribed doses taken had
no effect on blood pressure control at 12 months. In contrast,
patients with deteriorating adherence, as determined through
ASM methods, were more likely to have uncontrolled blood
pressure at 12 months.
Furthermore, the results suggested that the intervention
was most beneficial to patients with higher baseline blood
pressure levels and acceptable adherence rather than for
all patients who were randomized to the MINT group.
Moreover, as expected, the MINT intervention had a posi-
tive influence on patient medication adherence self-efficacy.
However, the effect was limited to those patients who also
had acceptable adherence levels. In this case, the strength
of the intervention appeared to lie in reinforcing patient
confidence to maintain good adherence behaviors and might
not have been suitable for addressing complex issues facing
patients with poor adherence. Also, while the intervention
targeted adherence behaviors, the effect of MINT on sys-
tolic blood pressure by the end of the study (12 months)
was unrelated to adherence type. This finding attests to the
multifactorial nature of blood pressure control. Types of
medications and their properties and/or changes in lifestyle
behaviors (ie, diet and exercise) were not measured in this
60
65
70
75
80
85
90
95
100
Po
st-b
asel
ine
dia
sto
lic b
loo
d p
ress
ure
Baseline diastolic blood pressure
Unacceptable adherence
UC at alltimes
MINT at 6months
MINT at 9months
MINT at 12months
60
65
70
75
80
85
90
95
100
70 75 80 85 90 95 100 105 110
70 75 80 85 90 95 100 105 110
Po
st-b
asel
ine
dia
sto
lic b
loo
d p
ress
ure
Baseline diastolic blood pressure
Acceptable adherence
UC at alltimes
MINT at 6months
MINT at 9months
MINT at 12months
Figure 6 Mean post-baseline diastolic blood pressure versus baseline diastolic blood pressure over time and by combinations of adherence type and treatment group.Abbreviations: MiNT, motivational interviewing; UC, usual care.
submit your manuscript | www.dovepress.com
Dovepress
Dovepress
216
Knafl et al
Patient Preference and Adherence 2012:6
trial, but might explain the observed reduction in systolic
blood pressure.
Standard repeated-measures analysis of variance/
covariance models in time, treatment group, and adherence
type with possible covariates can be overly complicated and
so suggest that there are no treatment group or adherence
type effects when in fact there are such effects (for example,
this held for reported systolic and diastolic blood pressure
analyses). ASM analyses are needed to identify which effects,
if any, are of substance and which are not. Even when standard
repeated-measures analyses identify significant effects (as for
reported adherence self-efficacy analyses), ASM modeling
provides a fuller depiction of those effects. The reported
repeated-measures analyses demonstrate that ASM methods
can provide parsimonious descriptions of how outcomes
change with predictors like time, baseline values, treatment
group, adherence type, and their interactions, and so identify
distinct effects that standard repeated-measures models can
sometimes suggest do not exist. While ASM methods were
used here to analyze data from a study of electronically moni-
tored adherence, they can also be used to perform adaptive
analyses of repeated-measures data from studies addressing
areas other than adherence.
Seven adherence types were identified in the analyses
within three categories of relatively consistent adherence
over time, deteriorating adherence over time, and improv-
ing adherence over time. The number of adherence types is
likely to vary with the study under analysis, but variations on
these three categories of adherence types can be expected to
be identified for any type of medication. For example, Knafl
et al13 identified 10 adherence types for subjects with human
immunodeficiency virus (HIV) on antiretroviral medications,
including seven relatively consistent, one deteriorating, and
two improving adherence types. However, these adherence
patterns were also identified in the context of a randomized
controlled trial, so it is not clear if the same adherence pat-
terns would emerge in clinical settings.
In summary, using ASM methods, this study identified
specific patient-related and disease-related factors (for exam-
ple, treatment group, adherence type, and baseline systolic/
diastolic blood pressure) that jointly predicted improvements
in psychosocial outcomes (ie, adherence self-efficacy) and
in clinical outcomes (ie, post-baseline systolic/diastolic
blood pressure) in a sample of African-American patients
enrolled in a motivational interviewing trial. In some cases,
these effects were not identifiable with standard repeated-
measures methods currently used for such assessments and
their distinct nonlinearity in none of the cases.
LimitationsThe adherence data analyzed in this article were collected
electronically using MEMS caps. Cap openings do not always
necessarily correspond to actual medication-taking. Patients
may have sometimes removed multiple doses at one cap
opening in order to put them in pill boxes, in which case the
cap openings underestimate actual adherence. On the other
hand, patients were enrolled in a randomized controlled
trial addressing adherence and so they may have sometimes
opened the cap to appear adherent without actually taking
any medications, in which case the cap openings overestimate
actual adherence. However, positive effects on adherence
self-efficacy and blood pressure identified in the analyses
for acceptable compared with unacceptable adherence, as
determined by MEMS cap openings, suggest that, for most
patients in the MINT study, their MEMS cap data reflect
their actual adherence quite closely.
The reported findings provide useful information for use
in the research field of adherence to medication regimens.
However, beneficial effects of improvements in patient
medication-taking behaviors on blood pressure control and
cardiovascular events remain to be determined in future
investigations.
There are also limitations to current ASM methods that
should be noted and these require further research. First,
while only adaptive Poisson regression of counts/rates is
needed for modeling EMD adherence data, ASM methods
currently also support adaptive linear and logistic regression
modeling of uncorrelated continuous and discrete outcomes,
respectively. However, ASM methods currently only support
adaptive repeated-measures modeling of correlated continu-
ous outcomes. There is a need to extend these to support
adaptive modeling of correlated counts/rates and correlated
discrete outcomes. Second, ASM methods currently sup-
port only two correlation structures for repeated-measures
analyses, which are constant as in standard repeated-measures
modeling and order 1 autoregression. Extensions are needed
to handle more general correlation structures, for example,
random-effect models. Third, other methods could have
been used. For example, latent class analysis could be used
instead of standard clustering procedures. Delucchi et al12
considered both these approaches for determining adher-
ence types for HIV-positive methadone patients and found
that there was good agreement between the two alternative
cluster assignments, but adaptive analyses were still needed
to generate the adherence patterns they clustered. Fourth, in
this study, variability was modeled only for adherence while
standard constant variance models were used for analyzing
submit your manuscript | www.dovepress.com
Dovepress
Dovepress
217
Electronically monitored adherence to antihypertensives

Patient Preference and Adherence 2012:6
longitudinal outcomes. Further research is needed to address
the impact of heterogeneous variance on the conclusions
for repeated-measures analyses. Fifth, the analyses only
addressed the frequency of medication-taking, not the timing
of medication-taking. Sixth, ASM analyses can require exten-
sive computation time. Finally, ASM methods currently are
not directly supported by statistical software tools. However,
they have been implemented in SAS macros available from
the corresponding author.
ConclusionOver the past 30 years, numerous interventions have been
developed to improve medication adherence in hypertensive
patients; however, no single strategy has emerged as superior
for all patients.23 While complex intervention strategies have
proven more successful than simple strategies,24 they too
have failed to demonstrate sizable effects that justify the high
costs and resources needed for implementation.25 Rather than
developing more complex, resource-intensive interventions,
new innovative methods are needed that directly address the
multifaceted nature of patient medication-taking behaviors.
ASM methods provide an approach for developing tailored
and potentially cost-effective intervention strategies to
improve adherence in patients who are at greatest risk for
poor adherence, such as those with lower socioeconomic
status and who are in racial/ethnic minorities.26
The findings of this study have several important implica-
tions that can guide future intervention efforts. First, exam-
ining individual adherence patterns can assist in developing
patient-specific intervention strategies that could maximize
efforts to improve patient’s medication-taking behaviors. For
example, patients who are nonadherent due to self-termination
of their medication require counseling approaches that build
confidence and motivation to continue with treatment, even
in situations that may pose challenging. Alternatively, patients
whose nonadherence is due to problems with execution of the
regimen require counseling approaches that assist in develop-
ing behavioral action plans and identifying sources of social
support to assist in taking medications as prescribed.
ASM methods could also be applied to future clinical trials
by the inclusion of a run-in phase during the first month of the
trial to generate adherence types and stratify patients accord-
ing to their adherence status as well as other key psychosocial
and clinical characteristics. This initial groundwork could help
researchers to determine which intervention approach would be
best matched to individual patient needs and to facilitate medi-
cation adherence behaviors. It is crucial that this preliminary
assessment be made close to randomization into treatment groups
because it is not clear whether a patient’s long-term history of
medication taking is as good an indicator of that patient’s pres-
ent or future medication-taking behavior. For example, patients
may have been consistently adherent until a future significant
life event/stressor occurs and interferes with medication-taking
behavior, after which their adherence deteriorates. These kinds
of events may be the root cause for some deteriorating individual
patient adherence patterns. Research is needed on what length of
a run-in period would be most effective for predicting subsequent
medication-taking behavior.
AcknowledgmentThis work was supported in part by grants R01 HL69408,
K23 HL098564, and K24 HL111315 from the National
Heart, Lung, and Blood Institute and grant P60 MD003421
from the National Center for Minority Health Disparities of
the National Institutes of Health. The content is solely the
responsibility of the authors and does not necessarily repre-
sent the official views of the National Heart, Lung, and Blood
Institute, the National Center for Minority Health Disparities,
or the National Institutes of Health.
DisclosureThe authors report no conflicts of interest in this work.
References1. Brunenberg DE, Wetzels GE, Nelemans PJ, et al. Cost effectiveness
of an adherence-improving programme in hypertensive patients. Pharmacoeconomics. 2007;25:239–351.
2. Düsing R, Handrock R, Klebs S, Tousset E, Vrijens B. Impact of support-ive measures on drug adherence in patients with essential hypertension treated with valsartan: the randomized, open-label, parallel group study VALIDATE. J Hypertens. 2009;27:894–901.
3. Gerin W, Tobin JN, Schwartz JE, et al. The medication Adherence and Blood Pressure Control (ABC) trial: a multi-site randomized controlled trial in a hypertensive, multi-cultural, economically disadvantaged population. Contemp Clin Trials. 2007;28:459–471.
4. Ogedegbe G, Schoenthaler A, Richardson T, et al. An RCT of the effect of motivational interviewing on medication adherence in hyperten-sive African Americans: rationale and design. Contemp Clin Trials. 2007;28:169–181.
5. Rose AJ, Berlowitz DR, Manze M, Orner MB, Kressin NR. Intensifying therapy for hypertension despite suboptimal adherence. Hypertension. 2009;54:524–529.
6. Schoenthaler A, Ogedegbe G. Patients’ perceptions of electronic monitoring devices affect medication adherence in hypertensive African Americans. Ann Pharmacother. 2008;42:647–652.
7. Vrijens B, Vincze G, Kristanto P, Urquhart J, Burnier M. Adherence to prescribed antihypertensive drug treatments: longitudinal study of electronically compiled dosing histories. BMJ. 2008;336:1114–1117.
8. Sereika SM, Dunbar-Jacob J. Analysis of electronic event monitored adherence. In: Burke LE, Ockene IS, editors. Compliance in Healthcare and Research. Armonk, NY: Futura Publishing; 2003.
9. Knafl GJ, Fennie KP, Bova C, Dieckhaus K, Williams AB. Electronic monitoring device event modelling on an individual-subject basis using adaptive Poisson regression. Stat Med. 2004;23:783–801.
submit your manuscript | www.dovepress.com
Dovepress
Dovepress
218
Knafl et al
Patient Preference and Adherence
Publish your work in this journal
Submit your manuscript here: http://www.dovepress.com/patient-preference-and-adherence-journal
Patient Preference and Adherence is an international, peer-reviewed, open access journal focusing on the growing importance of patient preference and adherence throughout the therapeutic continuum. Patient satisfaction, acceptability, quality of life, compliance, persistence and their role in developing new therapeutic modalities and compounds to
optimize clinical outcomes for existing disease states are major areas of interest. This journal has been accepted for indexing on PubMed Central. The manuscript management system is completely online and includes a very quick and fair peer-review system. Visit http://www.dovepress.com/ testimonials.php to read real quotes from published authors.
Patient Preference and Adherence 2012:6
10. Aloia MS, Goodwin MS, Velicer WF, et al. Time series analysis of treatment adherence patterns in individuals with obstructive sleep apnea. Ann Behav Med. 2008;36:44–53.
11. Knafl GJ, Bova CA, Fennie KP, O’Malley JP, Dieckhaus KD, Williams AB. An analysis of electronically monitored adherence to antiretroviral medications. AIDS Behav. 2010;14:755–768.
12. Delucchi KL, Knafl GJ, Haug N, Sorensen J. Adaptive Poisson model-ing of medication adherence among HIV-positive methadone patients provided greater understanding of behavior. In: Ekwall B, Cronquist M, editors. Micro Electro Mechanical Systems (MEMS) Technology, Fabrication Processes and Applications. Hauppauge, NY: Nova Science Publishers; 2010. Available from: https://www.novapublishers. com/catalog/product_info.php?products_id=19148. Accessed February 29, 2012.
13. Knafl GJ, Delucchi KL, Bova CA, Fennie KP, Ding K, Williams AB. A systematic approach for analyzing electronically monitored adherence data. In: Ekwall B, Cronquist M, editors. Micro Electro Mechanical Systems (MEMS) Technology, Fabrication Processes and Applications. Hauppauge, NY: Nova Science Publishers; 2010. Available from: https://www.novapublishers.com/catalog/product_info.php?products_id=19133. Accessed February 29, 2012.
14. Ogedegbe GO, Chaplin W, Schoenthaler AS, et al. A practice-based trial of motivational interviewing and adherence in hypertensive African Americans. Am J Hypertens. 2008;21:1137–1143.
15. Ogedegbe O, Mancuso CA, Allegrante JP, Charlson ME. Development and evaluation of a medication adherence self-efficacy scale in African-American patients. J Clin Epidemiol. 2003;56:520–529.
16. Knafl GJ, Fennie KP, O’Malley JP. Adaptive repeated measures mod-eling using likelihood cross-validation. In: Bovaruchuk B, editor. Proceedings Second IASTED International Conference on C omputational Intelligence. Anaheim, CA: ACTA Press; 2006.
17. Royston P, Altman DG. Regression using fractional polynomials of continuous covariates: parsimonious parametric modelling. Appl Stat. 1994;43:429–467.
18. McCullagh P, Nelder JA. Generalized Linear Models. Boca Raton, FL: Chapman & Hall/CRC; 1999.
19. Knafl GJ, Grey M. Factor analysis model evaluation through likelihood cross-validation. Stat Methods Med Res. 2007;16:77–102.
20. Stone M. An asymptotic equivalence of choice of model by cross-validation and Akaike’s criterion. J Roy Stat Soc B. 1977;39:44–47.
21. Symons MJ. Clustering criteria and multivariate normal mixtures. Biometrics. 1981;37:35–43.
22. SAS Institute Inc. SAS/STAT 9.1 User’s Guide. Cary, NC: SAS Institute; 2004.
23. Takiya LN, Peterson AM, Finley RS. Meta-analysis of interventions for medication adherence to antihypertensives. Ann Pharmacother. 2004;38:617–624.
24. McDonald HP, Garg AX, Haynes RB. Interventions to enhance patient adherence to medication prescriptions: scientific review. JAMA. 2002;288:2868–2879.
25. Haynes RB, Ackloo E, Sahota N, McDonald HP, Yao X. Interventions for enhancing medication adherence. Cochrane Database Syst Rev. 2008;2:CD000011.
26. Hyre AD, Krousel-Wood MA, Muntner P, Kawasaki L, DeSalvo KB. Prevalence and predictors of poor antihypertensive medication adherence in an urban health clinic setting. J Clin Hypertens. 2007;9:179–186.
submit your manuscript | www.dovepress.com
Dovepress
Dovepress
Dovepress
219
Electronically monitored adherence to antihypertensives
Copyright © 2022 FDOKUMEN