The Phenomenology of Psychosis Associated with Complex Partial Seizure Disorder1

INVITED REVIEWS
Comparison of Seizure Detection Algorithms inContinuously Monitored Pediatric Patients
Hyong C. Lee,* Wim van Drongelen,*† Arnetta B. McGee,* David M. Frim,‡ Michael H. Kohrman*
Summary: Robust, automated seizure detection has long been animportant goal in epilepsy research because of both the possibilitiesfor portable intervention devices and the potential to provideprompter, more efficient treatment while in clinic. The authorspresent results on how well four seizure detection algorithms (basedon principal eigenvalue [EI], total power, Kolmogorov entropy[KE], and correlation dimension) discriminated between ictal andinterictal EEG and electrocorticoencephalography (ECoG) fromfour patients (aged 13 months to 21 years). Test data consisted of 46to 78 hours of continuously acquired EEG/ECoG for each patient(245 hours total), and the detectors’ accuracy was checked againstseizures found by a board-certified neurologist and an experiencedregistered EEG technician. The results were patient-specific: noalgorithm performed well on a 13-month-old patient, and no algo-rithm consistently performed best on the other three patients. One ofthe metrics (EI) supported the existence of a postictal period of 5 to15 minutes in the three oldest patients, but no strong evidence of apreictal anticipation was found. Two metrics (EI and KE) cycledcontinuously with a period of several hours in a 21-year-old patient,highlighting the importance of continuous analysis to differentiatebackground cycling from anticipation.
Key Words: Epilepsy, Seizure detection, Signal analysis, Kolmog-orov entropy, Correlation dimension.
(J Clin Neurophysiol 2007;24: 137–146)
One of the most debilitating aspects of epilepsy is theanxiety that patients feel because of the unpredictable
nature of their seizures. Patients with poor seizure control areoften deprived of activities that call for continuous attention(e.g., driving). These curbs on the quality of life have madeseizure prediction an important goal of epilepsy research. Abroad variety of methods, including measures of multichan-nel synchrony (Mormann et al., 2003) and metrics from thetheory of nonlinear dynamics (Casdagli et al., 1997; Elger etal., 1998; Iasamidis et al., 1990; Le Van Quyen et al., 2001;Lehnertz et al., 2001; van Drongelen et al., 2003), have beenapplied to both the study and prediction of seizures; unfor-
tunately, the uneven performance of current prediction algo-rithms (cf. Mormann et al., 2005 for a comparison) makesrobust EEG-based prediction unpractical at this time. Al-though the ability to predict seizures with high certainty wellin advance of the event would be ideal, early detection ofincipient seizures can also serve some of the same ends(especially if it could be used in conjunction with an inter-vention, cf. Jerger et al. 2001, who found an average 25-second lead time between detection and clinical onset) andmethods developed for anticipation are often relevant todetection. In the clinical setting, reliable automated detectioncould hasten response times for treatment and also relax theneed for experts to be constantly on hand to monitor EEG forseizures.
The increase in available computational power sincethe first attempts to detect spikes and sharp waves (Gotmanand Gloor ,1976) and, later, seizures (Gotman, 1982), hasbroadened the range of algorithms that can be implemented inreal-time. Sophisticated algorithms that have been testedinclude wavelet decomposition (Khan and Gotman, 2003),spectral analysis (Grewal and Gotman, 2005), and neuralnetworks for pattern recognition in EEG (Gabor, 1998; Wilsonet al., 2004) and to improve existing methods by tailoringthem to individual patients (Park et al., 1997; Wilson, 2005).The amount of data against which it is practical to test thesedifferent approaches has also increased, and researchers havebegun to analyze complete inpatient records spanning severaldays, progressing from the formerly standard approach ofcomparing seizure versus seizure-free data segments usingonly a subset of recorded channels (cf. Lehnertz et al., currentissue). Analyzing all channels of continuously acquired EEGaffords the researcher improved insight into how the variousmetrics deal with the full range of patient activity, and alsoallows trends in the EEG to be tracked. Recently, recommen-dations were put forth at the First International CollaborativeWorkshop on Seizure Prediction (hereafter Bonn 2002; cf.Lehnertz and Litt, 2004) in an attempt to further standardizedata selection and establish a common database of multidayrecords for validation (in this case, to test prediction algo-rithms). Although multiday, continuously acquired data setsare becoming more common test beds in studies of adultseizures, studies evaluating seizure detectors on long epochsof pediatric EEG are rare. We therefore present the results ofan ongoing study to evaluate the accuracy of several com-monly cited detection algorithms in multiday EEG and elec-trocorticoencephalographic (ECoG) recordings from four pa-
Departments of *Pediatrics and ‡Surgery, and †Computation Institute, TheUniversity of Chicago, Chicago, Illinois, U.S.A.
Address correspondence and reprint requests to Hyong Lee, Department ofPediatrics, C399, MC 3055, 5841 S. Maryland Avenue, Chicago, IL60637-1470; e-mail: [email protected].
Copyright © 2007 by the American Clinical Neurophysiology SocietyISSN: 0736-0258/07/2402-0137
Journal of Clinical Neurophysiology • Volume 24, Number 2, April 2007 137

tients at the Pediatric Epilepsy Center at the University ofChicago Hospitals.
METHODS
Data Selection and ProcessingBoth EEG and ECoG were recorded and analyzed from
four consecutive surgical patients at the Pediatric EpilepsyCenter of the University of Chicago Comer Children’s Hos-pital in accordance with an IRB-approved protocol. NicoletBMSI 6000 acquisition systems (Nicolet Biomedical, Madi-son, WI) were used to collect 112 to 128 channels from eachpatient at a sampling rate of 400 Hz. The length of thepatients’ monitoring was determined by the requirements oftheir clinical treatment and determined the amount of datacollected. In some cases, it was necessary to exclude fromanalysis selections of data that were found to be contaminatedby technical problems, primarily loose ground electrodes; thisjudgment was made on the basis of notations from the EEGtechnician on duty, or after the fact by a registered EEGtechnician. Excluding these contaminated segments, 46 to 78hours of continuous data remained from each patient.
All four patients had intractable seizures and weretreated via surgical resection. After surgery, patient 1, a12-year-old boy, has had seizure frequency reduced fromseveral per day to less than one per week. Patient 2, a13-year-old girl, has had complete seizure control with med-ication in the 6 months since resection of a left temporalfocus. Patient 3, a 21-year-old woman, has also had completeseizure control in the 3 months since the resection of a righttemporal lobe focus. Finally, patient 4, a 13-month-old girl,has been seizure-free for the 4 months since a left frontallobotomy. These positive clinical outcomes indicate that theapproximate locations of the epileptogenic areas were cor-rectly identified, and therefore that activity in the EEG chan-
nels suspected of lying nearest the foci can be consideredrepresentative of focal activity. Specifics of the patients andthe collected data are summarized in Table 1.
The recommendations made at Bonn 2002 with regardto selection of data for testing seizure anticipation algorithmsare relevant to this study, and they were followed as far aswas feasible. However, practical considerations forced depar-ture from the recommendations at several points. Seizuremedications were withdrawn from the patients several daysbefore surgery to allow us to observe seizures as soon aspossible after grid implantation, thereby shortening the timeneeded to evaluate a resection; this approach was successful,as all four patients had seizures within 24 hours after surgery.In two cases (patients 1 and 4), seizures were so frequent thatmedication was reintroduced, so that these patients only hadseizures within 36 hours of grid implantation. It was thereforenecessary to include early seizures within 24 hours of theimplantation surgery. Further, recording these early seizuresallowed the resection surgery to be advanced, so that onepatient had less than the 48 hours of continuous data recom-mended at Bonn 2002. The generally higher rate of seizuresin our patients as compared with adults with mesial temporallobe seizures that were the focus at Bonn 2002 mitigatessomewhat the impact of a shorter data epoch.
Each channel of data was segmented into 20-secondwindows with 10-second overlaps. Twenty-second windowswere chosen after some experimentation with window lengthsas a compromise between good temporal resolution (andtherefore a timely detection) and the need for a (relatively)stable set of calculated metrics; because our equipment sam-ples at 400 Hz, each window contained 8000 samples. In eachchannel, the mean of the time series was subtracted, and thedemeaned signal was passed through a 1 to 35 Hz band passfilter (second-order Butterworth) before the four metrics were
TABLE 1. Summary of Patient Data*
Patient Sex Age Data Seizures Diagnosis Resected Engel Score
1 M 12 y 78 h24-channelEEG88-channelECoG
7 Perinatal asphyxia Right frontal lobe 3
2 F 13 y 59 h30-channelEEG88-channelECoG
5 Mesial temporalsclerosis/neurofibromatosis
Left temporal lobe 1
3 F 21 y 46 h24-channelEEG101-channelECoG
6 Mesial temporalsclerosis/neurofibromatosis
Right temporal lobe 1
4 F 13 mo 62 h24-channelEEG89-channelECoG
11 Aicardi syndrome Left frontal lobe 1
*Includes diagnosis, treatment, data collected, and the outcomes expressed as Engel scores (Engel et al., 1993).
Lee et al. Journal of Clinical Neurophysiology • Volume 24, Number 2, April 2007
Copyright © 2007 by the American Clinical Neurophysiology Society138

calculated. The values so calculated are marked with the timeof the end of the data window, so that any change in thesemetrics preceding an event noted by the human expert isguaranteed to contain only prior information. Figure 1 illus-trates the way in which data were blocked and time-stamped.
MetricsFour different metrics were calculated from the filtered
data: total power (POW), largest principal eigenvalue (EI),Kolmogorov entropy (KE), and correlation dimension (CD).These were chosen based on their promise in a previousfeasibility study (van Drongelen et al., 2003) and wereimplemented in a custom code (van Drongelen et al., 2005).The code is able to calculate all four metrics for a reasonablenumber of channels (30–40) in real time on a medium speed(1.8 GHz) PC if the data are blocked in overlapping windowsas previously described. They are therefore suitable for anonline detection system.
Power and principal eigenvalue are the two linearmetrics that were tested. The power of a channel was calcu-lated as the mean squared amplitude of the de-meaned andfiltered signal, so it is restricted to the power/variance inthe 1 to 35 Hz pass band. Before calculating EI, KE, andCD, the signal was normalized by the mean absolutedeviation of the channel:
�x�� �1
N�i
N
�xi � x��, where x� is the mean of the samples.
This has the effect of extracting the interwindow changes inaverage amplitude that are highlighted by POW. However,because of the relatively coarse size of the data windows (20seconds) compared with the typical time needed for seizureonset (approximately a few seconds), this data-adaptive scal-ing over a data window does not remove from the datawindows(s) corresponding to seizure initiation the often largecontrast between the amplitude of the preseizure signal com-pared with that recorded during a seizure.
The principal eigenvalue was calculated by viewingeach channel of data as containing a series of nonoverlapping128-element vectors chosen to be long enough to containepileptiform activity and to be consistent with the maximumnumber of data channels (128) provided by our equipment. A
128 � 128 covariance matrix was calculated from the result-ing series of vectors. An SVD-decomposition was performed(Press et al., 1992) from the covariance matrix; this yields aset of eigenvectors, which represent linearly independentcomponents of the signal, and their corresponding eigenval-ues. The principal eigenvalue used in this study is simply thelargest eigenvalue resulting from this decomposition. Thisgives a rough indication of the fraction of the signal that canbe accounted for with a single linear estimate; put anotherway, a large principal eigenvalue indicates those times whena single component dominates the signal.
The two nonlinear metrics evaluated in this study areKE and CD. Both assume the existence of an underlyingnonlinear system in a stationary state, and attempt to charac-terize this state. Takens (1981) showed that the dynamic stateof a system can be reconstructed from a time-delayed em-bedding of a time series, �x1, x2, . . ., xN�, generated by thesystem into a series of m-length vectors Xi � �xi, xi�j,xi�2j, . . ., xi��m�1�j�, where j is the time-delay in samples.Following Schouten et al. (1994a), we take j � 1, and alsoadopt the heuristic estimate of m suggested therein by settingm to the average number of points contained in one cycle ofthe time series: m � N/2c, where N is the number of samplepoints in the data window and c is the number of zerocrossings.
KE indicates the rate at which information about asystem is lost, or alternately, indicates the predictability of asystem’s evolution given its current state; it estimates theamount of time needed for a system in two very similar statesto evolve to states that differ significantly from one another.The time t needed for these states to diverge is distributed asp�t� � e�KE*t. Even if the rules governing the evolution of thesystem are understood perfectly, noise and measurementerror always limit the precision to which quantities describinga system state are known. KE indicates the rapidity withwhich the precision of quantities calculated from someknown initial condition will be eroded, and with them, knowl-edge of the system at some future time. The algorithm used tocalculate KE in this study is a maximum likelihood estimatorgiven by Schouten et al. (1994a).
Another common method of characterizing a dynamicalsystem is the correlation dimension. The correlation dimensionis estimated from the correlation integral, which is calculated on
a set of K vectors as C�s� �1
K�K�1��i,j
K
��s � �ij�, where � is
the Heaviside function and �ij is the maximum norm distancebetween two vectors: �ij � �Xi � Xj�. In other words, thecorrelation integral counts the number of vector pairs that arewithin a distance s of each other; for large K and small s, itis expected to scale with distance as C�s� � sCD, where CD isthe correlation dimension. The analogy here is with evenlydistributed random points in space; for a given point, thenumber of other points within a distance s should scale as sD,where D represents the number of spatial dimensions overwhich the points are distributed (1 for lines, 2 for planes, 3 forvolumes). Therefore, correlation dimension is an estimate ofthe minimum number of independent variables (dimensions)
FIGURE 1. The blocking of the data from each channelinto overlapping windows is illustrated. Twenty-second seg-ments have a 10-second overlap with the preceding andsucceeding segments, and each segment’s time marker cor-responds to that of the end of the data block.
Journal of Clinical Neurophysiology • Volume 24, Number 2, April 2007 Seizure Detection in Long-Term EEG
Copyright © 2007 by the American Clinical Neurophysiology Society 139

over which the dynamical system ranges, as implied by thebehavior of the measured signal. The algorithm used tocalculate CD is a maximum likelihood estimator given bySchouten et al. (1994b).
Comparison of AccuracyA board-certified pediatric neurologist (MHK) and an
experienced registered EEG technician (ABM) analyzed thepatient data and marked the start and end times of anyseizures to provide the reference against which the metricswere judged. When initiating (focal) channels were clearlyvisible, these were also noted; additional events (periods ofspiking activity, subclinical seizures, etc) were includedsolely at the discretion of the human expert. The researchersinvolved in the quantitative analysis and the human clinicalexperts were generally blinded to each other’s results untilthey were formally compared.
Initially, receiver operating characteristic (ROC) curves(Green and Swets, 1966) were used to evaluate effectivenessand to optimize a detection threshold for each patient-chan-nel-metric combination. This was done by scoring the metriccorresponding to each data window as a true detection (adetection falling within a seizure as marked by the humanexpert) or a false detection (a detection without a correspond-ing marked seizure) and calculating the sensitivity versusspecificity. This approach failed to characterize the data well.The problem is illustrated in Fig. 2, which shows a plot of EI(panel A) along with the seizures found by the human experts(vertical lines), and the resulting ROC curve (panel B). Fromthe plot, it is clear that a threshold �0.6 should yield perfectdetection sensitivity with no false detections, but this is notreflected in the ROC curve. A closer examination of a singleseizure (panel C) illustrates the problem: the ROC curvetreats each calculated point as an independent detection
instead of treating the seizure (and the clearly related set ofcalculated points) as a single event. In the example, the firsttwo points after the seizure ends are treated as false detectionseven though they are surely associated with the seizure.
To avoid the problems with the ROC curve as calcu-lated above, we modified the scoring in two ways. First, anyseries of contiguous metric values that fell below a testthreshold, up to 1 minute, were counted as a single prospec-tive detection. Second, if there were any prospective detec-tions within 20 seconds (the size of one data window) of amarked seizure interval, that seizure was counted as beingsuccessfully detected; otherwise, the prospective detectionwas counted false. The sensitivity is the ratio of detectedseizure to total seizures. Specificity depends on the ability tocount nondetections; because we no longer score individualdata points corresponding to fixed periods of time, but insteadscore seizures of variable duration, we cannot generalizespecificity directly. We have therefore replaced this with falsedetection rate (FDR), the number of false detections dividedby the length of the data set. The sensitivity and FDR canthen be plotted in an ROC-like curve to indicate the ability ofa metric to distinguish between seizures and nonseizure EEG,as shown in Fig. 2D.
Detection algorithms may be used on single channels,in case only a limited number of channels are recorded neara seizure focus, such as in a portable. They may alternately beapplied to many/all channels of an EEG during in patientlong-term monitoring. In both cases, the practical question tobe asked is whether most or all seizures can be detected witha reasonably low FDR. Therefore, we divided the data intoEEG and ECoG for each patient and counted the number ofchannels in each group for which a particular metric was ableto meet a reasonable maximum FDR while detecting all the
FIGURE 2. This figure illustrates thedifficulty arising from the use of tra-ditional ROC curves. EI (panel A)discriminates perfectly between sei-zures and nonseizures with a thresh-old of 0.6, but the ROC (panel B)does not reflect this because somemetric values near each seizure lieoutside the marked event eventhough they are clearly associatedwith it (panel C). The revised proce-dure described in the text accuratelyreflects the perfect discrimination ofthe metric (panel D); note the curveis hard to see because it follows theFDR � 0 axis.
Lee et al. Journal of Clinical Neurophysiology • Volume 24, Number 2, April 2007
Copyright © 2007 by the American Clinical Neurophysiology Society140
seizures, i.e., maintaining perfect sensitivity; the fraction ofchannels that met this criterion was interpreted as an indica-tion of the likelihood that a metric would be useful in asituation where a small number of targeted channels wererecorded. Three maximum FDRs were chosen such that, ifused as an alarm, at least {10%, 30%, 50%} of the alarmswould have been true seizures; this was calculated from theaverage seizure rate for each patient. The aim is to decidehow many channel/metric combinations might be relevant foruse in a detector, and scaling the maximum FDR with the rateof seizures for each patient takes out interpatient variation inseizure rate.
In addition, we also averaged the metrics (not the EEG)over the scalp and intracranial channel groups and calculatedsensitivity versus FDR for the averaged metrics; this wastaken as a practical way of setting thresholds in a situationwhere many channels are available, but the channels with thestrongest seizure discrimination are unknown. This would bea real possibility in a clinical, multiday evaluation of asurgical candidate.
RESULTSThe fraction of channels for which each metric success-
fully detected 100% of seizures with maximum FDRs asdescribed in the Methods section are summarized by patientand channel group in Tables 2 (intracranial electrodes) and 3(scalp electrodes). In examining these results, it should beemphasized that sensitivity is always balanced against FDR.As can be seen, there is great variability between metrics andespecially among patients. Despite this, the metrics are gen-erally good at detecting seizures; the differences appear in theability to distinguish seizures from other events. The moststriking case is patient 4, where none of the detection algo-rithms achieved adequate FDRs. The reason for this is thatthere were several epochs of 3 to 5 hours where this patient’srecord displayed constant spiking (some sections of whichresembled short electrographic seizures) as noted by theneurologist. None of the metrics could distinguish this abnor-
mal activity from seizure; indeed the activity was so prevalentthat blocks of more than 30 minutes were simply noted asspiking activity by the neurologist; a small representativesection of this EEG is shown in Fig. 3.
In patient 1, by contrast, EI and KE both do reasonablywell in balancing a high degree of sensitivity to seizures witha reasonable FDR; POW and CD do not do as well except inchannels close to the focus. In this patient, EI and KE do welldistinguishing seizure from nonseizure epochs in almost allthe EEG channels and perform considerably better on EEGthan in any of the other patients.
In patient 3, POW detects very cleanly, whereas KEand CD do a credible job on the ECoG but not the EEG.Interestingly, EI does not do particularly well on the ECoG,but performs better than KE or CD on the EEG. The perfor-mance of the metrics for this patient is also interesting in thatchannels away from the focus (for example, in the lefttemporal lobe) do a better job distinguishing seizure versusnonseizure than the channels nearest the focal region (righttemporal lobe). We attribute this to the heightened nonsei-zure, abnormal activity of the ECoG near the focus, includingseveral events that were judged by the neurologist to besubclinical seizures, which increases the FDR (because onlyclinical seizures are counted as true detections). By contrast,seizurelike activity would have to have spread beyond thefocal region to be recorded by channels farther away, therebyincreasing the chance that this activity would manifest itselfas a clinical seizure.
An example of spreading appears in a comparison of EIin two of patient 3’s ECoG channels: RAT1, on the righttemporal lobe nearest the focus, and LAT1, on the lefttemporal lobe (see Fig. 4). As can be seen, EI from RAT1drops at the beginning of the electrographic seizure; theclinical onset only occurs approximately 40 seconds later,accompanied by the expected drop in EI in LAT1. Althoughunusual, this case shows that the practical difference betweenanticipation and detection is not clear-cut; detecting subclin-ical seizures that continue for tens of seconds before theyspread into clinical seizures may be as useful as true antici-pation (cf. Jerger et al., 2001).
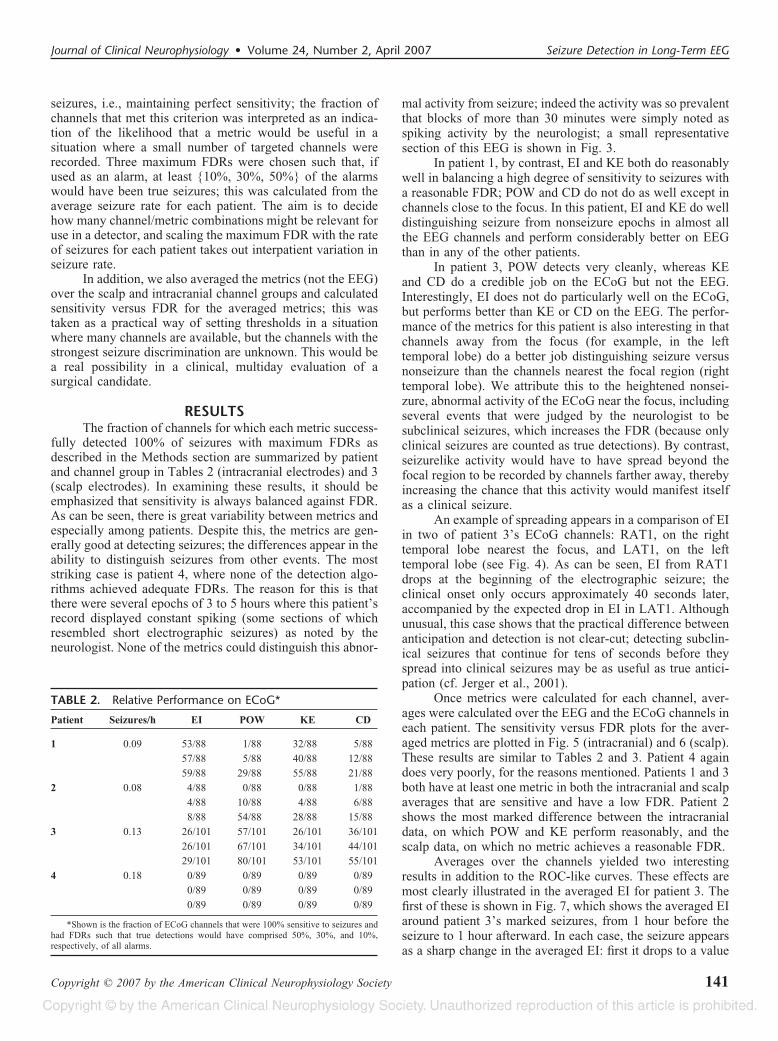
Once metrics were calculated for each channel, aver-ages were calculated over the EEG and the ECoG channels ineach patient. The sensitivity versus FDR plots for the aver-aged metrics are plotted in Fig. 5 (intracranial) and 6 (scalp).These results are similar to Tables 2 and 3. Patient 4 againdoes very poorly, for the reasons mentioned. Patients 1 and 3both have at least one metric in both the intracranial and scalpaverages that are sensitive and have a low FDR. Patient 2shows the most marked difference between the intracranialdata, on which POW and KE perform reasonably, and thescalp data, on which no metric achieves a reasonable FDR.
Averages over the channels yielded two interestingresults in addition to the ROC-like curves. These effects aremost clearly illustrated in the averaged EI for patient 3. Thefirst of these is shown in Fig. 7, which shows the averaged EIaround patient 3’s marked seizures, from 1 hour before theseizure to 1 hour afterward. In each case, the seizure appearsas a sharp change in the averaged EI: first it drops to a value
TABLE 2. Relative Performance on ECoG*
Patient Seizures/h EI POW KE CD
1 0.09 53/88 1/88 32/88 5/88
57/88 5/88 40/88 12/88
59/88 29/88 55/88 21/88
2 0.08 4/88 0/88 0/88 1/88
4/88 10/88 4/88 6/88
8/88 54/88 28/88 15/88
3 0.13 26/101 57/101 26/101 36/101
26/101 67/101 34/101 44/101
29/101 80/101 53/101 55/101
4 0.18 0/89 0/89 0/89 0/89
0/89 0/89 0/89 0/89
0/89 0/89 0/89 0/89
*Shown is the fraction of ECoG channels that were 100% sensitive to seizures andhad FDRs such that true detections would have comprised 50%, 30%, and 10%,respectively, of all alarms.
Journal of Clinical Neurophysiology • Volume 24, Number 2, April 2007 Seizure Detection in Long-Term EEG
Copyright © 2007 by the American Clinical Neurophysiology Society 141

lower than the preceding trend, and then rises to settlenoticeably above the trend value preceding the seizure. EItakes 5 to 15 minutes after the seizure ends before it stabilizesto a new trend value. The same pattern appears in EI for 5/7seizures in patient 1 in the ECoG electrode closest to thesuspected focus; the pattern is again evident in all fiveseizures in patient 2 when viewing EI of the ECoG electrodenearest the focus. Because the data windows are 20 secondslong, this recovery latency in EI is too long to be attributed toan artifact of the data analysis and appears to be a real effectindicative of the presence of a postictal period.
The second finding in the averaged data of patient 3 isa clear cycling in EI and KE with a period of a few hours; thecycling is continuous, does not seem to depend on the time ofday, and lasts for the entire 2-day record (see Fig. 8). Interest-ingly, it appears that, in this patient, seizures occur only when EItransitions from low to high (simultaneously, KE transitionsfrom high to low). The benefit of a multiday continuous recordis evident here, because if shorter segments were taken aroundthe seizure, then the cycling could have been mistaken foranticipation (see the selected segments in Fig. 7).
DISCUSSIONOur continuous analysis of long-term recordings shows
a broad variety of behavior; however, some interestingtrends appear even in this limited sample of four patients.
FIGURE 3. A 10-second page of abnormal EEG in patient 4. This abnormal activity, which continues for several hours at atime, is detected by all algorithms and is responsible for their abysmal FDR in patient 4.
FIGURE 4. Detection of electrographic versus clinical sei-zure in patient 3. EI from two channels of ECoG from pa-tient 3 is plotted: the solid line is from a channel (RAT1) inthe right temporal lobe nearest the suspected seizure focus,whereas the dotted line is from a channel (LAT1) in the lefttemporal lobe. The data are plotted from 2 minutes beforethe start of the clinical seizure to 2 minutes after, with theclinical seizure onset, represented by the middle vertical line,at t � 0. The electrographic onset and offset are marked bythe left and right vertical lines, respectively. The electro-graphic onset, and the response of RAT1, occurs about 40seconds before the clinical onset, which is tracked by LAT1.
Lee et al. Journal of Clinical Neurophysiology • Volume 24, Number 2, April 2007
Copyright © 2007 by the American Clinical Neurophysiology Society142
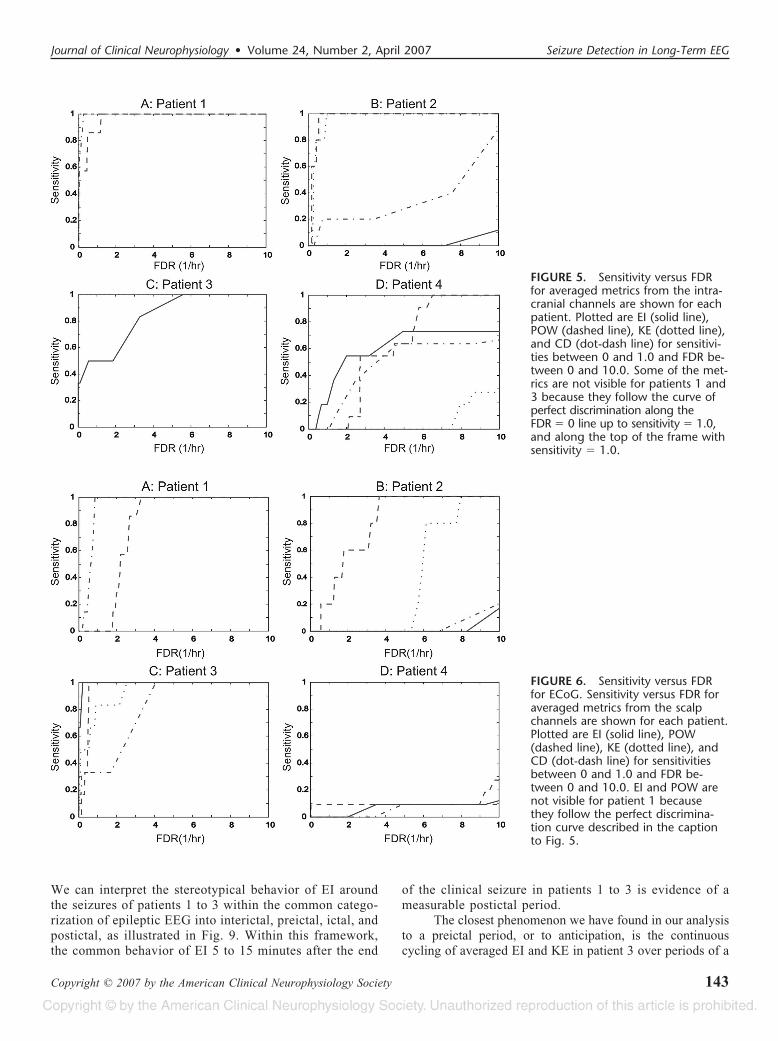
We can interpret the stereotypical behavior of EI aroundthe seizures of patients 1 to 3 within the common catego-rization of epileptic EEG into interictal, preictal, ictal, andpostictal, as illustrated in Fig. 9. Within this framework,the common behavior of EI 5 to 15 minutes after the end
of the clinical seizure in patients 1 to 3 is evidence of ameasurable postictal period.
The closest phenomenon we have found in our analysisto a preictal period, or to anticipation, is the continuouscycling of averaged EI and KE in patient 3 over periods of a
FIGURE 5. Sensitivity versus FDRfor averaged metrics from the intra-cranial channels are shown for eachpatient. Plotted are EI (solid line),POW (dashed line), KE (dotted line),and CD (dot-dash line) for sensitivi-ties between 0 and 1.0 and FDR be-tween 0 and 10.0. Some of the met-rics are not visible for patients 1 and3 because they follow the curve ofperfect discrimination along theFDR � 0 line up to sensitivity � 1.0,and along the top of the frame withsensitivity � 1.0.
FIGURE 6. Sensitivity versus FDRfor ECoG. Sensitivity versus FDR foraveraged metrics from the scalpchannels are shown for each patient.Plotted are EI (solid line), POW(dashed line), KE (dotted line), andCD (dot-dash line) for sensitivitiesbetween 0 and 1.0 and FDR be-tween 0 and 10.0. EI and POW arenot visible for patient 1 becausethey follow the perfect discrimina-tion curve described in the captionto Fig. 5.
Journal of Clinical Neurophysiology • Volume 24, Number 2, April 2007 Seizure Detection in Long-Term EEG
Copyright © 2007 by the American Clinical Neurophysiology Society 143

few hours between two trend levels. Seizures in this patientonly occurred during transitions between these two levels(always low to high in EI and high to low in KE), but manytransitions occurred with no corresponding seizure; therefore,the levels in these metrics before seizures cannot be taken asevidence that a preictal period has been detected, because
they do not always foreshadow a seizure. However, they mayindicate that the patient periodically visits a “vulnerable”abnormal state which does not lead deterministically to sei-zures, but which considerably heightens the likelihood thatthey will occur, as previously suggested by Lopes da Silva etal. (2003). Beyond this, we do not find any convincingevidence that any of the four metrics applied to our data setsanticipate seizures. Because we have used simple threshold-ing as the detection criterion, it is possible that a moresophisticated method, such as the use of neural networks tolink patterns within the derived metrics to seizure probabili-ties (Khan and Gotman, 2003), may yield more predictivepower (Mormann et al., 2005).
The performance of the detection metrics varied widelyamong the four patients. Not surprisingly, the metrics derivedfrom ECoG generally performed better than EEG (with theexception of patient 1, where the metrics performed very wellon scalp data). At least one of the algorithms performedreasonably well as a seizure detector in the three oldestpatients, but no single algorithm was able to meet our criteriafor a useful detector across these patients. Also, whereas notideal if only a few channels are available, the averagedmetrics tracked the performance of the underlying channelsfairly well. Thus, finding an optimal single channel may notbe a critical constraint, and it may instead be adequate toanalyze and average a metric over a group of channels when
FIGURE 7. Averaged EI for patient 3’s seizures. Plotted are averaged EI from –1 hour to �1 hour around all six seizures. EIappears to have a recovery period of 5 to 15 minutes after the seizure before settling to the new trend value. Also, cycling inthe trend of EI appears in some of these 2-hour windows and could be mistaken for anticipation (see arrows in panels A, B, E,and F).
TABLE 3. Relative Performance on EEG*
Patient Seizures/h EI POW KE CD
1 0.09 23/24 0/24 15/24 0/24
23/24 0/24 16/24 0/24
23/24 0/24 22/24 2/24
2 0.08 0/40 0/40 0/40 0/40
0/40 1/40 0/40 0/40
0/40 2/40 0/40 0/40
3 0.13 7/24 14/24 0/24 0/24
9/24 14/24 0/24 0/24
9/24 18/24 2/24 2/24
4 0.18 0/24 0/24 0/24 0/24
0/24 0/24 0/24 0/24
0/24 0/24 0/24 0/24
*Shown is the fraction of EEG channels that were 100% sensitive to seizures andhad FDRs such that true detections would have comprised 50%, 30%, and 10%,respectively, of all alarms.
Lee et al. Journal of Clinical Neurophysiology • Volume 24, Number 2, April 2007
Copyright © 2007 by the American Clinical Neurophysiology Society144
it is not feasible to find the single best one. Taken as a whole,it appears that these metrics are capable of useful seizuredetection, but that they must selected on a per-patient basisand combined with patient-specific thresholds (which may beconsidered a simple form of training) to be reliable.
Unfortunately, none of the algorithms tested couldadequately distinguish seizure from nonseizure EEG in pa-tient 4. It is not surprising that this patient stood out in the
group, because, at 13 months, she is by far the youngest of thefour patients, and developmental differences very likely con-tributed to the qualitative difference in the record betweenthis patient and the three older ones. Similar difficulties wereencountered by Faul et al., (2005) when testing detectionalgorithms in neonates.
Examining our single-channel scalp data, we found thatthe linear measures (EI and POW) were as effective overall at
FIGURE 8. Cycling in EI and KE ofpatient 3. The averaged EI and KEin patient 3 cycle between twotrend values with a period of sev-eral hours (46 hours are shown).Seizures (marked with verticallines) occur at the transitions be-tween the two levels.
FIGURE 9. Stages of seizure. EI fora seizure in patient 3 illustrates pos-sible stages leading up to and recov-ering from seizure. There is clear evi-dence of a postictal state that differsfrom the long-term trend followingit. Cycling of EI and KE in this pa-tient indicates the possible existenceof a vulnerable seizure-enabled inwhich the probability of seizure isgreatly increased.
Journal of Clinical Neurophysiology • Volume 24, Number 2, April 2007 Seizure Detection in Long-Term EEG
Copyright © 2007 by the American Clinical Neurophysiology Society 145
distinguishing seizures from background as the nonlinearmetrics (KE and CD). This is true regardless of whether wecompare the number of channels that met our FDR cutoff, asin Tables 2 and 3, or the sensitivity versus FDR of theaveraged metrics, as in Figs. 5 and 6. The linear measuresremain competitive even in the scalp EEG, where a presum-ably higher relative noise might at first seem to favor themore sophisticated nonlinear algorithms. Our results are con-sistent with the comparison of seizure prediction algorithms(distinguishing variable-length preictal periods versus ictal)by Mormann et al. (2005). Although more research is neededbefore a firm determination can be made, these early resultsare good news for computationally constrained portable de-vices because it appears that they may not have to sacrificesuperior effectiveness for computational efficiency.
Our experiences with these four algorithms applied toour patients have been mixed. The large variation in theeffectiveness of the different algorithms between patientspoints to the need to select or combine from a group ofmethods. At the same time, the promising scalp results frompatients 1 and 3 leave room for optimism about the possibilityof a robust and practical detector using currently availablemetrics. The main algorithmic constraint appears to be theminimization of FDRs to an acceptable level through ajudicious, and probably patient-specific, set of detectionthreshold criteria. This requires emphasis on real-world val-idation to determine whether a method is truly robust, testingconditions that only analysis of long-term data over manypatients can unambiguously provide.
ACKNOWLEDGMENTThe authors are grateful to Drs. V. L. Towle and K.
Lehnertz for useful discussions. This work was supported bythe Dr. Ralph and Marian Falk Medical Research Trust.
REFERENCESCasdagli MC, Iasemidis LD, Savit RS, et al. Non-linearity in invasive EEG
recording from patients with temporal lobe epilepsy. Electroencepha-logr Clin Neurophysiol. 1997;102:98–105.
Elger CE, Lehnertz K. Seizure prediction by non-linear time series analysisof brain electrical activity. Eur J Neurosci. 1998;10:786–789.
Engel J Jr, Van Ness P, Rasmussen T. Outcome with respect to epilepticseizures. In Engel J Jr (ed): Surgical treatment of the epilepsies, 2nd ed.New York: Raven Press, 1993:609–621.
Faul S, Boylan G, Connolly S, et al. An evaluation of automated neonatalseizure detection methods. Clin Neurophysiol. 2005;116:1533–1541.
Gabor AJ. Seizure detection using a self-organizing neural network: valida-tion and comparison with other detection strategies. ElectroencephalogrClin Neurophysiol. 1998;107:27–32.
Gotman J. Automatic recognition of epileptic seizures in the EEG. Electro-encephalogr Clin Neurophysiol. 1982;54:530–540.
Gotman J, Gloor P. Automatic recognition and quantification of interictalepileptic activity in the human scalp EEG. Electroencephalogr ClinNeurophysiol. 1976;41:513–529.
Green DM, Swets JA. Signal detection theory and psychophysics. New York:Wiley, 1966.
Grewel S, Gotman J. An automatic warning system for epileptic seizuresrecorded on intracerebral EEGs. Clin Neurophysiol. 2005;116:2460–2472.
Iasemidis LD, Sackellares JC, Zaveri HP, Williams WJ. Phase space topog-raphy and the Lyapunov exponent of electrocorticograms in partialseizures. Brain Topogr. 1990;2:187–201.
Jerger KK, Netoff TI, Francis JT, et al. Early seizure detection. J ClinNeurophysiol. 2001;18 :259–268.
Khan YU, Gotman J. Wavelet based automatic seizure detection in intrace-rebral electroencephalogram. Clin Neurophysiol. 2003;114:898–908.
Le Van Quyen M, Martinerie J, Navarro V, et al. Characterizing neurody-namic changes before seizures. J Clin Neurophysiol. 2001;18:191–208.
Lehnertz K, Andrzejak RG, Arnhold J, et al. Nonlinear EEG analysis inepilepsy: its possible use for interictal focus localization, seizure antic-ipation, and prevention. J Clin Neurophysiol. 2001;18:209–222.
Lehnertz K, Litt B. The first international collaborative workshop on seizureprediction: summary and data description. Clin Neurophysiol. 2005;116:493–505.
Lehnertz K, Mormann F, Osterhage H, et al. State-of-the-art of seizureprediction. J Clin Neurophysiol. 2007;XX;XXX–XXX.
Lopes da Silva FH, Blanes W, Kalitzin SN, et al. Dynamical diseases of brainsystems: different routes to epileptic seizures. IEEE Trans Biomed Eng.2003;50:540–548.
Mormann F, Andrzejak RG, Kreuz T, et al. Automated detection of apreseizure state based on a decrease in synchronization in intracranialelectroencephalogram recordings from epilepsy patients. Phys Rev E.2003;67:21912.
Mormann F, Kreuz T, Rieke C, et al. On the predictability of epilepticseizures. Clin Neurophysiol. 2005;116:569–587.
Park HS, Lee YH, Lee DS, Kim SI. Detection of epileptiform activity usingwavelet and neural network. Proceedings of the 19th InternationalConference IEEE/EMBS. 1997;1194–1197.
Press WH, Teukolsky SA, Vetterling WT, Flannery BP. Numerical recipesin C: the art of scientific computing, 2nd ed. New York: CambridgeUniversity Press, 1992.
Schouten JC, Takens F, van den Bleek CM. Maximum-likelihood estimationof the entropy of an attractor. Phys Rev E. 1994a;49:126–129.
Schouten JC, Takens F, van den Bleek CM. Estimation of the dimension ofa noisy attractor. Phys Rev E. 1994b;50:1851–1861.
Takens F. Detecting strange attractors in turbulence. In: Rand, DA YoungLS, eds. Dynamical systems and turbulence. Lecture notes in mathe-matics; vol 898. Berlin: Springer-Verlag, 1981:366–381.
Van Drongelen W, Nayak S, Frim D, et al. Seizure anticipation in pediatricepilepsy: use of Kolmogorov entropy. Pediatr Neurol. 2003;29 :207–213.
Van Drongelen W, Lee HC, Hecox KE. Seizure prediction in epilepsy. In: HeB (ed). Neural engineering. New York: Kluwer Academic Publishers,2005:389–419.
Wilson SB. A neural network method for automatic and incremental learningapplied to patient-dependent seizure detection. Clin Neurophysiol.2005;116:1785–1795.
Wilson SB. Seizure detection: evaluation of the Reveal algorithm. ClinNeurophysiol. 2004;115:2280–2290.
Lee et al. Journal of Clinical Neurophysiology • Volume 24, Number 2, April 2007
Copyright © 2007 by the American Clinical Neurophysiology Society146
Copyright © 2022 FDOKUMEN