Effect of Fluorine on Extracted Phases from Portland Cement Clinkers

al Research 165 (2007) 87–101www.elsevier.com/locate/jvolgeores
Journal of Volcanology and Geotherm
Environmental impact of magmatic fluorine emissionin the Mt. Etna area
Sergio Bellomo a,b,⁎, Alessandro Aiuppa a,b, Walter D’Alessandro b, Francesco Parello a
a Dipartimento CFTA, Università di Palermo, via Archirafi 36, 90123 Palermo, Italyb Istituto Nazionale di Geofisica e Vulcanologia, Sezione di Palermo, via La Malfa 153, 90146 Palermo, Italy
Received 5 April 2006; accepted 23 April 2007Available online 17 May 2007
Abstract
The sustained and uninterrupted plume degassing at Mount Etna volcano, Southern Italy, represents the troposphere's mostprominent natural source of fluorine. Of the ∼200 Mg of fluorine (as HFg) emitted daily by the volcano, 1.6±2.7 Mg are depositedby wet and dry deposition. Fluorine-deposition via volcanic ash, here characterised for the first time, can be quite significant duringvolcanic eruptions (i.e. 60 Mg of fluorine were deposited during the 2001 eruption through volcanic ash, corresponding to ∼85%of the total fluorine deposition). Despite the fact that these depositions are huge, the fate of the deposited fluorine and its impact onthe environment are poorly understood. We herein present original data on fluorine abundance in vegetation (Castanea Sativa andPinus Nigra) and andosoils from the volcano's flank, in the attempt to reveal the potential impact of volcanogenic fluorineemissions. Fluorine contents in chestnut leaves and pine needles are in the range 1.8–35 μg/g and 2.1–74 μg/g respectively; theyexceed the typical background concentrations in plants growing in rural areas, but fall within the lower range of typicalconcentrations in plants growing near high fluorine anthropogenic emission sources. The rare plume fumigations on the lowerflanks of Mt Etna (distanceN4 km from summit craters) are probably the cause of the “undisturbed” nature of Etnean vegetation:climatic conditions, which limit the growth of vegetation on the upper regione deserta, are a natural limit to the development ofmore severe impacts. High fluorine contents, associated with visible symptoms, were only measured in pine needles at three sites,located near recently-active (2001 to 2003) lateral eruptive fractures. Total fluorine contents (FTOT) in the Etnean soils have a rangeof 112–341 μg/g, and fall within the typical range of undisturbed soils; fluorine extracted with distilled water (FH2O) have a rangeof 5.1 to 61 μg/g and accounts for 2–40% of FTOT. FH2O is higher in topsoils from the eastern flank (downwind), while it decreaseswith depth in soil profiles and on increasing soil grain size (thereby testifying to its association with clay–mineral-rich, fine soilfractions). The fluorine adsorption capacity of the andosoils acts as a natural barrier that protects the groundwater system.© 2007 Elsevier B.V. All rights reserved.
Keywords: Mt. Etna; fluorine; environmental volcanology; impact of volcanic F; soils; vegetation; volcanic ash
⁎ Corresponding author. Dipartimento CFTA, Università di Palermo,via Archirafi 36, 90123 Palermo, Italy. Tel.: +39 091 6849409; fax: +39091 6849449.
E-mail address: [email protected] (S. Bellomo).
0377-0273/$ - see front matter © 2007 Elsevier B.V. All rights reserved.doi:10.1016/j.jvolgeores.2007.04.013
1. Introduction
Fluorine, the 13th most abundant element in theearth's crust, has the highest level of phyto-toxicity ofall air pollutants; fluorine-related damage to sensitiveplants can develop at concentration levels of 10 to10,000 times lower than those of other pollutants. After

88 S. Bellomo et al. / Journal of Volcanology and Geothermal Research 165 (2007) 87–101
O3, SO2 and nitrogen-containing air pollutants, fluorineoccupies the fourth place with regard to its detrimentaleffects on harvests, at least in the US (Weinstein andDavison, 2003).
Fluorine is released into the environment, mostlyunder the form of fluorides, by manifold human activi-ties, e.g. coal combustion and waste- and process-watersfrom various industrial activities (WHO, 2002). Thereis no doubt that inorganic fluoride represented one ofthe major air pollutants in the 20th century, damagingcrops, forests and natural vegetation, and causing fluo-rosis in factory workers, livestock and wild mammals.However, there have been enormous improvements overthe last 40 years in the containment and scrubbing ofemissions, so that modern fluoride-emitting industriesgenerally have little or no environmental impact outside
Fig. 1. Location of the sampling sites. Right: a sketch of Mt Etna's area. The gdashed line shows the border of the horseshoe-shaped valley named “Valle deThe summit craters are labelled as NE — North-East Crater; SE— South-Eadiscussed with more detail in the text are also indicated with their initials (L—with a number (31, 35 and 48). SAS, CIT and PRO are three vegetation sampfrom 700 hPa (bottom right— Birgi station dataset of the period 2001–200322°50′ to 202°50′ on the eastern flank) and upwind (squares— western flanksampled for more than one media; in this case the symbols are nested.
the factory fence at the present time (Weinstein andDavison, 2003).
Volcanoes represent the main natural persistent sourceof fluorine (Symonds et al., 1988; Halmer et al., 2002).Volcanic emissions of fluorine take the form of eithersluggish permanent release from quiescent volcanoes(passive degassing) or rarer, but more impacting, dis-charges during short-lived volcanic eruptions. Estimatesof the global volcanogenic fluorine flux range from 50 to8600 Gg/a (Cadle, 1980; Symonds et al., 1988; Halmeret al., 2002), with the former figure probably being anunderestimation.
The environmental impact of anthropogenic fluorineemissions has long been studied, taking into account themost significant source processes (i.e. coal burning, alu-minium smelters, phosphate fertiliser production) and all
rey bold line represents the limits the Etnean volcanic products; the boldl Bove”. Left: zoom of Etna's summit area (covered area, 15×15 km).st Crater; BN — Bocca Nuova; VOR — Voragine. Soil sampling sitesLeccio; R— Roverella; F— Faggio: E3— Etna3; E5— Etna5) or
ling sites with peculiar features (see text). On the basis of the wind rose), the sampling sites were subdivided in downwind (diamonds— from) with respect to the summit crater's emissions. Some of the sites were

Fig. 2. Isolines of fluorine deposition (g/m2) via volcanic ash on thesouth-eastern flank of Mt. Etna during the 2001 eruption.
89S. Bellomo et al. / Journal of Volcanology and Geothermal Research 165 (2007) 87–101
types of receptors (i.e. air, glaciers, surface waters, vege-tation, soils, wildlife). On the other hand, the effects ofvolcanogenic fluorine emissions are far less characte-rised (Georgsson and Petursson, 1972; Fridriksson, 1983;Araya et al., 1990). More importantly, while the impact offluorine emitted during explosive volcanic eruptions hasbeen evaluated (Thorarinsson, 1979; Oskarsson, 1980;Cronin et al., 2003), the effects of passive degassing arestill poorly understood. In this context, the few studiesavailable effected at a few volcanoes (Guadeloupe —Garrec et al., 1977; Masaya — Garrec et al., 1984;Delmelle et al., 2002, 2003; Etna — Garrec et al., 1984;Notcutt and Davies, 1989; Aiuppa et al., 2001; Hawaii—Harding and Miller, 1982; Notcutt and Davies, 1993;Furnas—Notcutt and Davies, 1999; Stromboli Island—Bellomo et al., 2003) have documented the potentialimpact of passive degassing on downwind ecosystems(Delmelle et al., 2002; Delmelle, 2003).
Mount Etna is the largest known point source ofatmospheric fluorine on a global scale, contributing about70 Gg/a (Francis et al., 1998), even more than today'sestimated anthropogenic release over all Western Europe(Preunkert et al., 2001). The increase in fluorine depo-sitions around the volcano has already been documented(Aiuppa et al., 2004a, 2006). Here, we use Mount Etna asa test site for a comprehensive characterisation of fluorine-related volcanic effects on the environment, by combininganalyses on both vegetation and soils. An assessment ofthe potential fluorine deposition via volcanic ashes, pre-viously undetermined, is also provided.
2. Study area and methods
2.1. Study area
Mt. Etna is a large (1200 km2) 0.6 Ma old strato-volcano (Chester et al., 1985; Bonaccorso et al., 2004),located on the East Ionian coast of Sicily (Fig. 1). Themost striking feature of Etna's most recent activity hasbeen the un-interrupted passive emissions of magmaticvolatiles from four active summit vents,making the volca-no the world's most active point source emitter of SO2
(with a time-averaged emission rate of 5500 Mg/d for the1987–2000 period; Caltabiano et al., 2004), and of manyother environmentally-relevant volatiles (Gauthier and LeCloarec, 1998). In most atmospheric conditions, Etna'ssummit plume is dispersed by winds blowing at about thesame altitude as the emission point. Very strong westerlywinds often funnel the plume down into the Valle delBove depression (Fig. 1), leading to fumigation of therims of the Valle del Bove itself and the upper easternflanks of the volcano (Aiuppa et al., 2004a).
Summit and lateral eruptions (Branca and Del Carlo,2005), emitting lavas and pyroclasts of hawaiitic com-position, occasionally interrupt quiescent degassing. Ashort but intense flank eruption occurred on 17 July–9August 2001, emitting an unusually high proportion ofpyroclastic material (Behncke and Neri, 2003) andpreceded by 15 strong strombolian to lava fountain epi-sodes at the SE crater. Besides abundant lava effusiveactivity from a S-trending 10-km long eruptive fracture,intense ash emissions were produced by a newly openedvent at 2550 m a.s.l., with an ash veil that covered theentire south-eastern sector of the volcano. After about oneyear of quiescence, characterised by unusually low SO2
emission rates from the summit craters, a new lateraleruption started on October 27, 2002 (Andronico et al.,2005). This eruption, which lasted until the end of January2003, was characterized by ash emissions that were evenstronger than those which occurred during the 2001 event(Andronico et al., 2005).
2.2. Climate and vegetation cover
Mt. Etna experiences a vertically stratified climate thatranges from sub-tropical conditions on its lower flanks

90 S. Bellomo et al. / Journal of Volcanology and Geothermal Research 165 (2007) 87–101
through temperate to cold ones at the summit area.Precipitation is strongly influenced by elevation andexposure: rainfall is concentrated on the eastern flank ofthe volcano, as the volcano itself induces condensation ofwet air masses coming from the Ionian Sea. Thirty-yearaveraged data (1965–94) indicate that rainfall ranges from400 mm on the lower south-west flank to 1200 mm atabout 700m elevation on the east flank,with amean valueof about 800 mm for the entire area. All sectors displaymaximum precipitation in the autumn–winter season(mostly in October) while the minimum is always in July.
Meteorological soundings made at the Italian AirForce station of Birgi, about 200 km west of the volcano,are considered a proxy for wind speed and direction onEtna's summit crater area (Caltabiano et al., 1994). Based
Table 1Fluorine concentrations in ash leachates and deposition data
Site km F μg/g ash dep. total F dep. Φ=−2
g/m2 g/m2
E 37 2.7 40.6 11,490 0.466 17.7E 38 3.3 37.9 21,830 0.828 31.1E 43 4.0 37.5 9550 0.358 19.5E 39 4.3 51.0 18,000 0.917 26.5E 44 4.7 29.0 23,800 0.691 15.0E 40 5.0 62.6 5750 0.360 n.s.E 06 5.8 46.7 2550 0.119 n.s.E 45 6.0 34.4 12,170 0.418 n.s.E 41 6.2 61.8 5570 0.344 n.s.E 46 6.5 61.1 2330 0.142 n.s.E 42 6.8 69.6 3980 0.277 n.s.E 36 7.2 39.3 4190 0.165 n.s.E 05 8.3 39.2 2710 0.106 n.s.E 04 9.3 49.6 1960 0.097 n.s.E 08 10.0 55.4 340 0.019 n.s.E 03 10.5 58.2 1210 0.070 n.s.E 07 10.7 74.7 730 0.055 n.s.E 09 11.5 56.6 1820 0.103 n.s.E 29 12.7 40.8 2025 0.083 n.s.E 17 13.0 51.8 300 0.016 n.s.E 32 13.0 65.0 3330 0.217 n.s.E 02 13.7 86.7 390 0.034 n.s.E 25 14.0 71.9 2400 0.173 n.s.E 10 15.0 52.8 3090 0.163 n.s.E 01 15.3 54.9 435 0.024 n.s.E 26 15.8 65.5 1410 0.092 n.s.E 23 16.0 95.9 520 0.050 n.s.E 22 16.3 75.5 2730 0.206 n.s.E 33 16.7 63.3 3450 0.218 n.s.E 13 17.8 98.0 650 0.064 n.s.E 28 20.2 60.4 1510 0.091 n.s.E 34 22.5 67.4 550 0.037 n.s.E 20 23.0 67.4 900 0.061 n.s.E 19 24.5 62.0 390 0.024 n.s.
km=distance from the 2550mvent of the July–August 2001 lateral eruption; ash(bulk sample); leachable fluorine analysis performed on separate grain-size clas
on Birgi station's 1997–2003 dataset (http://weather.uwyo.edu/upperair/sounding.html), Fig. 1 shows a gen-eral increase in wind force and highlights the prevalence(47%) of westerly to north-westerly winds at 700 hPa(corresponding to a mean altitude of about 3100 m). Thestudy area can thus be distinguished in downwind areas,from 22°50′ to 202°50′ (east), and upwind areas from202°50′ to 22°50′ (west) (black line in Fig. 1). The wes-tern, upwind flank is sometimes affected by summit crateremissions, albeit rarely.
On a parallel with the climatic conditions, vegetationalso displays variations with altitude. Three such zonescan be recognised (Chester et al., 1985). The first one(regione pedemontana), which extends from sea level to1000 m, is the most intensively exploited for agricultural
Φ=−1 Φ=0 Φ=1 Φ=2 Φ=3 Φ=4 Φ=5
F μg/g
28.6 31.9 36.8 53.5 109 295 n.s.34.0 36.4 33.5 46.3 96.9 222 n.s.24.5 26.6 33.5 49.7 95.8 269 n.s.33.3 38.7 48.0 61.7 109 187 n.s.21.4 24.2 26.7 30.7 83.3 229 n.s.37.0 46.7 53.7 61.2 86.7 160 267n.s. n.s. n.s. n.s. n.s. n.s. n.s.22.9 28.5 28.1 34.3 65.6 231 n.s.36.5 41.4 54.0 60.5 73.4 121 235n.s. n.s. 49.5 56.9 100 n.s. n.s.n.s. 54.2 54.1 61.4 82.8 151 259n.s. 25.0 29.7 34.6 68.0 206 n.s.n.s. 45.8 37.9 33.0 43.5 60.7 140n.s. 40.6 53.3 42.8 49.5 76.0 184n.s. n.s. n.s. n.s. n.s. n.s. n.s.n.s. n.s. 92.0 47.4 46.2 85.4 222n.s. n.s. n.s. n.s. n.s. n.s. n.s.n.s. 39.0 44.6 58.6 53.7 99.2 249n.s. n.s. 33.4 35.2 47.7 86.2 413n.s. n.s. n.s. n.s. n.s. n.s. n.s.n.s. n.s. 38.6 57.1 66.8 114 275n.s. n.s. n.s. n.s. n.s. n.s. n.s.n.s. 52.0 56.6 71.2 84.0 112 295n.s. n.s. 53.5 50.1 48.4 79.0 280n.s. n.s. n.s. n.s. n.s. n.s. n.s.n.s. n.s. 53.7 50.3 65.5 85.9 239n.s. n.s. n.s. n.s. n.s. n.s. n.s.n.s. 63.3 69.6 71.8 68.4 100 235n.s. n.s. 40.6 58.0 65.2 164 326n.s. n.s. n.s. n.s. n.s. n.s. n.s.n.s. n.s. 61.2 59.2 52.1 84.4 476n.s. n.s. 52.6 59.8 65.0 127 306n.s. n.s. n.s. n.s. n.s. n.s. n.s.n.s. n.s. n.s. 58.2 59.2 62.0 306
dep. = total ash deposition; totalF dep. = total leachable fluorine depositionses (Φ=-log2 grain size in mm) are also reported. n.s. = no sample.
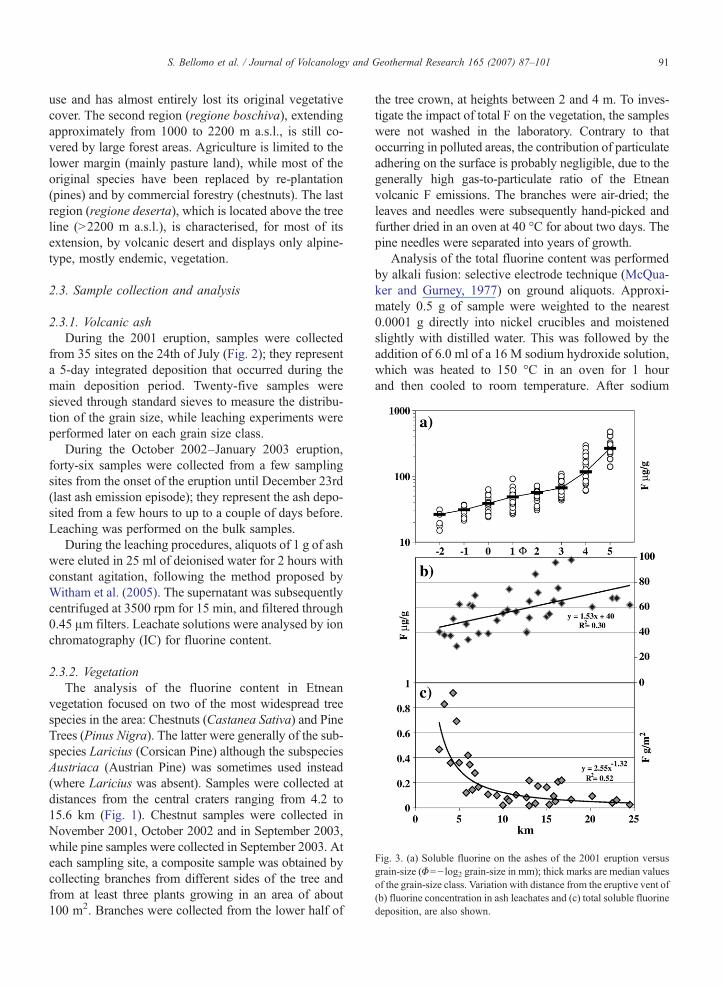
Fig. 3. (a) Soluble fluorine on the ashes of the 2001 eruption versusgrain-size (Φ=− log2 grain-size in mm); thick marks are median valuesof the grain-size class. Variation with distance from the eruptive vent of(b) fluorine concentration in ash leachates and (c) total soluble fluorinedeposition, are also shown.
91S. Bellomo et al. / Journal of Volcanology and Geothermal Research 165 (2007) 87–101
use and has almost entirely lost its original vegetativecover. The second region (regione boschiva), extendingapproximately from 1000 to 2200 m a.s.l., is still co-vered by large forest areas. Agriculture is limited to thelower margin (mainly pasture land), while most of theoriginal species have been replaced by re-plantation(pines) and by commercial forestry (chestnuts). The lastregion (regione deserta), which is located above the treeline (N2200 m a.s.l.), is characterised, for most of itsextension, by volcanic desert and displays only alpine-type, mostly endemic, vegetation.
2.3. Sample collection and analysis
2.3.1. Volcanic ashDuring the 2001 eruption, samples were collected
from 35 sites on the 24th of July (Fig. 2); they representa 5-day integrated deposition that occurred during themain deposition period. Twenty-five samples weresieved through standard sieves to measure the distribu-tion of the grain size, while leaching experiments wereperformed later on each grain size class.
During the October 2002–January 2003 eruption,forty-six samples were collected from a few samplingsites from the onset of the eruption until December 23rd(last ash emission episode); they represent the ash depo-sited from a few hours to up to a couple of days before.Leaching was performed on the bulk samples.
During the leaching procedures, aliquots of 1 g of ashwere eluted in 25 ml of deionised water for 2 hours withconstant agitation, following the method proposed byWitham et al. (2005). The supernatant was subsequentlycentrifuged at 3500 rpm for 15 min, and filtered through0.45 μm filters. Leachate solutions were analysed by ionchromatography (IC) for fluorine content.
2.3.2. VegetationThe analysis of the fluorine content in Etnean
vegetation focused on two of the most widespread treespecies in the area: Chestnuts (Castanea Sativa) and PineTrees (Pinus Nigra). The latter were generally of the sub-species Laricius (Corsican Pine) although the subspeciesAustriaca (Austrian Pine) was sometimes used instead(where Laricius was absent). Samples were collected atdistances from the central craters ranging from 4.2 to15.6 km (Fig. 1). Chestnut samples were collected inNovember 2001, October 2002 and in September 2003,while pine samples were collected in September 2003. Ateach sampling site, a composite sample was obtained bycollecting branches from different sides of the tree andfrom at least three plants growing in an area of about100 m2. Branches were collected from the lower half of
the tree crown, at heights between 2 and 4 m. To inves-tigate the impact of total F on the vegetation, the sampleswere not washed in the laboratory. Contrary to thatoccurring in polluted areas, the contribution of particulateadhering on the surface is probably negligible, due to thegenerally high gas-to-particulate ratio of the Etneanvolcanic F emissions. The branches were air-dried; theleaves and needles were subsequently hand-picked andfurther dried in an oven at 40 °C for about two days. Thepine needles were separated into years of growth.
Analysis of the total fluorine content was performedby alkali fusion: selective electrode technique (McQua-ker and Gurney, 1977) on ground aliquots. Approxi-mately 0.5 g of sample were weighted to the nearest0.0001 g directly into nickel crucibles and moistenedslightly with distilled water. This was followed by theaddition of 6.0 ml of a 16 M sodium hydroxide solution,which was heated to 150 °C in an oven for 1 hourand then cooled to room temperature. After sodium

92 S. Bellomo et al. / Journal of Volcanology and Geothermal Research 165 (2007) 87–101
hydroxide had solidified, the crucible was placed in amuffle furnace at 300 °C. The temperature was thenraised to 600 °C and the sample fused at this temperaturefor 30 min. After cooling, 10 ml of distilled water wereadded to the sample and slightly heated to facilitate thedissolution of the fusion cake. About 8 ml of concen-trated hydrochloric acid were added drop-wise, thusdecreasing the pH from 12.0–13.0 to 8.0 – 8.5 under thecontrol of a pH meter. Subsequently the samples weretransferred to a 50 ml volumetric flask, diluted to vo-lume, and then filtered (0.45 μm). This step eliminatedmost of the Al and Fe, both of which interfere with Fdeterminations obtained using the ion-selective elec-trode (McQuaker and Gurney, 1977). Determinationswere performed on 20 ml aliquots to which 2 ml of ionicstrength buffer (TISAB 3 — Fluka) were added, the pHof which was adjusted to obtain a value of 5.2 – 5.4.Reagent blanks were always prepared together with thesamples, and used for blank determinations as well asfor preparing standard solutions (with fluoride con-centrations of 0.05, 0.1, 0.25, 0.5, 1, 2.5, 5 and 10 mg/l).Both standards and samples were analysed using anOrion fluoride ion-selective electrode. The results areexpressed in μg/g on a dry weight basis. The detectionlimit is 1 μg/g and precision≤20%.
Table 2Fluorine contents in chestnut leaves and in pine needles collected in the Etn
Site Chestnut leaves
2001 2002 2003 km Site
SLN 7.5 6.7 CITZOA 35 7.3 PROVZA 25 16 7.3 SASZOB 17 7.6 SLNPDV 7.8 22 11 7.6 CUBCUB 29 5.0 7.8 LINSFO 10 8.5 SLIMCL 23 7.5 8.9 TARSVC 1.8 10 9.8 NICSGI 9.6 19 8.4 10.2 CAZSNI 11 10.5 SMTLIN 6.1 5.7 11.5 GALSLI 7.4 12.9 INTTAR 5.2 13.1 RAGCAZ 5.7 14.8 SMLFIL 5.8 6.9 BROINT 7.1 7.3 4.9 7.8 TLRRAG 6.3 8.1 RANSML 6.1 10.5 MALBRO 11 6.7 11.0 VERTLR 6.1 11.9RAN 7.6 13.2VER 4.2 15.6
Concentrations are expressed as µg/g of dry weight; km=distance from the ssamples collected in 2003 are subdivided into years of growth.
2.3.3. SoilsOur study comprises 57 soil-sampling sites (Fig. 1),
selected for their minor anthropogenic disturbance and fortheir distance from the summit craters, which ranged be-tween 3.7 and 16 km. Samples, were collected betweenJune and July 2002. At each sampling site, a compositesample of the first 5 cm of the soil profile was collected,each of which was composed of at least 4 points within anarea of about 100 m2.
Five soil profiles of different depths (50–130 cm)were also investigated, from areas both downwind andupwind from the summit craters (L, R, F, E3 and E5 inFig. 1). All the profiles were divided into sub-samples,corresponding to different pyroclastic layers rather thanto true pedogenic horizons (Bellanca et al., 1996).
The soils were air dried, sieved through a 2 mm sieveand thoroughlymixed.An aliquot of each samplewas usedto characterize grain-size distribution. The soil sampleswere analysed for: total fluorine content (FTOT); fluorineextractable with acid oxalate (FOX), which represents thefluorine aliquot bonded to amorphous phases like allo-phane and imogolite; and water soluble fluorine (FH2O),the least bounded form. FOX includes FH2O, while FTOTincludes both FOX and FH2O. Analysis of the total fluorinecontent (FTOT) was performed by alkali fusion using the
ean area
Pine needles
IV III II I km
64 49 26 6.0 5.826 36 5.5 5.974 64 16 5.9
6.5 9.1 6.0 3.0 6.713 9.3 11 2.1 7.8
5.4 3.9 3.6 11.53.9 7.3 4.7 2.4 12.92.9 5.5 3.4 2.8 13.1
4.2 3.7 2.4 14.32.3 5.1 4.2 3.2 14.810 7.7 7.2 7.4 4.2
5.7 8.2 5.0 4.32.9 5.9 4.1 2.9 7.85.5 8.6 4.8 4.0 8.14.0 6.3 3.6 4.0 10.54.4 6.3 4.6 3.7 11.05.3 8.2 4.4 3.8 11.9
2.7 3.8 2.8 13.27.8 6.2 6.3 14.2
2.2 7.2 5.0 4.1 15.6
ummit craters; sites upwind from the summit crater are in italics. Pine

93S. Bellomo et al. / Journal of Volcanology and Geothermal Research 165 (2007) 87–101
selective electrode technique (cfr. 2.3.2). The detectionlimit is 1 μg/g and precision≤10%. Oxalate extractablefluoride (FOX) was determined at a soil/solution ratio of 1/
Fig. 5. Fluorine contents in pine needles as a function of their year ofgrowth. Anomalous accumulation in the sites PRO, CIT and SAS arehighlighted.
50 in an extraction solution of 0.2 M ammonium oxalateand 0.2Moxalic acid at pH3 (Blakemore et al., 1987). Thesamples were shaken for 4 hours in the dark, centrifugedand filtered, following which the concentration of fluorinewas determined using a combination fluoride electrode(Orion), after the addition of a total ionic strength buffer(TISAB 3 Fluka) for decomplexation of fluoride. For theanalysis of FH2O, aliquots of the soil were leached with asoil/water ratio of 1/50 for 18 h while continuouslyshaking. The suspension was then centrifuged for 15 minat 5000 rpm and the supernatant filtered (0.2 μm) andanalysed by IC.
Fluorine adsorption experiments were made on thesub-samples of the two profiles (Etna3 and Etna5). Analiquot of 2 g of each sub-sample was equilibrated, at
Fig. 4. Variation with distance from the summit craters of (a) Hydrogenfluoride in air (data from Aiuppa et al., 2004a); (b) fluoride bulkdeposition (data from Aiuppa et al., 2006); (c) fluorine content inchestnut leaves; (d) fluorine content in pine needles; (e) water extrac-table, (f) oxalate extractable and (g) total fluorine in topsoils. Samplescollected downwind with respect to the summit crater are shown as greydiamonds, while those collected upwind as black squares. The linelabelled as dl in graph (a) indicates the detection limit of the method. Theencircled samples in (d) are discussed further in Fig. 5.

Table 3Fluorine contents in the Etnean soils
Topsoils Soil profiles
FH2O FOX FTOT Depth FH2O FOX FTOT
Site km μg/g cm μg/g
ETS40 4.3 16.0 139 155 RoverellaETS41 4.8 8.2 113 202 0–18 13.0 79 228ETS51 4.8 20.7 158 331 10–18 17.4 48 171ETS42 5.4 10.1 147 295 18–30 18.3 61 223ETS31 5.5 13.8 112 163 30–55 12.5 82 228ETS35 5.7 44.5 134 273 55–120 5.5 153 481ETS36 5.7 28.3 80 150 FaggioETS30 5.8 27.1 187 313 0–6 14.1 93 240ETS07 6.0 11.0 84 265 6–10 18.3 79 240ETS32 6.5 38.4 132 324 10–15 19.0 105 228ETS34 6.7 20.8 125 341 15–50 11.5 74 330ETS43 6.8 21.9 133 322 LeccioETS38 7.0 29.9 154 310 0–2 12.4 50 233ETS52 7.0 31.3 104 285 2–6 14.1 71 220ETS33 7.3 22.4 121 295 6–20 11.9 70 273ETS06 7.6 18.7 136 198 20–60 10.6 136 275ETS39 7.6 30.6 196 215 60–100 10.6 147 490ETS08 7.7 33.9 149 170 Etna 3ETS44 7.7 37.5 154 178 0–0.5 19.1 112 270ETS05 8.0 35.3 175 255 0.5–3 13.0 74 195ETS53 8.4 5.1 70 308 3–35 14.9 93 149ETS28 8.7 17.1 96 325 35–75 7.6 81 201ETS09 8.8 15.9 110 257 75–80 10.0 80 162ETS37 9.0 22.6 125 285 80–90 8.5 65 303ETS45 9.3 24.2 120 306 90–92 10.2 73 306ETS03 9.4 16.4 106 183 92–130 5.0 51 313ETS04 9.4 24.5 137 285 Etna 5ETS46 9.6 27.9 123 275 0–15 27.1 112 252ETS02 10.4 19.2 134 225 15–32 27.4 91 247ETS54 10.5 14.6 91 158 32–35 24.3 54 195ETS01 11.6 7.9 115 208 35–38 6.0 43 183ETS55 11.6 11.8 94 120 38–60 28.7 66 332ETS50 11.7 11.4 138 246ETS56 14.3 10.5 80 112 Grain sizes
ETS57 16.0 8.5 66 154 Φ FH2O FOX FTOT
ETS15 3.7 8.8 104 183 μg/g
ETS16 3.7 17.6 110 265 ETS 31ETS13 4.3 17.0 129 202 −1 6.7 90 117ETS17 4.3 20.5 174 251 0 7.4 102 159ETS18 4.4 61.2 143 154 1 11.5 86 179ETS12 4.7 31.7 106 210 2 17.0 96 277ETS21 5.0 18.0 132 214 3 21.0 143 287ETS11 5.6 22.2 165 231 4 26.8 129 220ETS14 5.7 20.8 97 177 ETS 35ETS19 6.1 15.0 104 142 −1 17.5 149 211ETS10 6.6 19.6 117 256 0 22.4 123 211ETS47 7.4 9.9 65 138 1 35.7 130 277ETS20 7.5 11.3 65 172 2 39.4 154 303ETS22 7.9 15.5 70 160 3 47.2 186 349ETS26 7.9 16.8 124 214 4 43.9 199 290ETS27 8.0 23.9 117 227 ETS 48ETS25 8.4 21.3 112 208 −1 5.5 70 152ETS23 8.7 22.8 78 202 0 6.0 64 230
Topsoils Grain sizes
FH2O FOX FTOT Φ FH2O FOX FTOT
Site km μg/g μg/g
ETS24 8.7 18.9 67 206 1 5.6 70 252ETS48 9.3 7.0 71 214 2 6.0 73 241ETS29 10.4 11.0 79 141 3 7.3 76 287ETS49 10.6 12.2 40 124 4 6.0 64 319
FH2O=fluorine extracted using distilled water; FOX=fluorine extractedusing acid oxalate; FTOT=total fluorine content; km=distance fromsummit craters; sites upwind from the summit crater are in italics;Φ=log2grain size in mm.
Table 3 (continued )
94 S. Bellomo et al. / Journal of Volcanology and Geothermal Research 165 (2007) 87–101
room temperature and under constant shaking, with 50mlof rainwater (F=3.8 mg/l). About 1 ml of the surnatantwas sampled after centrifugation and analyzed by IC after2, 4, 8, 24, and 192 h.
3. Results
3.1. Volcanic ash
The fluorine concentrations in the ash leachates fromthe 2001 eruption are listed in Table 1. The volcanic ashsamples have cumulative (e.g., all grain sizes considered)leachable fluorine concentrations in the range 15–476 μg/g. As observed previously at other volcanoes (e.g., Hekla;Oskarsson, 1980), fluorine concentrations increase withdecreasing grain size (Fig. 3a), the finest portions (Φ=5)being one order of magnitude richer in fluorine than thecoarsest ones (Φ=−2). In fact, the larger surface/volumeratio of the finer portions favours soluble salt condensa-tion. Distal sites are generally richer in finer classes thanproximal ones: soluble fluorine thus displays a positivedependence on distance from the eruptive vents (Fig. 3b).By combining these soluble fluorine concentrations withtotal ash deposition (Table 1), we have estimated thefluorine depositions at the various sites to be in the orderof 24–917 mg/m2 (Fig. 3c); this gives an integratedfluorine deposition of∼30Mg for the first five days of theeruption. Considering that the ash deposition nearly dou-bled during the following 25th July–5th August period,we suggest that ∼60 Mg of fluorine were deposited to-gether with ashes during the 2001 eruption.
The estimation of the total fluorine deposition ofthe 2002–2003 eruption is more uncertain because of theuneven distribution of the sampling points and irregularcollection times. The figure of ∼1 Gg of depositedfluorine was obtained assuming that ∼10% of the totalemitted ash (40–50×106 m3 — Andronico et al., 2005)was deposited on the Etnean area, and considering themedian value of 74 μg/g for leachable fluorine content.

Fig. 6. Total (FTOT), acid oxalate extractable (FOX) and waterextractable (FH2O) fluorine contents in the grain-size classes of threeEtnean topsoils. Samples 31 and 35 were collected downwind from thesummit craters, while sample 48 was collected upwind.
95S. Bellomo et al. / Journal of Volcanology and Geothermal Research 165 (2007) 87–101
3.2. Vegetation
The fluorine content of chestnut leaves and pineneedles, reported in Table 2, range from 1.8 to 35 μg/gand from 2.1 to 74 μg/g respectively, which is consistentwith previous data on grass and lichens collected fromEtna in 1987 (Notcutt and Davies, 1989).
No clear dependence of F content on distance from thesummit craters has been observed, either in chestnutleaves (Fig. 4c) or in pine needles (Fig. 4d). This contrastswith the remarkable negative concentration–distancerelation observed for both HF atmospheric concentrations(Fig. 4a—Aiuppa et al., 2004a) and fluorine bulk (wet+dry) depositions (Fig. 4b — Aiuppa et al., 2001, 2006).Nonetheless, fluorine concentrationsN10 μg/g are anexclusive feature of vegetation collected downwind fromthe vents and at distances of b10 km.
Chestnut leaves from the 2002 campaign display thehighest fluorine concentrations. This finding, which is notconfirmed in pine needles growing in the same period(2nd year), cannot be explained by higher emissions fromthe summit craters: plume emissions were, in fact,anomalously low in that period, with SO2 output ratesbeing b1000 t/d (see below, Section 4.1). Since SO2 in theatmosphere reduces stomatal conductance, thereby actingagainst fluorine accumulation in vegetation (Weinstein,1977), we speculate that the reduced SO2 emission during2002, and consequently the lower concentrations in theatmosphere, could possibly have induced a higher F accu-mulation. Furthermore, environmental conditions mighthave determined these differences. Rainfall was lessintense and farther back in time (up to one week) beforethe 2002 sampling survey than during the 2001 and 2003surveys. Therefore, either the 2002 samples contain somecontribution from F deposited on the surface of the leaves,or the 2001 and 2003 samples suffered F leaching frominside the leaves due to intense rainfall (Vike, 2005).
Anomalously high values were also measured in pineneedles at three sites (Figs. 4d and 5). These are locateddownwind from Etna's summit area, and they are alsoclose to the lateral eruptive fractures that opened duringthe 2001 (SAS) and 2002–2003 (PROandCIT) eruptions.
3.3. Soils
The fluorine content in the soils is reported in Table 3.The total fluorine content (FTOT) of the 57 topsoilsamples ranges between 112 and 341 μg/g; fluorineextracted with oxalate (FOX) ranges between 40 and196 μg/g (accounting for 23 to 93% of FTOT), whilefluorine extracted with distilled water (FH2O) rangesfrom 5.1 to 61 μg/g (2–40% of FTOT). Fig. 4e, f, and g
show the variation with distance from the summit cratersof FTOT, FOX and FH2O; they highlight the fact that thetopsoils from the eastern, downwind sector of the vol-cano are typically richer in fluorine than the soils on thewestern, upwind flank.
Fig. 6 plots FTOT, FOX and FH2O for the differentgrain sizes of three topsoil samples. Sample 48 wascollected from the upwind flank of the volcano, while theremaining two were collected from the downwind flank(31 and 35). The three samples (and particularly samples31 and 35) display increasing FTOT, FOX and FH2O
contents with decreasing grain size, thus indicating thegreater affinity of fluorine for mineralogical phase(s)enriched in the finer fractions of the soil (e.g. clay mine-rals and Al- and Fe-bearing amorphous phases; Perrottet al., 1976; Bellanca et al., 1996).
Fig. 7 investigates the vertical distribution of FTOT,FOX and FH2O on the soil profile. FTOT displays a

Fig. 7. Depth-profiles of total (FTOT), acid oxalate extractable (FOX) and water extractable (FH2O) fluorine contents in five soils. In the bottom rightgraph, FH2O of all profiles are plotted together with an enlarged scale.
96 S. Bellomo et al. / Journal of Volcanology and Geothermal Research 165 (2007) 87–101
greater range with respect to topsoils (149–490 μg/g—Table 3) with an increasing trend with depth. FOX
displays a range of values similar to that of topsoils (43–153 μg/g — Table 3), increasing trends in the upwindprofiles (Faggio, Leccio and Roverella) and a decreasingtrend in the downwind profiles (Etna3 and Etna 5). FH2O
shows a decreasing trend with depth in all the studiedprofiles.
4. Discussion
4.1. Fluorine release and deposition at Mount Etna
In accordance with spectroscopic observations (Fran-cis et al., 1998), fluorine is emitted by the volcanomostlyunder the form of HF(g). Based on a long-term averageSO2 emission rate of 5560 Mg/d for the 1987–2000period (Caltabiano et al., 2004) and an SO2/HF plumemass ratio of ∼27 (Francis et al., 1998; Pennisi and Le-Cloarec, 1998; Aiuppa et al., 2002; Burton et al., 2003;Aiuppa et al., 2004b), mean HF emission rates from thevolcano can be evaluated at ∼200 Mg/d (Fig. 8).
Thismagmatic fluorine is “the startingmaterial” for theanomalous F deposition to the terrestrial environment. AtEtna, fluorine deposition rates as high as 68mg/m2/d havebeen reported (Aiuppa et al., 2006). In comparison, typicaldepositions on remote locations such as the Alps andGreenland range from 0.00025 to 0.018 mg/m2/d (De
Angelis and Legrand, 1994; Eichler et al., 2000; Preunkertet al., 2001). The lowest deposition rates on Etna(0.05 mg/m2/d; Aiuppa et al., 2006), measured on theupwind flank, are comparable with background values inindustrialised areas (0.03–0.3 mg/m2/d; Elias et al., 1995;Saether et al., 1995; Chandrawanshi and Patel, 1999;Matschullat et al., 2000). The highest rate, typical of thevolcano's summit, exceed the characteristic range of fluo-rine depositions in heavily polluted areas (0.6–7mg/m2/d;Kauranen, 1978; Saether et al., 1995; Mayer et al., 2000).They are even higher than depositions found in areassurrounding active volcanoes such as Kilauea, Hawaii(1.5 mg/m2/d, Harding and Miller, 1982; 2.5 Mg/d of HFemitted in the 1956–83 period, Gerlach and Graeber,1985) and Vulcano Island, Italy (0.12 mg/m2/d, Capassoet al., 1993; 0.5 Mg/d of HF emitted, Italiano et al., 1994).The only comparable deposition rates have been mea-sured near (i.e. at a distance of 200 m) the summit cratersof Stromboli (up to 70 mg/m2/d— Bellomo et al., 2003).In comparison, the fluorine gas output at Stromboli Islandwas estimated at about 5 Mg/d in 1998 (Allard et al.,2000).
Due to these high deposition rates and the wide area ofplume dispersion and deposition (1200 km2), the total(wet+dry) fluorine depositional fluxes on Etna's flanksare huge: 0.2–17.1 Mg/d, with an average of 1.6±2.7 Mg/d for the 1998–2003 period (data from Aiuppaet al., 2006; Fig. 8). On average, ∼1% of the fluorine

Fig. 8. Time variations of deposition fluxes at Etna compared with estimated HF fluxes from the summit craters (see text). All data in Mg/day. Themass percentages (%) of plume-derived fluorine deposited on Etna's flanks is also shown.
97S. Bellomo et al. / Journal of Volcanology and Geothermal Research 165 (2007) 87–101
plume emissions have been deposited around the vol-cano (Fig. 8).
Dry-deposited fluorine represents a minor fraction(b20%) of the total fluorine depositions, at least duringquiescent degassing. In fact, 0.1 Mg/d of fluorine weredry deposited around the volcano in May–June 2002(Aiuppa et al., 2004a), when the total deposition was0.6Mg/d. A situation of this kindmay be reversed duringeruptions: in ash-laden plumes, such as those character-ising the recent 2001 and 2002–2003 eruptions (Andro-nico et al., 2005), the heterogeneous reaction of HF(g)with the volcanic ash (Oskarsson, 1980) producessoluble fluorine salts, which can be adsorbed on thesurface of ash particles and later deposited on the ground.Particulate fluorine has, in fact, much shorter residencetime in the atmosphere with respect to gaseous fluorine(WHO, 2002). Based on our ash leachate characterisa-tion (cfr. 3.1), we estimate that about 60 Mg of fluorinewere deposited during the 2001 eruption through vol-canic ash, corresponding to ∼85% of the total fluorinedeposition (71 Mg; see Fig. 8).
Fluorine scavenging by ash deposition, combinedwith larger emissions, may also be the source process ofthe exceptional total deposition fluxes measured duringthe October 2002–January 2003 eruptive phase, whichwas by far the highest ever measured in the area duringsix years of observations (Fig. 8). About 1 Gg ofvolcanogenic fluorine was deposited over the Etneanarea throughout the ∼90-day eruption in 2002–2003 (atan average rate of 11.4 Mg/d), which corresponds toabout the amount of fluorine deposited during four yearsof quiescent degassing from the volcano (at an averagerate of 0.8 Mg/d). This fits earlier findings at othervolcanoes (Durand and Grattan, 1999, Thordarson andSelf, 2003), that is to say that basaltic eruptions may
contribute to augmented depositions of plume-derivedvolatiles. It should further be noted that a larger fraction(3–5% — Fig. 8) of plume-derived volatile emissionswas scavenged during the eruption. Despite the fact thatthe eruption took place during the rainy fall–winterperiod, dry deposition through ashes was neverthelessthe main deposition mechanism. This is confirmed bythe fact that the estimated fluorine deposition withashes, although probably affected by a large uncertainty(cfr. 3.1), is of the same order of magnitude as the mea-sured total deposition.
4.2. Impact on vegetation
HF(g) primarily enters plant tissues by diffusionthrough the stomata on the leaf. Particulate F is also de-posited on the surface of the leaf; its subsequent penetra-tion into the leaf is slow and depends upon the solubilityof the material, particle size, relative humidity, and thepresence of dew or other tree water on the foliar surface.The superficial deposits, which can include gaseous Fsorbed to the waxy cuticle of the leaf or materials residingupon it as well as F from the interior of the leaf, can beeluted from the foliar surface by precipitation (Vike,2005). The amount of F that normally accumulatesthrough the roots from the soil is small, and there is littlerelationship between concentrations in plants and totalcontent in soils (Weinstein, 1977). Biological factors,such as species, cultivar, and stage of development, candetermine the uptake of F and its concentration in thefoliage by affecting stomatal conductance, surface to vo-lume ratios of the leaf, and leaf area index of the plant(Horntvedt, 1997).
Fluorine concentrations in chestnut leaves and pineneedles collected from the flanks of Mt. Etna are

98 S. Bellomo et al. / Journal of Volcanology and Geothermal Research 165 (2007) 87–101
substantially larger than typical background concentra-tions in plants (e.g., plants growing in rural areas havefluorine concentrationsb10 μg/g; WHO, 2002). Al-though this is a clear indication that the volcano iscertainly one of the main sources of the fluorine found inthe biosphere, we do wish to point out that Etna'svegetation dataset falls in the lower range of typicalconcentrations found in plants growing near high fluorineanthropogenic emission sources (where fluorine can be ashigh as 1000μg/g;WHO, 2002). This effect is probably tobe partially explained by the fact that most industrial casestudies have been based on vegetation samples collectedvery close to pollution sources (b2 km). Samplescollected from Mt. Etna were taken from much fartheraway (N4.2 and N6.7 km from summit craters for pinesand chestnuts respectively). In this sense climaticconditions, which limit the growth of vegetation in theregione deserta, are a natural limit for the developmentof more severe impacts.
The different varieties of crops and native species canbe ranked in three classes, on the basis of their relativesensitivity to fluorine: ‘sensitive’, ‘intermediate’, and‘tolerant’. The relative sensitivities of the two species,object of the present study, have not been evaluated pro-perly. However, other varieties of pine species have beeninvestigated in the past, and have been classified assensitive or, in a few cases, intermediate (Weinstein, 1977;Weinstein and Davison, 2003). Fluorine sensitive speciesalso have lower accumulation capacities than tolerantspecies (Horntvedt, 1997). At sites where both the twospecies were collected simultaneously (see Tab. 2), wefound higher F contents in chestnut leaves than in pineneedles, suggesting a possible higher tolerance of theformer. It is thus not surprising that damages suffered byvegetation, potentially related to high fluorine exposure,are limited to the latter species. Indeed, pine needles fromthree sites (PRO, CIT and SAS) display a strong increasein fluorine contents with needle age (Fig. 5), up to valuesusually associated with visible symptoms (N30 μg/g forsensible species). The tips of the needles actually appearto be slightly chlorotic at sites PRO andCIT.More evidentsymptoms (strong chlorotic or even necrotic tips) areobserved at SAS, where third year needles (correspondingto growth year 2001) are nearly totally necrotic whilefourth year needles are totally lacking. The sides of thetrees facing west (pointing toward the direction of the2100 m vent of the 2001 eruption) look burned, while thebranches are totally devoid of needles. The highly fluorineenriched gases (Aiuppa et al., 2002) released by the lowervent during the 2001 eruption (distance about 1.5 kmupwind) were possibly responsible for the damage suf-fered by the vegetation at this site. Sites PRO and CIT are
located in proximity of the 2002–2003 eruptive fissure(about 2 and 4 km downwind, respectively); there, themilder symptoms detectedmay possibly be ascribed to thegreater distance from the emission vent and/or to thedifferent season in which the eruption took place(autumn–winter), this latter influencing both vegetativestatus and fluorine deposition mechanisms (prevailinglywet).
Apart from the above cases, vegetation growing onMtEtna does not display any evident symptom that can berelated to the impact of HF or other phytotoxic volcanicgases. This implies that HF(g) atmospheric concentrationsare systematically below phytotoxic values in areascovered by vegetation (as in June 2002; Aiuppa et al.,2004a), probably because the morphology of the volcano(and its considerable height) limits more extensivefumigation of the low slopes. The neutralising actionplayed by the high Ca depositions in the Etnean area,derived from limestone dust, (Aiuppa et al., 2006) mightalso be invoked; many studies having, in fact, underlinedthe detoxification capacity of Ca with respect to F (Garrecand Chopin, 1982). Furthermore, as hypothesised by LeGuern et al. (1988), long-living Etnean plants could havedeveloped some kind of resistance to volcanic gas ex-posure. The same authors reported an example of theprobable attainment of such a resistance by pines im-ported for reforestation from Austria. Only about 20% ofthese trees, planted at the beginning of the twentiethcentury, reachedmaturity, but since the 1970s the progenyof these plants have shown no symptoms related to vol-canic gas exposure, while there is no evidence of anydiminution in volcanic gas emission.
4.3. Effects on soils
Total fluorine contents in Etnean soils fall within thetypical range of undisturbed soils (i.e. not affected byanomalous fluorine deposition; WHO, 2002). However,total fluorine in the soils is a poor indicator of pollutionstatus, due to the great natural variation in content, ad-sorption strength and adsorption capacity of different soils(Brewer, 1966; Arnesen et al., 1995): soluble F (FH2O) isprobably a more reliable indicator of the pollution situa-tion and the availability of F for plants (Arnesen, 1997).As far as the FH2O values are concerned, the anomalousnature of Etnean soils emerges. The volcanic plumederivation of this anomalous FH2O content is supportedby: (i) the inverse relation in respect of the distance fromthe summit craters for the topsoil samples (Fig. 4e,f,g); (ii)the inverse dependence on depth in the soil profiles(Fig. 7). FOX and FTOT display less clear relations,probably because they are much more influenced by

99S. Bellomo et al. / Journal of Volcanology and Geothermal Research 165 (2007) 87–101
fluorine inherited from rock weathering (Etnean volca-nites have F contents in the 240–985 μg/g range, average550 μg/g; Métrich, 1990); (iii) the increase in FH2O withdecreasing grain-size in samples collected downwindfrom the summit craters (Fig. 6). This is consistent with Fderived from atmospheric deposition, which has a greataffinity for clay minerals and amorphous phases (allo-phane, imogolite, etc), which are enriched in finerportions of the soils.
4.4. Role of Etnean soils in groundwater protection
The fluorine content in groundwaters inmany volcanicareas is often higher than the safe drinking water limit(1.5 mg/l — WHO, 2002). Given the huge fluorine de-positions in the areas surrounding the volcano, highfluorine concentrations in Etnean groundwaters can wellbe expected. Despite the fact that the volume weightedaverage fluorine concentration in atmospheric precipita-tions is about 2 mg/l, the concentration of fluorine ingroundwaters is lower, ranging from 0.02 to 1.0 mg/l,with an average value of 0.43 mg/l (Aiuppa et al., 2003).The estimated fluorine groundwater discharge in thevolcanic aquifer is 0.82 Mg/d (Aiuppa et al., 2004c).Considering that rock weathering contributes 0.36 Mg/d(Aiuppa et al., 2000), while ignoring any anthropogeniccontribution, this leaves 0.46 Mg/d, at most, for theatmospheric contribution, which is much lower than ourestimated average deposition flux (1.6 Mg/d). Clearly, animportant fluorine sink must be invoked, and the soils arethe most obvious candidates. Recent studies have demon-strated the significant fluorine adsorbing capacity ofandosoils, typical of active volcanic areas (Zevenbergenet al., 1996; Delmelle et al., 2003), and have related this tochemisorption on “active” Al-bearing phases, mainly in
Fig. 9. F adsorption efficiency of two soil profiles as a function oftime. The starting solution is a natural rainwater sample with initialfluorine content of 3.8 mg/l.
the formof allophane. Experiments performed on samplesof the soil profiles Etna3 and Etna5 also highlighted highfluorine adsorption capacities of the Etnean soils. After192 hours, the adsorbed F fractions ranged from 0.44 to0.91, and some samples also showed very high adsorbedfractions (up to 0.54) after only 2 hours (Fig. 9). In thelight of these experiments, we propose a natural defluo-ridation action of Etnaen soils, which retain about1.1 Mg of fluorine every day and protect the very im-portant water resources of the area from excessivefluorine contents.
5. Summary
Quiescent passive degassing at Mt. Etna daily releases∼200 Mg of hydrogen fluoride, of which only ∼1%reaches the ground in the areas surrounding the volcano,and most of that by wet deposition. Larger depositionsmay occur during Etna's basaltic eruptions, due to higheremissions from the volcano and fluorine scavenging byash. The data presented here demonstrate that∼71Mg offluorine were deposited in two weeks during the 2001eruption, of which ∼85% occurred through volcanic ashdeposition. Similarly ∼11 Mg of fluorine were depositeddaily around the volcano during the 2002–2003 eruption,corresponding to 3–5% of the emissions. Condensationand reaction of HF on the surface of ash particles confirmsthis as being a very effective scavenging mechanism forfluorine during basaltic eruptions (Oskarsson, 1980).
The samples of vegetation growing on Mt Etna, al-though they do suggest that the volcano is an importantsource of the fluorine found in the biosphere, do notgenerally manifest anomalous fluorine accumulations(e.g., fluorine is generally below 10 μg/g). The extremeenvironmental conditions of Etna's regione deserta, whichare unfavourable to the growth of vegetation, probably actas a natural barrier to the development of more severeimpacts, even in those areas where plume fumigation ismore frequent. A few sampling sites, located near activedegassing eruptive fractures of the most recent eruptions(July–August 2001 and October 2002 – January 2003),make exceptions, as the vegetation shows fluorineconcentrations of N10 μg/g. This is associated with visiblesymptoms such as chlorotic or necrotic tips.
Soils on Mt. Etna have total fluorine contents withinthe range typical of undisturbed soils. Furthermore, thepresence of a “volcanic degassing effect” in soils isprobably supported by high, water-soluble (FH2O), fluo-rine contents, which are at the highest in the finest grain-sizes of topsoils from Etna's upper, downwind flank. AtEtna, soils absorb ∼60% of the atmospheric fluorine de-positions, thereby exerting a significant protective action

100 S. Bellomo et al. / Journal of Volcanology and Geothermal Research 165 (2007) 87–101
on the volcanic aquifers while maintaining fluorine con-centrations in the groundwaters below the safe drinkingwater limit.
Acknowledgments
This work is part of the PhD thesis research of the firstauthor (PhD in Geochemistry — University of Palermo16th cycle) that was funded by the University of Palermoand by the European Social Fund. Soil profile sampleswere kindly supplied by Barbara Palumbo (Etna3 andEtna5), Prof. Salvatore Dazi and Armando Laudicina(Leccio, Roverella and Faggio). Daniele Andronico,Emanuela Bagnato, Cinzia Berrittella, Claudia Bitetto,PieroBonfanti, LorenzoBrusca, PaolaDel Carlo, RobertoDi Paola, Manfredi Longo are acknowledged for theirsupport either in the field or in the laboratory. Commentsby and discussions with A. Allen, T. Mather, G. Notcutt,R. Pyle, who consistently improved an earlier version ofthe paper are also kindly acknowledged. Referees' (S.Cronin and J.P. Garrec) comments improved the finalversion of the paper.
References
Aiuppa, A., Allard, P., D'Alessandro, W., Michel, A., Parello, F., Treuil,M., Valenza, M., 2000.Mobility and fluxes of major, minor and tracemetals during basalt weathering and groundwater transport at Mt.Etna volcano (Sicily). Geochim. Cosmochim. Acta 64 (11),1827–1841.
Aiuppa, A., Bonfanti, P., Brusca, L., D'Alessandro, W., Federico, C.,Parello, F., 2001. Evaluation of the environmental impact of volcanicemissions from the chemistry of rainwater: Mount Etna area (Sicily).Appl. Geochem. 16, 985–1000.
Aiuppa, A., Federico, C., Paonita, A., Pecoraino, G., Valenza, M., 2002.S, Cl and F degassing as an indicator of volcanic dynamics: the 2001eruption of Mount Etna. Geophys. Res. Lett. 29 (11). doi:10.1029/2002GL015032.
Aiuppa, A., Bellomo, S., Brusca, L., D'Alessandro, W., Federico, C.,2003. Natural and anthropogenic factors affecting groundwaterquality of an active volcano (Mt. Etna, Italy). Appl. Geochem. 18,863–882.
Aiuppa, A., Bellomo, S., D'Alessandro, W., Federico, C., Ferm, M.,Valenza, M., 2004a. Volcanic plume monitoring at Mount Etna bydiffusive (passive) sampling. J. Geophys. Res. 109 (D21), D21308.doi:10.1029/2003JD004481.
Aiuppa, A., Federico, C., Giudice, G., Gurrieri, S., Paonita, A., Valenza,M., 2004b. Plume chemistry provides insights into the mechanismsof sulfur and halogen degassing at basaltic volcanoes. Earth. Planet.Sci. Lett. 222, 469–483.
Aiuppa, A., Allard, P., D'Alessandro, W., Giammanco, G., Parello, F.,Valenza, M., 2004c. Magmatic gas leakage at Mount Etna (Sicily,Italy): Relationships with the volcano-tectonic structures, thehydrological pattern and the eruptive activity. In: Bonaccorso, A.,Calvari, S., Coltelli, M., Del Negro, C., Falsaperla, S. (Eds.), EtnaVolcano Laboratory. AGU Geophysical Monography Series, vol.143, pp. 129–145.
Aiuppa, A., Bellomo, S., Brusca, L., D'Alessandro, W., Di Paola, R.,Longo, M., 2006. Major ion bulk deposition around an activevolcano (Mt. Etna, Italy). Bull. Volcanol. 68, 255–265.
Allard, P., Aiuppa, A., Loyer, H., Carrot, F., Gaudry, A., Pinte, G.,Michel, A., Dongarrà, G., 2000. Acid gas and metal emission ratesduring long-lived basalt degassing at Stromboli volcano. Geophys.Res. Lett. 27 (8), 1207–1210.
Andronico,D., Branca, S., Calvari, S., Burton,M.,Caltabiano, T., Corsaro,R.A., Del Carlo, P., Garfì, G., Lodato, L., Miraglia, L., Murè, F., Neri,M., Pecora, E., Pompilio, M., Salerno, G., Spampinato, L., 2005. Amulti-disciplinary study of the 2002–03 Etna eruption: insights intoa complex plumbing system. Bull. Volcanol. 67 (4), 314–330.
Araya, O., Wittwer, F., Villa, A., Ducom, C., 1990. Bovine fluorosisfollowing volcanic activity in the southern Andes. Vet. Rec. 126,641–642.
Arnesen, A.K.M., 1997. Availability of fluoride to plants grown incontaminated soils. Plant Soil 191, 13–25.
Arnesen, A.K.M., Abrahamsen, G., Sandvik, G., Krogstad, T., 1995.Aluminium smelters and fluoride pollution of soil and soil solutionin Norway. Sci. Total Environ. 163, 39–53.
Behncke, B., Neri, M., 2003. The July–August 2001 eruption of Mt.Etna (Sicily). Bull. Volcanol. 65 (7), 461–476.
Bellanca, A., Hauser, S., Neri, R., Palumbo, B., 1996. Mineralogy andgeochemistry of soils related to Etna volcano: heavy metal distri-bution as a result of soil-forming processes and inherited features.Miner. Petrogr. Acta 39, 95–107.
Bellomo, S., D'Alessandro, W., Longo, M., 2003. Volcanogenicfluorine in rainwater around active degassing volcanoes: Mt. Etnaand Stromboli island, Italy. Sci. Total Environ. 301, 175–185.
Blakemore, L.C., Searle, P.L., Daly, B.K., 1987. Methods for chemicalAnalysis of Soils. Scientific report No. 80 New Zealand SoilBureau, Lower Hutt, New Zealand.
Bonaccorso, A., Calvari, S., Coltelli, M., Del Negro, C., Falsaperla, S.(Eds.), 2004. Etna Volcano Laboratory. AGUGeophysical Monog-raphy Series, vol. 143.
Branca, S., Del Carlo, P., 2005. Types of eruptions of Etna volcano AD1670-2003: implications for short-term eruptive behaviour. Bull.Volcanol. 67 (8), 732–742.
Brewer, R.F., 1966. Fluorine. In: Chapman, H.D. (Ed.), DiagnosticCriteria for Plants and Soils. Univ. California Press, California,pp. 80–196.
Burton, M., Allard, P., Murè, F., Oppenheimer, C., 2003. FTIR remotesensing of fractional magma degassing at Mt. Etna, Sicily. In:Oppenheimer, C., Pyle, D., Barclay, J. (Eds.), Volcanic Degassing.Geol Soc London Spec. Publ., vol. 213, pp. 281–293.
Cadle, R.D., 1980. A comparison of volcanic with other fluxes ofatmospheric trace gas constituents. Rev. Geophys. 18, 746–752.
Caltabiano, T., Romano, R., Budetta, G., 1994. SO2 flux measurementsat Mount Etna, Sicily. J. Geophys. Res. 99 (D6), 12,809–12,819.
Caltabiano, T., Burton, M., Giammanco, S., Allard, P., Bruno, N., Murè,F., Romano, R., 2004. Volcanic Gas Emissions From the SummitCraters and Flanks of Mt. Etna, 1987–2000. In: Bonaccorso, A.,Calvari, S., Coltelli,M.,DelNegro, C., Falsaperla, S. (Eds.),Mt. Etna:Volcano Laboratory AGU Geophysical Monograph Series, vol. 143,pp. 111–128.
Capasso, G., Dongarrà, G., Favara, R., Francofonte, S., Hauser, S.,1993. Composition of bulk precipitation on Island of Vulcano(Aeolian I., Italy). Nat. Sicil. Serie IV 17 (1–2), 33–43.
Chandrawanshi, C.K., Patel, K.S., 1999. Fluoride deposition in centralIndia. Environ. Monit. Assess. 55, 251–265.
Chester, D.K., Duncan, A.M., Guest, J.E., Kilburn, C.R.J., 1985. MountEtna: The anatomyof a volcano. Chapman andHall, London. 404 pp.

101S. Bellomo et al. / Journal of Volcanology and Geothermal Research 165 (2007) 87–101
Cronin, S.J., Neall, V.E., Lecointre, J.A., Hedley, M.J., Loganathan, P.,2003. Environmental hazards of fluoride in volcanic ash: a casefrom Ruapehu volcano, New Zealand. J. Volcanol. Geotherm. Res.121, 271–291.
De Angelis, M., Legrand, M., 1994. Origins and variations of fluoridein Greenland precipitation. J. Geophys. Res. 99, 1157–1172.
Delmelle, P., 2003. Environmental impacts of tropospheric volcanicgas plumes. In: Oppenheimer, C., Pyle, D.M., Barclay, J. (Eds.),Volcanic degassing. Geological Society, London, Special Publica-tion, vol. 213, pp. 381–399.
Delmelle, P., Stix, J., Baxter, P., Garcia-Alvarez, J., Barquero, J., 2002.Atmospheric dispersion, environmental effect and potential healthhazard associated with the low-altitude gas plume of Masayavolcano Nicaragua. Bull. Volcanol. 64, 423–434.
Delmelle, P., Delfosse, T., Delvaux, B., 2003. Sulfate, chloride andfluoride retention in Andosols exposed to volcanic acid emissions.Environ. Pollut. 126, 445–457.
Durand, M., Grattan, J., 1999. Extensive respiratory health effects ofvolcanogenic dry fog in 1783 inferred from European documentarysources. Environ. Geochem. Health 21, 371–376.
Eichler, A., Schwikowski, M., Gaggeler, H.W., 2000. An Alpine ice-core record of anthropogenic HF and HCl emissions. Geophys.Res. Lett. 27, 3225–3228.
Elias, V., Tesar, M., Buchtele, J., 1995. Occult precipitation: sampling,chemical analysis and processmodeling in the SumavaMts. (CzechRepublic) and in theTaunusMts. (Germany). J.Hydrol. 166, 409–420.
Francis, P., Burton, M.R., Oppenheimer, C., 1998. Remote measure-ments of volcanic gas compositions by solar occultation spectros-copy. Nature 396, 567–570.
Fridriksson, S., 1983. Fluoride problems following volcanic eruption. In:Shupe, J.L., Peterson, H.B., Leone, N.C. (Eds.), Fluorides,- Effect onvegetation, animals and humans. Pearagon Press, UT, pp. 339–344.
Garrec, J.P., Chopin, S., 1982. Calcium accumulation in relation tofluoride pollution in plants. Fluoride 15 (3), 144–149.
Garrec, J.P, Lounowski, A., Plebin, R., 1977. Impact of volcanicfluoride and SO2 emissions from moderate activity volcanoes onsurrounding vegetation. Bull. Volcanol. 47 (3), 491–496.
Garrec, J.P., Plebin, R., Faivre-Pierret, R.X., 1984. The Influence ofvolcanic fluoride emissions on surrounding vegetation. Fluoride 10(4), 152–156.
Gauthier, P.J., Le Cloarec, M.F., 1998. Variability of alkali and heavymetal fluxes released by Mt. Etna volcano, Sicily, between 1991and 1995. J. Volcanol. Geotherm. Res. 81, 311–326.
Georgsson, G., Petursson, G., 1972. Fluorosis of sheep caused by theHekla eruption in 1970. Fluoride 5 (2), 58–66.
Gerlach, T.M., Graeber, E.J., 1985. Volatile budget of KilaueaVolcano. Nature 313, 273–277.
Halmer, M.M., Schmincke, H.U., Graf, H.F., 2002. The annual volcanicgas input into the atmosphere, in particular into the stratosphere: aglobal data set for the past 100 years. J. Volcanol. Geotherm. Res.115, 511–528.
Harding, D., Miller, J.M., 1982. The influence on rain chemistry of theHawaiian volcano Kilauea. J. Geophys. Res. 87 (C2), 1225–1230.
Horntvedt, R., 1997. Accumulation of airborne fluorides in forest treesand vegetation. Eur. J. For. Pathol. 27, 73–82.
Italiano, F., Nuccio, P.M., Pecoraino, G., 1994. Fumarolic gas output atthe La Fossa di Vulcano crater. Acta Vulcanol. 6, 39–40.
Kauranen, P., 1978. Fluoride deposition in snow in the surroundings ofa mixed fertilizer factory. Chemosphere 6, 537–547.
Le Guern, F., Faivre-Pierret, R.X., Garrec, J.P., 1988. Atmosphericcontribution of volcanic sulfur vapor and its influence on thesurrounding vegetation. J. Volcanol. Geotherm. Res. 35, 173–178.
Matschullat, J., Maenhaut, W., Zimmermann, F., Fiebig, J., 2000.Aerosol and bulk deposition trends in the 1990's, EasternErzgebirge, Central Europe. Atmos. Environ. 34 (19), 3213–3221.
Mayer, R., Liess, S., Lopes, M.I.M.S., Kreutzer, K., 2000. Atmo-spheric pollution in a tropical rain forest: effects of deposition uponbiosphere and hydrosphere II. Fluxes of chemicals and elementbudgets. Water Air Soil Pollut. 121, 79–92.
McQuaker, N.R., Gurney, M., 1977. Determination of total fluoride insoil and vegetation using an alkali fusion-selective ion electrodetechnique. Anal. Chem. 49, 53–56.
Métrich, N., 1990. Chlorine and fluorine in tholeiitic and alkaline lavasof Etna (Sicily). J. Volcanol. Geotherm. Res. 40, 133–148.
Notcutt, G., Davies, F., 1989. Accumulation of volcanogenic fluorideby vegetation: Mt. Etna, Sicily. J. Volcanol. Geotherm. Res. 39,329–333.
Notcutt, G., Davies, F., 1993. Dispersion of gaseous fluoride, island ofHawaii. J. Volcanol. Geotherm. Res. 56, 125–131.
Notcutt, G., Davies, F., 1999. Biomonitoring of vulcanogenic fluoride,Furnas Caldera, Sao Miguel, Azores. J. Volcanol. Geotherm. Res.92, 209–214.
Oskarsson, N., 1980. The interaction between volcanic gases andtephra: fluorine adhering to tephra of the 1970 Hekla eruption.J. Volcanol. Geotherm. Res. 8, 251–266.
Pennisi, M., Le-Cloarec, M.F., 1998. Variations of Cl, F, and S inMount Etna's plume, Italy, between 1992 and 1995. Geophys. Res.Lett. 103, 5061–5066.
Perrott, K.W., Smith, L., Inkson, R.H.E., 1976. The reaction of fluoridewith soils and soil minerals. J. Soil Sci. 1976 (27), 58–67.
Preunkert, S., Legrand, M., Wagenbach, D., 2001. Causes of enhancedfluoride levels in Alpine ice cores over the last 75 years: Implicationsfor the atmospheric fluoride budget. J. Geophys. Res. 106 (D12),12,619–12,632.
Saether, O.M., Andreassen, B.T., Semb, A., 1995. Amounts andsources of fluoride in precipitation over southern Norway. Atmos.Environ. 29 (15), 1785–1793.
Symonds, R.B., Rose,W.I., Reed,M.H., 1988. Contribution of Cl- and F-bearing gases to the atmosphere by volcanoes. Nature 334, 415–418.
Thorarinsson, S., 1979.On the damage caused by volcanic eruptionswithspecial reference to tephra and gases. In: Sheets, P.D., Grayson, D.K.(Eds.), Volcanic Activity andHumanEcology. Academic Press, NewYork, pp. 125–159.
Thordarson, T.H., Self, S., 2003. Atmospheric and environmentaleffects of the 1783–1784 Laki eruption: a review and reassess-ment. J. Geophys. Res. 108 (D1), 4011.
Vike, E., 2005. Uptake, deposition and wash off of fluorine andalluminium in plant foliage in the vicinity of an aluminium smelterin Norway. Water Air Soil Pollut. 160, 145–159.
Weinstein, L.H., 1977. Fluoride and plant life. J. Occup. Med. 19,49–78.
Weinstein, L.H., Davison, A., 2003. Fluoride in the Environment.CABI Publishing.
Witham, C.S., Oppenheimer, C., Horwell, C.J., 2005. Volcanic ashleachates: a review and recommendations for analysis methods.J. Volcanol. Geotherm. Res. 141, 299–326.
WHO, 2002. Fluorides. Environmental Health Criteria, vol. 227.World Health Organization, Geneva, p. 268.
Zevenbergen, C., Van Reeuwijk, L.P., Frapporti, G., Louws, R.J.,Schuiling, R.D., 1996. A simple method for defluoridation ofdrinking water at village level by adsorption on Ando soil inKenya. Sci. Total Environ. 188, 225–232.
Copyright © 2022 FDOKUMEN